
Abstract
Many Chinese aluminum enterprises now choose to mix sintering process red mud and Bayer process red mud in the proportion of 1:1 to form mixed red mud and then stockpile the mixed red mud in the open air. In this study, the strength characteristics and the mechanism behind cementation hardening of the mixed red mud were investigated from the aspects of microstructure and macromechanical properties under different dewatering times. It was found that many hydraulic cement minerals and active ingredients in the red mud undergo a series of hydration reactions and carbonization reactions during dewatering, forming cementing minerals, which finally results in a large increase in the cohesion. These reactions mainly complete in the first 70 days of dewatering. In addition, the influence of acid on the strength characteristics of mixed red mud was also studied. It was found that even though the mixed red mud is soaked in a high-concentration acid solution (2 mol/L) for a long period (60 day), its strength only decreases slightly. These findings can provide important references for the open-air storage of red mud and the analysis of stability of the stockpile.
Introduction
Red mud is a reddish brown-colored solid waste produced during the physical and chemical processing of bauxite. It is mainly divided into two types of red mud, sintering process red mud and Bayer process red mud, based on different production processes (Kumar et al., 1989; Liu et al., 2007; Wang et al., 2008; Feng et al., 2017). The two types of red mud vary greatly in microstructure, appearance, physical characteristics, and mechanical characteristics (Wang and Liu, 2012). Red mud from the sintering process has a large particle size, high sand content, good permeability and high strength (Wang et al., 2012). Moreover, it is also somewhat hydraulic. Unlike the sintering process red mud, Bayer process red mud has small particle size, high clay mineral content, poor permeability, and low strength (Nie et al., 2016; Hu et al., 2018).
Stockpiling of red mud in an open yard is the main treatment process for red mud because of the small amount of actual consumption but very high disposal cost (accounting for about 5% of alumina production cost) (Feng and Yang, 2018). In China, major alumina plants stock the two kinds of red mud separately in the early stage. Because of its low strength and poor permeability, the Bayer red mud stockpile is prone to dam breakage and is profoundly affected by rainfall, so the height of the pile is small. Consequently, it occupies a large horizontal area. In recent years, as a result of land restriction policies and a dramatic rise in the land price, it has become more difficult to build new stockpiles (Xiu et al., 2019a, 2019b). Therefore, it is extremely urgent to find ways to stockpile new red mud (Kumar et al., 2006; Orescanin et al., 2006; Nan et al., 2009; Power et al., 2011).
Studies show that the sintering process red mud contains a large number of cementing minerals such as carbonates and silicates (Liu et al., 2009, 2014; Wang et al., 2012). Its particles form a porous structure dominated by cementation bond under the action of cementation. The structure has a high strength, which increases irreversibly.
Considering this cementation hardening characteristic of the sintering process red mud, Chalco Shandong Branch and Chalco Guizhou Branch proposed to mix the red mud from the sintering process with that from the Bayer process in a certain proportion before stocking. Laboratory experiments have revealed that the mixed red mud with a mixing proportion of 1:1 possesses the highest strength (Sun, 2009). This method can not only solve the difficulties in stocking the Bayer process red mud and reduce the likelihood of dam break but also make the most of the existing stockpiles to save investment (Turkmen et al., 2002; Turkmen, 2003).
To date, the existing literature on the strength of red mud has mainly focused on specimens made of either Bayer red mud or sintering process red mud (Nie et al., 2016; Hu et al., 2018). For mixed red mud, some research has been carried out on its shear strength parameters (Sun, 2009). To our knowledge, no studies have been performed on the mechanism underlying its cementation, hardening, or strength formation, which is very important for analysis of the stability of mixed red mud stockpiles.
In this study, a series of laboratory experiments were carried out to investigate the strength formation characteristics of the mixed red mud. Consolidated drained (CD) triaxial compression tests were performed to explore the macromechanical properties, and X-ray diffraction (XRD), electron microprobe, and scanning electron microscopy (SEM) were used to characterize the chemical and mineral compositions, particle morphology, and particle aggregation morphology of the mixed red mud at different dewatering times.
Considering that the red mud material is alkaline and its stockpiling is susceptible to rainfall, the influences of water and acid on mechanical characteristics and microstructures of the cemented and hardened mixed red mud were also studied. The conclusions can provide a theoretical reference for designing open-air stocking of mixed red mud and for use in studying the stability of stockpiles during rain.
Materials and Methods
Materials
This study utilized mixed red mud from the Zatang red mud disposal site of Chalco Guizhou Branch, which was taken immediately upon discharge. The sizes of the cylindrical specimens were 39.1 × 80 mm and 61.8 × 20 mm (diameter × height) for the triaxial shear test and unconfined compression test, respectively, which is in accordance with relevant provisions of the Standard for Soil Test Method (GB/T 50123-1999, 1999).
All the specimens were naturally dewatered first. A total of 150 specimens were prepared and divided into six types (Types A–F). Types A–E represent the specimens that were naturally dewatered for 1, 7, 28, 70, and 120 days, respectively. Type F represents the specimens that were naturally dewatered for 120 days and then soaked in acid solution. Henceforth, the subscript a of Type Fab represents the concentration of the acid solution (there were four different concentrations: 0, 0.1, 1.0, and 2.0 mol/L), and the superscript b represents the soaking time (there were four different soaking times: 10, 20, 40, and 60 days).
Methods
A series of experiments were carried out to examine the physical characteristics, strength characteristics, and microscopic composition of the specimens. Specific experimental equipment and procedures were as follows.
Physical characteristics were determined by first drying the specimens at 105°C and sifting with a sieve with a mesh size of 0.5 mm as specified in the Chinese code (GB/T 50123-1999, Standard for Soil Test Method, 1999). The specific gravity of the red mud was determined by the pycnometer method, and its liquid limit and plastic limit were measured by the photoelectric liquid/plastic limit combined device. Two specimens were measured under the same conditions and we took the average.
To estimate the strength characteristics, we first considered that the actual stockpile is arranged with drainage layers, and thus CD triaxial compression tests under different confining pressures were performed on Type A–E specimens in a strain-controlled triaxial apparatus produced by Guodian Nanjing Automation Co., Ltd. According to the requirements of relevant code for soil test methods (GB/T 50123-1999, Standard for Soil Test Method, 1999), the three different confining pressures were 100, 200, and 400 kPa, and the deviatoric strain was applied at a rate of 0.015 mm/min.
Second, unconfined compression tests and direct shear tests were performed on Fab specimens using a strain-controlled unconfined compression apparatus (YYW-2) and a strain-controlled direct shear apparatus produced by Nanjing Soil Instrument Factory Co., Ltd., respectively. For unconfined compression tests, the axial stress was applied to the specimen at a constant displacement rate of 2.4 mm/min. For direct shear tests, all types of specimens were tested under five vertical pressures (σv; 50, 100, 200, 300, and 400 kPa). The shear stress was applied at a rate of 0.015 mm/min.
Microscopic composition. The chemical composition, mineral composition, particle morphology, and particle aggregation morphology of the specimens were analyzed. The chemical composition and mineral composition of the specimens were determined in the following steps as specified in the Chinese Code Method for Chemical Analysis of Clay (GB/T 16399-1996, 1996). First, the specimens were dried at 105°C to constant weight, and the specimens sifted with a sieve with a mesh size of 200 after grinding.
Then, the X-ray fluorescence spectrometry and XRD were applied to analyze and measure the microcomposition of the materials. Two specimens were measured under the same conditions, and the average was taken. Particle morphology and particle aggregation morphology of the specimens were determined in the following steps: (1) drying the specimens at 105°C to constant weight and crushing the specimens into 1 cm3 regular blocks; (2) treating the surfaces of the specimens using vacuum ion beam sputtering and coating equipment; and (3) observing the particle morphology and particle aggregation morphology of the red mud by SEM with a magnification of 2,000 times.
Mechanical Characteristic and Microscopic Composition Features
The influence of dewatering time
Physical and deformation characteristics
The main physical and deformation parameters of the specimens are shown in Table 1. Table 1 shows that the liquid limit decreases to some extent, whereas the plastic limit changes little along with the prolonged dewatering time. The plasticity index shows a significant decrease, indicating that the red mud gradually becomes less sticky during dewatering and becomes sandy soil.
Main Physical and Deformation Parameters of the Mixed Red Mud
The compression coefficient of the specimens decreases with the increasing dewatering time, indicating that the specimens become more resistant to deformation over time. In addition, the compression coefficient changes drastically over time in the first 70 days and changes slightly at 70 and 120 days. According to the classification of compressible soil (moderately compressive in the case of 0.1 MPa−1 < a1–2 < 0.5 MPa−1, and highly compressive in the case of a1–2 > 0.5 MPa−1) in the Standard for Soil Test Method (GB/T 50123-1999, 1999), Type A, Type B, and Type C specimens are highly compressive soil, whereas Type D and Type E specimens are moderately compressive soil.
Strength and failure mode
Typical triaxial stress–strain curves of the specimens are shown in Fig. 1. The curves of the specimens gradually change from the strain hardening type to the softening type as the dewatering time increases (Fig. 1). In the case of confining pressure σ3 = 100 and 200 kPa, the curves of Type A specimens are the weak hardening type, the curves of Type B and Type C specimens are the weak softening type, and those of Type D and Type E specimens are the strong softening type. In the case of σ3 = 400 kPa, the curves of Type A, Type B, and Type C specimens are the weak hardening type, whereas those of Type D and Type E specimens are the weak softening type.
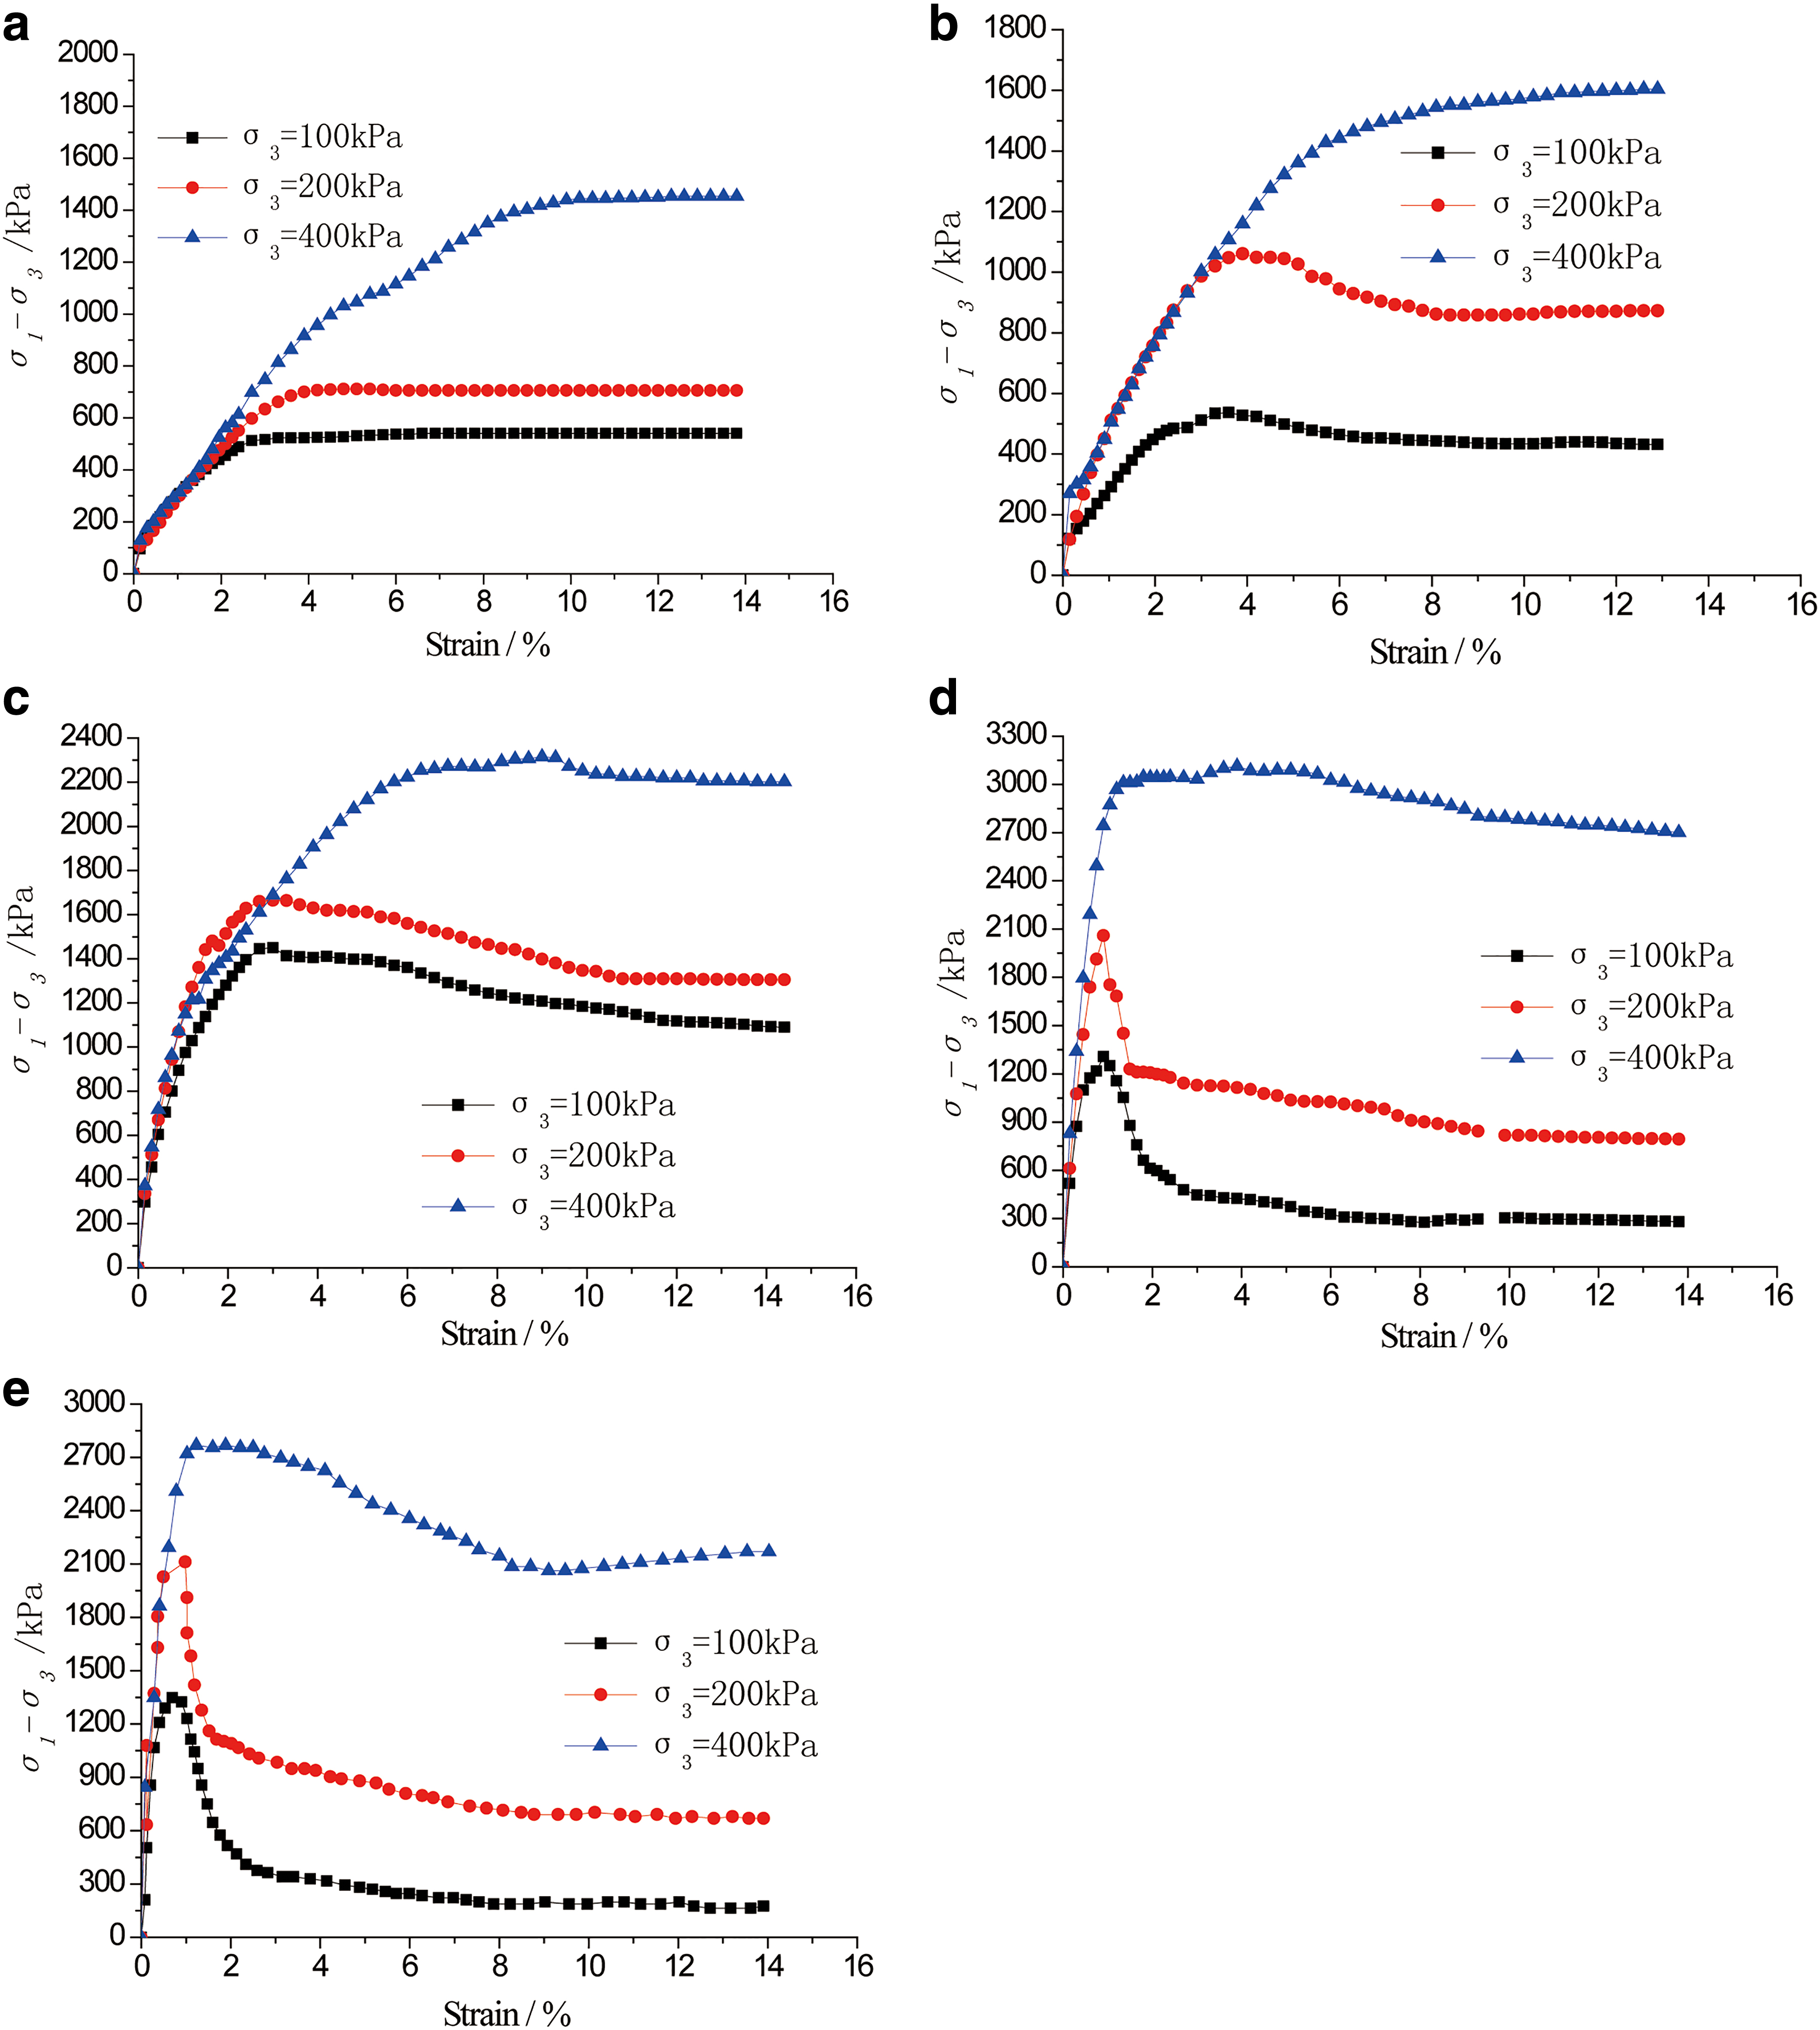
Typical triaxial stress–strain curves of the specimens:
Moreover, the axial strain gradually decreases as the specimens reach peak strength with increasing dewatering time. These results together indicate that the brittleness of the mixed red mud gradually increases as dewatering continues. For the same type of specimen, the slope of the curves of peak deviatoric stress (σ1–σ3) versus axial strain (σ1), the peak deviatoric stress and axial strain (σ1) at peak strength all increase with the confining pressure (σ3). In addition, as the confining pressure increases, the curves of the specimens gradually change from the strain softening type to the hardening type, which indicates that the plasticity of the specimens gradually increases with the increasing confining pressure. The curve shapes of Type D and Type E specimens are similar at the same confining pressure.
Figure 2 shows the failure pattern of different types of mixed red mud with σ3 = 200 kPa. Type A and Type B specimens have no obvious fracture surface and show a plastic failure mode. Type C specimens have an obvious shear fracture face, but the specimens are not completely separated. Like Type C specimens, failure of the Type D and Type E specimens also have an obvious shear fracture face, but the difference is that Type D and Type E specimens are completely separated by the shear surface and show a brittle failure mode. This also shows that the brittleness of the mixed red mud gradually increases as dewatering goes on.

Failure of the tested mixed red mud:
For triaxial tests, the linear Mohr–Coulomb criterion, which can be expressed simply as a linear relationship of both the peak axial stress (σ1) and the confining pressure (σ3), that is, σ1 = {(1 + sinφ)/(1 − sinφ)}σ3 + 2ccosφ /(1 − sinφ), was selected to determine the shear strength parameters, including the cohesion (c) and internal friction angle (φ) (Huang et al., 2015). The cohesion (c) and internal friction angle (φ) are obtained (Table 2) through the linear regression of the results of the triaxial tests.
Shear Strength Parameters (Internal Friction Angle φ and Cohesion c) of the Mixed Red Mud
Table 2 shows that cohesion (c) of the mixed red mud increases significantly in the first 70 days of dewatering (increasing from 61.67 kPa on the first day to 322.76 kPa on day 70), but the increase is less clear after that. Moreover, the internal friction angle (φ) changes slightly with the increasing dewatering time.
Microscopic composition
The chemical composition and mineral composition of the specimens are shown in Table 3 and Fig. 3, respectively. The SEM results are shown in Fig. 4. Table 3 shows that the mixed red mud contains considerable calcium oxide (CaO), silica (SiO2), and alumina oxide (Al2O3), which account for more than 70% of all the minerals. Comparison of the chemical compositions of the five types of specimen reveals that the mass percentage of CaO and SiO2 increases, and loss also increases with the prolonged dewatering time.

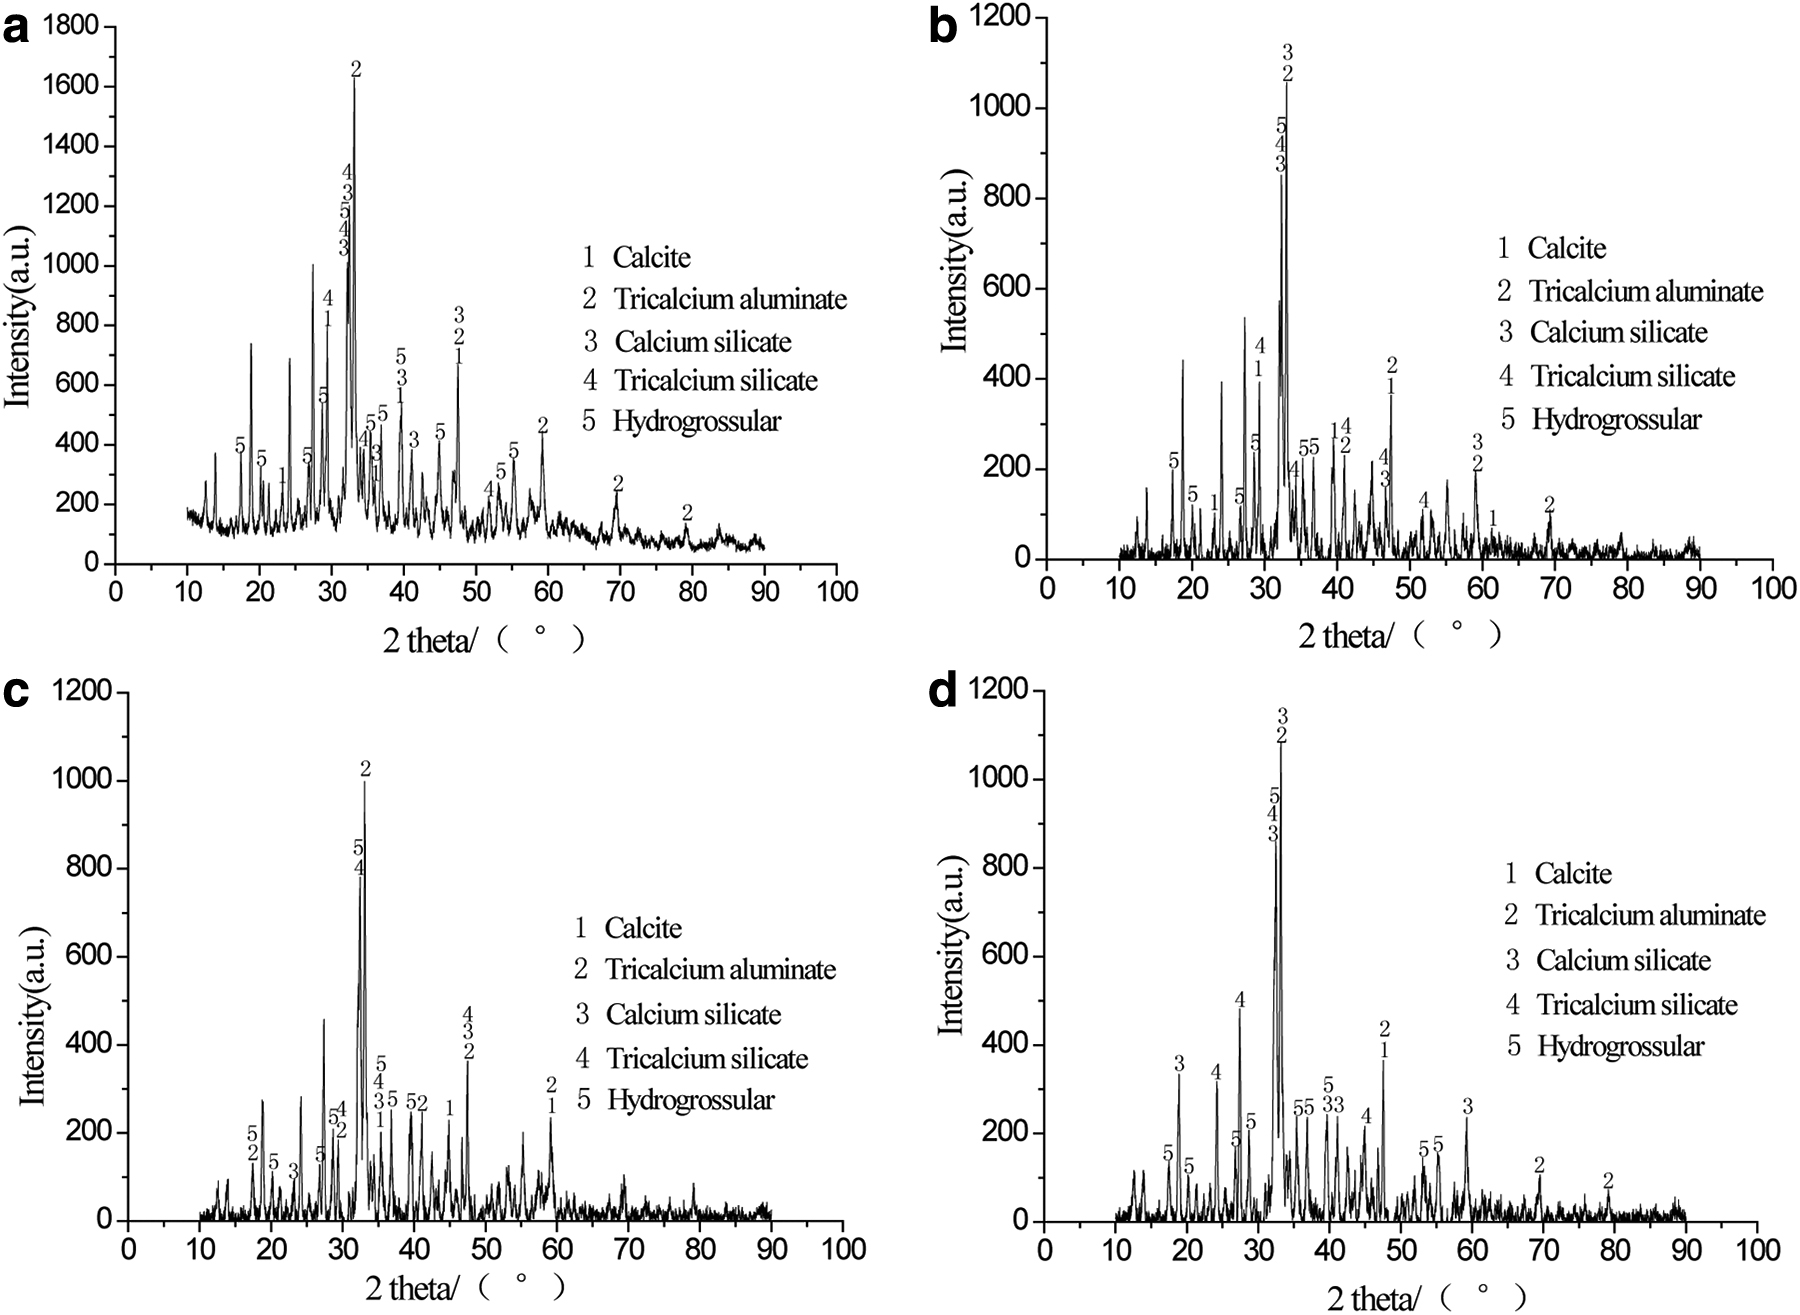
XRD curves of the tested mixed red mud. XRD, X-ray diffraction.
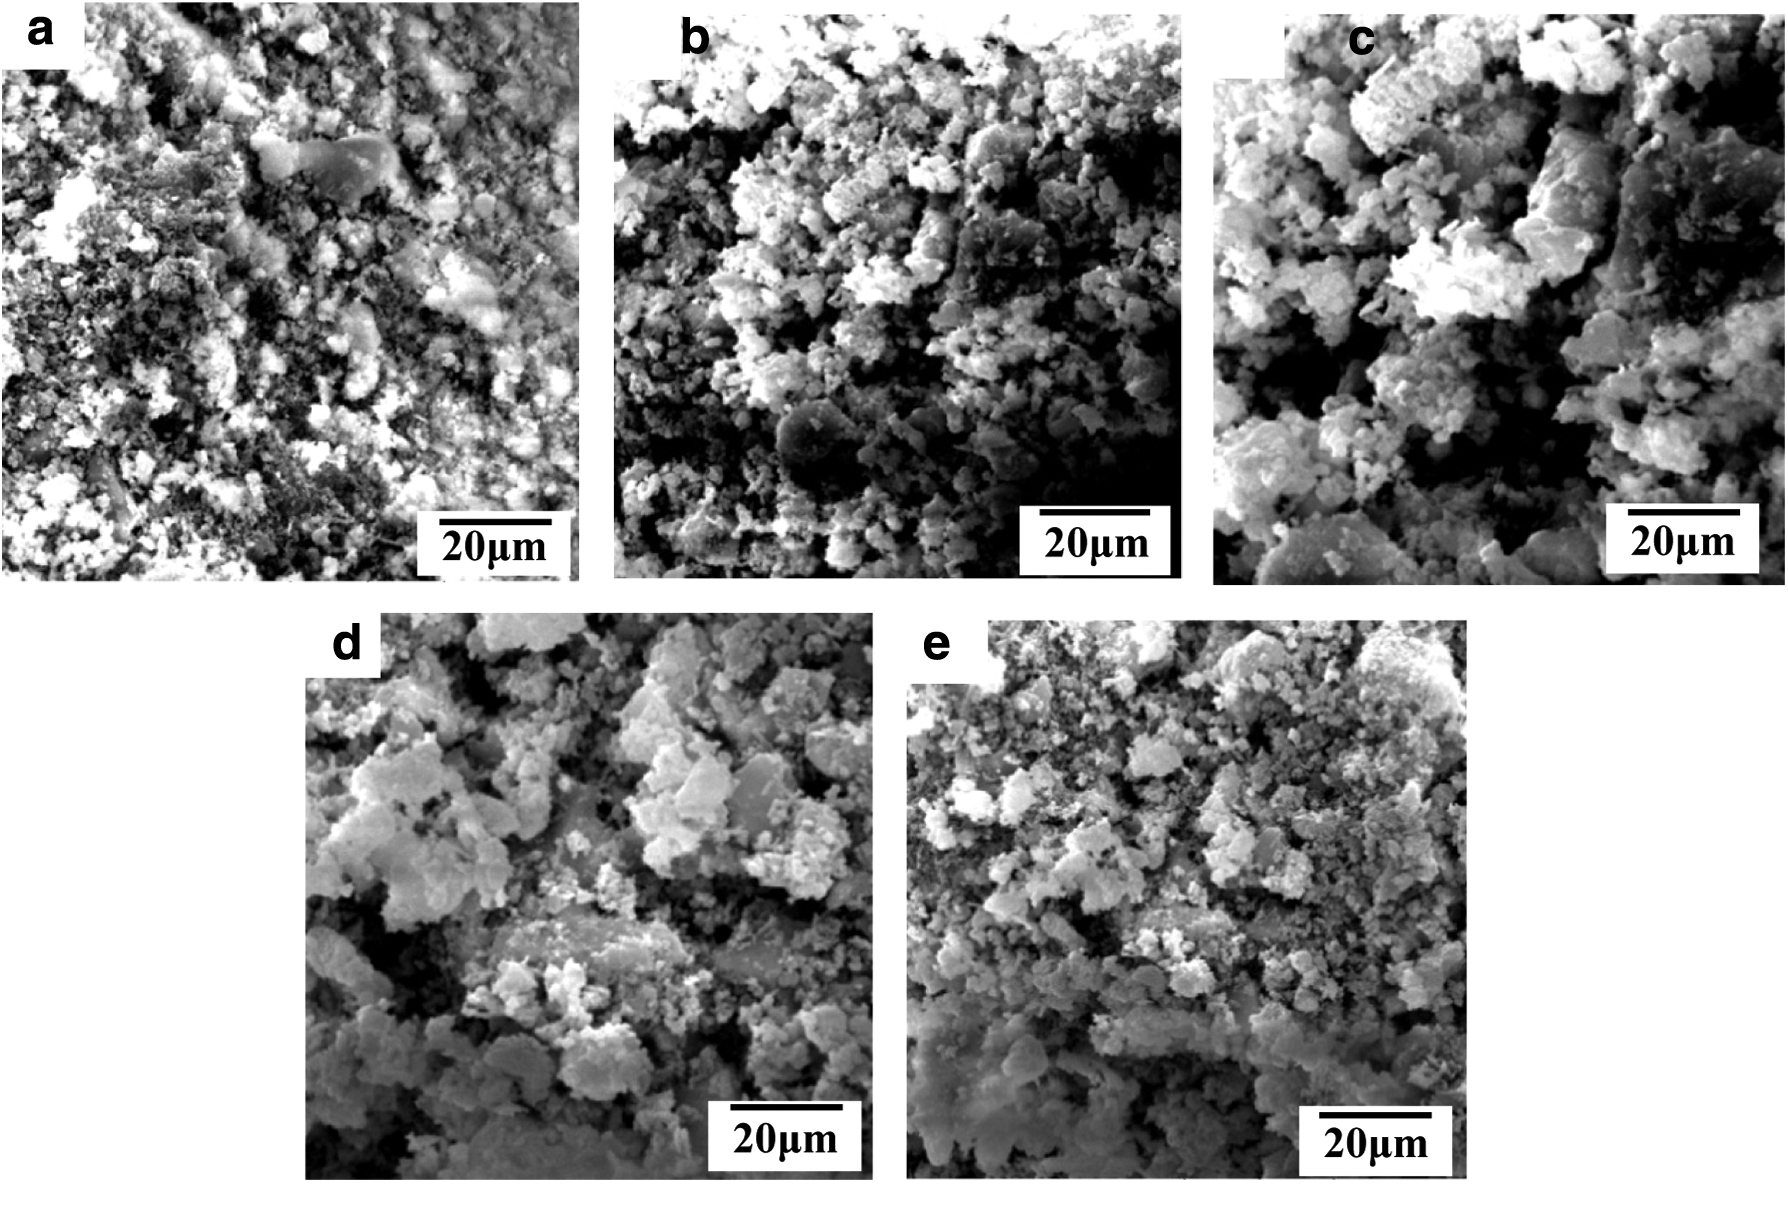
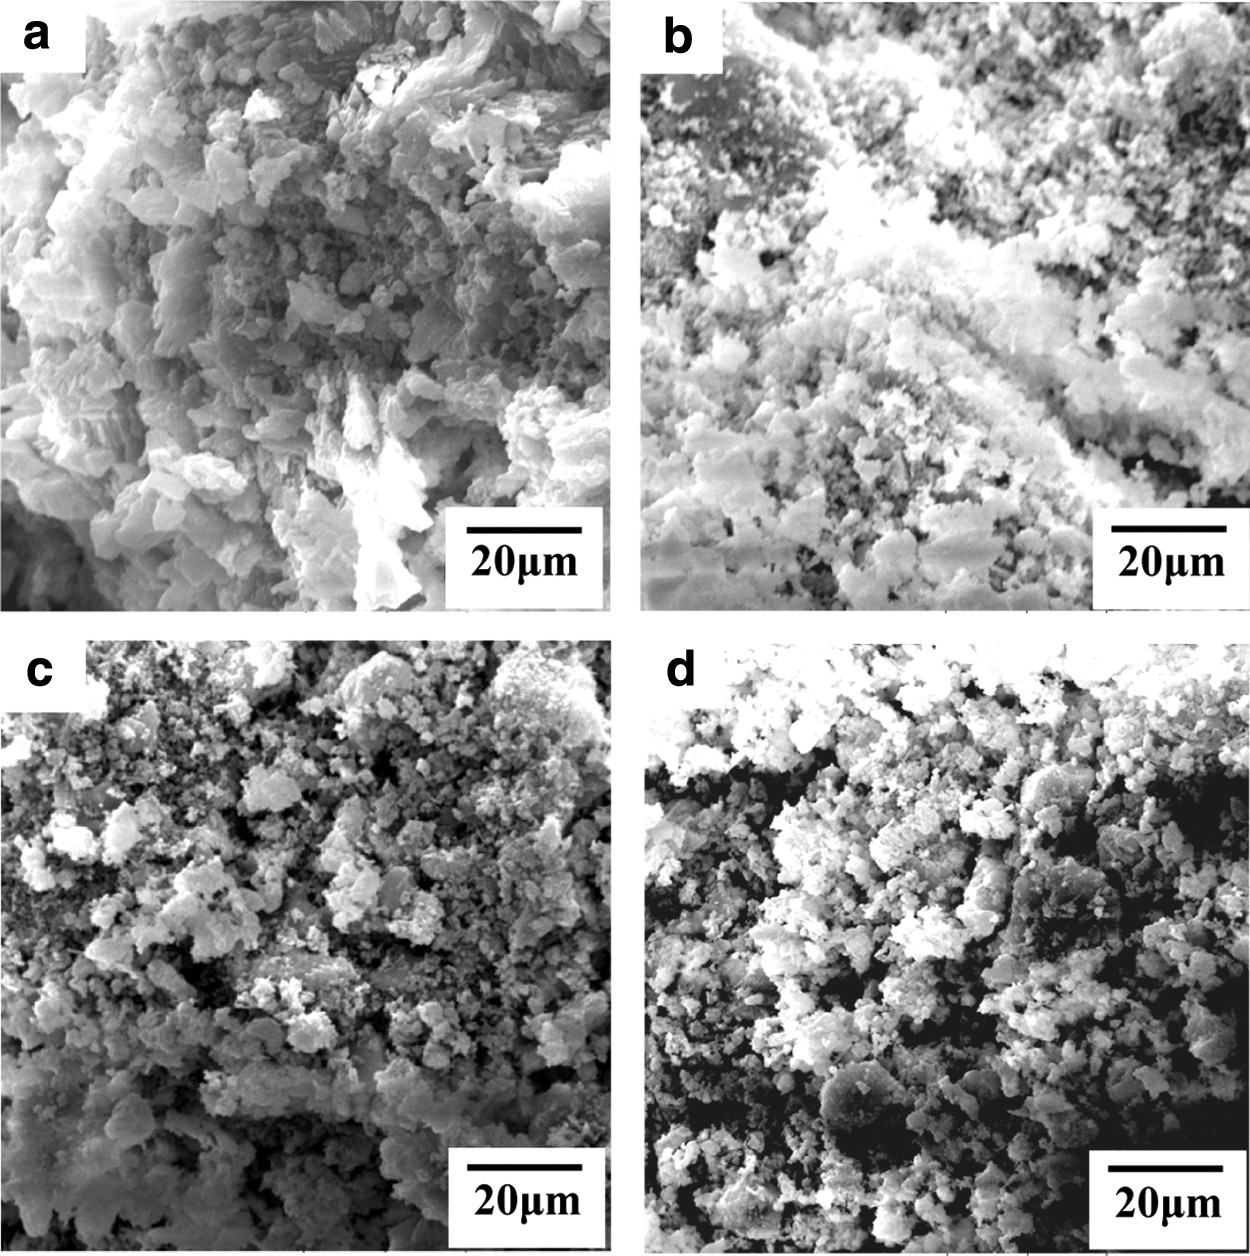
SEM of the tested mixed red mud:
Chemical Composition of the Tested Mixed Red Mud (w/%)
Figure 3 shows that the mixed red mud mainly contains minerals such as calcite, dicalcium silicate (2CaO·SiO2), tricalcium silicate (3CaO·SiO2), tricalcium aluminate (3CaO·Al2O3) and hydrogrossular (Ca3Al2(SiO4)x(OH)4(3-x)). As dewatering continues, the characteristic lines of 3CaO·SiO2 and 3CaO·Al2O3 become less apparent, those of 2CaO·SiO2 change little, and those of calcite show an increasing trend.
Figure 4 shows that, as dewatering goes on, the particles of the mixed red mud turn from the original small loose ones into subsequent flaky or blocky aggregates. On day 7 of dewatering (Fig. 4b), the particles of the mixed red mud begin to aggregate, and there are a large number of white substances on the surface, which mainly contain calcium carbonate (CaCO3). The blocky aggregates become bigger over time, and CaCO3 also tends to increase (Fig. 4b–d). Comparison of Fig. 4d and e shows that the size of the blocky aggregates basically remains the same, indicating that the size of the blocky aggregates basically stops increasing after 70 days of dewatering.
The influence of acid
Unconfined compression strength
Typical axial stress–strain curves of the specimens are shown in Fig. 5. Figure 5a shows the axial stress–strain curve of the soaked mixed red mud under unconfined compression. It can be seen that, compared with the specimens that have not been soaked in water (Type E): (1) the peak strength of the specimens does not decrease significantly after soaking; and (2) after soaking, the axial strain corresponding to the peak stress of the specimens is smaller than that corresponding to the peak stress of Type E specimens, indicating the increase in brittleness of the mixed red mud after soaking.
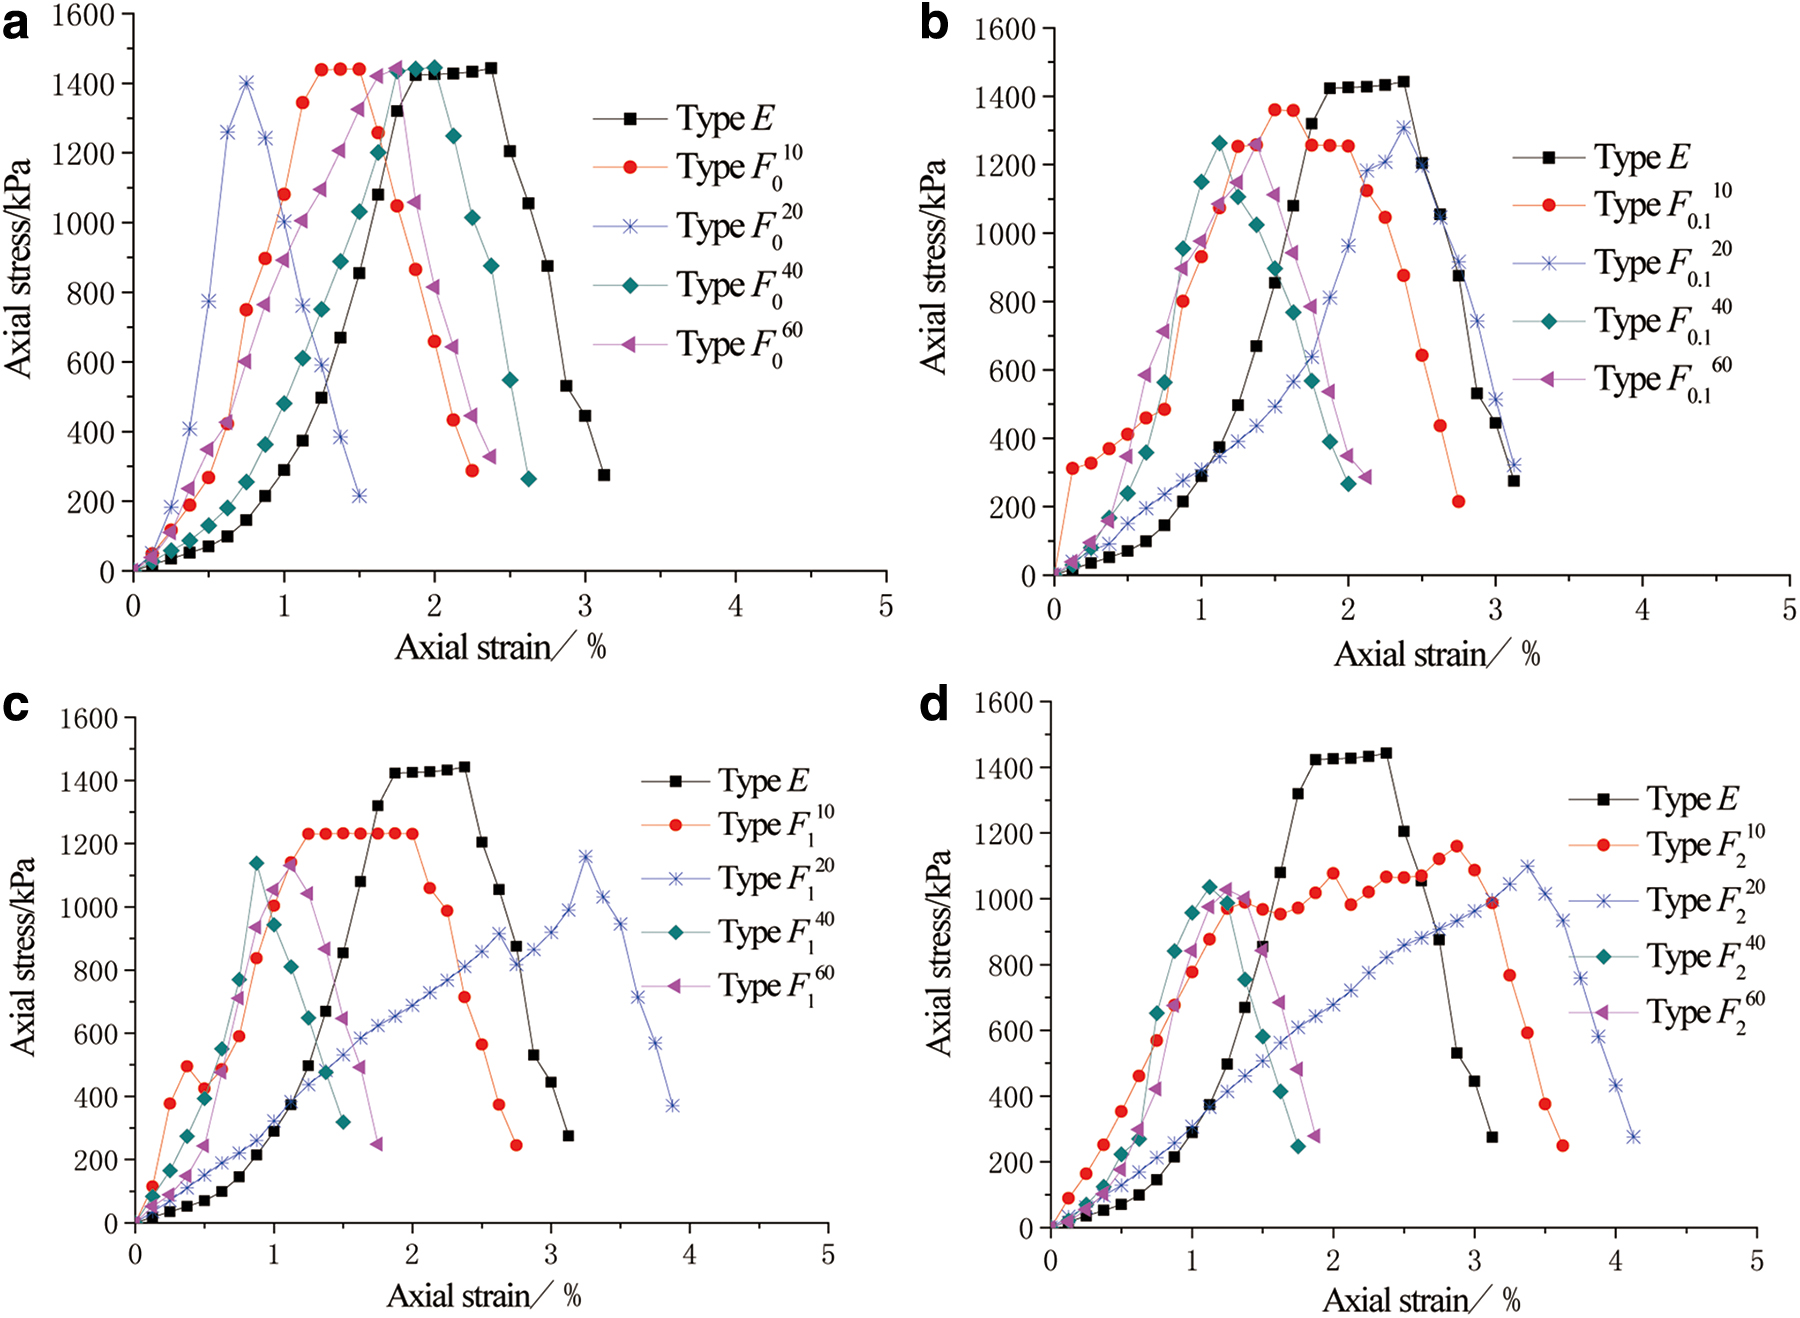
Typical axial stress–strain curves of the specimens:
As can be seen in Fig. 5b–d, after soaking in acid, the peak stress of the specimens significantly decreases compared with Type E specimens. Moreover, the higher the concentration of hydrochloric acid and the longer the soaking time, the more significant the decrease in peak stress.
Figure 6 shows the normalized peak strength qu/quE (where quE is the average compression strength of the Type E specimens) of the tested specimens. The normalized peak strength of Type F0.160 specimens is 0.873, much larger than the normalized peak strength (i.e., 0.804) of Type F210 specimens, indicating that the concentration of hydrochloric acid has a greater influence on the strength of the specimens than soaking time does. This is mainly because the calcite in the mixed red mud easily reacts with hydrochloric acid, producing water-soluble salts, which weaken the cementation bond among particles and subsequently lead to a great reduction in the peak strength of the specimens. In addition, the strength of the specimens tends to stabilize after the specimens are soaked in the hydrochloric acid for 40 days.

The normalized peak strength qu/quE.
Direct shear strength
The linear Mohr–Coulomb criterion, τ = σtanφ + c, was selected to determine the shear strength parameters, including internal friction angle (φ) and the cohesion (c). Figure 7 shows scatterplots of the peak shear stress (τ) versus the vertical pressure (σ), from which the corresponding linear regression lines (the inclination of the regression lines is the internal friction angle [φ], and the intercept on the vertical coordinate is the cohesion [c]) were obtained. The peak shear strength parameters (i.e., internal friction angle [φ] and cohesion [c]) are presented in Table 4.
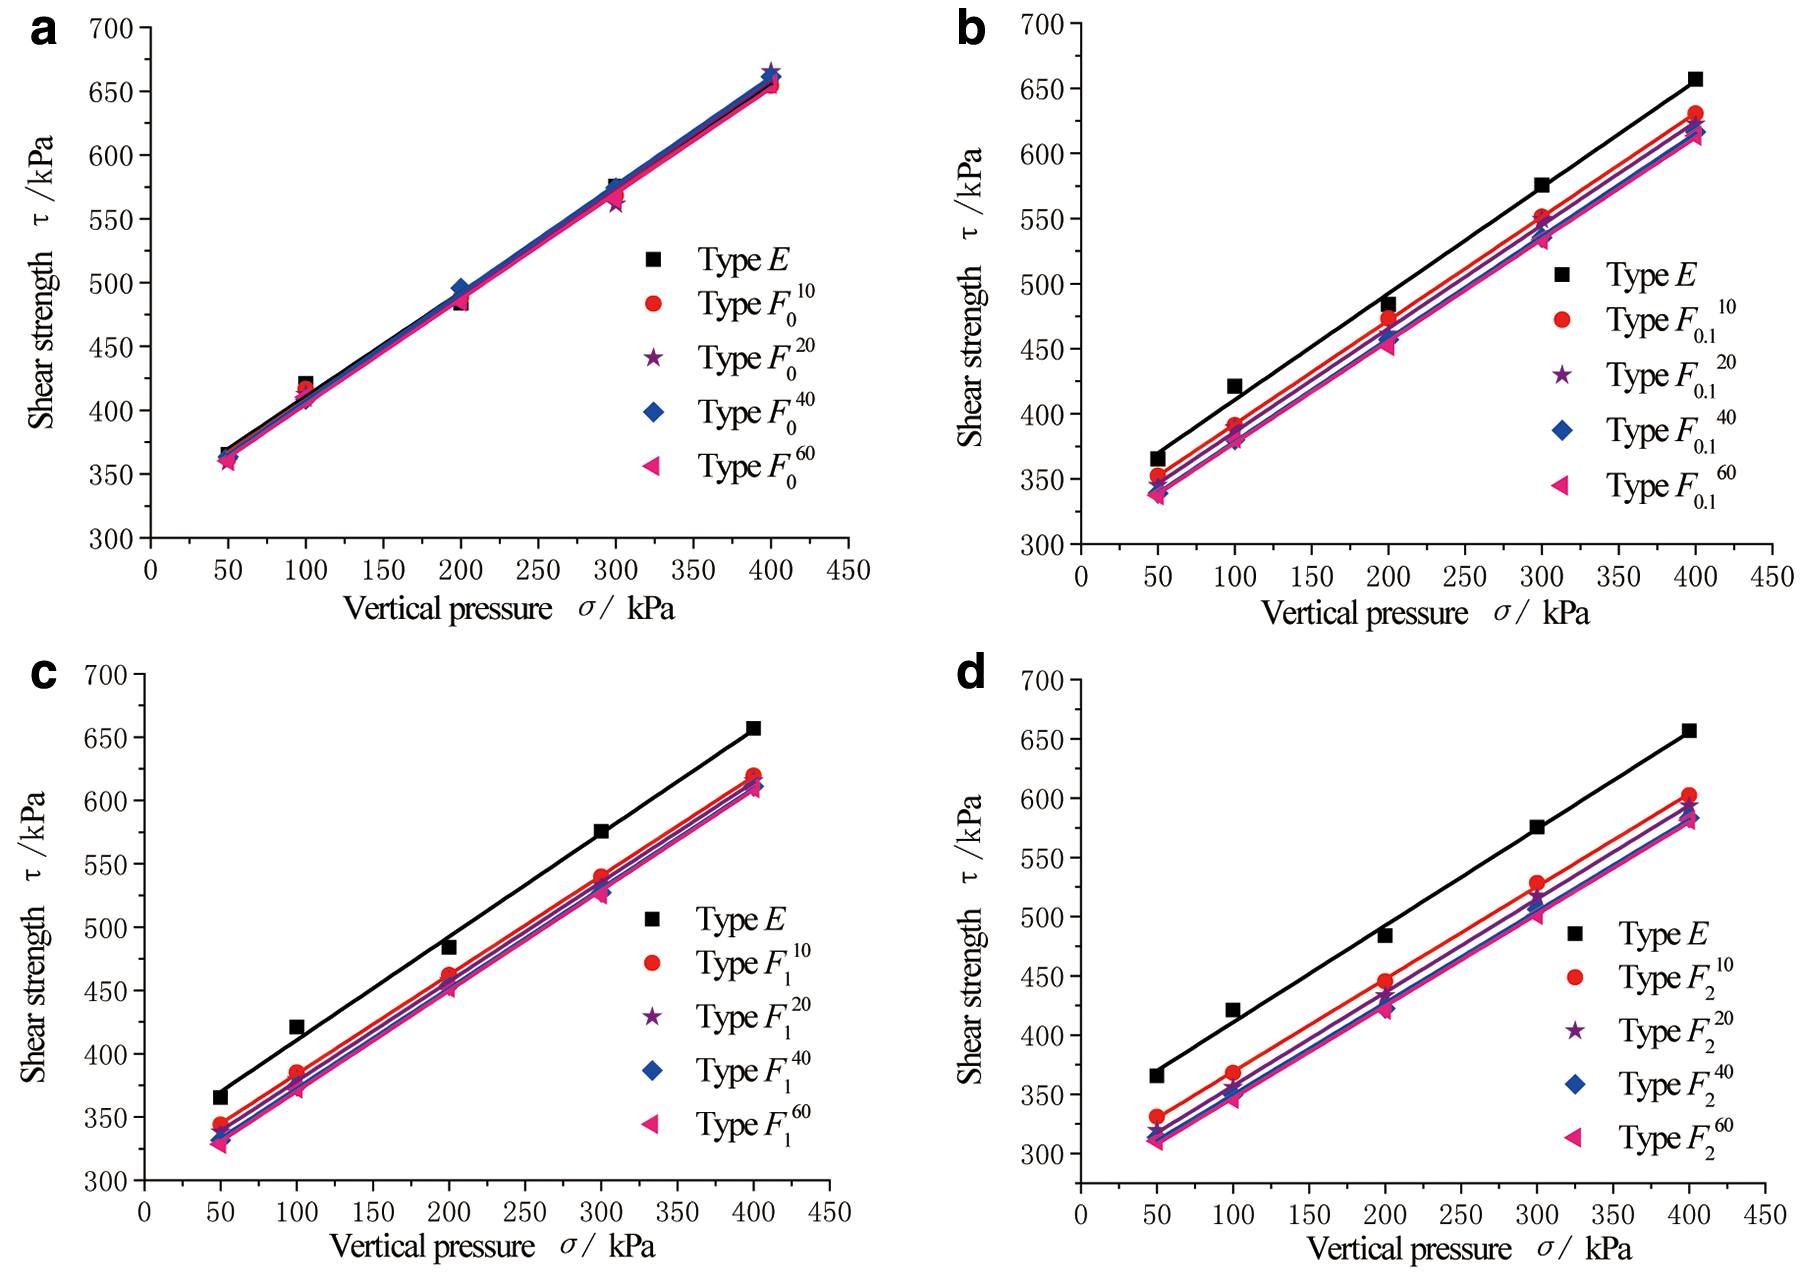
Peak shear stress τ versus vertical pressure σ:
Shear Strength Parameters (Internal Friction Angle φ and Cohesion c) of Tested Mixed Red Mud
Figure 7a shows that the regression line of the four groups of Type F0 b specimens almost coincides with that of Type E specimens, indicating that water soaking has little effect on the shear strength of the cemented and hardened mixed red mud (Type E), and the cementation hardening characteristic of the mixed red mud is irreversible.
Figure 7b–d shows that the regression lines of the specimens soaked in the hydrochloric acid with the same concentration but for different lengths of time are basically parallel, indicating that soaking time mainly affects the cohesion (c) and has little influence on the internal friction angle (φ). The values in Table 5 reveal that as the concentration of hydrochloric acid increases, the internal friction angle (φ) of the mixed red mud tends to decrease, but the decrease is negligibly small. Therefore, it can be assumed that soaking time and concentration have no effect on the internal friction angle of the mixed red mud, whereas cohesion (c) decreases with the increasing concentration and soaking time. Moreover, the concentration of hydrochloric acid has a stronger influence on the cohesion (c) than soaking time does.
Chemical Composition of Mixed Red Mud Soaked in 2 mol/L Hydrochloric Acid Solution (w/%)
Microstructure
The chemical composition, mineral composition, and microstructure of the mixed red mud after being soaked in 2 mol/L hydrochloric acid for different lengths of time are shown in Table 5 and Figs. 8 and 9, respectively. Table 5 shows that, compared with Type E, the chemical composition of the mixed red mud soaked in 2 mol/L acid changes substantially. The contents of SiO2, TiO2, and SO3 increase over time, whereas the contents of Al2O3, Fe2O3, CaO, Na2O, and MgO decrease over time, especially CaO. This is mainly because CaCO3 reacts easily with hydrochloric acid, and the salts produced dissolve in the solution, leading to a decrease in the CaO content.
XRD curves of the specimens:
SEM of the specimens:
Moreover, oxides, such as Al2O3, Fe2O3, and Na2O easily react with hydrochloric acid, and the water-soluble salts produced dissolve in the solution, which also contributes to the decrease in the content of CaO. This illustrates that when the mixed red mud is soaked in hydrochloric acid, carbonate minerals react with hydrochloric acid, whereas silicate minerals have no apparent reaction with hydrochloric acid.
Figure 8 shows that the mineral composition changes little after the mixed red mud is soaked in acid solution; the mixed red mud still mainly contains calcite, 2CaO·SiO2, 3CaO·SiO2, 3CaO·Al2O3, and Ca3Al2(SiO4)x(OH)4(3-x), among which the content of calcite decreases greatly over time, and the content of other minerals shows little change. This is because calcite mainly contains CaCO3, which reacts easily with hydrochloric acid, further leading to a large reduction in the content of calcite. The content of other minerals changes little because they are calcium silicate minerals, which undergo almost no reaction with hydrochloric acid.
Figure 9 shows that the microstructure changes substantially after the mixed red mud is soaked in acid solution, indicating a change from the original dense structure (Fig. 3e) to a porous and hollow structure, and the pores increase over time. This is mainly because CaCO3 in the red mud reacts with hydrochloric acid, causing the structure to become less compact. However, because silicates do not react with hydrochloric acid, the cementation bond remains among the particles of the red mud, thus forming a hollow structure.
Discussion
The strength formation mechanism
According to the test results, the strength formation mechanism of mixed red mud can be described as follows: the mixed red mud contains a large amount of hydraulic cement minerals, such as 2CaO•SiO2, 3CaO•SiO2, and 3CaO•Al2O3 and active ingredients, such as CaO (up to 30%) and Na2O (Table 3), which undergo a series of hydration reactions and carbonization reactions during dewatering:
Hydration reactions (Xiong et al., 2001):
Carbonization reactions (Wang et al., 2008):
As can be seen from the chemical Eqs. (1–9), a lot of cementing minerals are formed during the dewatering of the mixed red mud, which contributes to considerable changes in the strength characteristics and microstructure of the mixed red mud (Feng et al., 2017). First, 2CaO·SiO2 has the slowest hydration speed, 3CaO·SiO2 is much faster than that of 2CaO·SiO2, and 3CaO·Al2O3 has the fastest hydration speed. Therefore, the characteristic lines of 3CaO·SiO2 and 3CaO·Al2O3 are the first to become less apparent, whereas those of 2CaO·SiO2 change slowly (Fig. 3).
Second, hydroxides such as CaO and Na2O in the mixed red mud absorb CO2 in the air to form the cementing material CaCO3, making the mixed red mud more compact (Fig. 4). Hydrated minerals and CaCO3 cement of hydraulic cement minerals such as 2CaO·SiO2, 3CaO·SiO2, and 3CaO·Al2O3 increase the shear strength of the mixed red mud, leading to a huge increase in the cohesion of the mixed red mud (Table 2).
The test results show that Type D and Type E specimens are basically the same in terms of the compression coefficient (Table 1), the shape of the stress–strain curve (Fig. 1), axial strain at break (Fig. 1), failure mode (Fig. 2), shear strength parameter (Table 2), particle morphology, and particle aggregation morphology (Fig. 4). This indicates that the cementing strength of the mixed red mud mainly forms in the first 70 days of dewatering and remains the same after that, which means that the hydration reaction and carbonization reaction are more or less complete within the first 70 days, and cementing minerals also form primarily during this period.
Water soaking has little effect on the strength of the mixed red mud. It is mainly because cementing minerals, such as CaCO3 and calcium silicate in the mixed red mud are not highly soluble in water. However, salt minerals, such as NaOH, NaHCO3, Na2SiO3, and NaAlO2 are easily soluble in water, thus increasing particle pore sizes and the brittleness of the specimens.
Compared with the completely cemented and hardened Type E specimens, unconfined compression strength (qu), internal friction angle (φ), and cohesion (c) of the Type F260 specimens decrease significantly. Unconfined compression strength (qu), internal friction angle (φ), and cohesion (c) decrease by 28.8%, 3.6%, and 18.3%, respectively. However, the mixed red mud still maintains high strength even after it is soaked in high-concentration acid solution. The actual rainwater is far less acidic (with a concentration of only 5 × 10⁻⁶ mol/L) than the hydrochloric acid used for the tests. Therefore, we can conclude that rainfall infiltration has little effect on the strength characteristics of the mixed red mud.
The influence of the leachate
After a period of time in the storage yard, the liquid–solid separation is carried out. Subsequently, part of the leachate is returned to the alumina plant through the transportation pipeline for recycling and reenters the alumina production process, and part of the leachate is deposited and left in the red mud storage yard, which is treated by the natural evaporation and drainage system. Relevant research has shown that the main leachable metals in the mixed red mud leachate are Al (2.980 mg/L), Cr (0.111 mg/L), Mn (0.174 mg/L), and Ni (0.502 mg/L), which are far lower than the national standards for hazardous wastes. However, the pH value of leachate can be as high as 12.3, indicating exceptionally strong alkalinity.
Therefore, the most damaging factor of mixed red mud leachate to the environment is likely to be alkali pollution. The extremely high pH value, complex chemical composition, and mineral composition lead to strong corrosivity to organic matter, metals (such as aluminum), and siliceous materials (such as glass). The infiltration of strong alkaline leachate into the ground will not only pollute the groundwater but also cause corrosion to the foundation soil and initial dam (solidified by cement or fly ash) of the red mud storage yard. Moreover, if the red mud itself has been immersed in the strong alkaline leachate for a long time, its physical and mechanical properties and microstructure composition will be affected, which will seriously affect the safety and stability of the stockpile.
This article mainly examines the strength formation characteristics of mixed red mud under different dewatering times, and further research will be carried out in the following aspects to provide theoretical basis for the safety and stability of mixed red mud pile: the influence of leachate on the microstructure and strength characteristics of the mixed red mud, foundation soil, and initial dam; and numerical analysis of the stability of red mud pile considering the fluid solid coupling, so as to reveal the immersion corrosion of leachate on the seepage field and stress field and the safety coefficient of the stockpile.
Conclusions
In this article, the strength formation characteristics and cementation hardening mechanism of mixed red mud were investigated from the aspects of microstructure and macromechanical properties under different dewatering times. In addition, the influence of acid on the strength characteristics of mixed red mud was analyzed based on these two aspects. On the basis of the results from this study, the following conclusions can be drawn.
The mixed red mud is of high strength. During dewatering, active oxides in the mixed red mud undergo carbonization reactions, and hydraulic cement minerals react with water, producing cementing minerals, such as CaCO3, hydrated 2CaO·SiO2, hydrated 3CaO·SiO2, and hydrated 3CaO·Al2O3, which give the mixed red mud great cementing strength.
The strength formation of mixed red mud is basically completed in the first 70 days, and the strength is irreversible. The deformation characteristics (compression coefficient), strength characteristics (the shape of the stress–strain curve, axial strain at break, failure mode, and shear strength parameter), and the microscopic composition (particle morphology and particle aggregation morphology) change slightly after the first 70 days of dewatering time.
The acidic environment has little effect on the strength of the mixed red mud. After soaking in hydrochloric acid solution, its unconfined compression strength (qu) and cohesion (c) decrease with the increasing concentration of hydrochloric acid and soaking time, whereas internal friction angle (φ) showed no obvious change. After the specimens are soaked in 2 mol/L hydrochloric acid solution for 60 days, the unconfined compression strength and cohesion decrease slightly (28.8% and 18.3%, respectively), and the specimens still maintain high strength.
It is feasible to store the mixed red mud in the open air, and it can also be used in dam building and as a foundation material. It should be noted that when mixed red mud is discharged after initial mixing, it should be stacked in different zones to ensure that the red mud can be dehydrated and dried to achieve a rapid increase in strength, and the dewatering time should be no <70 days.
Footnotes
Author Disclosure Statement
No competing financial interests exist.
Funding Information
This work was financially supported by the Nature Science Foundation of Hubei Province (no. 2018CFB453); the Chongqing Natural Science Foundation (no. cstc2019jcyj-msxmX0262); the Science and Technology Research Program of Chongqing Municipal Education Commission (no. KJQN201801303); and the Foundation for High-level Talents of Chongqing University of Art and Sciences (no. R2015JJ07).