
Abstract
In this work, we have adopted a coprecipitation method to synthesize BiOBr nanoplates with diameter of 150–450 nm and thickness of 40–80 nm, and then created Bi nanowires (diameter: 6 nm) on their surface through a NaBH4 reduction method. Evolution of Bi nanowires was systematically investigated by varying the concentration of NaBH4 solution and reaction time. It is demonstrated that with increasing the NaBH4 concentration (2 h reaction), Bi nanowires are gradually evolved from BiOBr crystals, and in particular treatment by 110 mM NaBH4 solution leads to the complete evolution of BiOBr nanoplates to Bi nanowires. At a low-concentration NaBH4 solution (30 mM), BiOBr crystals are partially reduced to Bi nanowires with increasing reaction time, and then the Bi nanowires are recrystallized into BiOBr nanowires/nanoparticles on the surface of BiOBr nanoplates. At a high-concentration NaBH4 solution (110 mM), BiOBr nanoplates are easily reduced to Bi nanowires with a short reaction time, and further prolonging the reaction time leads to the gradual transformation of Bi nanowires into Bi4O5Br2 nanoparticles/nanowires. Photocatalytic performances of the samples were evaluated by eliminating rhodamine B from aqueous solution under simulated sunlight illumination. It is demonstrated that the creation of Bi nanowires (an appropriate content) on the surface of BiOBr nanoplates can produce excellent Bi@BiOBr composite photocatalysts with enhanced photodegradation performances. The underlying enhanced photocatalytic mechanism was investigated and discussed.
Introduction
The human living environment, particularly the water resource on which human beings depends, is getting seriously polluted with the rapid development of chemical industry. The industrial wastewater generated from textile/paper/paint/cosmetic manufacturers contains many harmful and carcinogenic substances such as organic dyes (Brown and De Vito, 1993), which must be eliminated before releasing wastewater into natural water bodies. Recently, semiconductor-based photocatalysis has aroused a great deal of interest due to its tremendous application potential in the wastewater purification (Zangeneh et al., 2015; Di et al., 2018; He et al., 2018; Wang et al., 2019a). Semiconductor photocatalysts are excited under sunlight irradiation to generate electrons (e−) and holes (h+) in their conduction band (CB) and valence band (VB), respectively. The photocatalytic degradation reactions depend on the photoexcited charge carriers. To achieve excellent photocatalytic performance of semiconductors, the photoexcited electrons and holes, which are easily recombined for pristine semiconductors, must be efficiently separated, thus making more charge carriers available for the photocatalytic reactions (He et al., 2016; Zheng et al., 2017; Wang et al., 2019e; Yan et al., 2019b).
Bismuth-containing oxide semiconductors, as an important class of semiconductor photocatalysts, have attracted much recent interest owing to their powerful photodegradation capabilities of organic dyes (Malathi et al., 2018; Zhao et al., 2018; Di et al., 2019b; Wang et al., 2019f; Xia et al., 2019). Bismuth oxyhalides with the chemical formula BiOX (X = I, Cl, Br) are a typical representative of Bismuth-containing semiconductor photocatalysts. The BiOX compounds crystallize in a layered matlockite-type structure constructed from [Bi2O2]2+ slabs alternated with double layers of X atoms (Zhang et al., 2008). Due to this unique layer structure, a polarization electric field (i.e., self-built internal static electric field) is formed perpendicular to the (001) facet of BiOX crystals (Peng et al., 2015). Under the action of the polarization electric field, photoexcited electrons and holes are ready to be spatially separated along the [001] direction. This suggests that BiOX nano/microplates with highly exposed (001) facets could exhibit superior photocatalytic activity since the photoexcited charge carriers tend to migrate to the (001) facets. Moreover, BiOX has been widely incorporated with other semiconductors to form excellent heterojunction composites (Huang et al., 2015; Kanagaraj and Thiripuranthagan, 2017; Chakraborty et al., 2018; Xia et al., 2018). In those heterojunction composites, the photoexcited electrons and holes could transfer between the two semiconductors, thus resulting in an efficient electron/hole pair separation and enhanced photocatalytic performance.
Nanostructured carbon materials and noble metals (e.g., carbon quantum dots, carbon nanotubes, graphene, metal nanoparticles, metal nanowires) manifest many intriguing physicochemical characteristics and offer a wide scope of technological applications in electronic devices, biomedicine, sensors, and wave absorption (Fernando et al., 2015; Cen et al., 2019a, 2019b; Tong et al., 2019; Wang et al., 2019h, 2019k; Yi et al., 2019; Zhang et al., 2019a). In the aspect of photocatalytic applications, these nanomaterials not only can be used as excellent electron sinks to promote the photoexcited electron/hole pair separation, but also can enhance visible light absorption and utilization in the photocatalysis. Furthermore, nanostructured metals can induce localized surface plasmon resonance (LSPR) by absorbing visible light (Jonathan et al., 2012; Wang et al., 2019i, 2019j).
The LSPR-induced electromagnetic field can facilitate the generation and separation of electron/hole pairs in the semiconductor. Due to these outstanding properties, nanostructured carbon materials and noble metals have been demonstrated to be excellent modifiers or cocatalysts to enhance the photocatalytic performances of semiconductor photocatalysts (Park et al., 2014; Yan et al., 2016; Alansi et al., 2018; Di et al. 2019a; Gao et al., 2019a, 2019b). Recently, Bi-modified BiOBr composite photocatalysts have been frequently prepared, and they were shown to exhibit photocatalytic performance obviously superior to that of bare BiOBr (Xiong et al., 2014; Dong et al., 2018; Imam et al., 2019; Zhang et al., 2019b). However, the evolution of Bi nanowires from BiOBr crystals through a NaBH4 reduction method and their effect on the optical absorption properties and photocatalytic performances of the Bi@BiOBr samples are yet to be investigated.
In this work, we adopted a coprecipitation method to synthesize BiOBr nanoplates, and created Bi nanowires on the surface of BiOBr nanoplates through a NaBH4 reduction method. The evolution of Bi nanowires was systematically investigated by varying the concentration of NaBH4 solution and treatment time. The photocatalytic performances of the as-prepared Bi@BiOBr samples were evaluated by eliminating rhodamine B (RhB) from aqueous solution under simulated sunlight illumination.
Experimental
Materials
Bi(NO3)3 · 5H2O (≥99%), NaBr (≥99%), and NaBH4 (≥99%) were obtained from Shandong Xiya Chemical Industry Co., Ltd. Glacial acetic acid (CH3COOH ≥99.5%) was derived from Guangdong Chemical Reagent Engineering-Technological Research and Development Center. Polyvinyl pyrrolidone (PVP) was purchased from Shanghai Aladdin Reagent Co., Ltd. All the raw materials and chemical reagents were of analytical grade, and directly used without further purification.
Synthesis of BiOBr nanoplates
A coprecipitation method was used to synthesize BiOBr nanoplates. Typically, 1.4553 g (3 mmol) of Bi(NO3)3 · 5H2O was dissolved in 3 mL glacial acetic acid with magnetic stirring (MS) for 1 h (designated as solution A). Around 0.1753 g (3 mmol) of NaBr was dissolved in 30 mL deionized water with MS for 1 h (designated as solution B). The solution B was added in the solution A drop by drop, and then the obtained mixture solution was magnetically stirred for 12 h. The precipitate was collected as BiOBr nanoplates. To remove impurity ions, the washing process with deionized water and ethanol and drying process at 60°C for 12 h were required.
Treatment of BiOBr nanoplates with NaBH4
The as-synthesized BiOBr nanoplates were treated by NaBH4 solution. In a typical treatment process, 1 g of PVP was dissolved in 100 mL deionized water (with 1 h MS), to which was then added 0.6098 g of BiOBr nanoplates (with another 1 h MS). Thirty milliliters of NaBH4 solution with a certain concentration was added to the above suspension drop by drop, followed by 1 h MS, and then 1 h static placing (SP). The NaBH4-treated BiOBr sample was collected, washed with deionized water and ethanol, and dried at 50°C for 12 h. The samples treated by 20, 30, 40, 50, 70, 90, 110, and 140 mmol/L (mM) NaBH4 solutions were termed as 20 mM—BiOBr, 30 mM—BiOBr, 40 mM—BiOBr, 50 mM—BiOBr, 70 mM—BiOBr, 90 mM—BiOBr, 110 mM—BiOBr, and 140 mM—BiOBr, respectively.
Characterization methods
X-ray powder diffraction (XRD) characterization of the samples was performed on a D8 Advance X-ray diffractometer with λCu-Kα = 0.15406 nm. A field-emission scanning electron microscope (JSM-6701F) and a field-emission transmission electron microscope (JEM-1200EX) were used for the scanning electron microscopy/transmission electron microscopy (SEM/TEM) observation. X-ray photoelectron spectroscopy (XPS) measurement was carried out on a PHI-5702 multifunctional X-ray photoelectron spectrometer. Ultraviolet-visible (UV–vis) diffuse reflectance spectra of the samples were measured on a TU-1901 double beam UV–vis spectrophotometer. Fourier transform infrared (FTIR) spectra were obtained on a Spectrum Two FTIR spectrophotometer. A RF-6000 fluorescence spectrophotometer was employed to measure the photoluminescence (PL) spectra at λexcitation = 280 nm. A Raman spectrometer (LabRAM HR Evolution) was used for the Raman microscopy measurement.
Photoelectrochemical testing
Photocurrent response and electrochemical impedance spectroscopy (EIS) measurements were performed on a CST 350 electrochemical workstation equipped with a three-electrode cell configuration. The working electrode preparation and photoelectrochemical measurement procedures were the same to those reported in the literature (Zheng and Yang, 2018). The used electrolyte was 0.1 mol/L Na2SO4 aqueous solution, and the light source was a 200-W xenon lamp (emitting simulated sunlight with wavelength region of 300–2,500 nm).
Photocatalytic testing
The photocatalytic degradation performances of the samples were evaluated by removing RhB from aqueous solution under illumination by a 200-W xenon lamp (sunlight simulator). The photocatalytic system was composed of 0.1 g photocatalyst and 100 mL RhB solution (Cphotocatalyst = 1 g/L, CRhB = 5 mg/L). The pH value of reaction solution lies between 6 and 7. Before photocatalysis, the adsorption experiment was carried out by magnetically stirring the mixture solution for 30 min in the dark. During the photodegradation process, the residual RhB concentration was monitored by sampling 2.5 mL of the reaction solution from the photoreactor and measuring its absorbance using a UV–vis spectrophotometer at λRhB = 554 nm. Before the absorbance measurement, the photocatalyst was centrifugally removed from the reaction solution. Based on the initial RhB concentration (C0) and residual RhB concentration (Ct), the degradation percentage (DP) of RhB was given as: DP = (C0 − Ct)/C0 × 100%.
Results and Discussion
Effect of NaBH4 concentration
Figure 1 shows the XRD patterns of BiOBr nanoplates before and after treatment with NaBH4 solution of different concentrations for 2 h (1 h MS, 1 h SP). The diffraction peaks of pristine BiOBr nanoplates can be perfectly indexed according to the standard diffraction pattern of JCPDS#78-0348, implying the formation of pure BiOBr tetragonal structure with space group P4/nmm. When BiOBr nanoplates are treated by NaBH4 solution, additional diffraction peaks corresponding to metallic Bi are observed on their XRD patterns, and moreover their intensity gradually increases with increasing the NaBH4 solution. When the NaBH4 solution is increased up to 110 mM, pure Bi crystal, which is characterized as a R-3m rhombohedral structure (JCPDS#85-1329), is evolved from the BiOBr crystal.

XRD patterns of pristine and NaBH4-treated BiOBr samples with different concentrations. XRD, X-ray powder diffraction.
Pristine and NaBH4-treated BiOBr samples with different concentrations were observed by SEM. Figure 2a shows the SEM image of pristine BiOBr, revealing the synthesis of BiOBr nanoplates through a coprecipitation method. The nanoplates have a size distribution of 150–450 nm in diameter and 40–80 nm in thickness, and their surface appears to be clean and smooth. As seen from the SEM images in Fig. 2b–f, after treatment with NaBH4 solution, the surface of BiOBr nanoplates becomes quite rough, and Bi nanowires are evolved from BiOBr crystals by the NaBH4 reduction. In particular, when the concentration of NaBH4 solution is increased up to 110 mM, the BiOBr nanoplates are completely reduced into Bi nanowires. This evolution process leads to a slight increase in the Brunauer–Emmett–Teller (BET) surface area of the samples (e.g., the BET surface area is increased from 8.29 m2/g for pristine BiOBr to 8.71 m2/g for 30 mM-BiOBr, as depicted in Supplementary Fig. S1).

SEM images of
TEM investigation was performed on pristine BiOBr and 30 mM-BiOBr to further unveil their microstructures. Figure 3a shows the TEM image of pristine BiOBr nanoplates, revealing that they possess a clean and smooth surface. The BiOBr nanoplates present a single-crystalline feature with perfect lattice structure, as depicted by the high-resolution TEM (HRTEM) image in Fig. 3c. The TEM image of 30 mM-BiOBr (Fig. 3b) clearly demonstrates the creation of Bi nanowires with an average diameter of 6 nm on the surface of BiOBr nanoplates by the NaBH4 reduction. As seen from the HRTEM image in Fig. 3d, the nanowires manifest obvious lattice fringes, which can be characterized as the Bi rhombohedral structure. Moreover, the surface lattice of BiOBr becomes disordered. Figure 3e and f present the energy-dispersive X-ray spectroscopy (EDS) spectra of pristine BiOBr and 30 mM—BiOBr, respectively. It is seen that the NaBH4 treatment leads to an obvious decrease in the O and Br contents, which gives support to the reduction of partial BiOBr crystals into Bi nanowires. On the EDS spectra, the observation of additional Cu and C signals could be ascribed to the TEM microgrid holder (Zhao et al., 2019a).

It is noted that the properties of nanomaterials are highly dependent on their optical absorption properties, which can be determined by UV–vis diffuse reflectance spectroscopy measurements (Li et al., 2019; Liang et al., 2019). Figure 4a shows the UV–vis diffuse reflectance spectra of pristine and NaBH4-treated BiOBr samples with different concentrations. It is seen that pristine BiOBr has a poor optical absorption in the visible-light region due to its large bandgap energy. In contrast, NaBH4-treated BiOBr samples exhibit enhanced visible light absorption, which monotonically increases with increasing the NaBH4 concentration. This is confirmed by the apparent color change of the samples, as shown in Fig. 4c. Pristine BiOBr presents white color, whereas the color of NaBH4-treated BiOBr samples is gradually deepened to the black with increasing the NaBH4 concentration. The color deepening is ascribed to the creation of Bi nanowires by the NaBH4 reduction, which have strong visible-light absorption due to the LSPR.
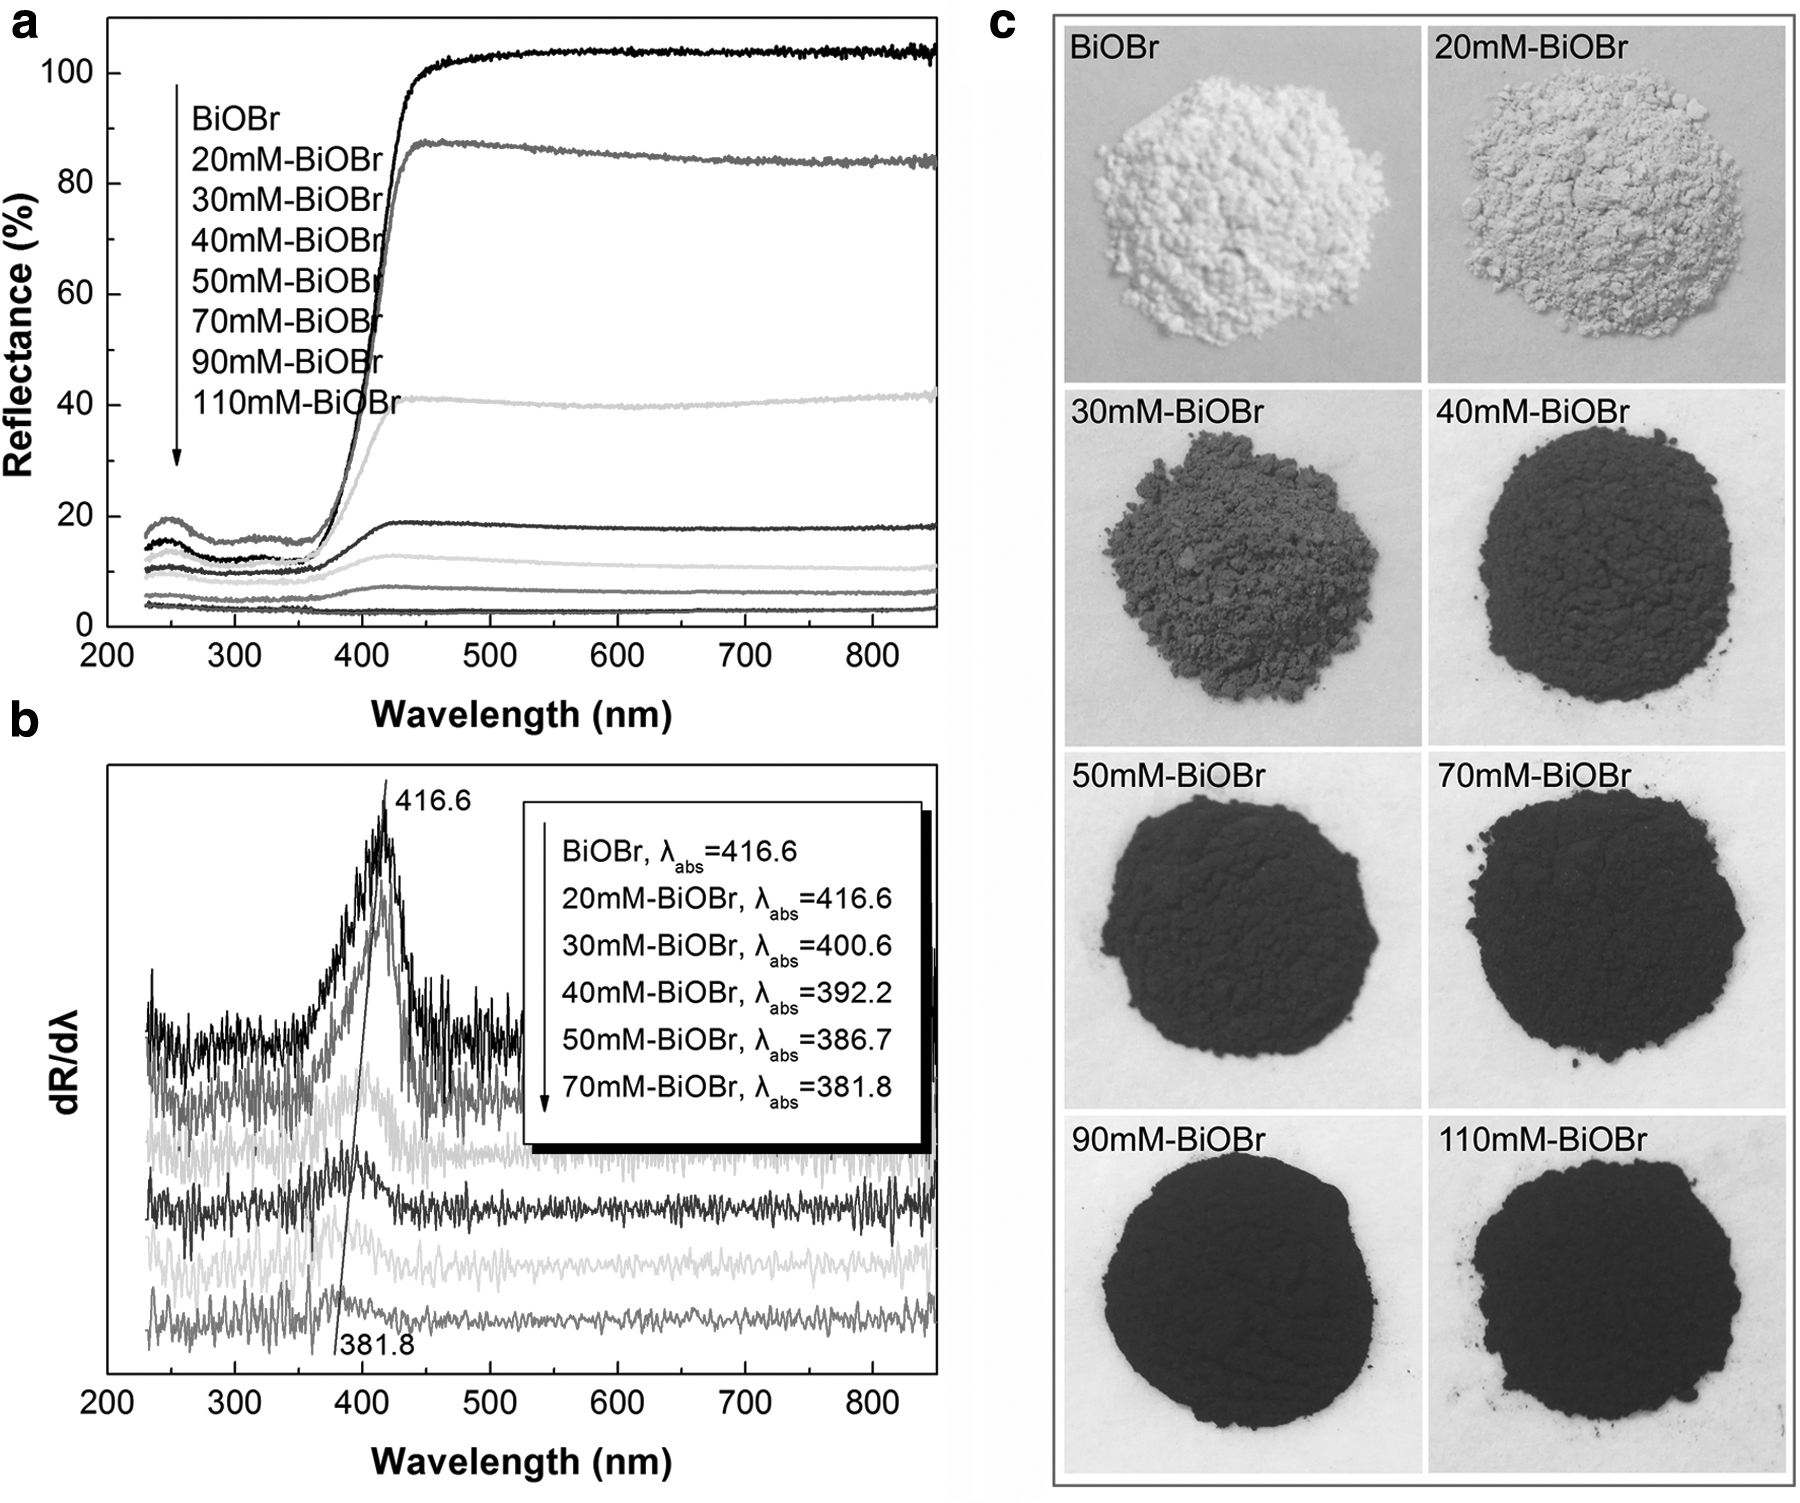
UV–vis diffuse reflectance spectra
The first derivative curves of the UV–vis diffuse reflectance spectra can be available for determining the absorption edge wavelength (or bandgap energy) of BiOBr. As illustrated in Fig. 4b, pristine BiOBr has an absorption edge at λabs = 416.6 nm, and the absorption edge of NaBH4-treated BiOBr samples exhibits a gradual decrease with increasing the NaBH4 concentration. According to the relationship Eg = 1240/λabs, the bandgap energy (Eg) of BiOBr for the samples can be obtained, as summarized in Table 1. The slightly decreased Eg of NaBH4-treated BiOBr could be ascribed to the lattice expansion of BiOBr crystals due to their partial reduction into Bi nanowires.
Bandgap Energy (Eg) of BiOBr, Adsorption Percentage of RhB, Degradation Percentage of RhB After Photocatalysis for Fifteen Minutes, and Apparent First-Order Reaction Rate Constant (kapp) for Pristine and NaBH4-Treated BiOBr Samples
RhB, rhodamine B; MS, magnetic stirring; SP, static placing.
As an example, XPS analysis was performed on 30 mM-BiOBr to elucidate the element chemical states, as shown in Fig. 5. Besides the Bi, O, and Br elements, additional C signal (C 1s → 284.8 eV) is detected on the survey scan XPS spectrum (Fig. 5a), which is used for the binding energy calibration. Figure 5b illustrates the high-resolution Bi 4f XPS spectrum, on which the two sharp peaks at 159.1 and 164.4 eV are attributed to Bi 4f7/2 and Bi 4f5/2 core-electron binding energies of Bi3+ species, respectively (Cao et al., 2019; Rashid et al., 2019). The appearance of two weak peaks at 157.3 (Bi 4f7/2) and 162.7 eV (Bi 4f5/2) is indicative of the formation of metallic Bi nanowires on the surface of BiOBr nanoplates (Cao et al., 2019). The O 1s XPS spectrum (Fig. 5c) is deconvoluted into three peaks at 530.0, 531.7, and 533.3 eV. The peak at the binding energy value of 530.0 eV is characterized as the lattice oxygen of BiOBr crystals (Cao et al., 2019; Rashid et al., 2019). The binding-energy peaks at 531.7 and 533.3 eV are ascribed to the contribution of chemisorbed oxygen species and water molecules, respectively (Pooladi et al., 2019; Zhao et al., 2019b). On the Br 3d XPS spectrum (Fig. 5d), the deconvoluted peaks at 68.2 and 69.2 eV are attributed to Br 3d5/2 and Br 3d3/2 core-electron binding energies of Br− species, respectively (Cao et al., 2019; Rashid et al., 2019).
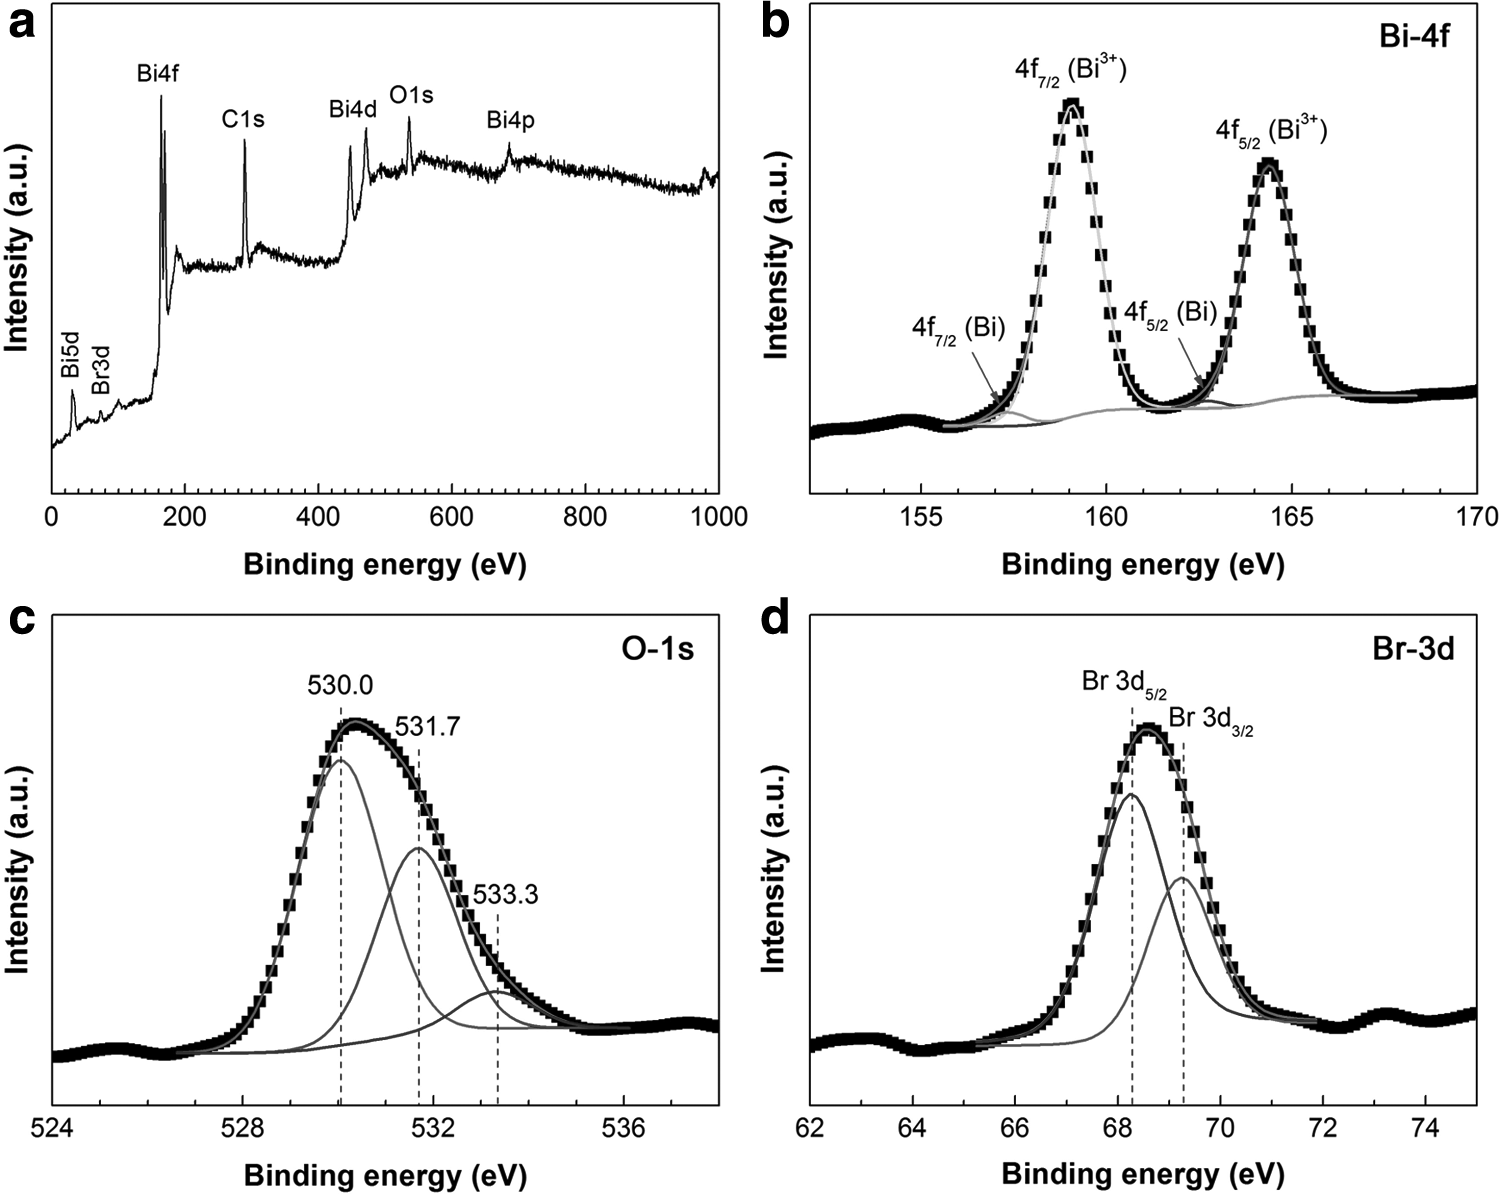
Survey scan XPS spectrum
Figure 6 shows the Raman spectra of BiOBr, 30 mM—BiOBr, and 110 mM—BiOBr. For pristine BiOBr, a strong peak at 108 cm−1 and three weak peaks at 87, 156, and 379 cm−1 are observed, which are characterized as the vibration features of BiOBr nanoplates. The peaks at 108 and 156 cm−1 correspond to the A1g and Eg internal Bi–Br stretching modes, respectively (Zhang et al., 2013; Wu et al., 2015). The extremely weak peak at 379 cm−1 originates from the motion of the oxygen atoms (B1g mode) (Zhang et al., 2013; Wu et al., 2015). The appearance of the weak peak at 87 cm−1 could be ascribed to the formation of oxygen vacancies in BiOBr nanoplates (Wu et al., 2015). The characteristic Raman peaks of BiOBr crystals become slightly weakened for 30 mM—BiOBr, and completely disappear for 110 mM—BiOBr. Instead, three bands at 86, 118, and 303 cm−1, characterized as the vibration modes of metallic Bi (Weng et al., 2013), are observed on the Raman spectrum of 110 mM—BiOBr, implying the formation of Bi nanowires after treatment by 110 mM NaBH4 solution.

Raman spectra of pristine BiOBr, 30 mM—BiOBr, and 110 mM—BiOBr.
FTIR analysis is performed on BiOBr, 30 mM—BiOBr, and 110 mM—BiOBr to elucidate the possible existence of functional groups in the samples, as shown in Fig. 7. The broad absorption band centered around 3,141 cm−1 could be ascribed to the stretching vibration of N–H groups (Wang et al., 2019g). The peak at 1,392 cm−1 can be characterized as the in-plane deformation vibration O–H groups, implying that alcohols could be anchored on the samples during the washing process (Wang et al., 2019g). The presence of water molecules on the surface of the samples is confirmed by the absorption bands appearing at 3,430 and 1,634 cm−1 (Wang et al., 2019b, 2019d). A strong characteristic peak of BiOBr crystals is observed at 515 cm−1 for pristine BiOBr and 30 mM—BiOBr (Yang et al., 2015). The BiOBr characteristic peak disappears for 110 mM—BiOBr, implying the complete evolution of BiOBr nanoplates to Bi nanowires with 110 mM NaBH4 solution treatment. No characteristic peaks assignable to Bi nanowires are observed for 110 mM—BiOBr, possibly due to infrared inactivity of metallic Bi.

Fourier transform infrared spectra of pristine BiOBr, 30 mM—BiOBr, and 110 mM—BiOBr.
Pristine and NaBH4-treated BiOBr samples with different concentrations were measured by photocurrent response and EIS with the aim of elucidating the separation/transfer behavior of photoexcited carriers. Figure 8a illustrates the transient photocurrent–time curves obtained by intermittently illuminating the samples with simulated sunlight. An obvious photocurrent response behavior is observed for all the samples. On the irradiation, the photocurrent density of pristine BiOBr, 20 mM—BiOBr, 30 mM—BiOBr, 40 mM—BiOBr, and 110 mM—BiOBr is obtained as 0.58, 0.99, 1.91, 1.44, and 0.08 μA/cm2, respectively. With increasing the NaBH4 concentration, the highest photocurrent density is observed for 30 mM—BiOBr. Figure 8b shows the EIS spectra (Nyquist plots) of the samples, all of which (except for that of 110 mM—BiOBr) display a typical semicircle in the high-frequency region and a straight line in the low-frequency region. The semicircle diameter for the samples follows the order: 30 mM—BiOBr <40 mM-BiOBr <20 mM—BiOBr < BiOBr, implying that 30 mM—BiOBr has the smallest charge-transfer resistance due to its smallest semicircle diameter (Wang et al. 2019c). Both the photocurrent response and EIS analyses demonstrate that NaBH4 treatment with appropriate concentrations (particularly 30 mM NaBH4 solution) result in significantly enhanced electron/hole separation efficiency and interface charge transfer of NaBH4-treated BiOBr samples.
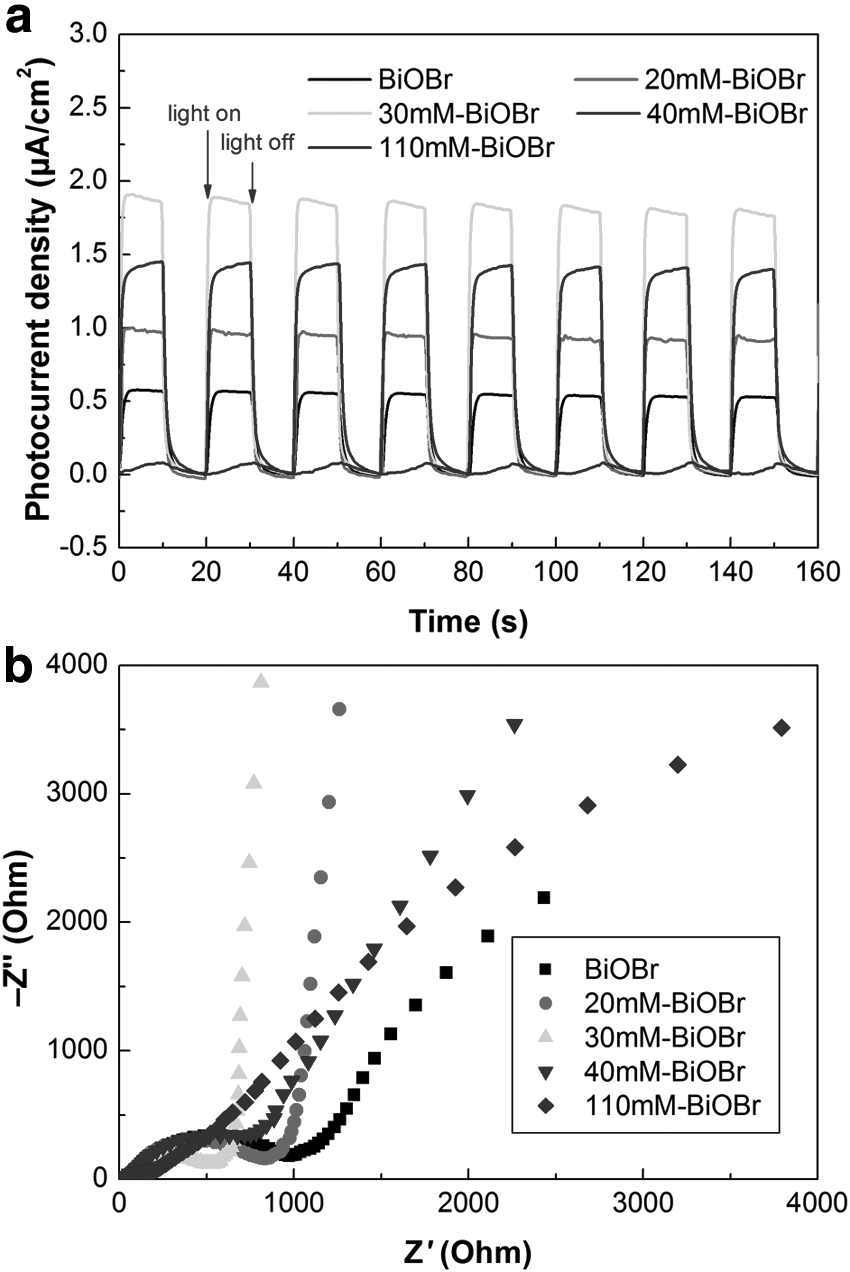
Transient photocurrent response curves
The photoexcited carrier separation behavior of the samples was further determined by PL spectroscopy characterization. As seen in Fig. 9, the PL spectra of pristine and NaBH4-treated BiOBr samples with different concentrations show an obvious PL emission peak at 560 nm, which is characterized as the electron/hole pair recombination (Huo et al., 2012). The weakest PL emission peak is observed for 30 mM—BiOBr among the samples, indicating that it has the lowest electron/hole recombination. This result is consistent with the photocurrent response and EIS analysis results.

Photoluminescence spectra of pristine and NaBH4-treated BiOBr samples with different concentrations.
The photocatalytic degradation performances of pristine and NaBH4-treated BiOBr samples with different concentrations were assessed by eliminating RhB from aqueous solution under simulated sunlight irradiation. The adsorption and time-dependent photodegradation of RhB over the samples are presented in Fig. 10a. The adsorption percentages (30 min contact in the dark) and DPs of RhB (15 min photoreaction) are summarized in Table 1. It is seen that pristine BiOBr nanoplates exhibit a large adsorption toward RhB (53.7%), which could be induced by the polarization electric field perpendicular to the BiOBr nanoplates (Peng et al., 2015). With increasing the NaBH4 concentration, the RhB adsorption on the NaBH4-treated BiOBr samples shows a monotone decrease. In particular, only a small adsorption of RhB is observed for 90 mM—BiOBr and 110 mM—BiOBr. This is because BiOBr crystals are gradually reduced to Bi nanowires that have a poor dye adsorption behavior.
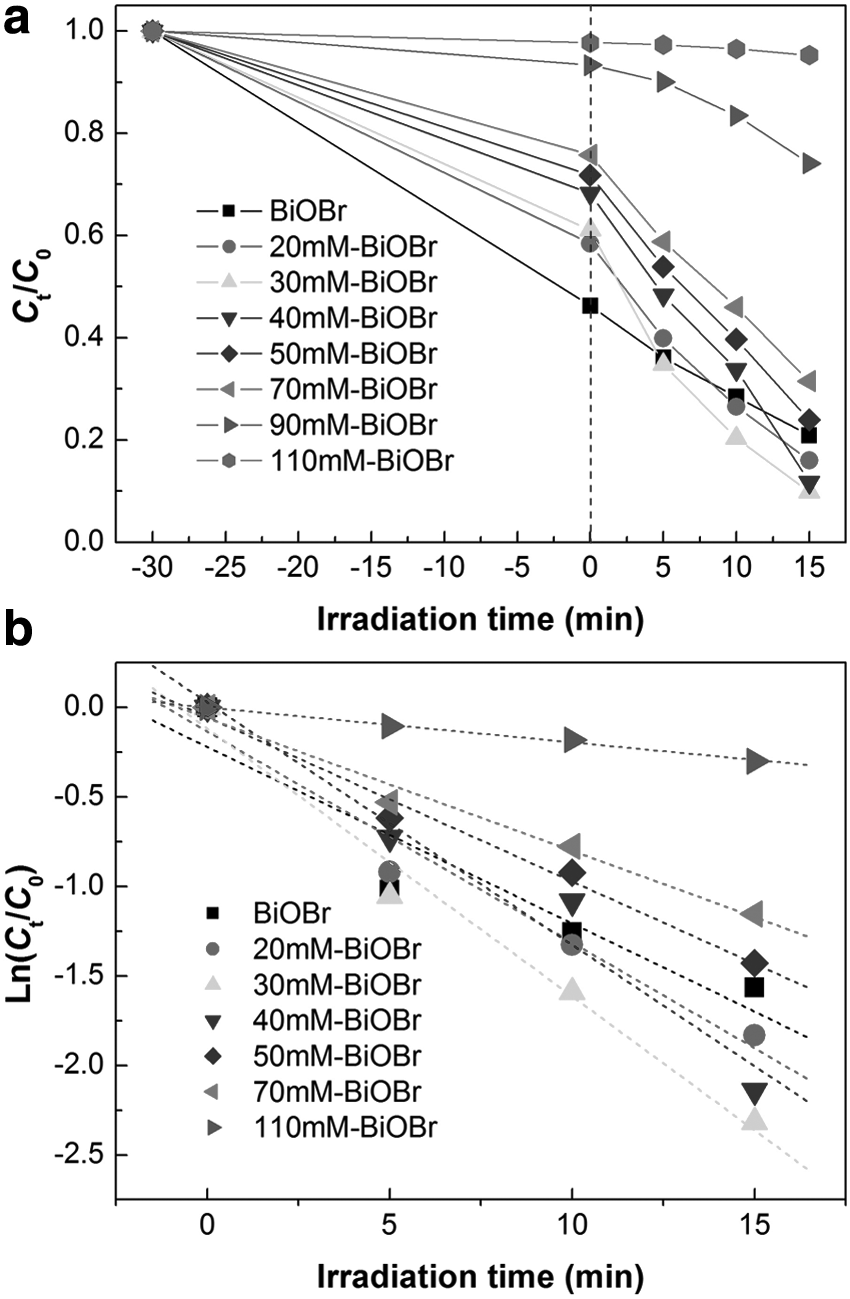
Time-dependent photodegradation curves of RhB
Pristine BiOBr nanoplates show a 79.1% photodegradation of RhB. With increasing the NaBH4 concentration, the photodegradation activity of the NaBH4-treated BiOBr samples initially increases and reaches the highest level for 30 mM—BiOBr (DP = 90.1%), and then decreases. When BiOBr nanoplates are completely transformed to Bi nanowires (110 mM—BiOBr), almost no degradation of RhB is observed. To further elucidate the photodegradation activity of the samples, the degradation kinetic plots of Ln(Ct/C0) versus t are presented in Fig. 10b. By modeling the plots using the pseudo-first-order kinetic equation Ln(Ct/C0) = −kappt (Ye et al., 2018), the apparent first-order reaction rate constant kapp is obtained as given in Table 1. It is seen that 30 mM—BiOBr has the largest value of kapp (0.14966 min−−1), which is about 1.5 times larger than that for pristine BiOBr (0.0986 min−1).
Effect of treatment time with NaBH4
By fixing the NaBH4 concentration separately at 30 and 110 mM, we also investigated the effect of treatment time on the structure, morphology, optical property and photodegradation performance of NaBH4-treated BiOBr samples. Figure 11a shows the UV–vis diffuse reflectance spectra of 30 mM NaBH4-treated BiOBr samples with different treatment times. It is interesting that with increasing the treatment time, the visible-light absorption of the NaBH4-treated BiOBr samples initially increases and then gradually decreases. The highest visible-light absorption is observed for 0 min MS–1 h SP–BiOBr (i.e., the sample treated by 0 min MS and 1 h SP), whereas 3 h MS–1 h SP–BiOBr (i.e., the sample treated by 3 h MS and 1 h SP) manifests an optical absorption property very similar to that of pristine BiOBr nanoplates. The absorption edge λabs and bandgap energy Eg of the samples are obtained from the first derivative curves of the UV–vis diffuse reflectance spectra, as shown in Fig. 11b and Table 1.
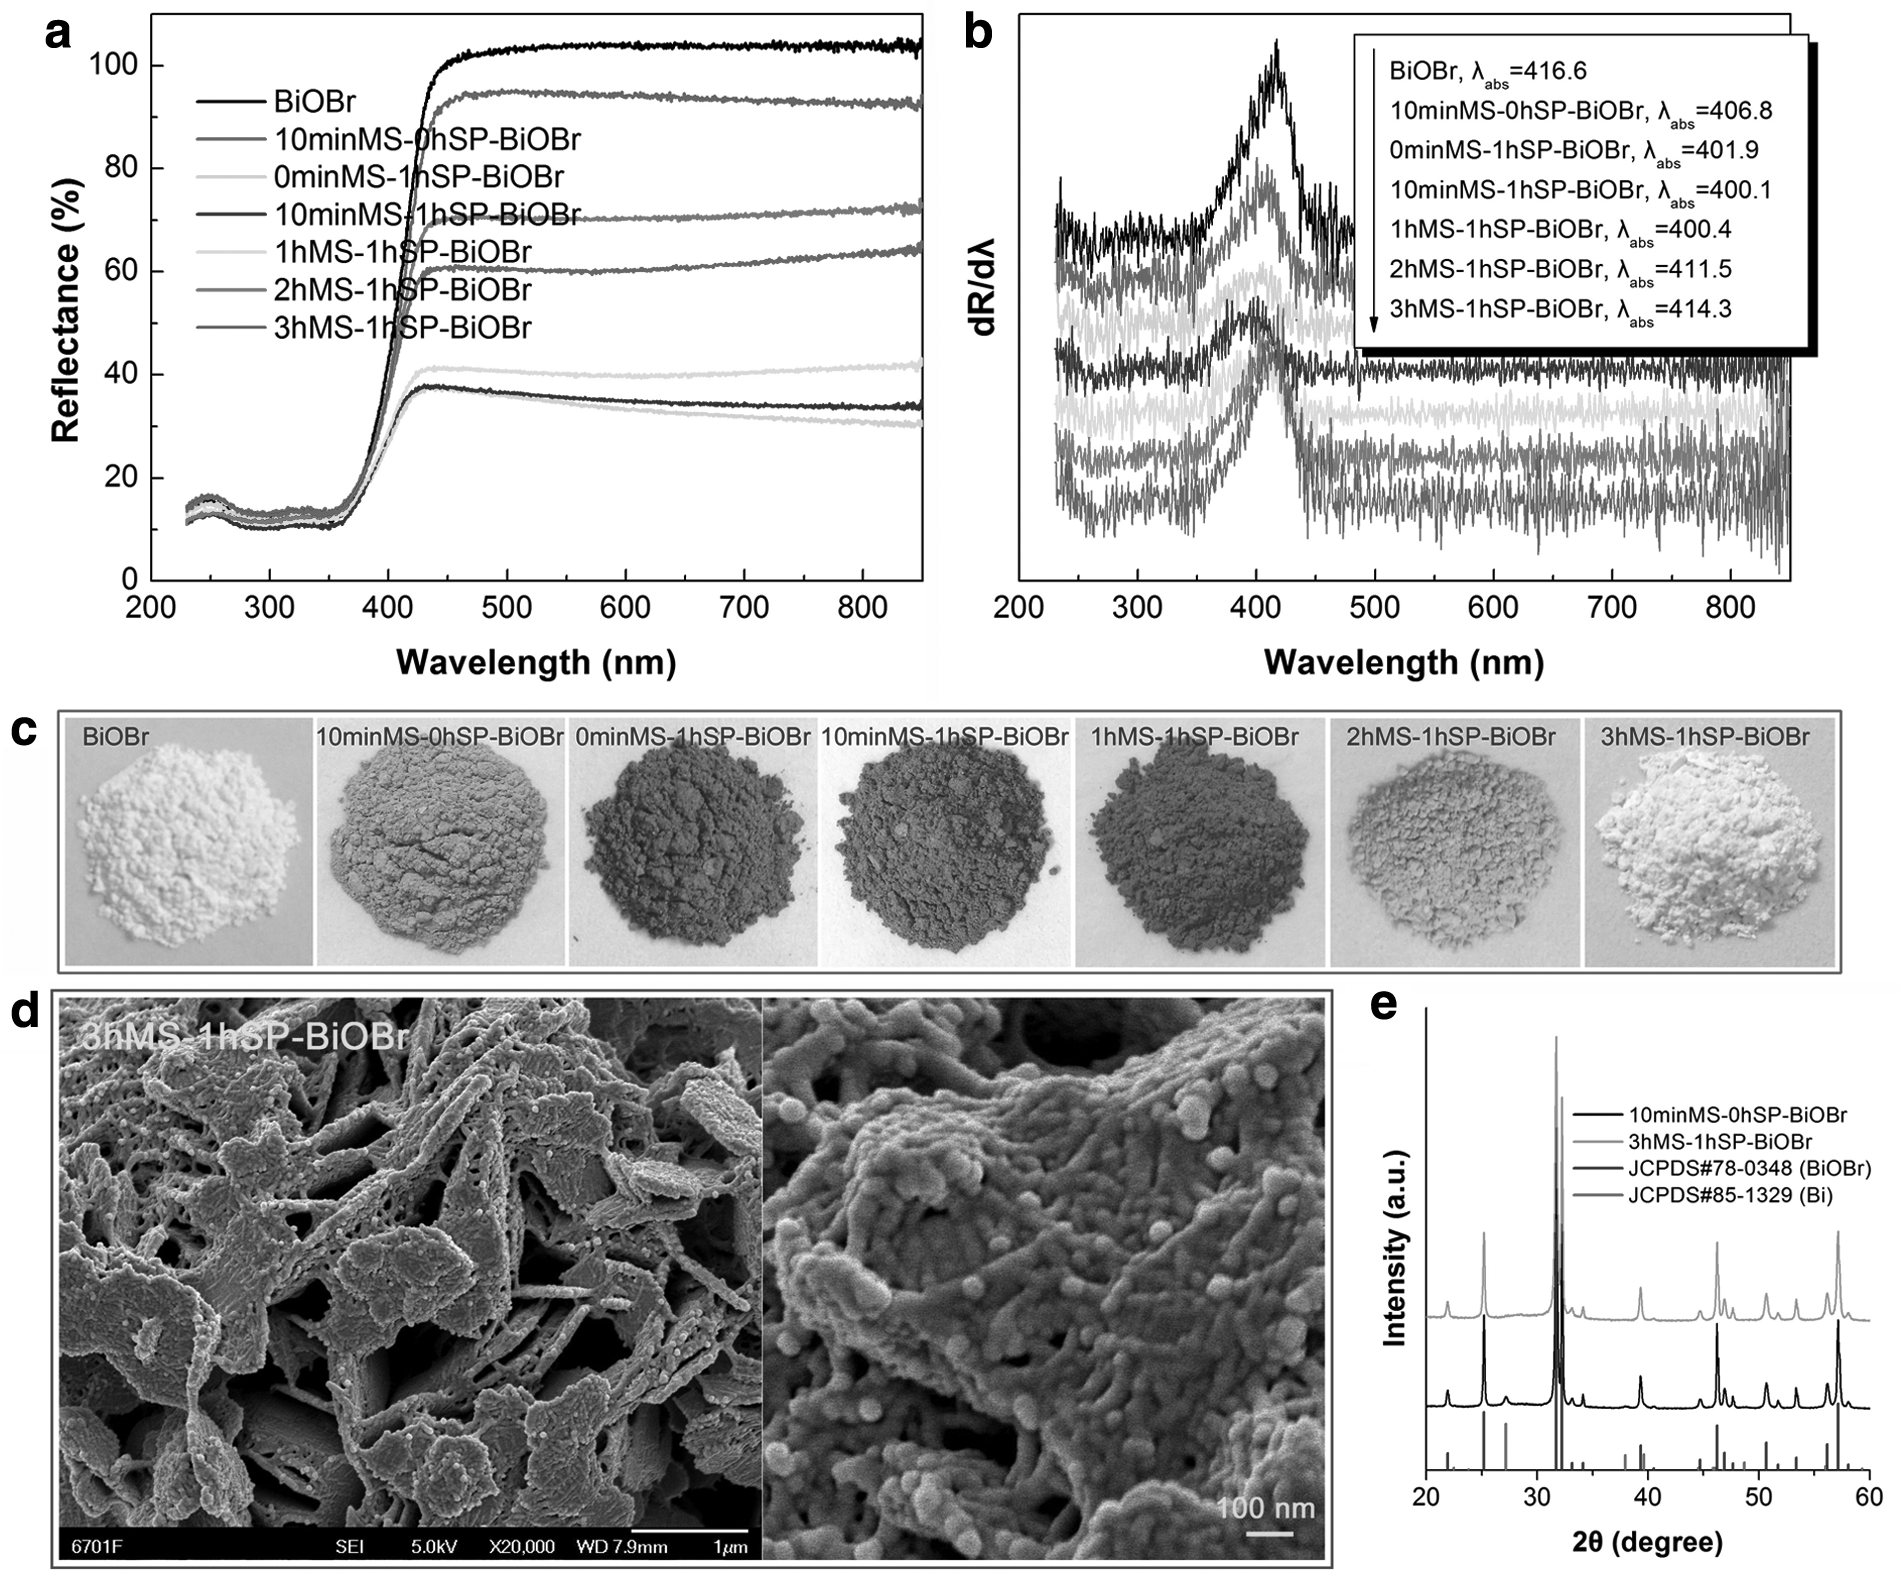
The variation of the optical absorption properties between the samples is further confirmed by their apparent color change, as depicted in Fig. 11c. With increasing the treatment time, the color of the samples becomes deepened from white (pristine BiOBr) to dark gray, and then returns to white (3 h MS–1 h SP–BiOBr). The optical absorption properties suggest that BiOBr crystals are partially reduced to Bi nanowires at initial treatment time; further prolonging the treatment time results in the recrystallization of BiOBr from the Bi nanowires.
This evolution process is confirmed by the XRD analysis, as shown in Fig. 11e. Additional weak diffraction peaks from metallic Bi are observed on the XRD pattern of the NaBH4-treated BiOBr sample at 10 min of MS (10 min MS–0 h SP–BiOBr). When the NaBH4 treatment time is prolonged to 3 h MS and 1 h SP (3 h MS–1 h SP–BiOBr), the Bi diffraction peaks completely disappear, and all the diffraction peaks can be perfectly indexed to the BiOBr phase. However, the morphology of 3 h MS–1 h SP–BiOBr is different from that of pristine BiOBr nanoplates, although they have a similar crystal structure. As seen from the SEM images of 3 h MS–1 h SP–BiOBr in Fig. 11d, the surface of BiOBr nanoplates become extremely rough with the formation of BiOBr nanowires/nanoparticles.
The evolution of Bi nanowires from BiOBr crystals and recrystallization of BiOBr from Bi nanowires can be simply described by the following chemical reactions.
The adsorption and time-dependent photodegradation of RhB over the 30 mM NaBH4-treated BiOBr samples with different treatment times is illustrated in Fig. 12a. Figure 11b displays the kinetic plots of the dye degradation over the samples. The adsorption percentage, DP of RhB (15 min photoreaction), and apparent first-order reaction rate constant derived from Fig. 12a and b are presented in Table 1. It is seen that the NaBH4 treatment time has an important effect on the adsorption and photodegradation performances of the samples. Among the samples, 10 min MS–1 h SP–BiOBr shows the smallest adsorption toward RhB, whereas the largest photodegradation performance is observed for 2 h MS–1 h SP–BiOBr (DP = 95.0%), which is about two times larger than that of pristine BiOBr nanoplates.
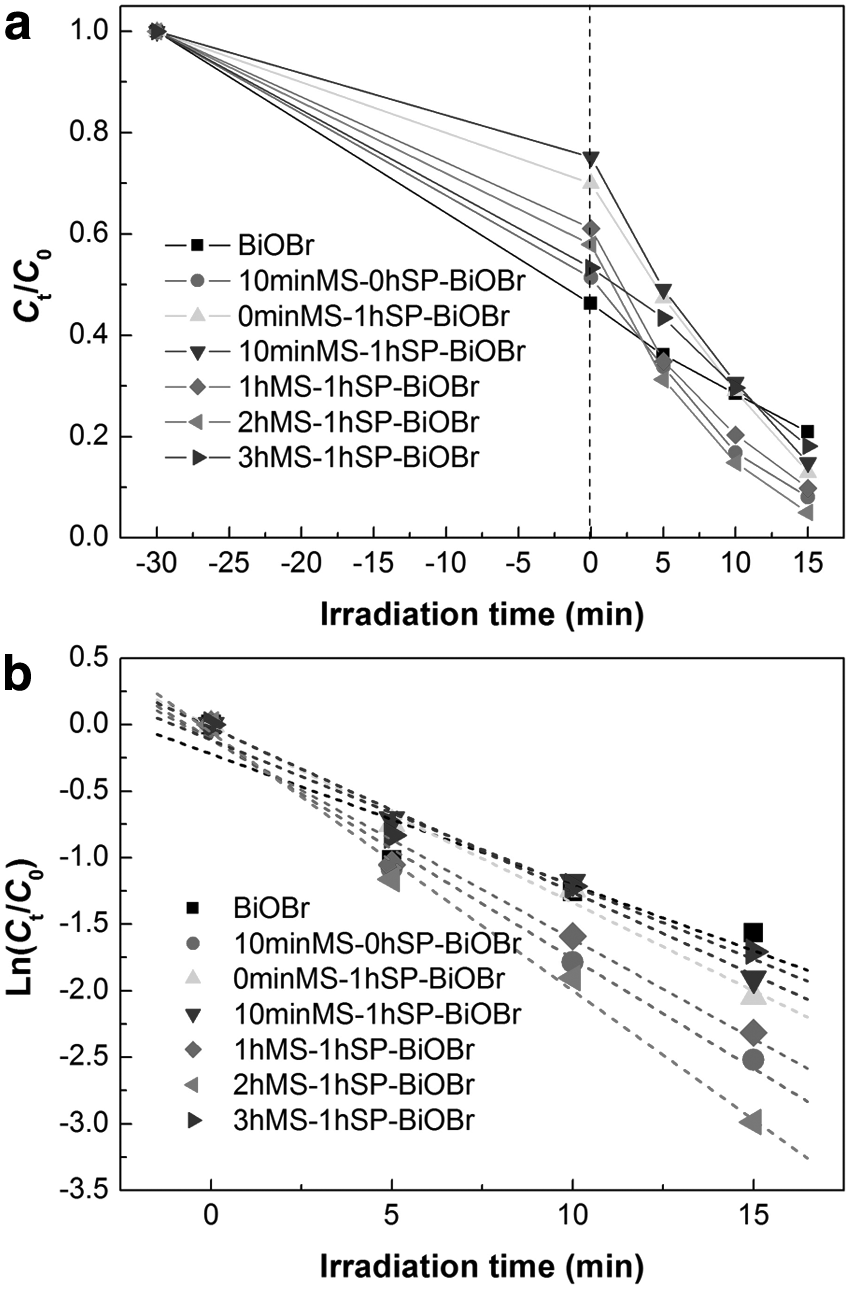
Time-dependent photodegradation curves of RhB
Figure 13a shows the UV–vis diffuse reflectance spectra of 110 mM NaBH4-treated BiOBr samples with different treatment times. It is seen that the samples treated at short times have extremely strong optical absorption in the UV–vis light region. When the treatment time exceeds 5 h (4 h MS +1 h SP), the samples exhibit a gradual decrease in the visible-light absorption. As seen in Fig. 13c, the samples after short time treatment present black color, and then gradually become faint yellow with increasing the treatment time up to 11 h (10 h MS +1 h SP).

The structural evolution of the samples with treatment time was elucidated by XRD investigation, as shown in Fig. 13d. Under the treatment with high-concentration NaBH4 solution (110 mM), BiOBr nanoplates are easily reduced to Bi nanowires with a short time. With prolonging the treatment time, the Bi nanowires begin to gradually transform into monoclinic Bi4O5Br2 crystals along with minor BiOBr crystals through a dissolution–crystallization process. When the treatment time is increased up to 11 h (10 h MS +1 h SP), the obtained 10 h MS–1 h SP–BiOBr sample forms pure Bi4O5Br2 structure. The chemical reaction for the formation of Bi4O5Br2 crystals from Bi nanowires can be simply described by Equation (3).
The SEM images (Fig. 13e) demonstrate that the Bi4O5Br2 sample has a morphology of nanoparticles and nanowires, which are heavily agglomerated. The Bi4O5Br2 nanoparticles/nanowires have a bandgap energy of 2.80 eV (Fig. 13b; Table 1).
Figure 14a illustrates the photodegradation and adsorption performances of the 110 mM NaBH4-treated BiOBr samples with different treatment times toward RhB. It is seen that the sample 1 h MS–1 h SP–BiOBr shows extremely small adsorption and photodegradation toward RhB (Table 1), which is explained due to the fact that BiOBr nanoplates are completely reduced to Bi nanowires. The observed large dye adsorption for 10 h MS–1 h SP–BiOBr could be ascribed to the formation of abundant dangling bonds on the surface of Bi4O5Br2 nanoparticles/nanowires, which are beneficial to the dye adsorption. The largest photodegradation performance is observed for 6 h MS–1 h SP–BiOBr (DP = 90.4%), which could be explained by the creation of BiOBr@Bi@Bi4O5Br2 heterostructures. Figure 14b displays the kinetic plots of the dye degradation over the samples, from which the apparent first-order reaction rate constants are obtained and presented in Table 1. The reaction rate constants suggests that the photodegradation performance of 6 h MS–1 h SP–BiOBr is about 1.6 times larger than that of pristine BiOBr nanoplates.
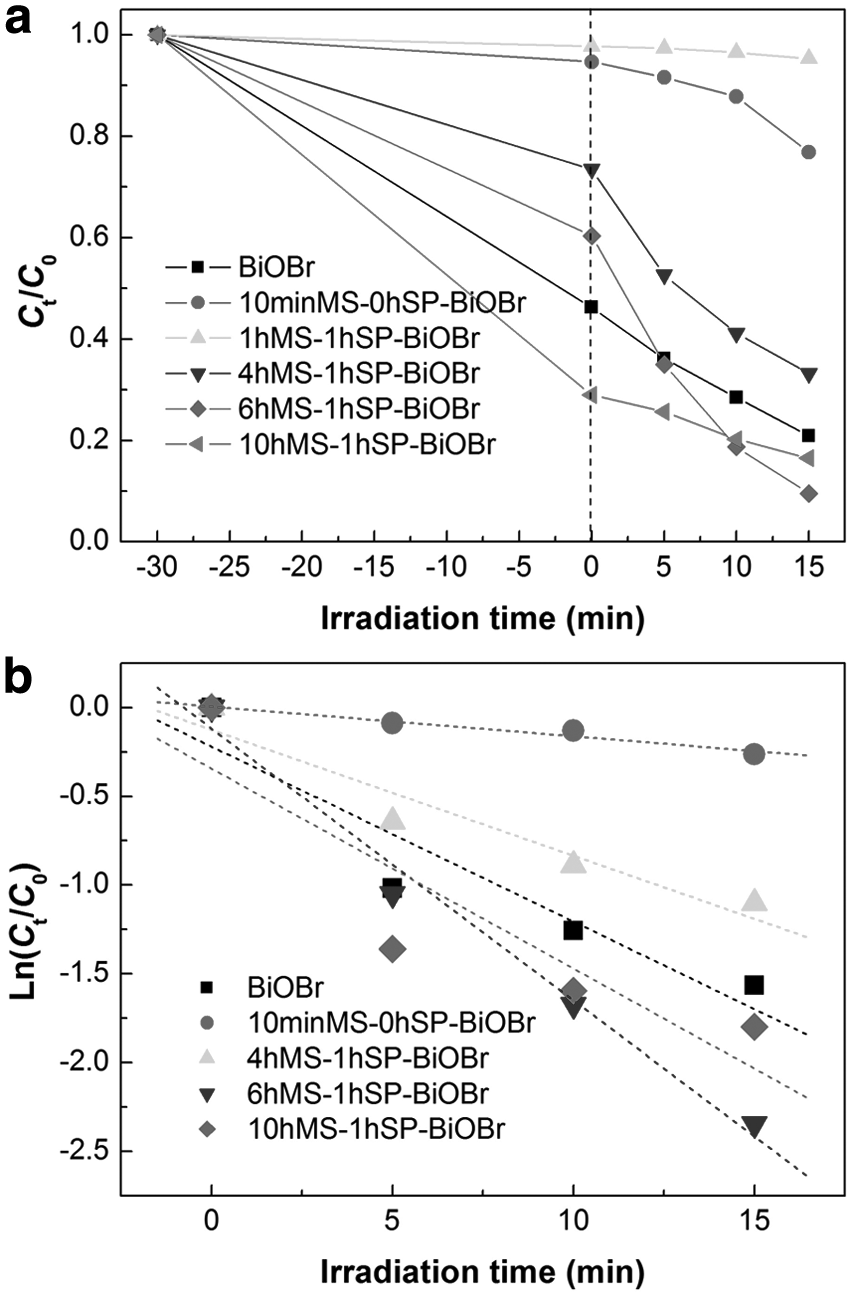
Time-dependent photodegradation curves of RhB
Photocatalytic mechanism of Bi nanowire-decorated BiOBr nanoplates
Based on the electrochemical measurements, the CB and VB potentials of BiOBr nanoplates were determined using the Mott–Schottky method described in the literature (Fattah-Alhosseini, 2016). Figure 15a shows the Mott–Schottky plot of BiOBr measured at 3,000 Hz. By extrapolating the linear portion of the plot to the x-axis, the flat-band potential of BiOBr is obtained as VFB = + 2.27 V versus standard calomel electrode (SCE), correspondingly VFB = + 2.93 V versus normal hydrogen electrode (NHE) according to V(NHE) = V(SCE) +0.059 × pH( = 7) + 0.242 (Wang et al., 2019g). The Mott–Schottky plot suggests a p-type semiconductivity of BiOBr due to its negative slope. Assuming the negligibility between flat-band potential and VB edge potential for a p-type semiconductor, the CB and VB potentials of BiOBr nanoplates (Eg = 2.98 eV) can be obtained as −0.05 and +2.93 V versus NHE, respectively.
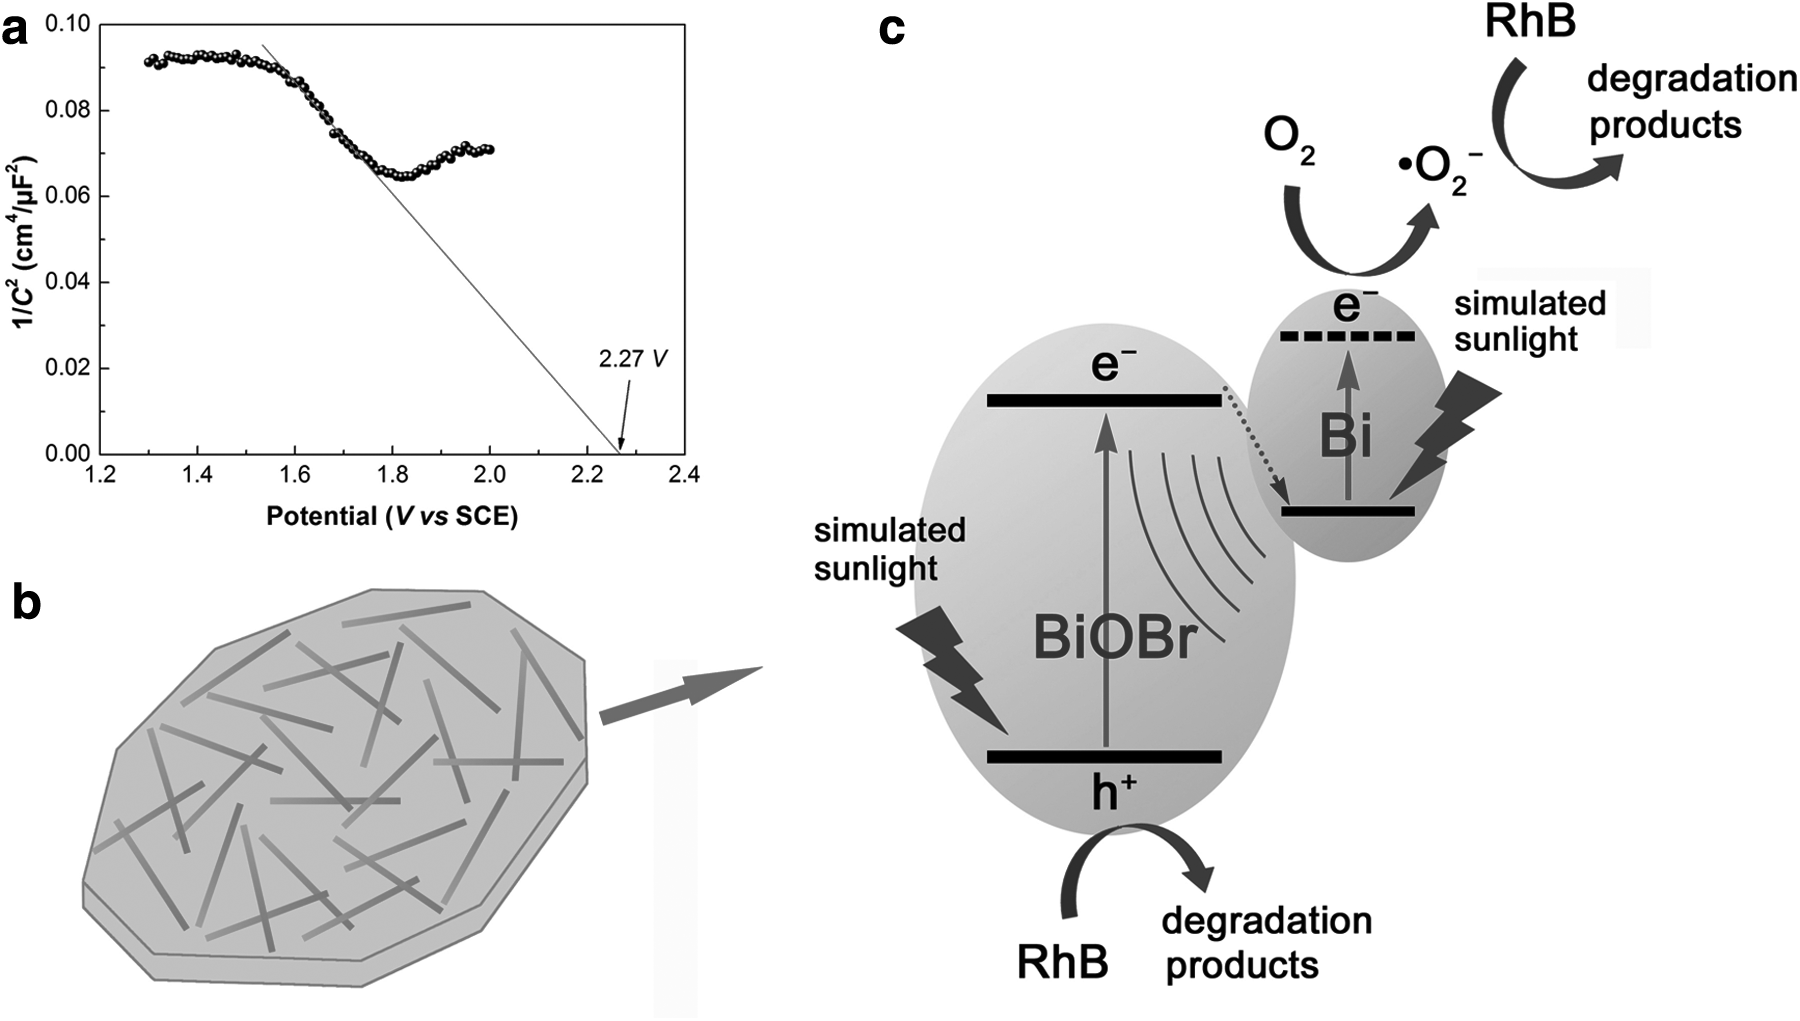
It is noted that when BiOBr nanoplates are treated by NaBH4 solution with an appropriate concentration and a proper treatment time, Bi nanowires are created on the surface of BiOBr nanoplates, as schematically depicted in Fig. 15b. Figure 15c schematically shows the photocatalytic mechanism of the Bi@BiOBr composites toward the degradation of RhB. Under simulated sunlight irradiation, BiOBr nanoplates are excited, leading to the generation of electrons and holes in their CB and VB, respectively. Simultaneously, Bi nanowires could also be excited by LSPR. As the excited metal nanoparticles/nanowires can act as excellent electron sinks (Yan et al., 2019a), the photoexcited electrons will transfer from the CB of BiOBr to Bi nanowires. This electron transfer process can efficiently promote the separation of photoexcited electron/hole pairs in BiOBr nanoplates, which is confirmed by the photoelectrochemical and PL spectroscopy analyses (Figs. 8 and 9). On the other hand, the LSPR-induced electromagnetic field from Bi nanowires can stimulate the generation and separation of electron/hole pairs in BiOBr. Moreover, the LSPR-induced electrons in Bi nanowires could also participate in the photodegradation reactions. All these factors collectively result in the enhanced photodegradation performance of the Bi@BiOBr composites (i.e., NaBH4-treated BiOBr nanoplates) under simulated sunlight irradiation.
Generally, photoexcited h+, hydroxyl (•OH), and superoxide (•O2−) are considered to be the main reactive species causing the dye degradation (Yan et al., 2019c). Thermodynamically, the VB holes in BiOBr can react with OH− or H2O species to produce •OH radicals due to the sufficiently positive VB potential of BiOBr (+2.93 V vs. NHE) compared with E0(H2O/•OH) = +2.38 versus NHE and E0(OH−/•OH) = + 1.99 versus NHE (Drashti and Upendra, 2019). However, the reactive species trapping experiments carried out according to the method described in our previous work (Di et al., 2019b) suggest a negligible role of •OH in the photodegradation process, whereas photoexcited h+ and •O2− are confirmed to be the main reactive species causing the dye degradation (Supplementary Fig. S2). This indicates that the photoexcited holes could directly oxidize the dye, instead react with OH− or H2O to produce •OH. The reaction of adsorbed O2 molecules with the LSPR-induced electrons in Bi nanowires is one of the feasible ways to generate •O2− radicals. Although the CB potential of BiOBr (−0.05 V vs. NHE) is not more negative than E0(O2/•O2−) = −0.13 V versus NHE (Di et al., 2019b), the photoexcited electrons at higher excited states of BiOBr could react with adsorbed O2 to produce •O2− radicals.
Conclusions
Herein, we systematically investigated the evolution of Bi nanowires from BiOBr nanoplates through a NaBH4 reduction method by varying the NaBH4 concentration and reaction time. With increasing the NaBH4 concentration (2 h reaction), BiOBr crystals are gradually reduced to Bi nanowires and this transformation process is completed by increasing the NaBH4 concentration up to 110 mM. At a low-concentration NaBH4 solution (30 mM) and with increasing the reaction time, partial BiOBr crystals are reduced to Bi nanowires first, and then the Bi nanowires are recrystallized into BiOBr nanowires/nanoparticles. At a high-concentration NaBH4 solution (110 mM) and with increasing the reaction time, BiOBr nanoplates are first reduced to Bi nanowires at a short reaction time, and then the Bi nanowires gradually transform into Bi4O5Br2 nanoparticles/nanowires. Photodegradation experiments suggest that the creation of an amount of Bi nanowires on the surface of BiOBr nanoplates can achieve excellent Bi@BiOBr composite photocatalysts, which exhibit enhanced photodegradation toward RhB under simulated sunlight illumination compared with pristine BiOBr nanoplates. The enhanced photocatalytic mechanism can be attributed to the following aspects: (i) The electron transfer from the CB of BiOBr nanoplates to the LSPR-excited Bi nanowires leads to an efficient separation of photoexcited electron/hole pairs in BiOBr, (ii) the LSPR-induced electromagnetic field could facilitate the generation and separation of electron/hole pairs in BiOBr, and (iii) the generated electrons in Bi nanowires by LSPR excitation could take part in the photodegradation reactions.
Footnotes
Author Disclosure Statement
No competing financial interests exist.
Funding Information
This work was supported by the National Natural Science Foundation of China (Grant No. 51662027) and the HongLiu First-Class Disciplines Development Program of Lanzhou University of Technology.
References
Supplementary Material
Please find the following supplemental material available below.
For Open Access articles published under a Creative Commons License, all supplemental material carries the same license as the article it is associated with.
For non-Open Access articles published, all supplemental material carries a non-exclusive license, and permission requests for re-use of supplemental material or any part of supplemental material shall be sent directly to the copyright owner as specified in the copyright notice associated with the article.