
Abstract
Improving energy efficiency in tillage is critical for developing sustainable agriculture and mitigating fuel-related CO2 emissions. However, data on energy efficiency and CO2 emissions across various tillage-sowing practices remain scarce in terms of vetch production. The study aimed at evaluating the impact of four tillage-sowing practices (conventional tillage [CT], Reduced-I and II, and no-tillage [NT]) on the fuel consumption, energy productivity, and fuel-related CO2 releases in Hungarian vetch production. The study was performed in Turkey, in semiarid conditions using two water applications (rainfed and irrigated) under two different crop rotations (rainfed: vetch-wheat-fallow and irrigated: vetch-wheat-sunflower). The study findings revealed that while CT had the highest diesel-fuel consumptions (52.2 L/ha in irrigated and 53.1 L/ha in rainfed), the lowest values were determined in NT (16.4 L/ha in irrigated and 16.6 L/ha in rainfed). Total energy requirements were the highest in CT, and determined 11827.4 MJ/ha (5229.1 MJ/ha direct and 10502.5 MJ/ha nonrenewable) in irrigated rotation and 9328.5 MJ/ha (3013.6 MJ/ha direct and 8004.6 MJ/ha nonrenewable) in rainfed conditions. Moreover, CT provided the lowest energy ratio (4.41 in irrigated and 3.87 in rainfed). NT practice required significantly lower total (20.6% in irrigated and 27.8% in rainfed), direct (52.5% in irrigated and 68.8% in rainfed), and nonrenewable energies (23.1% in irrigated and 32.3% in rainfed) and provided higher energy ratio (24.0% in irrigated and 53.2% in rainfed) compared to CT. Irrigation increased energy gain by 48.2% on average. Conservation tillage logarithmically reduced CO2 emissions in both rotations. NT and reduced tillage practices generated 68.7% and 42.2% lower emissions on average compared to CT (151.1 kg CO2/ha), respectively. It was concluded that NT can be a suitable practice to achieve higher energy efficiency and lower CO2 emissions in vetch production. However, reduced tillage can be favorable due to the limited application of NT in most countries.
Introduction
Proper economic and environmental approaches to meet food security goals in the agriculture sector are vital in formulating global environmental policies. Therefore, energy consumption and energy-related greenhouse gas (GHG) emissions from agricultural practices are an important concern for policymakers (Li et al., 2016).
Emissions through agricultural treatments comprise a considerable portion of total GHG emissions (Jaiswal and Agrawal, 2019). The share of the agricultural sector of total GHG emissions is 22% (Platis et al., 2019). The use of fossil fuel in agricultural power machineries and irrigation pumps contributes to carbon emissions (Houshyar, 2017). CO2 is also emitted at high levels from the degradation of agricultural and other lands by human-induced activities directly [Environmental Protection Agency (EPA), 2019]. The amount of global GHG emissions reported in 2017 was 50.9 Gt, which is about 55% higher than in 1990 and 40% higher than in 2000 (Oliver and Peters, 2018). Anthropogenic emissions accounted for probably 55% of total global emissions in 2016 (Xi-Liu and Qing-Xian, 2018).
The adequacy of measures that could be considered to reduce GHG emissions by way of soil management is still uncertain (Abdalla et al., 2016). Global impact of management practices such as tillage and crop rotation on cropland soils needs further evaluation under different soil and climatic conditions (Sainju, 2016). Tillage is both an energy intensive practice and affects soil organic carbon stocks and GHG emissions due to organic matter decomposition (Abdalla et al., 2016). High-level consumption of fossil-based energy during the tillage process emits high amounts of CO2 into the atmosphere from the burning fuel. Lu and Lu (2017) confirmed that diesel fuel use was the major consumer of energy and producer of GHG emissions in various tillage practices.
Conservation tillage practices encompass zero tillage or no-till, reduced or minimum tillage, mulch tillage, ridge tillage, and contour tillage practices, and the most common ones are zero tillage (no-till) and reduced or minimum tillage (Busari et al., 2015). Conservation tillage and no-tillage (NT) practices have various advantages such as low carbon emission, save time and fuel, require less labor, and higher agricultural productivity (Karayel and Šarauskis, 2019).
Reducing tillage processes mitigates GHG emissions both through decreased use of fossil fuels in field preparation and increases soil organic matter content and sequestration of carbon (Mangalassery et al., 2014). In a study that analyzed the numerous researches conducted in different soil and environmental conditions worldwide to evaluate tillage impact on soil CO2 emissions, it is shown that NT practice is an effective mitigation measure of CO2 emissions from dry land soils. It is also concluded that tillage practices result in 21% greater CO2 emissions than NT practice (Abdalla et al., 2016).
Conventional tillage (CT) requires high amounts of diesel fuel due when increasing the working depth from 0.25 to 0.30 m (López-Vázquez et al., 2019). Lekavičienė et al. (2019) also confirmed significantly increased diesel fuel consumption and tractor's CO2 emission with increasing penetration depth. Similarly, Sayed et al. (2019) determined minimum amounts of fuel consumption and considerably lower CO2 emission in NT and minimum tillage practices compared to CT.
Previous study results showed that sustainable crop production with less GHG emissions can be obtained through efficient energy use (Houshyar, 2017). Energy efficiency can be improved with reduced energy input and/or increased output energy. Therefore, more acceptable energy efficiency can be realized with either increased or decreased energy inputs or outputs depending on the input-output energy relationship under different tillage practices. Barut et al. (2011), Kumar et al. (2013), and Hamzei and Seyyedi (2016) have previously reported that higher energy use efficiency was achieved under minimized or NT conditions compared to CT practice.
Huynh et al. (2019) reported that soil productivity and thus crop yield are strongly influenced with changes in the cropping system, soil tillage, and irrigation. Therefore, a suitable cropping system can provide additional contributions to increase productivity and profitability of crops and to provide agronomic sustainability. Decreasing cereal monoculture by adding legumes in rotation systems has long been proven to have productivity and environmental benefits in many parts of the world (Dalias, 2012). Inserting legumes into crop rotations helps reduce the use of fertilizers and energy (Stagnari et al., 2017). Wheat-fallow crop rotation is applied mostly in dry regions with low annual precipitation (<450 mm) (Kumlay et al., 2007). This study was conducted in the Eastern Anatolia Region in Turkey. Approximately 26.2% and 21% of the country's small and large ruminant animals, respectively, are raised in this region [Eastern Anatolia Project (DAP), 2014].
Vetch has also been added as a crop to the wheat-fallow rotation in this region with a low amount of annual precipitation (≈425 mm) to grow animal feed (Olgun et al., 2007). Vetch uses the soil water economically. Dalias (2012) expressed that vetch creates better water economy because it does not consume soil moisture at the same extent as cereal crops and leaves residual soil moisture for the following crop in the rotation.
Nowadays, tillage is being increasingly abandoned as the use of direct sowing machines becomes more widespread and weed control is carried out with herbicides (Abdalla et al., 2016). Conservation tillage practices are being increasingly advocated worldwide for sustainable agriculture due to minimum fuel consumption based on shallow tillage or NT and decreased tillage equipment usage and time, and less CO2 releases from minimized fuel consumption. However, empirical knowledge regarding energy consumption and CO2 emissions of tillage-sowing practices in vetch production in both rainfed and irrigated rotations in regions with semiarid climates is limited. Therefore, by studying rainfed and irrigated crop rotations that continued for 9 years, we endeavored to (1) investigate how much CO2 was emitted from fuel consumption with conventional and conservation tillage-sowing practices during Hungarian vetch production for 3 years and (2) evaluate the effects of different tillage-sowing practices on vetch energy use by many energy evaluation parameters (e.g., the energy ratio, intensity and gain, and the requirements of direct, indirect, renewable, and nonrenewable energies).
Materials and Methods
Experiment area
The field studies were conducted at the Soil-Water Resources Research Station of East Anatolia Agricultural Research Institute in Pasinler District in Erzurum province, Turkey (39.989° N, 41.575° E, 1,720 m a.s.l). The soil type in the study region is Inseptisol according to the USDA soil classification system (Özgül, 2003). The texture class of the surface soil layer at 0–30 cm in the experimental field was sandy clay loam (47.9% sand, 25.5% silt, and 26.6% clay). Electrical conductivity, pH, CaCO3, and organic matter contents in the surface soil layer before the experiment were also determined as 1.495 dS/m, 7.17, 0.35%, and 1.73%, respectively.
The annual total precipitation and mean temperature in the experimental region were 423.5 mm and 6.1°C in long-term period averages (2000–2016), respectively [Eastern Anatolia Agricultural Research Institute (DATAE), 2016]. Monthly precipitation and air temperature values during vetch growing periods are shown in Fig. 1. First year precipitation values in vetch growing periods were less than the long-year average precipitation values, while other 2-year values were close. In the region with a semiarid climate, summers are short, warm-cool, and dry, while winters are long, cold, and snowy. Therefore, the climate type is described as Dsb (D: continental climate, s: dry summer, and b: warm summer) according to the Koppen-Griger classification (Öztürk et al., 2017b).
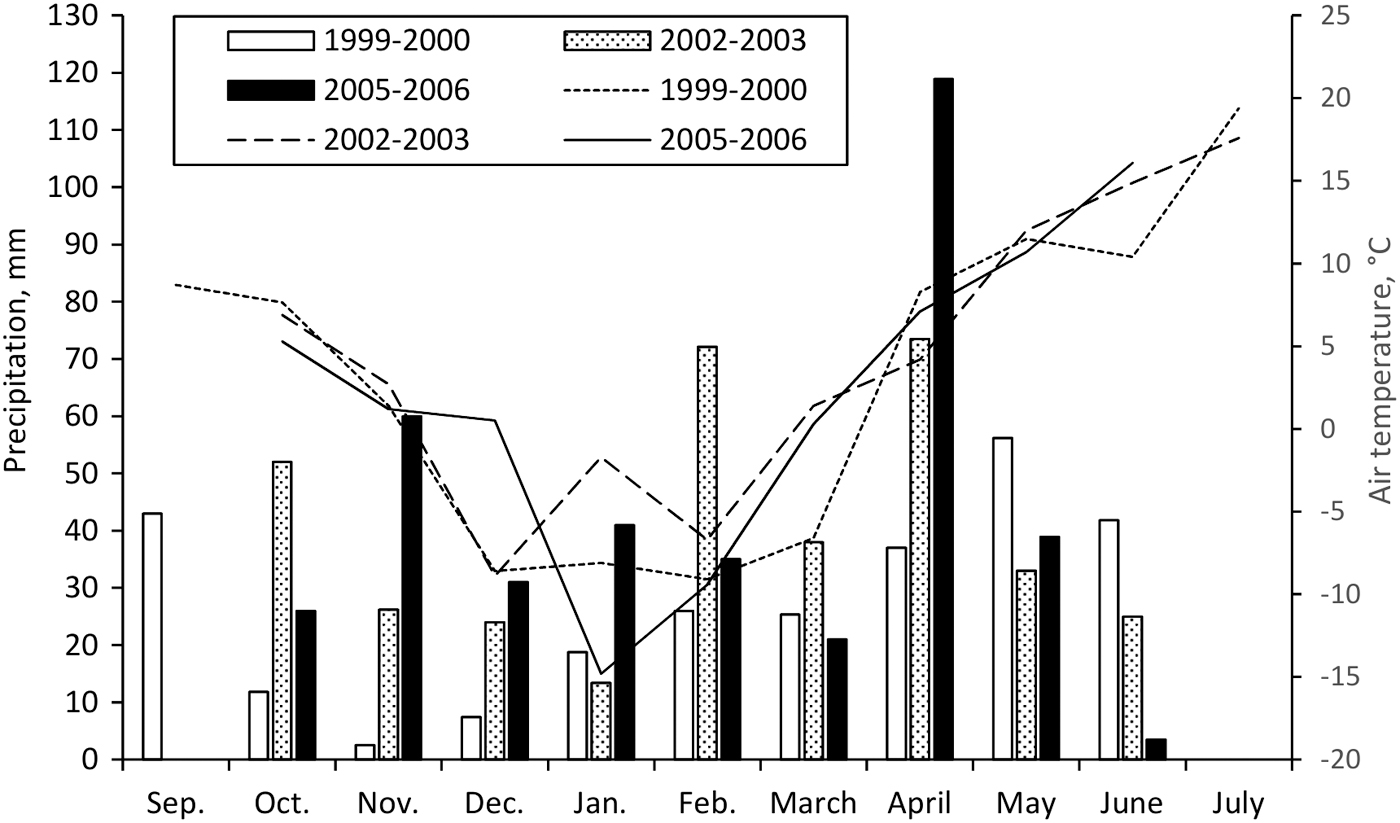
Monthly precipitation and air temperature values during vetch growing periods.
Experimental design and agricultural operations
The experimental design was a randomized complete block design with three replications. Hungarian vetch production was carried out in 1999, 2002, and 2005 in two crop rotations (rainfed and irrigated), each was planned for a period of 9 years (1999–2008). While vetch-winter wheat-fallow cycle was applied in the rainfed crop rotation, vetch-winter wheat-sunflower cycle was considered in the irrigated crop rotation. Each experimental plot was 15 × 40 m in size and a total of 12 plots for each crop rotation were arranged in the experimental field. The plots under both crop rotations have been treated with four different tillage-sowing practices as CT, reduced tillage-I (RT1), reduced tillage-II (RT2), and NT. The equipment and their technical properties used in different tillage-sowing practices during the vetch production periods are given in Table 1. The effective working depths and widths of all the equipment used were determined with three repeated measurements for each plot in the study. Agricultural equipment was towed with a tractor of 50 kW with a weight of 3,396 kg and economic life of 12,000 h.
Equipments Used in Different Tillage-Sowing Practices in Vetch Production Processes and Their Technical Properties
C, cultivator; CH, combined harrows; CT, conventional tillage; DH, disc harrow; DS, disc seeder; FM, fingerbar mower; MP, moldboard plough; NS, no-till seeder; NT, no-tillage; P, pulverizator; RH, rotary power harrow; RT1, reduced tillage-I; RT2, reduced tillage-II.
The Hungarian vetch (Vicia pannonica Crantz.) population line seeds were sown at a rate of 130 kg/ha on September 8, 1999, October 2, 2002, and October 13, 2005. Harvests were made on July 11, 2000 and 2003, and June 29, 2006. The 500 g samples taken from green forages harvested in trial plots were air dried in outdoor conditions, subsequently oven dried at 78°C for 24 h, and weighed. Dry forage yield as kg/ha was calculated with dry weight percentage (Taş, 2010). Average vetch dry forage yields for 3 years under irrigated rotation conditions were realized as 5801.57, 6069.08, 6078.81, and 5710.95 kg/ha in the CT, RT1, RT2, and NT practices, respectively. These values under rainfed rotation conditions were determined as 4010.44, 3906.13, 3938.21, and 4435.15 kg/ha with the same order. The plots were fertilized with diammonium phosphate (46–48% P2O5 and 16–18% N) and urea (46% N) fertilizers with consideration to the dosage calculated according to the soil analysis results before planting during all vetch production years (Table 2). No chemicals were used to combat weeds in the CT practice due to deep plowing with a moldboard plough, while herbicide at the rate of 0.4 kg/ha using a pulverizator was applied in the other tillage-sowing practices.
The Fertilizer Quantities (kg/ha) Applied to Different Tillage-Sowing Practices Under Two Crop Rotations in Vetch Production Years
The quantity of irrigation water applied in different tillage-sowing practices as a 3-year average (mean ± standard error of mean) in vetch production under irrigated crop rotation conditions was 1088.7 ± 8.9, 1045.8 ± 32.6, 863.1 ± 32.8, and 744 ± 14.4 m3/ha for CT, RT1, RT2, and NT practices, respectively. Irrigation quantities were determined considering soil moisture contents measured gravimetrically. Irrigation was done by surface (ponding) irrigation method using groundwater (pH: 7.45, electrical conductivity: 0.225 dS/m and sodium adsorption ratio: 0.64) that was provided by an electrical motor-submersible pump system.
Determination of operational values, input and output energies, energy efficiency, and CO2 emission
Task times of agricultural equipments used throughout vetch production periods were determined with a chronometer with 1/100 Cmin precision. The effective field capacity (EFC) values of tractors and agricultural equipment needed for determination of the machine energy requirements were calculated with the ratio of the treated area and the actual task time (Hanna, 2016). Real fuel consumptions were measured at a precision of 0.01 mL with specially designed electronic fuel units located between the fuel tank and pistons, as well as the pump and fuel tank. The data were transferred into a storage unit, and evaluated by using a software (ZET) developed by Özden (1995). The human labor requirements were also determined for each agricultural process under operational conditions. Table 3 shows diesel fuel consumption, the EFC, and human labor values of all used agricultural equipment as 3-year averages.
The Operational Values as 3-Year Average of Equipments Used in Vetch Production Processes Under Irrigated and Rainfed Crop Rotation Conditions
EFC, effective field capacity.
The total input energy requirement in different tillage-sowing practices was calculated as the sum of the requirements of machinery, diesel fuel oil, human labor, fertilizers, seed, irrigation, and chemical energy. The machinery energy need for the manufacturing of tractors and agricultural equipment was calculated using the equation below (Barut et al., 2011; Karaağaç et al., 2014).
where W is the weight of a tractor or agricultural equipment (kg), E is the energy equivalent of the manufacturing of the tractor or agricultural equipments (MJ/kg), T is the economic life (h), and EFC is the effective field capacity (ha/h). Energy amounts spent for other inputs (diesel fuel oil, human labor, fertilizers, seed, irrigation, and chemical) were calculated by multiplying the input amounts with the energy equivalents given in Table 4. Hungarian vetch total forage yield was multiplied by the value of energy equivalent in Table 3 to determine the output energy amount.
Energy Equivalents (MJ/Unit) of Inputs and Output in Vetch Production
The energy amounts calculated for the inputs were categorized as direct, indirect, renewable, and nonrenewable energy. The indirect energy was determined with the sum of machinery, fertilizer, seed, and chemical energies, and direct energy was determined by the sum of human labor, diesel fuel oil, and irrigation energies. Moreover, while the sum of human labor and seed energies was considered renewable energy, the others were evaluated as nonrenewable energy (Lorzadeh et al., 2012).
Energy efficiency was evaluated in terms of energy ratio, energy intensity (also called specific energy), and energy gain (also known as net energy produced or net energy output) (Rathke et al., 2007; Banaeian and Zangeneh, 2011; Barut et al., 2011; Moreno et al., 2011).
The energy ratio (no unit) was determined by dividing the energy output by the energy input. Energy intensity (MJ/kg) represents total energy input per unit vetch forage yield equivalent. Energy gain (MJ/ha) is the difference between total output and total input energies (Rathke et al., 2007).
CO2 emission was calculated with diesel fuel and lubricant oil consumptions by using the following equations (Öztürk et al., 2017a; Gungor et al., 2018; Küsek, 2018).
Diesel-based CO2 emission (kg CO2/ha) = Diesel fuel used (L/ha) × Heating value (0.0371 GJ/L) × Emission factor (74.01 kg CO2/GJ)
Lubricant oil-based CO2 emissions = Oil used (L/ha) × Heating value (0.0382 GJ/L) × Emission factor (73.28 kg CO2/GJ)
Similarly, Filipovic et al. (2006) and Khaledian et al. (2014) reported that the combustion of one liter of diesel fuel resulted in an emission of 2.75 kg CO2 (0.0371 × 74.01). Lubricant oil consumption was considered 4.5% of diesel fuel consumption (Gözübüyük et al., 2015).
Yield-scaled CO2 emissions named as specific CO2 emission (g CO2/kgyield) used to analyze the relationship between CO2 emissions and crop production were calculated with the ratio of total CO2 emissions (g CO2/ha) and vetch forage yield (kgyield/ha) (Gungor et al., 2018; Küsek, 2018).
Statistical analysis
The effects of different tillage-sowing practices on input and output energies, energy use efficiency, and CO2 emissions were evaluated by variance (analysis of variance) analysis using JMP statistical software. Significant means were compared at the level of 0.05 with the LSD multiple comparison test.
Results and Discussion
Operational values
Average 3-year diesel fuel, human labor, and EFC values of the agricultural equipment used in four different tillage-sowing practices for Hungarian vetch production under irrigated and rainfed crop rotations are shown in Table 3. In both crop rotations, diesel fuel consumptions were the highest in CT (52.2 L/ha in irrigated rotation and 53.1 L/ha in rainfed rotation) and the lowest in NT practice (16.4 L/ha in irrigated rotation and 16.6 L/ha in rainfed rotation). This was manifested as 3.2-fold difference between fuel consumptions in CT and NT. While RT1 and RT2 practices consumed 30.2 and 30.8 L/ha fuel in irrigated rotation, respectively, the consumptions were 29.6 and 31.2 L/ha in rainfed rotation. These values also showed that the difference between the CT and RT practices was 1.7–1.8 times lower in favor of RT practices. The significant differences in fuel oil consumption under conventional and NT conditions have also been manifested by many researchers. According to an investigation by Sarauskis et al. (2012), the fuel consumption in CT-sowing systems was more than five times higher compared to zero tillage. Akbarnia and Farhani (2014) determined approximately four times higher fuel consumptions under CT practice in a wheat farm than with NT. Similarly, Filipović et al. (2004) reported that compared to the CT system, the NT system consumed 82.7% less fuel in a maize-winter wheat rotation. From the results of previous studies, it is seen that the no-till practice resulted in fuel savings close to or a bit higher than our findings. It is clear from our data that the moldboard plough equipment used in the CT practice consumed more fuel (25.5 L/ha in irrigated rotation and 23.9 L/ha in rainfed rotation) due to deep tillage compared to the other tillage equipments (Tables 1 and 3). As compatible with research findings mentioned above, Moitzi et al. (2014) determined linear increases in fuel consumption with increasing working depth of the moldboard plough used in the CT system. Namdari et al. (2011) indicated an increase in fuel consumption in deep plowing. Šarauskis et al. (2017) also measured increases ranging from 10.3% to 24.3% in hourly fuel consumption in increased soil depths up to 20 cm depending on the machine working speed.
The human labor need was the highest in moldboard plough application with the lowest EFC values in both crop rotations (Table 3). Therefore, the CT practice with the moldboard plough had the highest human labor or the lowest EFC values compared to other tillage-sowing practices. These study findings regarding savings incurred from machine working time in vetch production were very valuable because, while the area amounts tilled and planted per hour was 0.132 and 0.133 ha in the conventional practice, respectively, in irrigated and rainfed rotations, the NT practice manifested a value that was more than 4.5 times higher. The NT practice also provided approximately two times lower working time compared to reduced tillage practices in both rotations. Parallel to our findings, Sarauskis et al. (2012) and Moitzi et al. (2013) declared the greatest working time need in CT practice due to deep ploughing. Sessiz et al. (2008) presented better values because the NT practice decreased both fuel consumption and working time, and the values were five to six times lower than those of CT with ploughing.
In addition, our findings showed that fuel consumptions in deep plowing were lower in the rainfed conditions than in the irrigated (Table 3). Since vetch year follows fallow year, fuel consumption might decrease as a result of extra moisture accumulation in the soil during tillage in rainfed conditions. In line with this result, Nkakini and Vurasi (2015) indicated that energy spent during tillage operations decreases with the increase in soil moisture content.
Input and output energies and energy use efficiencies
The quantities of energy consumed in vetch production in CT, RT1, RT2, and NT practices showed that soil tillage-sowing practices significantly affected all energy inputs, except seed energy in both crop rotations (Table 5). The greatest total energy input was determined in the CT practice as 11827.45 MJ/ha under irrigated crop rotation, indicating a value 1.27 times higher compared to rainfed crop rotation. Total input energies in the irrigated rotation relative to the values in rainfed rotation were 1.44 times higher in RT1, 1.30 times higher in RT2, and 1.40 times higher in NT. This could be explained with less fertilization and no irrigation under the rainfed rotation conditions (Table 5).
The Input and Output Energy Amounts (MJ/ha) for the Vetch Produced Under Four Different Tillage-Sowing Practices in Two Crop Rotations
The values marked with different superscript letters in each row are statistically different (p < 0.05).
Irrigation labor included.
The NT practice with the lowest energy consumption reduced the input energies by 20.6% (irrigated) and 27.8% (rainfed) compared to the CT because no soil tillage equipment was used and less energy was necessary for irrigation. Input energy saved in the NT practice of this study was low because Sørensen and Nielsen (2005) simulated that, compared to CT, the input energy of reduced tillage and NT can be 18–53% and 75–83% lower, respectively. Contrary to these study results, Šarauskis et al. (2014) determined a lower total energy input in maize cultivation. They obtained 10.5% less energy input value in NT compared to the conventional deep-ploughing tillage. Yousefi et al. (2019) also found a lower value of 10.7% in NT under wheat cultivation conditions.
The lowest consumption in all practices was obtained for human labor, except in the CT practice without the application of chemicals. A large proportion of input energy use was attributed to fertilizer. Considering irrigated crop rotation, the ratio of fertilizer energy to total energy consumed in vetch production was 39.3% in CT, 45.4% in RT1, 48.1% in RT2, and 54.4% in NT. This was followed by fuel oil and irrigation energies in the CT practice, irrigation and fuel oil energies in the RT1 and RT2 practices, and irrigation and seed energies in the NT practice (Fig. 2). Parallel results were also observed under rainfed crop rotation. While the fertilizer energy among inputs had the highest ratio (47% in CT, 52.5% in RT1, 55.3% in RT2, and 59.5 in NT) in all practices, fuel oil energy ranked as the second highest ratio (32% in CT, 23% in RT1, and 22.1% in RT2), except for the NT practice.
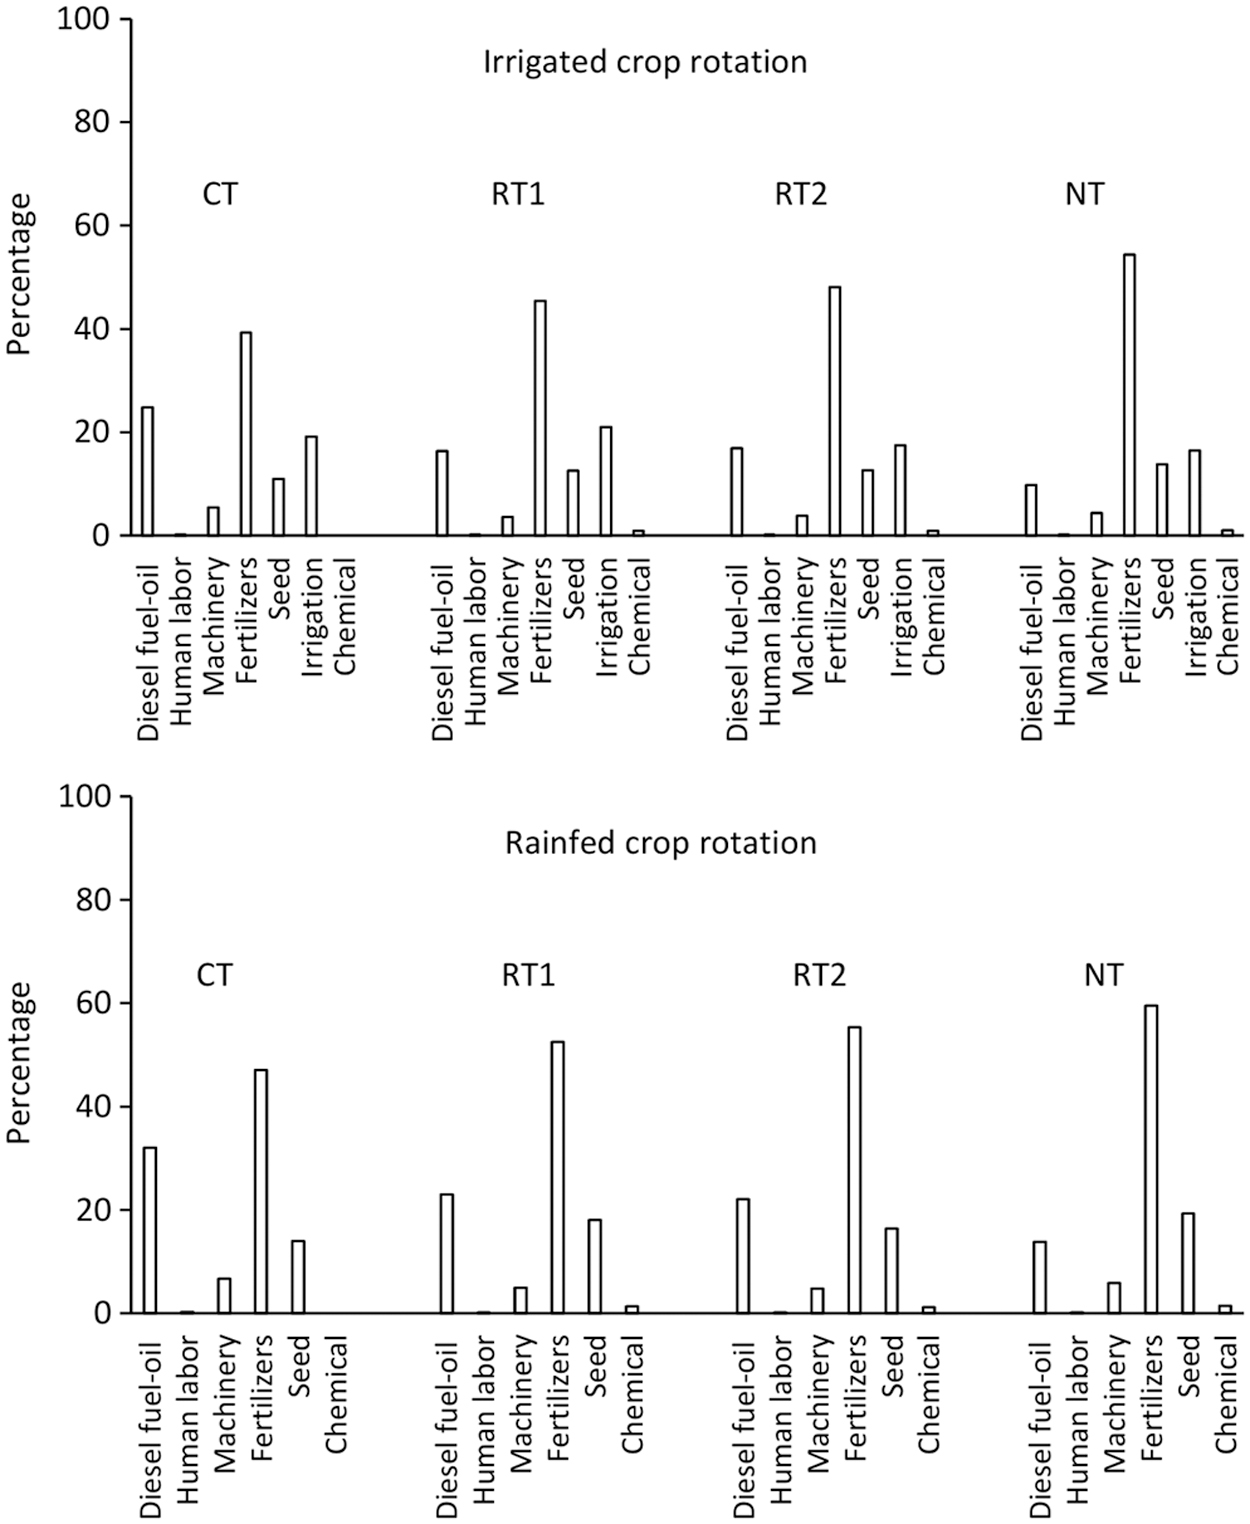
The percentage distribution of the energy consumed for vetch production in four different tillage-sowing practices under two crop rotations. CT, conventional tillage; NT, no-tillage; RT1, reduced tillage-I; RT2, reduced tillage-II.
The fertilizer energy was followed by seed energy (19.3%) in the NT practice (Fig. 2). The reason for chemical fertilizer energy being so high was due to the full application of chemical fertilizers to achieve maximum yields in the soils with poor fertility. Therefore, higher yields (output energies) could be obtained under irrigated rotation through the supporting effect of additional fertilizer relative to rainfed rotation (Table 5). Some previous studies revealed that fertilizer energy in crop production was the most dominant input compared to the others. The results of energy analysis of winter vetch (Vicia sativa L.) produced in dry conditions in Thrace region of Turkey displayed that the chemical fertilizer energy (52.8%) was the highest followed by diesel fuel energy (25.6%) (Baran, 2017). Chemical fertilizer energy had the highest portion (56%) of total energy inputs in maize production (Abdi et al., 2012).
While the fertilizer energy in the NT practice under the irrigated rotation was the highest, it was statistically lower in the rainfed rotation compared to the CT practice (Table 5). Higher fertilizer consumption in the irrigated rotation compared to rainfed rotation could be the result of higher soil water content that influences uptake of elements required in the irrigated plants (Xue et al., 2017). The NT practice in the rainfed rotation reduced the fertilizer need because the conservation tillage (minimum tillage, direct drilling, zero tillage, and so on) improves soil fertility due to increased soil organic matter from crop residue (Sharif et al., 2018).
The NT practice significantly decreased the requirements for direct (fuel oil+human labor+irrigation) and nonrenewable energies (fuel oil+machinery+fertilizers+irrigation+chemical) compared to reduced and CT practices (Fig. 3). Direct energy in the NT practice was reduced at a rate of 52.5% (irrigated) and 68.8% (rainfed) compared to the CT practice, which had the highest value. The nonrenewable energy in the NT practice was also 23.1% (irrigated) and 32.3% (rainfed) less compared to the CT practice. It could be argued that the reduction of fuel oil consumption using less tillage equipment reduced the direct and nonrenewable energies in conservation tillage conditions compared to CT.
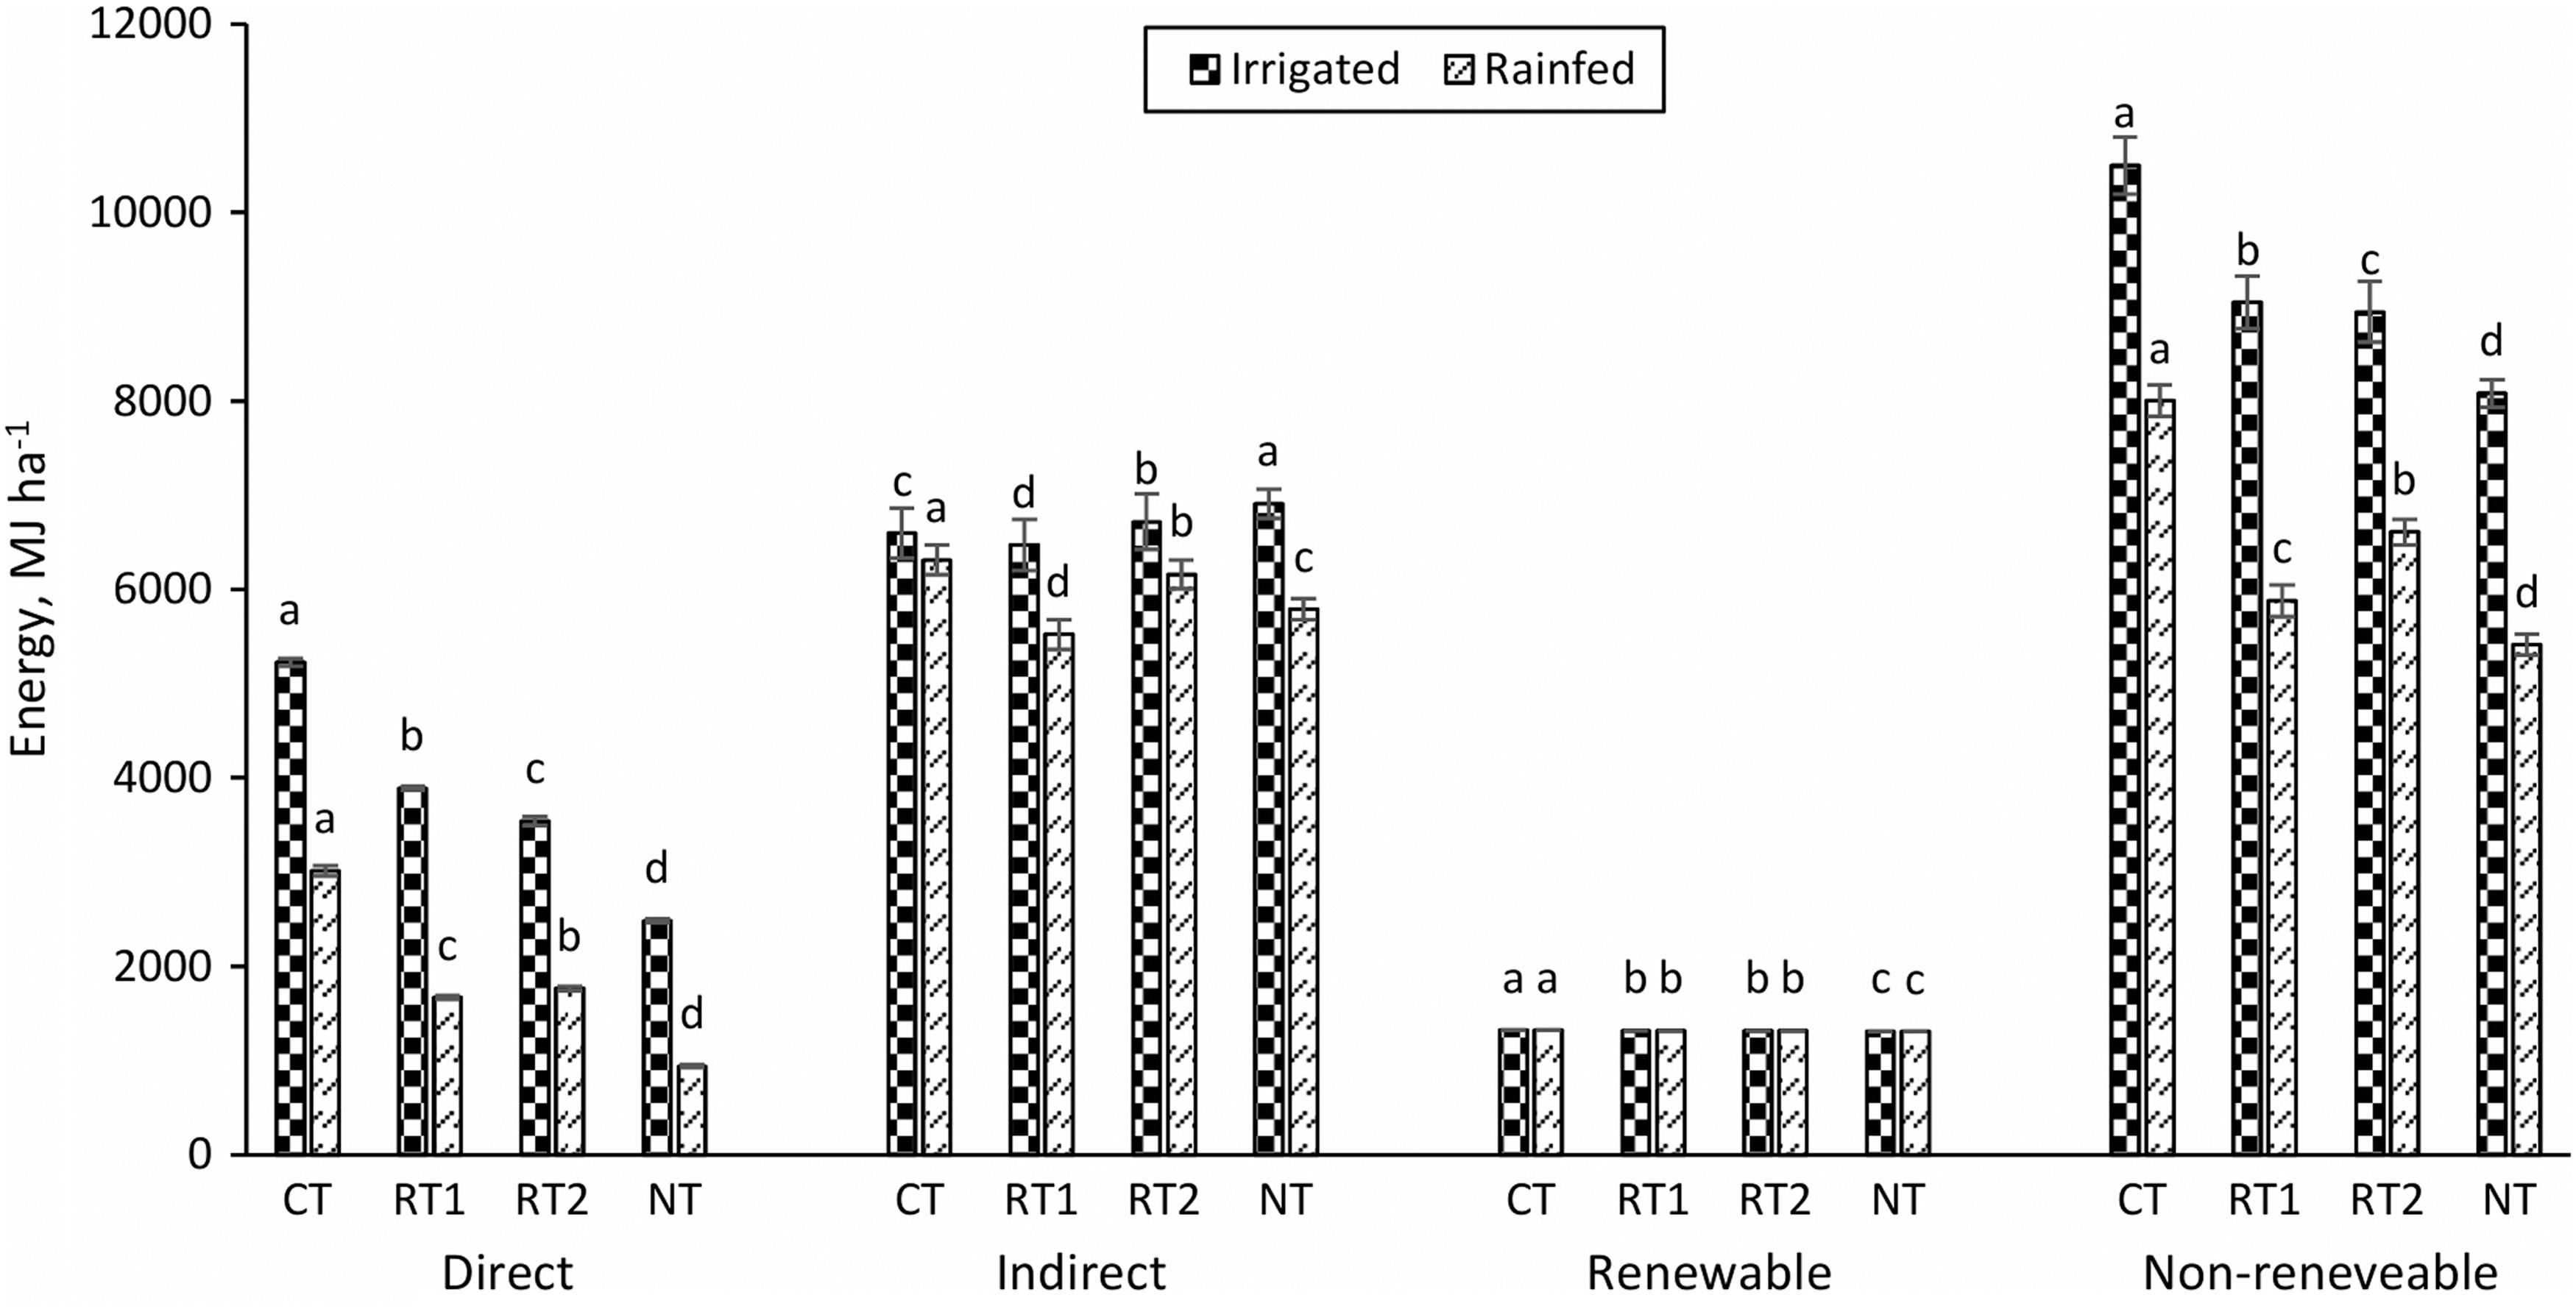
Types of energy consumed in the vetch production in four different tillage-sowing practices under two crop rotations. The values marked with different lowercases in each crop rotation for each energy type are statistically different (p < 0.05).
The NT practice had the lowest renewable energy consumption (human labor and seed) in both rotations. Same seed and reduced human labor values provided similar renewable energy values for two crop rotations (Table 5). Indirect energy values (machinery+fertilizer+seed+chemical) in irrigated rotation in the NT practice increased, while they decreased in rainfed rotation (Fig. 3). Fertilizer energy was the most effective element in changing the indirect energy amount (Table 5). Therefore, the NT practice had the highest value in irrigated rotation, while the CT practice had the highest value in rainfed rotation.
Average values for 3 years (Table 5) showed that the output energy in rainfed rotation was significantly higher in the NT practice (39916.36 MJ/ha), a result of the higher vetch forage yields than for the conventional and reduced tillage practices. The energy output in the CT, RT1, and RT2 practices was 9.6, 11.9, and 11.2% lower than in the NT practice, respectively. Higher output energies were obtained in all tillage-sowing practices under irrigated crop rotation as a result of higher vetch forage yields compared to rainfed rotation, while tillage-sowing practices provided similar effects on the yields statistically (Table 5). The practices of CT, RT1, RT2, and NT in the irrigated rotation provided 1.45, 1.55, 1.54, and 1.29 times higher output energies, respectively, compared to rainfed rotation. These values indicated that the NT practice in rainfed conditions could be more appropriate to improve the vetch forage yield with more effective use of the soil water as a result of improved soil properties. Many previous studies have indicated that the NT practice has been a better alternative in terms of soil water conservation compared to the CT practice. According to Rusu (2014), using minimum and NT practices promotes the increase of soil organic matter content, aggregation, and permeability, and provide a greater water supply. Similarly, Yu et al. (2011) expressed that NT practice promotes available soil water by improving soil porosity and wet aggregate stability, and thereby increases crop yield. Rain water use efficiency has been reported to be higher under the NT practice compared to CT (Li et al., 2005). As a supporting important result for our study findings, Pittelkow et al. (2015) conducted an analysis on a global scale to evaluate the effects of numerous crops (50 crops) and environmental factors (63 countries) on NT compared to CT yields using data obtained from 678 different studies. The results of this analysis showed that no-till practice increases yields compared to CT under rainfed conditions in dry climates. Farooq et al. (2011) expressed that yields in conservation agriculture under rainfed conditions were often greater compared to CT.
The CT practice had a statistically lower energy ratio (4.41 in irrigated rotation and 3.87 in rainfed rotation) compared to the NT practice (5.47 in irrigated rotation and 5.93 in rainfed rotation) with the greatest energy ratio in both rotations (Fig. 4). Moreover, reduced tillage practices increased (∼21.0%) the energy ratio significantly compared to the CT practice. Therefore, the order of energy ratios for different tillage practices could be expressed as NT>RT>CT. Yousefi et al. (2019) also determined that the energy ratio amounts of different tillage systems followed the order of NT>RT>CT practices in wheat production. These findings show that energy ratio increased with decreasing soil tillage applications in both crop rotations. The use of more machinery and increased operational time increases energy consumption to a major degree and may reduce energy use efficiency. Similarly, Rathke et al. (2007) observed that the energy ratio tended to increase when soil tillage operations were reduced. Šarauskis et al. (2014) achieved the highest energy efficiency ratio in maize production with the NT practice and it resulted in a 12.9% higher value compared to conventional deep ploughing.

Energy ratio (output/input) values in the vetch production in four different tillage-sowing practices under two crop rotations. The values marked with different lowercases in each crop rotation are statistically different (p < 0.05).
Higher output energies, despite higher input energies in irrigated rotation, increased the energy ratio in the CT, RT1, and RT2 practices compared to rainfed rotation. However, an energy rate that was 8.4% higher was acquired with the NT practice with both the relative yield increase and input energy decrease in rainfed rotation compared to irrigated rotation (Table 5 and Fig. 4). Therefore, it could be said that this high energy ratio in the rainfed rotation corresponded to a high yield and low mechanization level. Taner et al. (2016) also expressed that higher energy use efficiency with minimum energy input and maximum output energy was determined in NT practice than CT and RT in the wheat production under wheat-fallow, wheat-chickpea, and wheat-wheat rotations in a rainfed region.
The greatest energy intensity was determined in the CT practice (2.04 MJ/kg in irrigated rotation and 2.33 MJ/kg in rainfed rotation), while conservation tillage positively affected energy intensity, and values were statistically lower than those in the CT practice (Fig. 5). The NT practice with minimum energy intensity resulted in 19.1% and 34.8% lower values than the CT practice in the irrigated and rainfed rotations, respectively. The finding for tillage practices is consistent with the finding of Tabatabaeefar et al. (2009), who emphasized that the minimum energy consumed in wheat production was 8.81 MJ/kg under the NT practice and that it was lower by 25.2% than with moldboard treatment. The change in trend for energy intensity in soil tillage-sowing practices in rainfed rotation was similar to changing trends of nonrenewable and direct energies (Figs. 3 and 5). Therefore, it could be asserted that less diesel fuel oil consumption in the conservation tillage practices is a more dominant input to obtain less energy intensity values in rainfed crop rotation (Table 5). Energy intensity values in irrigated rotation were lower than the values in rainfed rotation values, except in the NT practice (Fig. 5). Higher fertilizer consumption in irrigated rotation could deter obtaining lesser energy intensity values, despite higher forage yields.

Energy intensity values in the vetch production in four different tillage-sowing practices under two crop rotations. The values marked with different lowercases in each crop rotation are statistically different (p < 0.05).
Energy gain for different tillage practices in both rotations generally displayed similar trends to total energy output (Fig. 6 and Table 5). This finding is commensurate with the result that the energy gain manifested a behavior generally similar to that of energy output argued by Zentner et al. (2004) and Yousefi et al. (2019). This behavior also confirmed energy gain increases as long as the energy output per unit energy input increases (Moreno et al., 2011). Energy gain also differed between the crop rotations and it was lower in rainfed conditions. The decrease rates in the CT, RT1, RT2, and NT practices were 33.7%, 36.8%, 38.1%, and 21%, respectively. These results indicated that NT practice under rainfed conditions is more suitable compared to other tillage-sowing practices due to the increase in energy output and decrease in energy inputs.
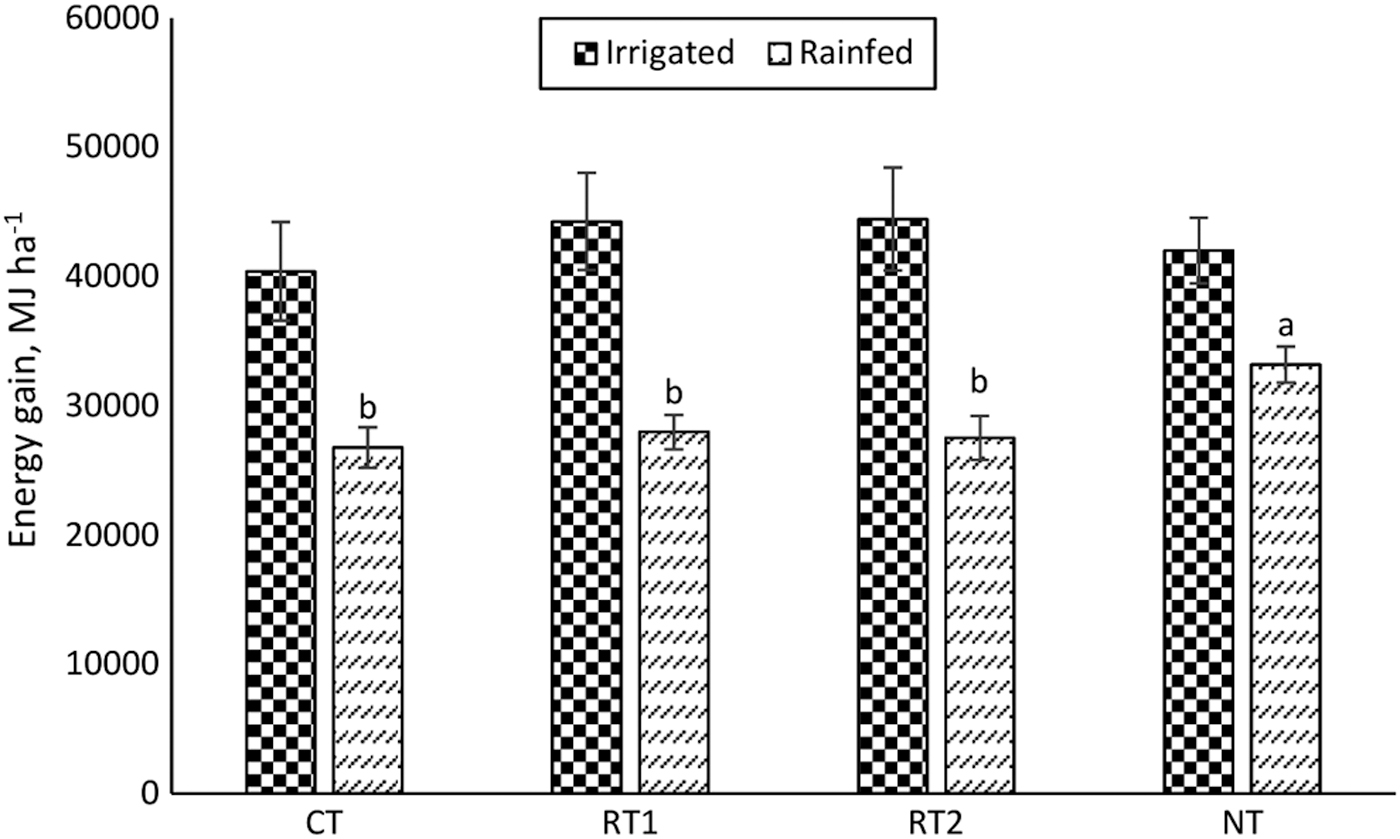
Energy gain values in the vetch production in four different tillage-sowing practices under two crop rotations. The values marked with different lowercases in each crop rotation are statistically different (p < 0.05).
CO2 emissions
Although total CO2 emissions based on the heating value of diesel fuel and lubricant oil showed similar changes under the two crop rotations, tillage-sowing practices had a significant effect on CO2 emission, and the highest amount of CO2 emissions occurred in CT practice (Fig. 7). The conservation tillage practices in both crop rotations logarithmically (r2 = 0.913 in irrigated rotation and r2 = 0.898 in rainfed rotation) reduced the CO2 emissions (Fig. 7). Carbon emissions from moldboard plough were 19.8 kg C/ha in irrigated rotation and 18.5 kg C/ha in rainfed rotation (the CO2 emission was multiplied by 0.27 coefficient convert to C). Therefore, moldboard plowing in CT practice released CO2 equivalent to 48.9% and 45.0% of total emission in irrigated and rainfed rotations, respectively. These values were high when considering the C emission equivalent values that ranged from 13.4 to 20.1 kg C/ha of the moldboard plowing given by Lal (2004). NT practice saved ∼69% of CO2 emissions for irrigated and rainfed rotations, in comparison with CT practice, as a consequence of fuel savings.
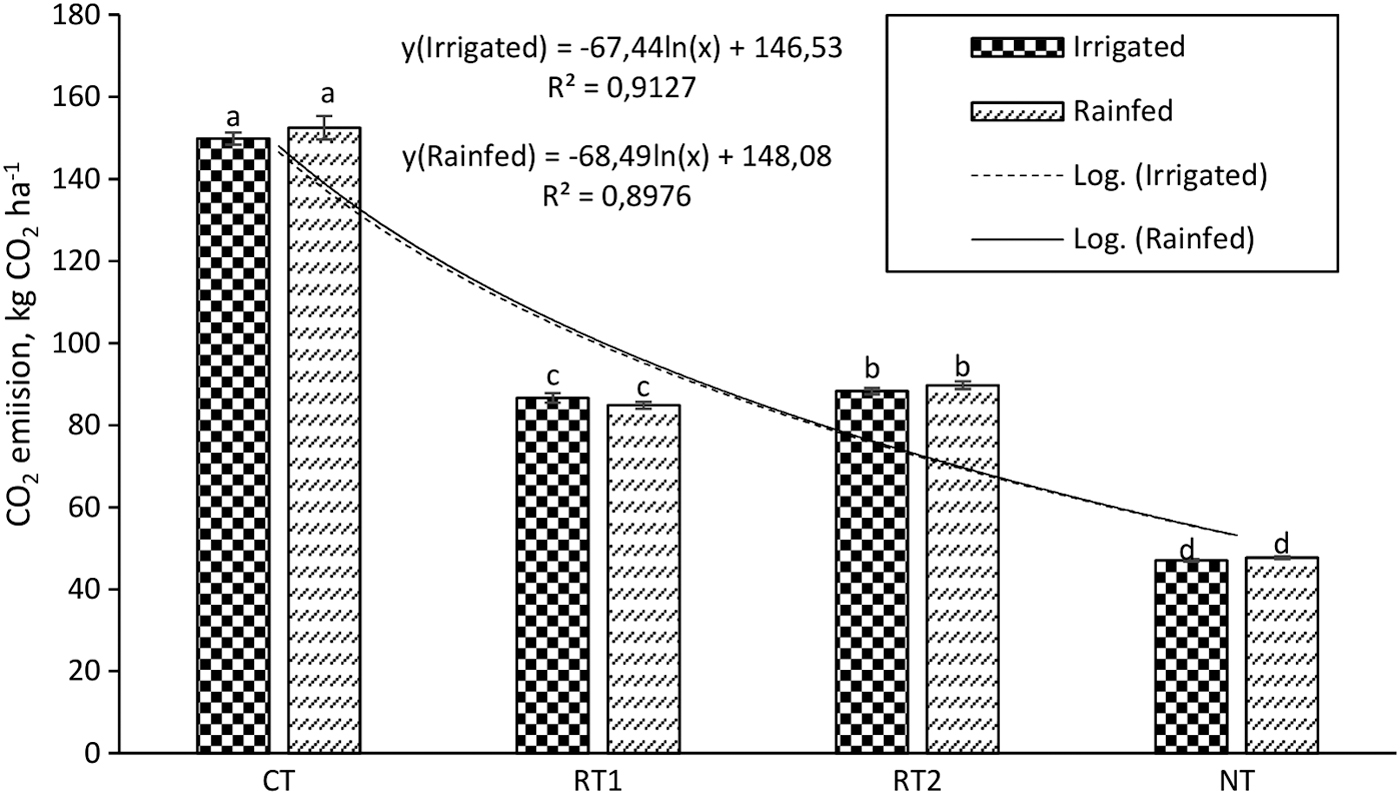
CO2 emission values in the vetch production in four different tillage-sowing practices under two crop rotations. The values marked with different lowercases in each crop rotation are statistically different (p < 0.05).
In accordance to an analysis of previous study findings, many studies reported close rates for CO2 emissions from NT practice compared to CT. Khaledian et al. (2014) determined CO2 emission up to 50% less in NT practice compared to CT, while Stajnko et al. (2009) found a reduction of 80%. Šarauskis et al. (2014) found that agricultural machinery used in NT practice in maize cultivation emits 57.7% less CO2 gas into the environment compared to the emissions of conventional deep-ploughing tillage. Some of the previous studies reported excessively high CO2 emission values for CT practices. In the seedbed preparation stage, Lal (2004) determined that CT resulted in 6 times higher carbon emission (35.3 kg C/ha) than NT. Filipovic et al. (2006) determined that, while CT practice in the production of four different crops (maize, wheat, barley, and soybean) released CO2 quantities ranging from 132.36 kg CO2/ha to 167.72 kg CO2/ha based on the fuel consumption, the commensurate figures ranged from 15.95 to 20.21 kg CO2/ha in the NT practice.
Reduced tillage-sowing practices also provided lower emissions ranging between 41% and 44% from those valid for the CT practice. Our results, which were higher than in a previous study finding that reported CO2 emission rates in the production of four major crops (wheat, sugar beet, bean and potato), were reduced by 15–29% in the reduced tillage practice compared to the conventional practice (Koga et al., 2003).
Yield-indexed CO2 emissions (specific CO2 emission) were ∼1.5 times higher in CT, RT1, and RT2 practices under rainfed rotation than in irrigated rotation with higher vetch forage yields, while the NT practice revealed 1.3 times higher specific CO2 emissions (Fig. 8). In both rotations, the NT practice had the lowest specific CO2 emission, and emission values that were significantly lower at 68.8% (irrigated) and 72.1% (rainfed) than in the CT practice. It was determined that specific CO2 emissions were reduced similar to the CO2 emission logarithmically (r2 = 0.921 in irrigated rotation and r2 = 0.890 in rainfed rotation) in the conservation tillage practices under rainfed and irrigated rotations (Fig. 8).

Specific CO2 emission values in the vetch production in four different tillage-sowing practices under two crop rotations. The values marked with different lowercases in each crop rotation are statistically different (p < 0.05).
Conclusions
These results reveal that the NT practice in rainfed and irrigated rotations was very advantageous compared to the CT practice in terms of saving both diesel fuel (3.2 times less) and working time (4.5 times less). Therefore, the greatest output/input energy ratio (5.47 in irrigated rotation and 5.93 in rainfed rotation) and the lowest energy intensity (1.65 MJ/kg in irrigated rotation and 1.52 MJ/kg in rainfed rotation) were determined in the NT practice. Energy gain in rainfed rotation, despite lower energy input, was lesser than in irrigated rotation with higher vetch yields. Conventional practice also consumed more fuel compared to the reduced tillage practices. Lower fuel consumption in conservation tillage practices sharply reduced CO2 emissions. The NT practice reduced ∼69% of CO2 emission compared to the CT practice.
It was concluded that NT practice in Hungarian vetch production in both irrigated and rainfed rotations can be an appropriate option to achieve higher energy use efficiency and lower CO2 emissions from fuel oil consumption. Reduced tillage practices also can be considered a second option in Hungarian vetch production. Moreover, compared to the NT practice in rainfed rotation in semiarid climate conditions, NT practice in irrigated rotation would be more suitable due to both reduced yield-indexed CO2 emissions and increased energy gain.
Footnotes
Author Disclosure Statement
No competing financial interests exist.
Funding Information
This research was financially supported by “General Directorate of Agricultural Research and Policies in Ministry of Agriculture and Forest in Turkey” (Project No. TAGEM-BB-980210K1).