
Abstract
The purpose of this study was to investigate energy reduction using electrocoagulation (EC) followed by electrooxidation (EO) targeting initial removal of dissolved organic carbon (DOC) during EC and subsequent removal of estrogenic compounds in EO. EC offers benefits over conventional coagulation such as in situ generation of coagulant but is not practical for removing estrogenic compounds. Advanced oxidation processes, including EO, can effectively remove micropollutants such as estrogenic compounds but are hindered by the presence of bulk organic matter. This study investigated four estrogenic compounds from the U.S. EPA's Contaminant Candidate List: estrone (E1), 17β-estradiol (E2), estriol (E3), and 17α-ethynylestradiol (EE2). First, EC (iron electrodes) was employed to remove humic acid and improve downstream removal of estrogenic compounds while reducing overall energy consumption in EO (boron-doped diamond electrodes). The sequential EC and EO system effectively reduced overall electrical energy per order (EEO) by more than half compared with EO alone for each estrogenic compound. The system also effectively removed humic acid and estrogenic compounds. An EC current density of 8.88 mA/cm2 and electrolysis time of 8 min with a flocculation stir rate of 40 rpm (G = 23 s−1) achieved the greatest DOC and UV-VIS254 removal. EO treatment achieved the highest estrogenic compound removal at a current density of 22.2 mA/cm2. Initial humic acid sodium salt concentration (0–60 mg/L C) had an effect on EC iron dose and estrogenic compound removal. The EEO for EC-EO treatments was lower than EC alone, EO alone, UV photolysis, UV photocatalysis, and ozone but was higher than a photocatalytic reactor membrane and UV/H2O2. Overall, the EC-EO system was effective at removing bulk organic matter during EC and estrogenic compounds during EO. EC-EO reduced overall energy demand, indicating that this system should be developed further as an advanced technology that could efficiently remove micropollutants.
Introduction
Micropollutants, such as estrogenic compounds, are pervasive in the environment and have become a concern due to their bioactive nature and potential to initiate a human hormonal response, even at low doses (Roy et al., 2009; National Institute of Environmental Health Sciences, 2010). The main source of these compounds in water is animal and human excreta, with subsequent discharge to surface water after wastewater treatment, followed by uptake into drinking water treatment plants (Liu et al., 2015). Over the past few decades, synthetic and natural human estrogenic compounds have been detected in water and wastewater systems due to their limited removal during conventional treatment (Ternes, 1998; Daughton and Ternes, 1999; Kuch and Ballschmiter, 2001; Snyder et al., 2003; Westerhoff et al., 2005; Benotti et al., 2009; Aris et al., 2014; Conley et al., 2017; Wang et al., 2018). The presence of estrogenic compounds in drinking water also presents a technical problem for smaller rural communities and point-of-use treatment systems unable to adequately remove micropollutants, such as estrogenic compounds. Therefore, additional research on the removal of these compounds using an effective, energy efficient, and low maintenance technology for drinking water treatment would be beneficial.
Electrochemical treatment technologies have been used in industrial wastewater treatment processes and have recently gained attention for drinking water treatment based on their ability to provide efficient, safe, and effective removal of a variety of pollutants (Heffron et al., 2019; Maher et al., 2019a; Öztürk et al., 2019). Electrooxidation (EO) employs inert electrodes that indirectly oxidize contaminants through the generation of oxidants in solution and directly oxidize contaminants on the surface of the electrode (Chen, 2004; Heffron et al., 2019). Direct oxidation occurs when pollutants are adsorbed on the surface of the electrode and are oxidized through electron transfer without the involvement of any other substance (Panizza, 2010). Indirect oxidation occurs, not at the electrode surface, but through an electroactive mediator, which transfers electrons from the electrode to the organic pollutant (Panizza, 2010).
EO is capable of degrading (sometimes to complete mineralization) a number of pollutants, including estrogenic compounds (Murugananthan et al., 2007; Yoshihara and Murugananthan, 2009; Frontistis et al., 2011), pharmaceuticals (Sopaj et al., 2015), industrial wastewater contaminants (Panizza, 2010), landfill leachate (Anglada et al., 2010), ammonia nitrogen (Anglada et al., 2010), and pathogens (Frontistis et al., 2011). However, mineralization of target micropollutants can be impeded due to organic matter scavenging the oxidants and increasing overall energy consumption (Khan et al., 2013). This impedance is because relatively high-molecular-weight natural organic matter, such as humic and fulvic substances, is more resistant to anodic oxidation compared with micropollutants (Chiang et al., 2000; Panizza, 2010). Therefore, the removal of natural organic matter before EO treatment would likely improve energy efficiency for treatment of estrogens.
Electrocoagulation (EC) offers a well-documented approach to remove organic matter and would do well ahead of EO (Dubrawski and Mohseni, 2013). EC is the in situ generation of a metal oxide coagulant via the dissolution of sacrificial electrodes, either iron or aluminum, through the release of metal ions (Fe+2, Fe+3, and Al+3) (Linares-Hernández et al., 2010; Öztürk et al., 2019). Previous studies have found that iron EC is capable of efficiently removing dissolved organic carbon (DOC) (Dubrawski and Mohseni, 2013; Ulu et al., 2014), but EC is not an efficient treatment method for estrogenic compound removal (Maher et al., 2019b).
The goal of this research was to reduce overall energy consumption (evaluated as the electrical energy per order [EEO] of each estrogenic compound) for the removal of DOC and estrogenic compounds (estrone [E1], 17β-estradiol [E2], estriol [E3], and 17α-ethynylestradiol [EE2]) in a sequential EC-EO system. This is the first known study to analyze the use of an EC-EO system targeting energy reduction for the removal of organic compounds in the form of humic acid and estrogenic compounds. It was hypothesized that using EC and EO in series would decrease overall energy consumption for removing DOC and estrogenic compounds compared with operating either of these treatment systems independently. The specific objectives of this research were to (1) determine the effect of EC iron dose (based on electrolysis time and current density) and flocculation stir rate on the removal of organic matter, (2) determine the effect of current density and pH in EO on estrogenic compound removal, (3) determine the effect of initial humic acid concentration in the sequential EC-EO process on estrogenic compound removal, and (4) determine the energy efficiency of the EC-EO system for treatment of each estrogenic compound.
Materials and Methods
Chemicals
Estrogenic compounds (E1 [≥99% purity], E2 [≥98%], E3 [≥97%], EE2 [≥98%]), sodium sulfate (≥99%), and humic acid sodium salt were purchased from Sigma–Aldrich (St. Louis, MO). Estrogenic compound stock solutions were prepared in HPLC-grade methanol (≥99%) purchased from Alfa Aesar (West Hill, MA) and stored at −20°C. Estrogenic compounds were spiked into the bulk test solution in methanol volumes that accounted for 0.05% of the total volume. Methanol was used to help dissolve the estrogenic compounds in the solution (Maher et al., 2019b; Tong et al., 2019). It is noted that methanol can act as a free radical scavenger. Estrogenic compound removal might have slightly increased without the presence of methanol, but methanol concentrations were the same between all experiments for the sake of comparisons. Humic acid sodium salt (Sigma–Aldrich) was dissolved in ultra-pure Milli-Q (Millipore, Burlington, MA) water. Sulfuric acid (96.6%) and sodium bicarbonate from Fisher Scientific International, Inc. (Fair Lawn, NJ) were used for pH adjustment.
Reactor operation
The sequential treatment system consisted of EC (electrolytic coagulation and flocculation), separation via settling and EO batch experiments (Supplementary Fig. S1, Section S1 in the Supplementary Data). EC and EO experiments were performed in 250-mL glass Berzelius beakers with a 3D-printed plastic cap designed to fit two electrodes at an interelectrode distance of 1 cm (Naje et al., 2015; Maher et al., 2019a, 2019b). Power was supplied using a benchtop DC power supply (Sorensen XPH75-2D, 300W, 0-75W, 0-2A, dual output, universal input 110VAC to 240VAC). Tests were performed on a magnetic stirrer to provide reactor mixing during experiments.
EC for the removal of organic matter before employing EO for estrogen removal
Iron electrodes (1020 steel, fabricated by VMetals, Franklin, WI) with an active anode surface area of 18 cm2 were used as the anode and cathode in EC experiments. In EC experiments, the power supply was used in conjunction with a current alternator (kindly provided by A/O Smith Corporation, Brookfield, WI) using a 30-s polarity reversal to reduce electrode passivation and improve efficiency (Maher et al., 2019a). EC was conducted in 250 mL volume with coagulation at a rapid mix stir rate of 120 rpm [velocity gradient (G) is 117 s−1], followed by 15 min of slow mixing flocculation (40 rpm, G value of 23 s−1) with no power. The effect of variable EC mixing speed (20, 40, 80, and 120 rpm, corresponding G values of 8, 23, 64, and 117 s−1, respectively) on DOC removal was investigated.
The test solution was prepared by adding humic acid sodium salt to Milli-Q (18.2 MΩ at 22°C ± 1°C; Millipore) with ∼4.51 mM (1000 μS/cm) Na2SO4 as the electrolyte, alkalinity of 85 mg/L CaCO3 (added as sodium bicarbonate), and pH adjustment with sodium hydroxide or sulfuric acid. The adjusted pH was ∼6.0 for all EC tests. DOC was added at ∼20 mg/L C (Dubrawski and Mohseni, 2013).
During evaluation of operational parameters of EC for organic matter removal, no estrogens were dosed into the test water to eliminate interference from the estrogen-associated methanol on the total organic carbon (TOC) analyzer. In addition to DOC measurements, UV-VIS254 measurements were collected for EC experiments to characterize the removal of organic matter. All glassware for DOC testing were acid washed in 5% HCl solution and baked at 550°C (Mayer et al., 2019). The iron electrodes were acid washed (2 M sulfuric acid), rinsed with water, washed with Alconox®, and wet sanded with 320 grit fine sandpaper (Maher et al., 2019a, 2019b).
EC-EO for estrogenic compound and organic matter removal
After 30 min of settling following flocculation, 200 mL of EC-treated water were decanted into the EO reactor. Electrodes with a boron-doped diamond (BDD) film on a niobium substrate (Fraunhofer USA, Inc., Lansing, MI) with an active anode surface area of 13.5 cm2 and a titanium cathode were used for EO. BDD electrodes were selected because several advantages have been documented, including a wide solvent window (high potential range) (Macpherson, 2015), low capacitance or background currents (Panizza, 2010; Macpherson, 2015), reduced fouling (Macpherson, 2015), low adsorption (Panizza, 2010), corrosion stability even in acidic media and high temperatures or pressures (Panizza, 2010; Macpherson, 2015), and extremely high oxygen evolution overpotential (Panizza, 2010). BDD electrodes underwent anodic polarization for 10 min in 0.1 M H2SO4 at 50 mA current between each experiment to remove any surface contamination or deposition (Murugananthan et al., 2007). Following EO, samples were collected, processed, and analyzed for estrogenic compounds and organic carbon. As the methanol (organic alcohol) matrix used to spike estrogens interfered with DOC analysis, organics were assessed as UV-VIS254. This approach provided quantification of the aromatic fraction, which is the dominant DOC fraction in humic acid as well as natural organic matter (Bekbolet et al., 2005; Samios et al., 2007).
The test solution was prepared by adding the estrogenic compounds and humic acid sodium salt stock solutions in Milli-Q (18.2 MΩ at 22°C ± 1°C; Millipore) with ∼4.51 mM (1000 μS/cm) Na2SO4 as the electrolyte, alkalinity of 85 mg/L CaCO3 (added as sodium bicarbonate), and pH adjustment with sodium hydroxide or sulfuric acid. The adjusted pH was ∼6.0 for all tests, with the exception of EO pH experiments targeting pH 8.0 or 10.0. DOC was added at ∼20 mg/L C with the exception of experiments investigating the effect of initial DOC concentration on energy use and estrogenic compound removal, where concentrations of 0, 7.5, 15, 30, and 60 mg/L C of DOC were tested.
All estrogenic compounds (E1, E2, E3, and EE2) were added at a concentration of 200 μg/L in a methanol solution. Estrogenic compound concentrations were above environmental levels, which are in the ng/L range, but higher concentrations were used to assess potential for greater removal rates. Supplementary Table S1 (Section S2 in the Supplementary Data) details the physical and chemical characteristics of the estrogenic compounds. Control experiments indicated negligible adsorption of the estrogenic compounds to the glassware and electrodes. Reactor samples removed for estrogenic compound analysis were only 1 mL, which changed the reactor volume by 0.4% and had negligible effect on treatment conditions.
Analytical measurements and quality assurance/quality control
The methods for estrogen analysis, sample preparation, spike and recovery experiments, standard curve preparation, limit of detection and limit of quantification determination, and quality assurance/quality control were previously reported (Maher et al., 2019a, 2019b; Mayer et al., 2019). Briefly, E1, E2, E3, and EE2 were analyzed via liquid chromatography–mass spectrometry (LC-MS) using a Shimadzu LC-MS 2020 (Kyoto, Japan); additional details are provided in Sections S3 and S4 of the Supplementary Data (Supplementary Tables S2 and S3). DOC samples were acidified with 3 N HCl and filtered through a 0.45 μm, 25 mm Polytetrafluoroethylene (PTFE) syringe filters (Agela Technologies, Newark, DE) and then analyzed with a Total Organic Carbon Analyzer (TOC-VCSN; Shimadzu, Kyoto, Japan). UV-VIS254 was measured with a spectrophotometer (Genesys 20; Thermo Scientific, Waltham, MA) in accordance with USEPA Method 415.3. The DOC measurements were used to quantify total dissolved organic matter in solution, whereas UV absorbance at a wavelength of 254 nm (UV-VIS254) was indicative of the organic matter character (i.e., aromaticity) (Mayer et al., 2019). Residual iron concentrations following EC were measured as total soluble iron after filtration with a 25 mm, 0.45 μm syringe filter (Agela Technologies) via inductively coupled plasma mass spectrometry analysis (7700 Series; Agilent Technologies, Santa Clara, CA) (Maher et al., 2019a). See Section S8 in the Supplementary Data for residual iron data.
The estrogenic compound standards used for generating standard curves on the LC-MS for each test were prepared in the same manner as the test water used, that is, with the same electrolyte (Na2SO4), pH adjustment (H2SO4 or NaOH), and alkalinity (NaHCO3). Experiments were completed in triplicate, alongside one control reactor operated under the same conditions but with no power input to quantify estrogenic compound removal via adsorption to reactor walls or loss during sample collection and processing. During each test, a blank water sample (no estrogenic compounds) was collected before the addition of the estrogen stock solution to ensure clean glassware. Methanol was sampled and analyzed to ensure no contamination. Instrument blanks were analyzed approximately every six samples during LC-MS runs to ensure no carryover on the column between samples.
Data analysis
Statistical data analysis was performed with GraphPad Prism 7® (GraphPad Software, La Jolla, CA). A one-way analysis of variance (ANOVA) was performed for each compound for each treatment tested. A one-way ANOVA was also performed for pH tests, DOC concentration tests, and DOC EC optimization tests. Post hoc tests were evaluated with the uncorrected Fisher's least significant difference (LSD) multiple comparisons test, and potential outliers were evaluated using the Grubb's test and then excluded (GraphPad QuickCalcs: outlier calculator, 2018). Error bars on figures represent the standard error of the mean.
Treatment effectiveness was evaluated in terms of energy input (kWh/m3) and EEO (kWh/[m3·order]). EEO is a measure of the amount of energy required to reduce contaminant concentrations by one order of magnitude in a volumetric unit (Bolton et al., 2001). The EEO metric was calculated for each estrogenic compound using Equation (1) (Bolton et al., 2001).
where P is rated power (kW), t is time (h), V is volume (L), Co is influent estrogen concentration (μg/L), and Cf is final estrogen concentration (μg/L).
Results and Discussion
EC for the removal of organic matter before employing EO for estrogen removal
Effect of iron dose (based on electrolysis time)
Initial EC experiments were performed to understand the effect of EC parameters on removal of organic matter (assessed as DOC and UV-VIS254). The majority of DOC removal occurred in the first 2 min (Fig. 1). While there was a statistical difference in DOC removal between all electrolysis times tested (0, 2, 4, 6, 8, and 10 min; ANOVA p-value <0.0001), DOC removal remained largely unchanged from 2 to 8 min of EC treatment (post hoc Fisher's LSD p-values for 2 through 8 min were ≥0.0538). Removal at 10 min was slightly worse than at 8 min (Fisher's LSD p-value of 0.0332). Greater reduction in UV-VIS254 was achieved with longer electrolysis times (Fig. 1). There was a statistical difference between overall UV-VIS254 removal at different times (ANOVA, p-value <0.0001), but no further removal was observed after 6 min (post hoc Fisher's LSD p-value ≥0.4828 for 6, 8, and 10 min). The difference in DOC and UV-VIS254 indicates that the aromatic fraction quantified by UV-VIS254 was more susceptible to removal. The time chosen for use in future tests was 8 min of electrolysis [equivalent to a theoretical iron dose of 111 mg/L as Fe based on Faraday's law using z = 2 (Dubrawski and Mohseni, 2013)] because floc formation was more reliable at 8 min than at 6 min based on visual inspection. Supplementary Table S4 (Section S5 in the Supplementary Data) summarizes the iron dose and energy consumption at each time tested.
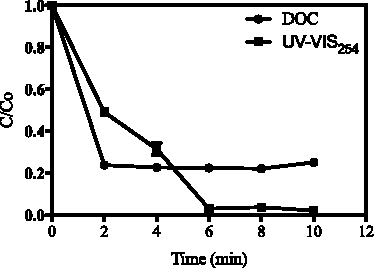
Removal of organic matter, characterized as DOC and UV-VIS254, during EC as a function of treatment time. Current density was 16.6 mA/cm2 (conductivity 1000 μS/cm, pH 6.0, ∼22°C, and I = 0.3 A). Error bars are shown as ±1 standard error of the mean of triplicate data. Error bars shorter than the height of the symbol are not visible. DOC, dissolved organic carbon; EC, electrocoagulation.
Effect of iron dose (based on current density)
Increasing EC current density improved the removal of DOC and UV-VIS254 (Fig. 2). The current density was adjusted for each test by changing the current and maintaining a constant electrolysis time, submerged surface area, polarity reversal time, and stir rate. The greatest DOC removal achieved during this testing was accomplished with a current density of 2.22 mA/cm2 or greater, and there was no statistical difference using higher current densities (post hoc uncorrected Fisher's LSD p-values for current densities between 2.22 and 33.33 mA/cm2 ≥ 0.0825). Current densities also affected UV-VIS254 removal (ANOVA p-value <0.0001), but there was no improvement in UV-VIS254 removal for current densities above 4.44 mA/cm2 (post hoc uncorrected Fisher's LSD p-values ≥0.3553). However, low current densities yielded variable and unreliable floc formation; thus, a current density of 8.88 mA/cm2 was used in subsequent EC-EO experiments as a conservative value to ensure floc formation. Supplementary Table S5 (Section S5 in the Supplementary Data) summarizes the iron dose and energy consumption at each current density tested.
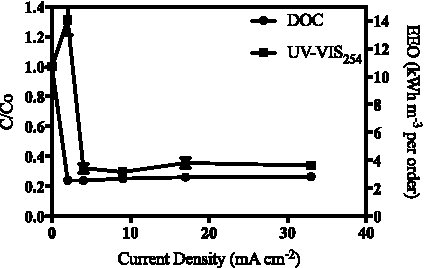
Removal of organic matter, characterized as DOC and UV-VIS254, during EC as a function of current density (conductivity 1000 μS/cm, pH 6.0, ∼22°C, and t = 10 min). Error bars are shown as ±1 standard error of the mean of triplicate data. Error bars shorter than the height of the symbol are not visible.
At a current density of 2.22 mA/cm2, there was an increase in UV-VIS254 C/Co. The increase in UV-VIS254 absorbance is likely because at very low current densities, floc formation was low, leaving soluble Fe3+ in solution. During EC, Fe2+ is released directly off the electrode but is then rapidly oxidized to Fe3+, which has long been recognized to interfere with UV-VIS254 measurements as Fe3+ absorbs light at the 200–400 nm wavelength range (Doane and Horwáth, 2010).
Effect of stir rate on flocculation
Stir rate has been shown to greatly affect flocculation performance (Yeung et al., 1997; Szpyrkowicz, 2005). Here, the effect of flocculation stir rates of 20, 40, 80, and 120 rpm was examined (G of 8, 23, 64, and 117 s−1, respectively). There was an overall statistical difference in DOC removal between stir rates tested (ANOVA p-value = 0.0005). The most effective stir rates were 40 rpm (23 s−1) and 80 rpm (64 s−1), which provided DOC removals of 92% ± 0.6% and 91% ± 2.8%, respectively (Fig. 3, no difference between these two stir rates, post hoc test uncorrected Fisher's LSD p-value = 0.9596). Stir rates of 20 rpm (8 s−1) and 120 rpm (117 s−1) yielded lower DOC removal (14% ± 21% and 59% ± 19%, respectively) and were significantly different from 40 and 80 rpm (post hoc test uncorrected Fisher's LSD p-value ≤0.0253). As a result, 40 rpm was used during the flocculation period for all subsequent experiments because there is less mixing energy required.

DOC reduction as a function of flocculation stir rate (rpm) and corresponding velocity gradient (s−1) in parenthesis after rapid mix EC using a current density of 16.6 mA/cm2. Electrolyte conductivity = 1000 μS/cm, pH 6.0, ∼22°C, t = 6 min, and I = 0.3 A. Error bars are shown as ±1 standard error of the mean of triplicate data. Error bars shorter than the height of the symbol are not visible.
Interestingly, Maher et al. (2019a) determined that increasing stir rates improved the removal of estrogenic compounds in EC. However, in that system, the major mechanism of estrogenic compound removal was oxidation rather than contaminant adsorption, which is likely the DOC removal mechanism in these EC tests (Mollah et al., 2004; Maher et al., 2019a). Oxidation was likely facilitated by longer electrolysis times, higher stir rates, and lower polarity reversal time (Maher et al., 2019b). In contrast, the DOC removal reported here may have improved with slower stir rates that allowed for agglomeration of DOC-laden flocs before sedimentation.
EC-EO for estrogenic compound removal
EC pretreatment ahead of EO treatment of estrogenic compounds was evaluated in this study. The parameters investigated included current density, EO pH, and initial humic acid concentration into the EC-EO system. Energy requirements for this EC-EO treatment approach (quantified as EEO) were compared with other advanced treatment technologies.
Effect of current density on estrogenic compound removal in EO
Increased current density improved the removal of all estrogenic compounds (Fig. 4). The highest average removal was achieved at 44 mA/cm2, although there was no statistical difference between 12, 22, and 44 mA/cm2 for E1 and E2 (ANOVA p-values ≥0.0142). Current densities less than 12 mA/cm2 provided statistically less removal efficiency (post hoc test uncorrected Fisher's LSD p-values ≤0.0168). For E3, there was a statistical difference (ANOVA p-value = 0.027) between 3 and 44 mA/cm2 (post hoc test uncorrected Fisher's LSD p-value = 0.0053) and between 6 and 44 mA/cm2 (post hoc test uncorrected Fisher's LSD p-value = 0.0059). For EE2, there was a statistical difference between 3 and 12 (ANOVA p-value = 0. 0361), between 22 and 44 mA/cm2 (post hoc test uncorrected Fisher's LSD p-value ≤0.0235), and between 6 and 44 mA/cm2 (post hoc test uncorrected Fisher's LSD p-value = 0.0339).
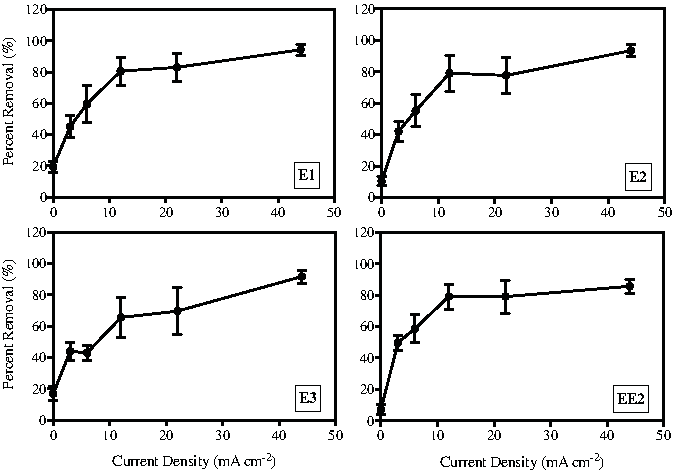
Increased current density in the EO treatment portion increased the removal of E1, E2, E3, and EE2 through the EC-EO treatment train. EC treatment consisted of electrolyte conductivity 1000 μS/cm, pH 6.0, ∼22°C, t = 8 min, I = 0.16 A, and initial estrogen concentrations of ∼200 μg/L. EC was followed by settling and EO treatment with varying EO current densities using a BDD anode. EO treatment consisted of an electrolyte conductivity 1000 μS/cm, pH 6.0, ∼22°C, and tEO = 40 min. Error bars are shown as ±1 standard error of the mean of triplicate data. Error bars shorter than the height of the symbol are not visible. E1, estrone; E2, 17β-estradiol; E3, estriol; EE2, 17α-ethynylestradiol; EO, electrooxidation.
As a result, for all subsequent EC-EO tests, a current density of 22 mA/cm2 was used as it offered the highest estrogen removal and lowest energy consumption per order. The results in Fig. 4 correspond well with other EO studies on the removal of micropollutants using BDD electrodes, where increasing current density increased estrogenic compound removal (Murugananthan et al., 2007; Yoshihara and Murugananthan, 2009).
Increases in current density facilitate electrolysis at high anodic potential; generate more •OH using BDD electrodes; and possibly generate peroxydisulfate, sulfate, and carbonate radicals as well (Murugananthan et al., 2007). The oxidants produced are capable of oxidizing organic compounds. Previous studies using BDD electrodes for the removal of E2 have shown that E2 was completely oxidized using a BDD system (Yoshihara and Murugananthan, 2009).
Effect of pH on estrogenic compound removal in EO
The effect of influent pH in the EO system on overall estrogenic compound removal through EC-EO was investigated at pH 6, 8, and 10 (Fig. 5). There was no statistically significant difference in removal at the different pH values after 40 min of EO treatment (ANOVA p-values ≥0.1329). Brocenschi et al. (2016) found a negative effect on E1 degradation with an increase in pH. However, the results presented by Brocenschi et al. (2016) are contradictory to reports by Murugananthan et al. (2007), which may be due to the nature (i.e., coating method, substrate) of the BDD electrodes or variation in water matrix. For the estrogenic compounds in this study, the pKa values are similar and range from 10.3 to 10.8 (refer Section S1 in the Supplementary Data and Supplementary Table S1). Accordingly, the estrogenic compounds are primarily in the neutral form at pH <10 and will likely not be electrostatically attracted to the positive charge on the surface of the anode. Additionally, at higher pH values, the production of hydroxyl radicals (•OH) competes with hydroxide ion oxidation, leading to lower radical generation and inhibition of organic compound removal via oxidation (Brocenschi et al., 2016).

Adjustment in pH before EO treatment did not impact the removal of E1, E2, E3, and EE2 through the EC-EO treatment train. EC treatment consisted of electrolyte conductivity 1000 μS/cm, pH 6.0, ∼22°C, t = 8 min, I = 0.16 A, and initial estrogen concentrations of ∼200 μg/L. EC was followed by settling and EO treatment with an EO current of I = 0.3 A using a BDD anode. Estrogen concentrations were ∼200 μg/L, electrolyte conductivity 1000 μS/cm, ∼22°C, tEC = 8 min, and tEO = 40 min. Error bars are shown as ±1 standard error of the mean of triplicate data. Error bars shorter than the height of the symbol are not visible.
Effect of initial humic acid concentration on estrogen removal in EC-EO
Estrogenic compound removal during EC-EO increased with an increase in initial humic acid concentration (Fig. 6). Based on visual observation, increasing humic acid during these tests interfered with floc formation in the EC reactor, therefore requiring a greater iron dose to achieve efficient UV-VIS254 removal. The EC dose for all humic acid concentrations tested in these experiments achieved consistent removal of UV-VIS254 of ∼88% (88.1% ± 3.5% average of UV-VIS254 among all treatments in triplicate, n = 12). The relationship between initial humic acid concentration and iron dose used to achieve consistent UV-VIS254 removal is shown in Supplementary Fig. S2 (Section S6 in the Supplementary Data).
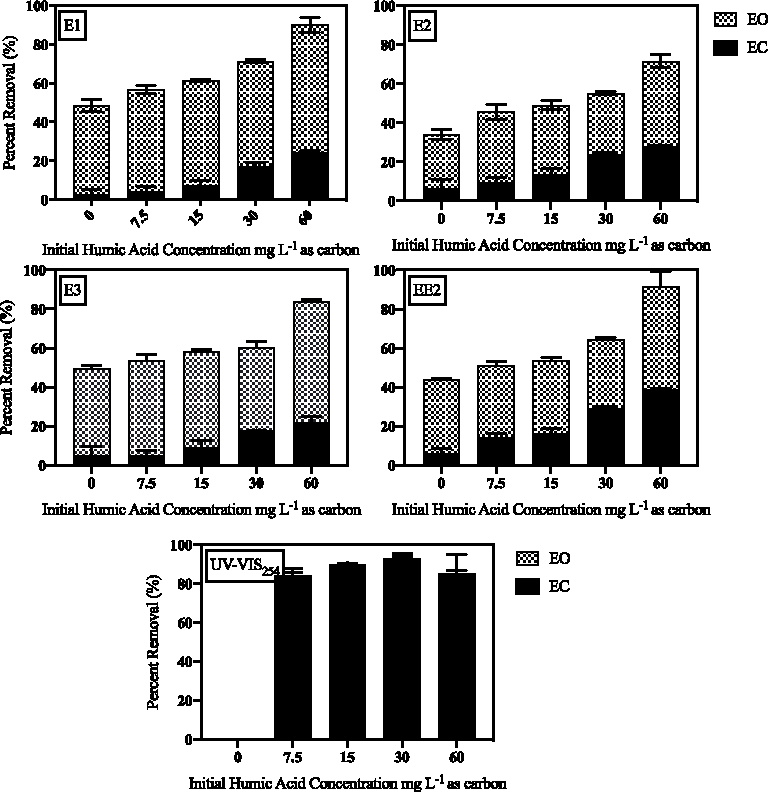
Percent removal of E1, E2, E3, EE2, and UV-VIS254 from EC (including flocculation and settling) and EO treatment with varying initial humic acid concentrations. Iron-EC treatment used initial estrogen concentrations of ∼200 μg/L, electrolyte conductivity 1000 μS/cm, pH 6.0, ∼22°C, tEC = 8 min (for 0, 7.5, and 15 mg/L C), tEC = 11 min (30 mg/L C), tEC = 18 min (60 mg/L C), and I = 0.16 A. A BDD anode was used for EO with electrolyte conductivity 1000 μS/cm, pH 6.0, ∼22°C, tEO = 40 min, and I = 0.3 A. Error bars are shown as ±1 standard error of the mean of triplicate data. Error bars shorter than the height of the symbol are not visible.
Removal of UV-VIS254 in EC-EO treatment was not statistically different as a function of initial humic acid concentrations (ANOVA p-value = 0.5997). The UV-VIS254 was removed primarily during EC, whereas the estrogenic compounds were removed during EO. The increase in electrolysis dose (based on increased initial organic dose) corresponds to an increase in estrogenic compound removal in EC, but not an increase in removal of estrogenic compounds in EO. The increase in estrogenic compound removal is likely due to an increase in redox reactions occurring in the reactor at the surface of the electrodes together with some adsorption (Mollah et al., 2004; Maher et al., 2019b).
Electrical energy per order
The EEO [Eq. (1)] was calculated to facilitate a normalized comparison of the energy required to achieve estrogenic compound removal using the EC-EO system tested in this study compared with other advanced treatment technologies. Values were calculated for the parameters tested in this study that achieved the greatest removals. The removal of estrogenic compounds and the EEO over treatment time are detailed in Fig. 7 for EC (treatment up to the dotted line and gray shading), followed by flocculation and settling (not graphed because no electrochemical energy input), and with EO treatment until 120 min (white background). The EEO values were higher during EC and then decreased during EO. For each compound, the EEO value remained constant after ∼20 min, indicating that system efficiency does not decrease when removing lower concentrations of estrogenic compounds.

Concentrations of E1, E2, E3, and EE2 after EC (treatment up to the dotted line and dark gray shading), flocculation and settling (no electrochemical energy consumption or estrogen removal; not graphed), and finished with EO treatment until 120 min (white background). The secondary y-axis shows the overall energy consumption per unit volume as a function of energy input (derived from treatment time). Initial estrogen concentration = ∼200 μg/L, electrolyte conductivity = ∼1000 μS/cm, pH 6.0, ∼22°C, tEC = 8 min, IEC = 0.16 A, tEO = 120 min (samples were collected throughout treatment), and IEO = 0.3 A. Error bars are shown as ±1 standard error of the mean for the triplicate data. Error bars shorter than the height of the symbol are not visible.
Note that the concentrations of E2, E3, and EE2 in Fig. 7 increased after EC treatment commenced. This increase in estrogenic compound concentration may be a response to the electron flow (induced electric field) produced by EC, which encourages an ion-induced dipole interaction for the compounds, making them more polar and increasing their solubility in water (a polar liquid) (Schwarzenbach et al., 2003b). The dipole moment and solubility in water is also influenced by the polarizability of the compounds (Schwarzenbach et al., 2003a). Because some of these estrogenic compounds have homologs and all have complex conjugated electron systems, they have higher polarizability (Schwarzenbach et al., 2003b). The increased temperature and pH may also affect the overall solubility. As a result, the estrogenic compound concentration increase is due to an increase in solubility from the polarization from the applied electrical field.
EEO was also calculated for EO alone to compare against the EC-EO system (Fig. 8). The EO and EC-EO tests were dosed with ∼30 mg/L C humic acid, and the EEO comparison was performed with data from 40 min of EO treatment without any EC pretreatment. The ratios of EEOECEO:EEOEO were 0.42 for E1, 0.3 for E2, 0.33 for E3, and 0.38 for EE2. Values less than 1 indicate that pretreatment with EC reduced overall energy consumption for estrogenic compound treatment while achieving a similar estrogenic compound removal. In summary, while estrogenic compound removal percentages were not substantially different between the EC-EO system and the EO alone system, the EEO values were lower in the EC-EO system than in the EO alone system (Fig. 8).

Comparison of
Supplementary Table S6 (Section S7 in the Supplementary Data) compares results from this study with a number of other advanced oxidation processes previously reported for the removal of estrogenic compounds. For the EC-EO system, the EEO values ranged from 12.5 to 25 depending on the concentration of humic acid added (mg/L C). This was an improvement over both EO alone and EC alone (Maher et al., 2019b). EEO can vary widely across treatment systems; for example, values by Mayer et al. (2019) were 41 to 60 for UV photolysis and 38 to 54 for TiO2 photocatalysis, whereas in this study, EEO ranged from 12.5 to 21.7 for EC-EO (20 mg/L C). This range of EEO values is an order of magnitude lower than treatment with ozone (Sarkar et al., 2014). It should be noted that EEO values for a given treatment process can change as treatment process setup and operational conditions change. EEO values for electrochemical systems could decrease as research is conducted to further develop these systems and improve their efficiency.
Study limitations
This research demonstrated the removal of parent compounds through the EC-EO system. While Yoshihara and Murugananthan (2009) showed complete mineralization of E2 in an EO BDD system, future work on EC-EO system development for estrogenic compound removal should take into account transformation products. The research presented here did not quantify total estrogenicity to ensure that residual transformation products did not carry estrogenic activity. While the goal of this research was to determine if EC could be paired with EO to reduce energy for parent compound removal, future research should include a transformation product analysis and a yeast estrogen screen assay or other estrogenicity assay to assess the removal of total estrogenicity.
Another limitation of this research was that a two-electrode system was used. While this system allows for preliminary data on efficacy, no information was provided on the possible potential reached from a three-electrode system. A reference electrode can be used to measure potentials achieved in solution during EO to compare with the literature values from previously conducted cyclic voltammetry experiments (Murugananthan et al., 2007; Yoshihara and Murugananthan, 2009). In addition to the use of a reference electrode, it would be beneficial to assess a real water matrix collected from a source water that includes a more complex mixture of constituents to evaluate potential additional oxidants produced (i.e., Cl−), possible disinfection byproducts formed, and the effect on organic matter and estrogenic compound removal.
Conclusions
The EC-EO treatment process demonstrated considerable promise for removing estrogenic compounds. In this study, EC was initially implemented for the removal of organic matter, which would likely scavenge oxidants suitable for removing estrogenic compounds in EO. EC operational parameters to achieve ∼90% DOC and UV-VIS254 removal were a current density of 8.88 mA/cm2, electrolysis time of 8 min, and a flocculation stir rate of 40 rpm. The EO system current density that achieved the best estrogenic compound removal was 22.2 mA/cm2, and initial pH of water fed to the EO system did not substantially affect removal. The initial organic matter concentration had a significant effect on EC floc formation and overall removal of estrogenic compounds in both EC and EO. Increases in humic acid required increased iron coagulant dose, which also increased estrogenic compound removal in EC. EEO values for the EC-EO system suggested that this process may be more efficient than some other advanced oxidation processes (AOPs) including EC alone, EO alone, ozone, TiO2 photocatalysis, and UV photolysis. In short, the use of EC as a pretreatment process reduced system energy requirements.
Footnotes
Acknowledgments
The authors acknowledge the use of the LC-MS from Marquette University, funded by the GHR Foundation. The authors acknowledge the use of the Total Organic Carbon instrument at the University of Wisconsin-Milwaukee School of Freshwater Sciences provided by Dr. Yin Wang and analyzed by PhD student Qianqian Dong.
Author Disclosure Statement
No competing financial interests exist.
Funding Information
This research was supported by a grant from the Lafferty Family Foundation. Funding for K.N.O. was provided by the Water Quality Center at Marquette University.
References
Supplementary Material
Please find the following supplemental material available below.
For Open Access articles published under a Creative Commons License, all supplemental material carries the same license as the article it is associated with.
For non-Open Access articles published, all supplemental material carries a non-exclusive license, and permission requests for re-use of supplemental material or any part of supplemental material shall be sent directly to the copyright owner as specified in the copyright notice associated with the article.