
Abstract
To realize the rapid concentration prediction of phenolic pollutants, simultaneous prediction of phenolic pollutants in water by wavelet analysis and support vector machine (SVM) was proposed in this article. The ultraviolet-visible (UV-Vis) absorption spectra of representative phenolic compounds were determined by spectrophotometry. Spectral analysis and spectral reconstruction were carried out by wavelet analysis. Specific types of phenolic compounds were identified by SVM classification. The regression equations of UV-Vis spectra and concentration of phenolic compounds were established by SVM regression, which was used to predict the concentration of the samples. The results showed that in the mixture of two [3-Methylphenol (m-cresol) and phenol], three [2,4-Dichlorophenol (2,4-DCP), m-cresol, and phenol], and four [2,4-DCP, 2,4,6-Trichlorophenol (2,4,6-TCP), phenol, and m-cresol] phenolic compounds, the wavelet reconstruction of phenolic compounds improved with decreasing wavelet decomposition layers. After wavelet decomposition and reconstruction, the spectra of phenolic compounds were smoother and noise elimination was more obvious. In the mixtures of two, three, and four phenolic compounds, the SVM model showed better prediction results. The predicted values by SVM and the reference values showed a good linear relationship (two phenolic compounds, R2 > 0.99; three phenolic compounds, R2 > 0.99; four phenolic compounds, R2 > 0.92). This study provides a feasible method for early warning of phenolic compound pollution in drinking water sources.
Introduction
Potable water sources are the basis of providing safe and sufficient clean water for human and social production. They are directly related to the safety of drinking water supply and social stability. However, in recent years, sudden drinking water pollution accidents have occurred frequently, which poses a serious threat to public water safety (Yao et al., 2016). The water pollution caused by these sudden pollution accidents seriously threatens the safety of urban water supplies. Therefore, it is of great significance to provide early warning of such sudden accidents to take the necessary precautions before accidents can occur.
In sudden pollution accidents of drinking water sources, the pollutants and contamination are frequently caused by phenolic compounds (Baken et al., 2018). Phenolic compounds have the potential toxicity to be carcinogenic, teratogenic, and mutagenic (Xu et al., 2018). The world health organization has listed 2,4,6-Trichlorophenol (2,4,6-TCP) and pentachlorophenol as class 2B pollutants with carcinogenic effects. The concentrations of 2,4,6-TCP and pentachlorophenol are also restricted in Chinese drinking water hygiene standards. Phenol, 3-Methylphenol (m-cresol), 2,4-Dichlorophenol (2,4-DCP), 2,4,6-TCP, pentachlorophenol, and p-nitrophenol are listed as priority pollutants that must be controlled in China.
At present, the main methods for the determination of phenolic compounds in water are spectrophotometry, liquid chromatography, and gas chromatography (Chen et al., 2001, 2019; Zuo et al., 2002; Salcedo et al., 2019; Tabaraki and Heidarizadi, 2019). The complex formed when using spectrophotometry is highly unstable in water, which affects the accuracy of the sample determination. Chromatography has high accuracy and sensitivity, however, the operational procedure is complex and the cost to run the method is relatively high (Zuo and Jones, 1997; Deng et al., 1998, 2006; Nassiri et al., 2014; Tang et al., 2014; Criado-García et al., 2015; Ahmad et al., 2016; Zhong et al., 2016).
Therefore, the development of a simple and rapid prediction technology for phenolic compounds is of great importance for the early warning detection of water quality variation in drinking water sources.
To achieve the rapid prediction of organic pollutants, online detection technologies for organic pollutants have been paid great attention to in recent years (Felix et al., 2018; Tan et al., 2019). The principles of online detection technologies for organic pollutants are divided into two categories: the technology based on the chemical method and the method based on spectral analysis. Online water quality detection that uses the chemical method is technically mature and widely used. However, there are several problems when using the method, such as having complex steps, long measuring periods, secondary pollution, and high operational costs. Spectral analysis technology has attracted wide attention due to its advantages of simple operation, fast speed, no secondary pollution, and low operational costs (El-Sheikh and Al-Degs, 2013; Jiao et al., 2014; Frizzarin et al., 2016).
Ultraviolet-visible (UV-Vis) spectra are molecular spectra produced by the transition of valence electrons. The concentration of a substance can be analyzed and predicted by the UV-Vis spectra generated by the absorption of the molecule or ion into ultraviolet and visible light (Uríčková and Sádecká, 2015; Raposo et al., 2016). Some studies have found that the UV absorbance of natural water is related to water quality factors, such as chemical oxygen demand (COD), NO3−, turbidity, and pH, etc. (Zuo and Deng, 1998; Chen et al., 2001; Zuo et al., 2006; Ahmad et al., 2016). Prediction of COD in natural water by the UV absorption spectra has been proposed by other researchers (Zhong et al., 2016), laying a foundation for the online prediction of organic matter concentration by UV-Vis absorption spectra.
However, due to the complex composition and seasonal variation of raw water, the prediction accuracy of organic contaminants by direct spectrometry is poor. In addition, spectral signals are easily affected by random factors such as thermal noise, sample background environment, and various interferences of the spectrometer. Therefore, denoising of UV-Vis absorption spectra is an important hurdle to overcome for spectral analysis to work effectively (Avagyan et al., 2014; Reinholds et al., 2015).
In recent years, wavelet analysis has become widely used in the field of spectral analysis. Wavelet analysis is able to recognize and filter noise signals from time and frequency domains simultaneously (Narayanam, 2015; Miesowicz et al., 2016). Wavelet transform analysis is able to realize multiscale analysis, and distinguish the difference between signals very accurately. Moreover, the signal can be quantified by the hierarchical model of wavelet analysis. Therefore, wavelet analysis can more accurately denoise signals (Yu et al., 2017; Yuan et al., 2017).
Another key technique necessary for the concentration prediction of phenolic compounds in water by UV-Vis absorption spectra is establishing the mathematical model between UV-Vis absorption spectra data and the concentration of phenolic compounds. To solve this problem, nonlinear regression methods are commonly used, including nonlinear partial least squares, artificial neural networks, and support vector machine (SVM). Under the condition of small samples, nonlinear, and high dimensional data space, SVM has obvious advantages (such as excellent ability for generalization, reduced data size requirements) in sample classification and regression (Zhao et al., 2008; Basant et al., 2015; Manganelli et al., 2019).
In this article, continuous wavelet transform and SVM are used for concentration prediction of each phenolic compound in the mixture of two, three, and four phenolic compounds. The analysis of UV-Vis absorption spectra of phenolic compounds based on wavelet analysis, and the establishment of mathematical models between the UV-Vis absorption spectra and concentration of phenolic compounds based on SVM were studied. Finally, the applicability of the model was verified.
Materials and Methods
Experimental materials
2,4-DCP, phenol, 2,4,6-TCP, and m-cresol were supplied by Shanghai Aladdin Biochemistry Technology Co., Ltd., China.
Experimental method
The water used in the experiment was taken from the Dongpu Reservoir, which now is an important drinking water source for Hefei City, China. Water quality index of the water used in the experiment is shown in Supplementary Table S1. Typical phenolic compounds, that is, 2,4-DCP, phenol, 2,4,6-TCP, and m-cresol, were selected as the target contaminants. Phenol and m-cresol were mixed and used to test the effectiveness of the method used in this article. Similarly, 2, 4-DCP, m-cresol, and phenol were mixed and used to test the effectiveness of the method used in this article. 2,4-DCP, phenol, m-cresol, and 2,4,6-TCP were mixed and used to test the effectiveness of the method used in this article. The absorbance of 2,4-DCP, phenol, m-cresol, and 2,4,6-TCP was recorded on a UV-Vis spectrophotometer (Lambda 25; PerkinElmer, Singapore).
Wavelet analysis
A spectrophotometer (Lambda 25; PerkinElmer) was used to record the mixed samples and single samples of phenolic compounds with different concentrations at full wavelengths (200–800 nm). The absorbance of phenolic compounds was measured by quartz glass cuvette with a 10 mm optical path. It was found that the absorbance value of the samples at 400–800 nm was close to zero. To improve the prediction accuracy, an absorbance of 200–400 nm was adopted for subsequent studies. A wavelet denoising algorithm was used to decompose the UV-Vis absorption spectra data, and then the signal was reconstructed by inverse wavelet transformation.
Since the wavelet basis was not unique, all the functions satisfying wavelet conditions could theoretically be used for the wavelet basis, such as the Daubechies wavelet family (dbN), SymletsA wavelet family (symN), Biorthogonal wavelet family (biorNr.Nd), Coiflet wavelet family (coifN), and Reverse Biorthogonal wavelet family (rbioNr.Nd) (Charina et al., 2019). In addition, the decomposition layer of the wavelet also affected the final effect of compression and reconstruction (Zhang et al., 2018).
To determine the optimal wavelet basis and decomposition layers, a certain wavelet basis was first fixed, and then three to six layers were selected as decomposition layers for wavelet decomposition to obtain the decomposition vectors. For the decomposition vectors obtained from different decomposition layers, only a small number of large coefficients were kept, and other coefficients were set to zero. After that, the wavelet reconstruction of decomposition vectors obtained by different decomposition layers was carried out to obtain the reconstructed signal, and the optimal decomposition layer of the wavelet basis was determined by comparing with the original signal. Afterward, another wavelet basis was changed and the steps mentioned above were repeated to determine the optimal decomposition layer corresponding to each wavelet basis.
Wavelet analysis was carried out by using the python 3.5.2 programming language and the PyWavelets library (Lee et al., 2019). The wavelet basis of db, sym, bior, coif, rbio, dmey, and gaus wavelet families was selected. The spectra were decomposed according to the decomposition layers and wavelet basis. Only the low-pass components were retained. The high-pass components were then set to zero. The wavelet image was reconstructed according to the components.
Reconstruction ERROR [Eq. (1)], mean squared error (MSE) [Eq. (2)], peak signal-to-noise ratio (PSNR) [Eq. (3)], and correlation coefficient (R) [Eq. (4)] were used for quantitative evaluation of the reconstructed signals and original signals.
where N is the length of the signal,
Support vector machine
The SVM method was used to establish the mathematical model between the concentrations of phenolic compounds and the UV-Vis absorption spectra data. Python 3.5.2 programming language was used to program the SVM method, where the sklearn machine learning library was invoked (Pedregosa et al., 2012).
First, Support Vector Classification (SVC) was used to train the wavelet transform coefficient matrix of the ultraviolet spectra of phenolic compounds. The expected goal was that SVC could accurately identify specific phenolic substances through the wavelet transform coefficient matrix of ultraviolet spectra after training. Then, Support Vector Regression (SVR) was used to establish the regression equation between ultraviolet spectra and the phenolic compound concentrations. The wavelet transform coefficient matrices of phenolic compound UV spectra were set as input and the concentrations of phenolic compounds were set as the target for regression analysis. Finally, the concentrations of phenolic compounds were predicted by using the GridSearchCV grid method; the Gaussian (RBF) kernel, polynomial (poly) kernel, linear kernel, and sigmoid kernel were selected.
When adjusting parameters for both SVC and SVR models, fivefold crossvalidation was carried out (Lin et al., 2019):
A. Divide all training sets into five disjoint subsets. B. Take one of the subsets as the test set and the other four subsets as the training set. C. Train the model or hypothesis function. D. Put the model on the test set, and obtain the evaluation score. E. Calculate the average value of the evaluation scores after running step D five times, and use the average as the real score of the model or hypothesis function.
MSE [Eq. (2)] and explained variance [Eq. (5)] were used to evaluate the prediction effect of the SVM method.
where, x(i) is the input data,
Results and Discussion
Wavelet decomposition and reconstruction of spectra
Wavelet analysis in the mixture of two phenolic compounds
The decomposition and reconstruction of spectra affected the wavelet basis function and wavelet decomposition layers (Zhang et al., 2018). In the mixture of two phenolic compounds (m-cresol and phenol), the evaluation parameters of the wavelet reconstruction with different wavelet decomposition layers (3, 4, 5, and 6) are shown in Supplementary Tables S2, S3, S4, S5, respectively. The results showed that the spectral reconstruction effect of phenolic compounds improved with decreasing wavelet decomposition layers. The wavelet basis with the best reconstruction effect was db6 (decomposition layers = 3), where the reconstruction ERROR was 0.0131, PSNR was 15.1769, MSE was 0.00003, and R was 0.9999.
In the mixture of two phenolic compounds, the wavelet basis (db6, decomposition layers = 3) with the best reconstruction effect was adopted. The comparison between the measured spectra in some experiments and the wavelet reconstruction spectra is shown in Fig. 1. It can be seen from Fig. 1 that the UV absorption spectra of phenolic compounds after wavelet decomposition and reconstruction became smoother. The noise elimination was evident.
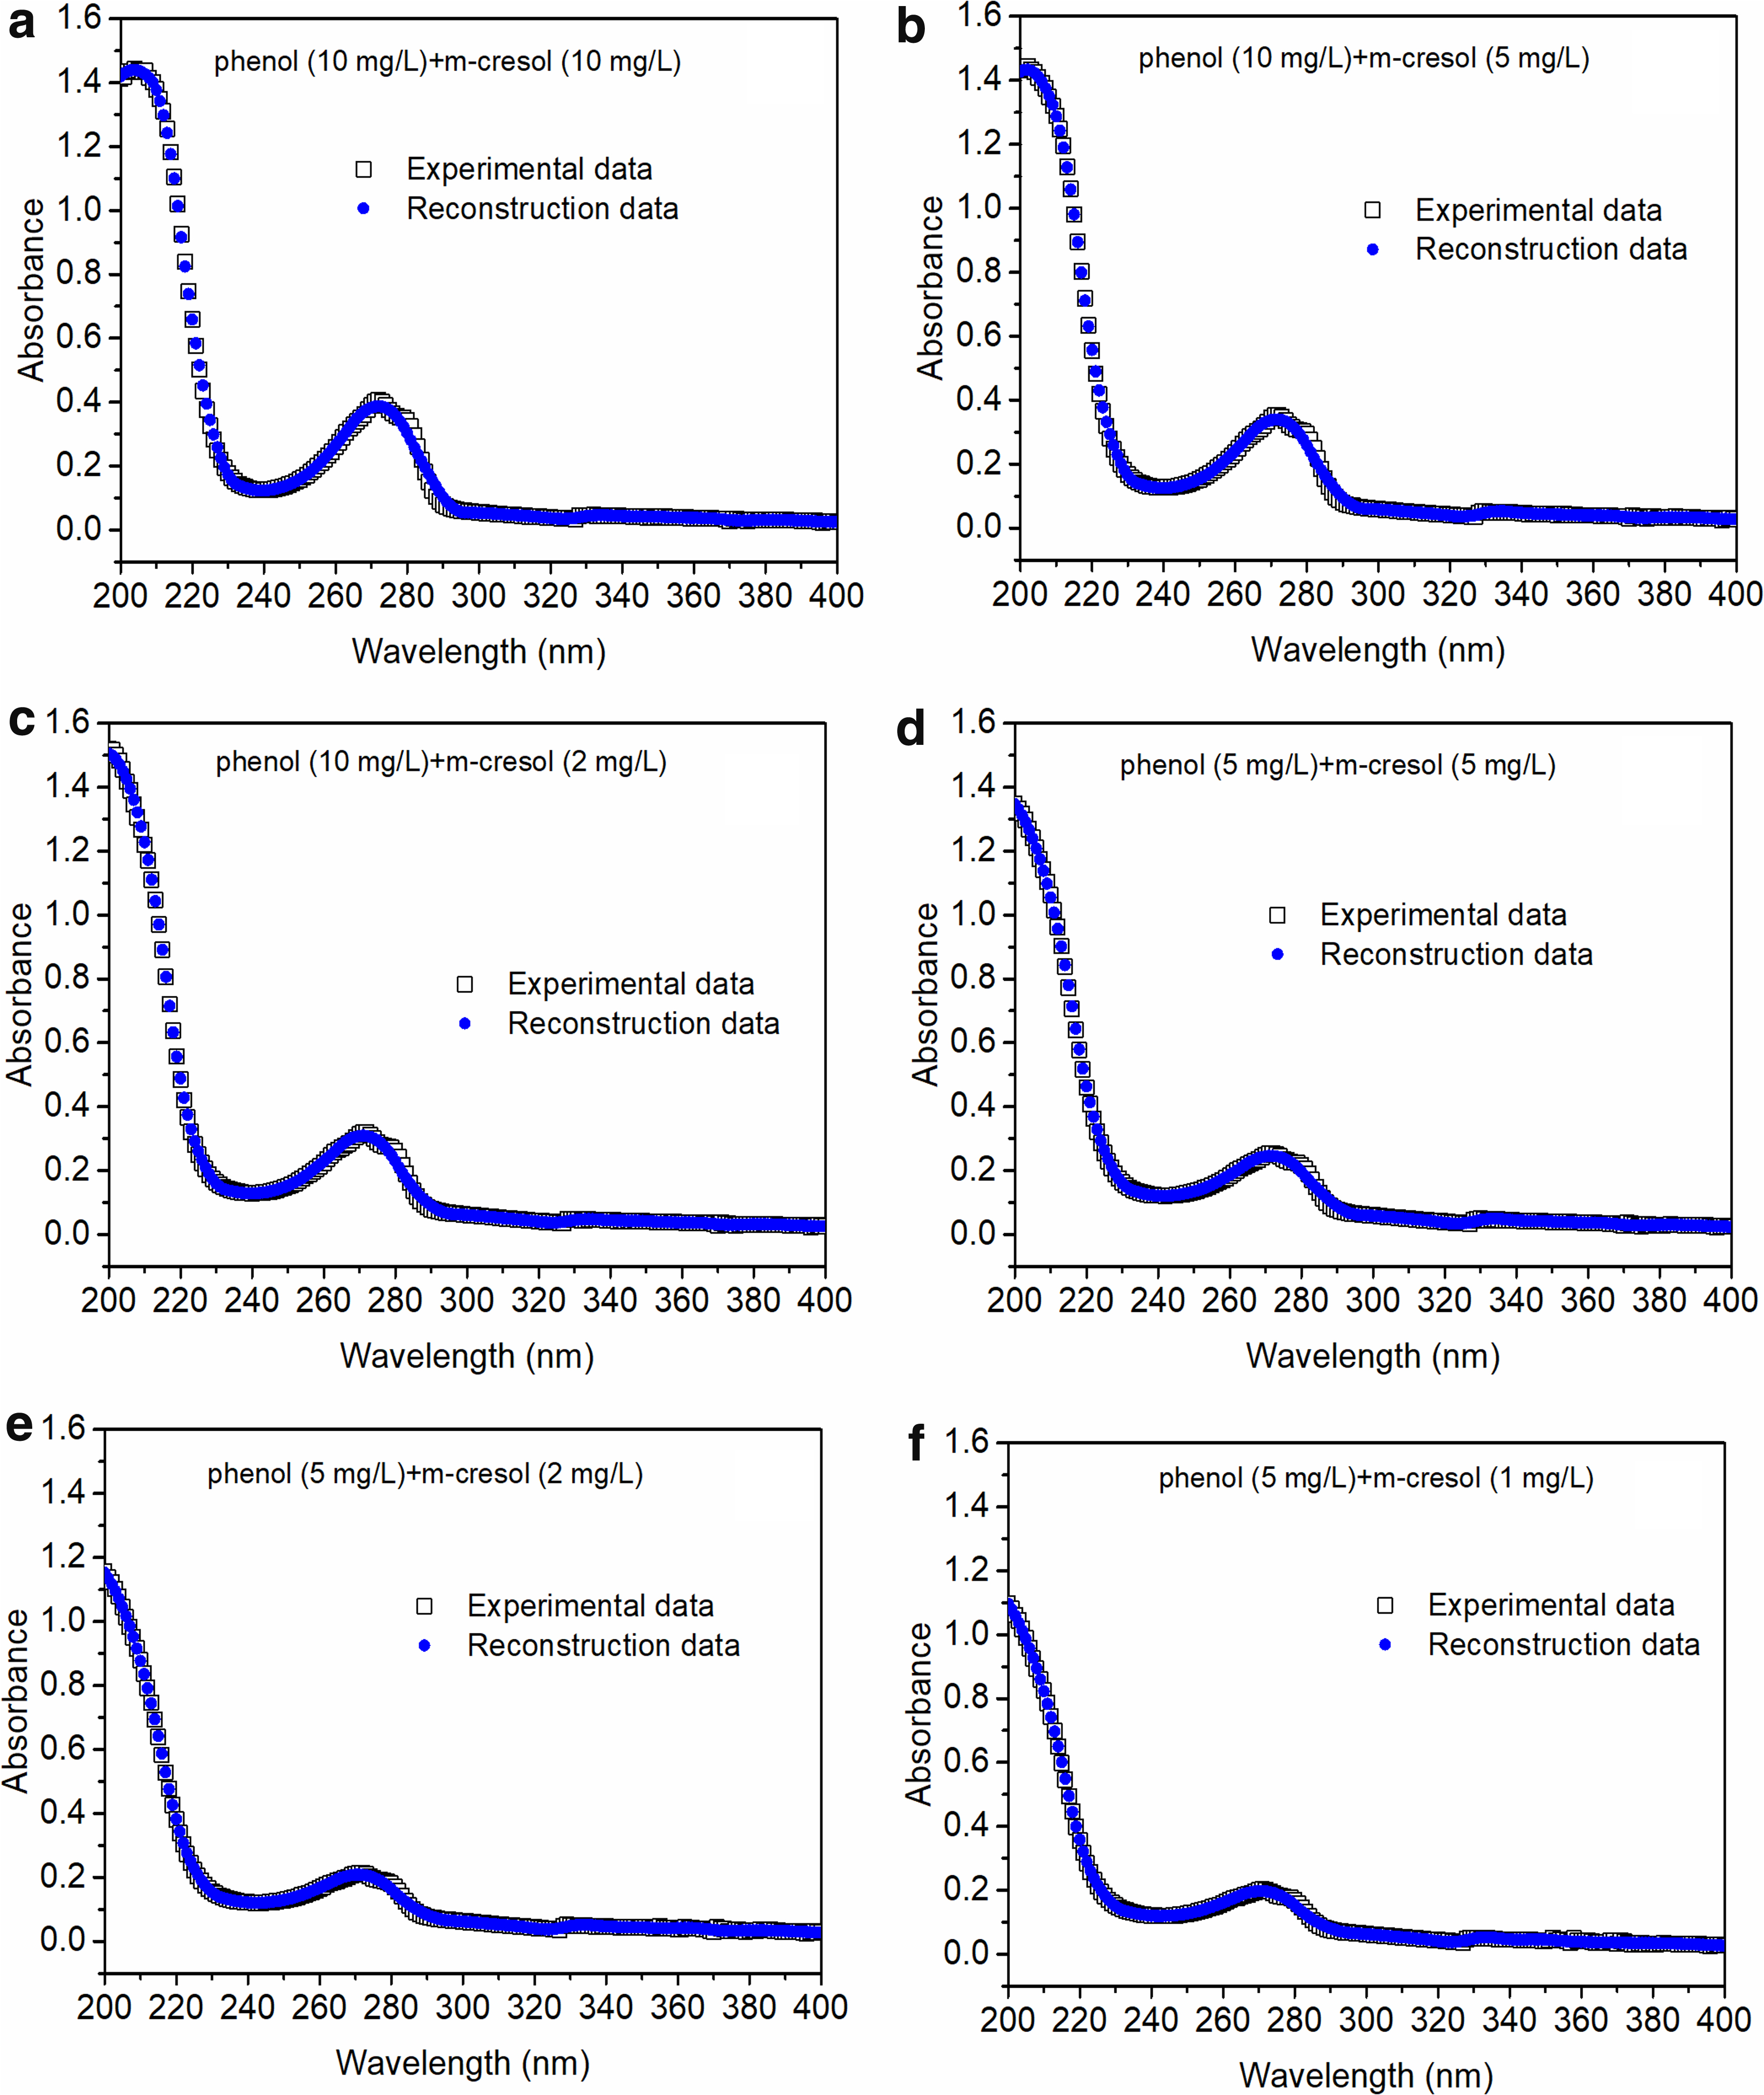
Comparison of some experimental spectra and wavelet reconstruction spectra in the mixture of two phenolic compounds (m-cresol and phenol) (
Wavelet analysis in the mixture of three phenolic compounds
In the mixture of three phenolic compounds (2,4-DCP, m-cresol, and phenol), the evaluation parameters of the wavelet reconstruction with different wavelet decomposition layers (3, 4, 5, and 6) are shown in Supplementary Tables S6, S7, S8, S9, respectively. The results showed that the wavelet reconstruction of phenolic compounds gradually worsened with increasing decomposition layers in the wavelet analysis. The wavelet basis with the best reconstruction effect was db6 (decomposition layers = 3), where the reconstruction ERROR was 0.0434, PSNR was 19.3208, MSE was 0.0021, and R was 0.9990.
In the mixture of three phenolic compounds, the wavelet basis (db6, decomposition layers = 3) with the best reconstruction effect was adopted. The comparison between the measured spectra in some experiments and the wavelet reconstruction spectra is shown in Supplementary Fig. S1. It can be seen from Supplementary Fig. S1 that the UV absorption spectra of phenolic compounds became smoother after wavelet decomposition and reconstruction. The noise elimination effect was also effective.
Wavelet analysis in the mixture of four phenolic compounds
In the mixture of four phenolic compounds (2,4-DCP, 2,4,6-TCP, phenol, and m-cresol), the evaluation parameters of the wavelet reconstruction under different wavelet decomposition layers (3, 4, 5, and 6) are shown in Supplementary Tables S10, S11, S12, S13, respectively. The results showed that wavelet reconstruction of phenolic compounds gradually improved with decreasing decomposition layers. The wavelet basis with the best reconstruction effect was bior3.1 (decomposition layers = 3), where the reconstruction ERROR was 0.0358, PSNR was 18.6428, MSE was 0.0018, and R was 0.9994.
In the mixture of four phenolic compounds, the wavelet basis (bior3.1, decomposition layers = 3) with the best reconstruction effect was adopted. The comparison between the measured spectra in some experiments and the wavelet reconstruction spectra is shown in Supplementary Fig. S2. It can be seen from Supplementary Fig. S2 that the UV absorption spectra of phenolic compounds became smoother after wavelet decomposition and reconstruction. The denoising method by using wavelet analysis was also effective.
Support vector classification and SVR
SVM analysis in the mixture of two phenolic compounds
There were two very important parameters in the SVM model (C and γ) (Pedregosa et al., 2012; Battineni et al., 2019). C was the penalty coefficient, that is, the tolerance for error, which decreased with increasing C values. Higher C values were prone to overfitting. However, too low C values were prone to underfitting (Leng et al., 2017; Tao et al., 2019). The number of support vectors decreased with an increase of gamma values, which affected the speed of training and prediction (Zhang et al., 2018; Wang et al., 2019).
The modeling parameters were optimized by the fivefold crossvalidation method. The values of C were [0.005, 0.01, 0.1, 0.5, 1, 2, 4, 10, 100, and 200], and the γ values were [0.0001, 0.001, 0.01, 0.05, 0.001, 0.0001, 0.125, 0.25, 0.5, and 1]. The optimal parameters were the ones with the smallest MSE. After calculation, in the mixture of two phenolic compounds (m-cresol and phenol), C = 200, γ = 0.0001, and the Linear kernel were finally selected as the optimal parameters for modeling the two phenolic compounds (m-cresol and phenol). A MSE of 0.58 and explanatory variance of 0.57 were calculated as the model evaluation parameters.
In the mixture of two phenolic compounds (m-cresol and phenol), the spectra reconstructed by wavelet analysis (200–400 nm) were used to establish the SVM model under the optimal parameters, and the concentrations of phenolic compounds were predicted (Fig. 2 and Table 1). It can be seen from Fig. 2 and Table 1 that the results of simultaneous prediction of the two phenolic compounds by SVM were satisfactory. As shown in Fig. 2, a good linear relationship was found between the predicted values and the reference values (m-cresol, R2 = 0.9963; phenol, R2 = 0.9989).
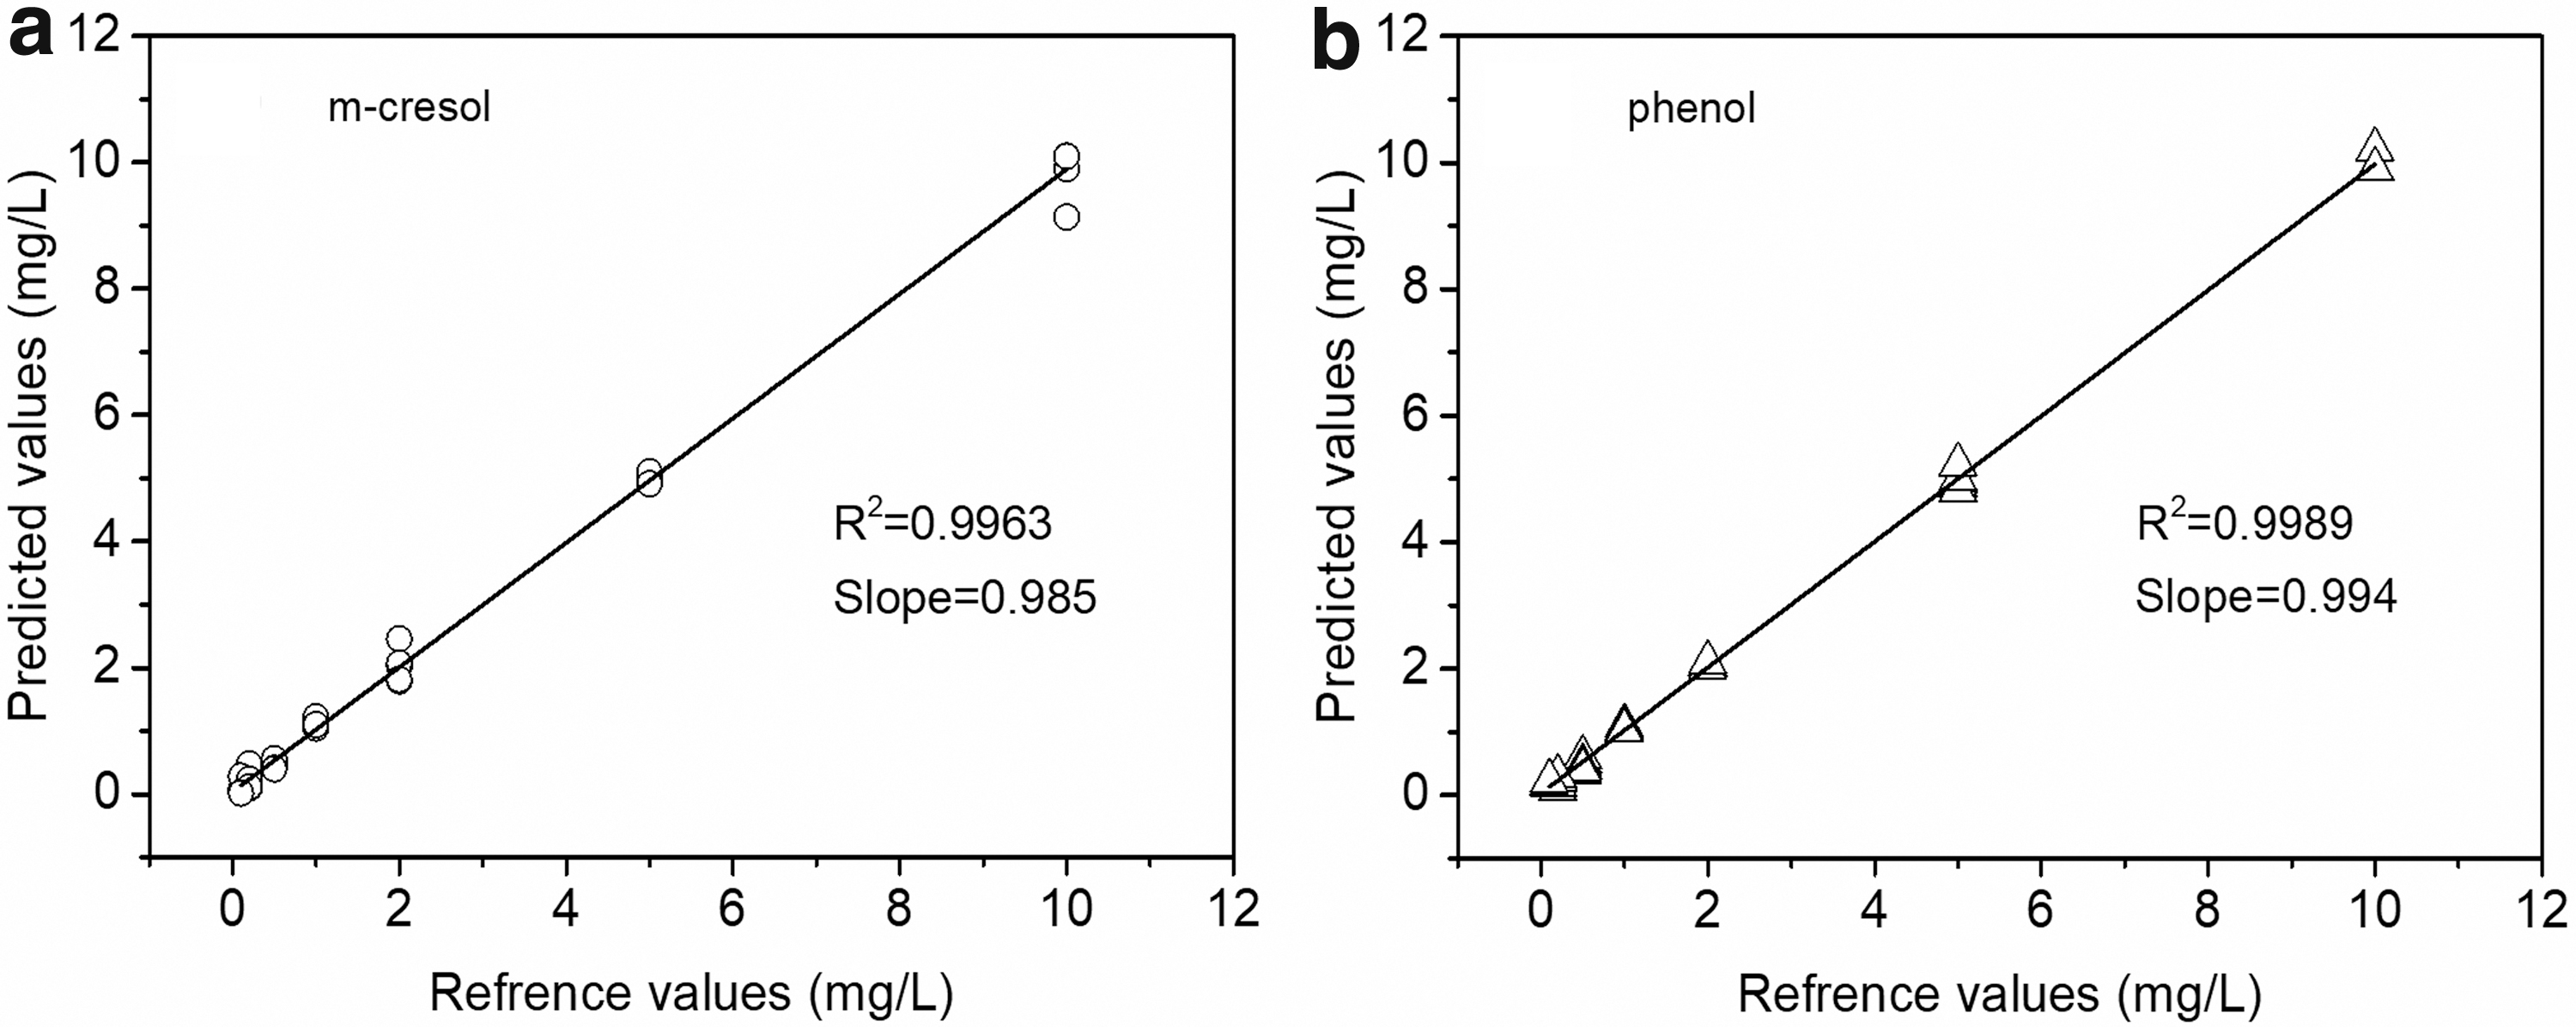
Prediction results of SVM modeling in the mixture of two phenolic compounds (
Simultaneous Determination of Phenol and m-Cresol in Real Samples by Support Vector Machine
In the mixture of two phenolic compounds (m-cresol and phenol), the average values of the predicted concentration and recovery at different phenolic concentrations were calculated (shown in Table 1).
When the concentration of phenol was in the range of 0.5–10.0 mg/L, there was little difference between the predicted values and the reference values, and the recovery ranged from 92.9% to 106.2%. When the concentration of phenol was 0.1 mg/L, the predicted values were significantly different from the reference values, and the average recovery was 192.4%. When the concentration of m-cresol was in the range of 0.2–10.0 mg/L, there was also little difference between the predicted values and the reference values, and the recovery ranged from 89.8% to 114.6%. When the concentration of m-cresol was 0.1 mg/L, the predicted values were also significantly different from the reference values, and the average recovery was 85.5%.
Therefore, when the concentrations of phenol and m-cresol were lower than 0.1 mg/L, the predicted values were significantly different from the reference values. When the concentrations of phenol and m-cresol were higher than 0.5 mg/L, the predicted values were very close to the reference values.
SVM analysis in the mixture of three phenolic compounds
In the mixture of three phenolic compounds (2,4-DCP, m-cresol, and phenol), SVM was adopted to establish the model between the spectra and concentrations of phenolic compounds. The model parameters were optimized by the fivefold crossvalidation method, using the values of C [0.005, 0.01, 0.1, 0.5, 1, 2, 4, 10, 100, and 200] and γ [0.0001, 0.001, 0.01, 0.05, 0.001, 0.0001, 0.125, 0.25, 0.5, and 1]. The optimal parameters were the ones with the smallest MSE. After calculation, in the mixture of three phenolic compounds (2, 4-DCP, m-cresol, and phenol), C = 200, γ = 0.0001, and the Linear kernel were finally selected as the optimal parameters for modeling, with a MSE of 0.96 and an explanatory variance of 0.96.
Moreover, the spectra after wavelet reconstruction (200–400 nm) were adopted. Under these optimal parameter conditions, the SVM model was used to predict the concentrations of three phenolic compounds (2,4-DCP, m-cresol, and phenol) simultaneously. The predicted results are shown in Fig. 3 and Table 2.
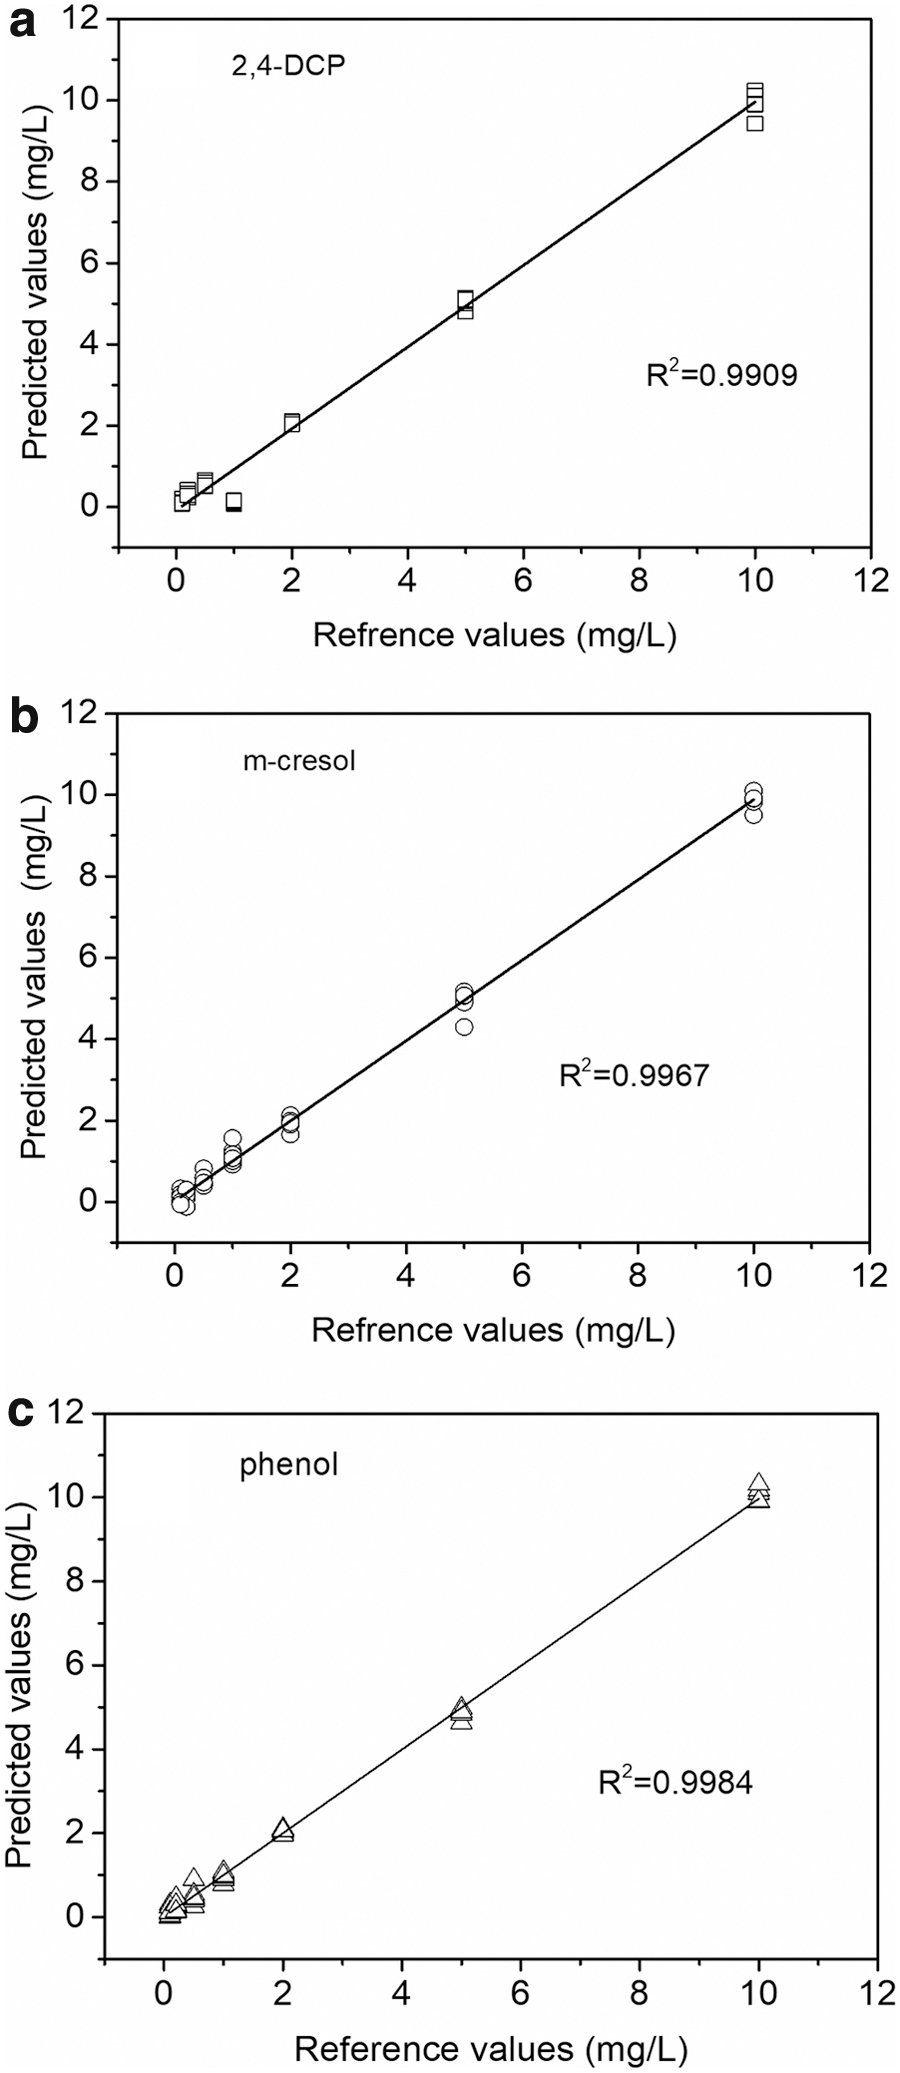
Prediction results of SVM modeling in the mixture of three phenolic compounds (
Simultaneous Determination of 2,4-Dichlorophenol, m-Cresol, and Phenol in Real Samples by Support Vector Machine
As shown in Fig. 3, the predicted values of the SVM model and the reference values showed a good linear relationship (2,4-DCP, R2 = 0.9909; m-cresol, R2 = 0.9967; phenol, R2 = 0.9984). In the mixture of three phenolic compounds (2,4-DCP, m-cresol, and phenol), the average values of the predicted concentrations and recovery at different phenolic concentrations were calculated (shown in Table 2).
When the concentrations of 2,4-DCP were in the range of 2.0–10.0 mg/L, the predicted values had little difference from the reference values, and the recovery ranged from 99.4% to 105.2%. The recovery was poor when the concentration of 2,4-DCP was lower than 2.0 mg/L. When m-cresol concentrations were in the range of 0.5–10.0 mg/L, the predicted values and the reference values showed little difference, and the recovery was within the range of 97.2–115.4%. The recovery was poor when m-cresol concentration was lower than 0.5 mg/L. When the concentrations of phenol were in the range of 0.5–10.0 mg/L, there was little difference between the predicted values and the reference values, and the recovery was within the range of 96.8–103.1%. The recovery was poor when the concentrations of phenol were lower than 0.5 mg/L.
SVM analysis in the mixture of four phenolic compounds
In the mixture of four phenolic compounds (2,4-DCP, 2,4,6-TCP, phenol, and m-cresol), the SVM method was used to establish the model between the spectra of phenolic compounds and their concentrations, and the modeling parameters were optimized by the fivefold crossvalidation method, using values of C [0.005, 0.01, 0.1, 0.5, 1, 2, 4, 10, 100, and 200] and γ [0.0001, 0.001, 0.01, 0.05, 0.001, 0.0001, 0.125, 0.25, 0.5, and 1]. The parameters with the smallest MSE were the optimal parameters.
In the mixture of four phenolic compounds, the spectra after wavelet reconstruction (200–400 nm) were adopted. Under this optimal parameter condition, the SVM model was established to predict the concentrations of phenolic compounds. The predicted results are shown in Fig. 4 and Table 3. It can be seen from Fig. 4 and Table 3 that the results of the simultaneous prediction of four phenolic compounds by the SVM model were satisfactory.
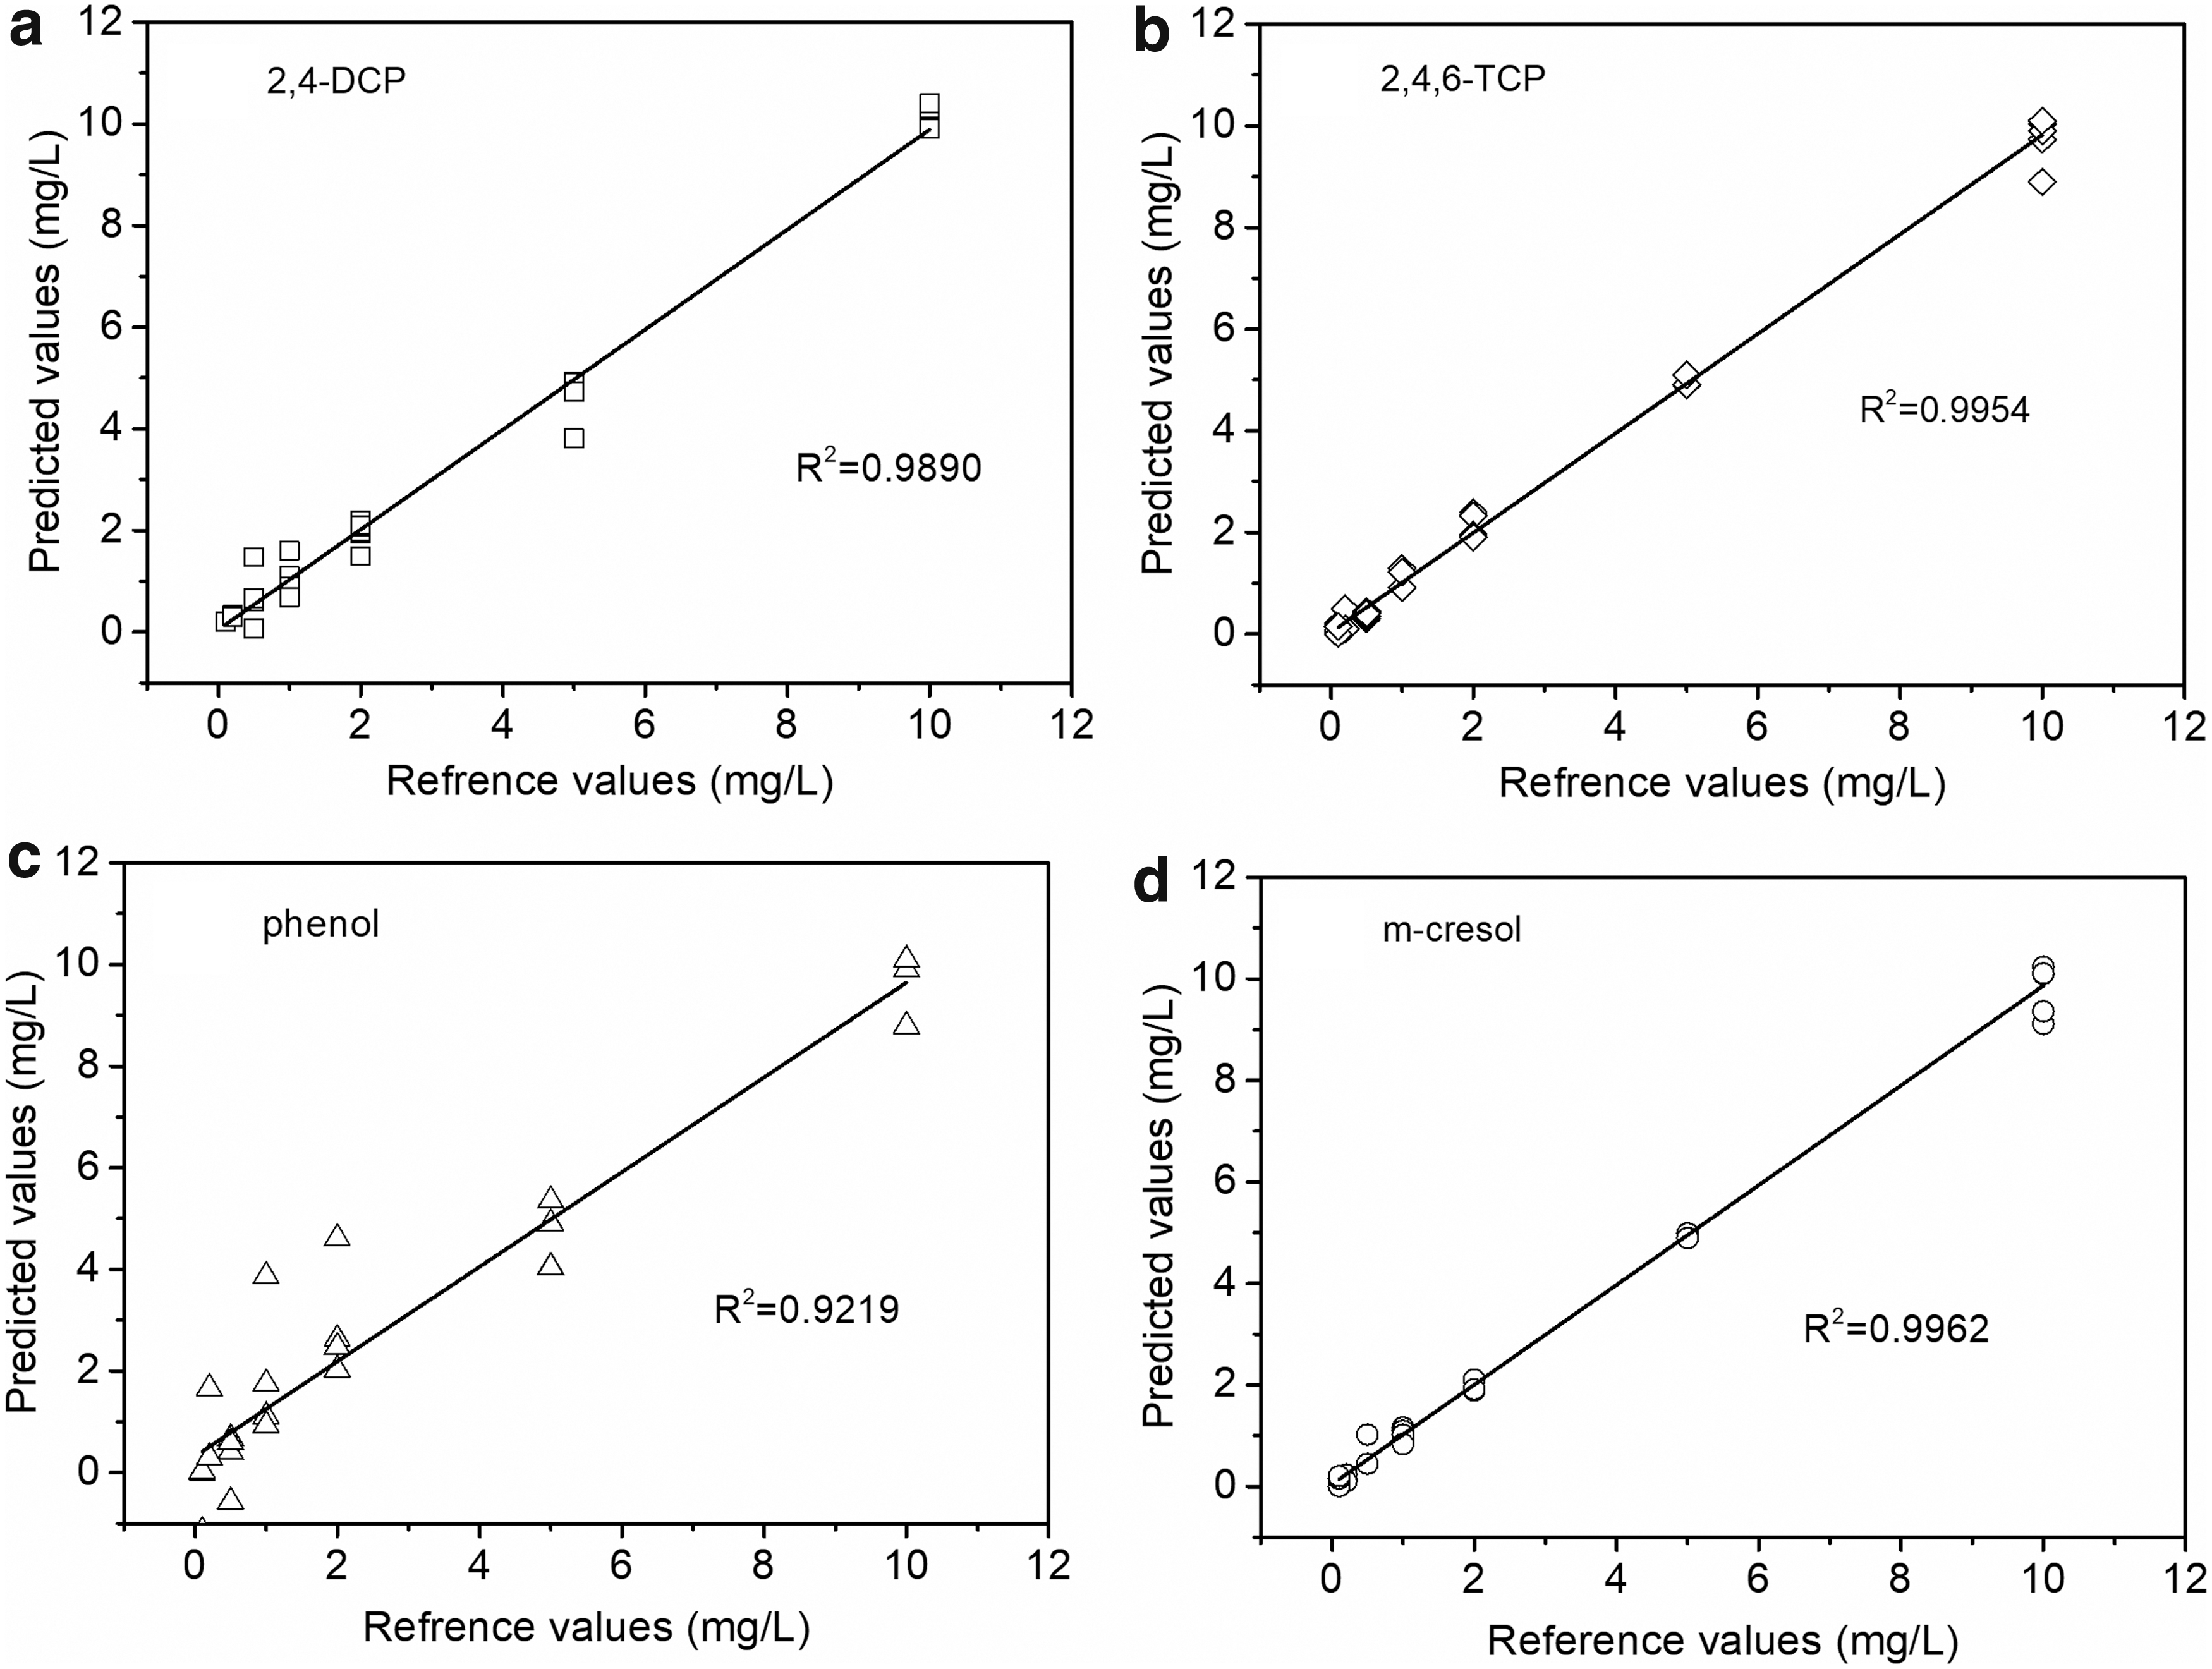
Prediction results of SVM modeling in the mixture of four phenolic compounds (
Simultaneous Determination of 2,4-Dichlorophenol, Phenol, m-Cresol, and 2,4,6-Trichlorophenol in Real Samples by Support Vector Machine
2,4-DCP, 2,4-Dichlorophenol; 2,4,6-TCP, 2,4,6-Trichlorophenol.
As shown in Fig. 4, the predicted values by SVM and the reference values showed a good linear relationship (2,4-DCP, R2 = 0.9890; 2,4,6-TCP, R2 = 0.9954; phenol, R2 = 0.9219; m-cresol, R2 = 0.9962). In the mixture of four phenolic compounds (2,4-DCP, 2,4,6-TCP, phenol, and m-cresol), the average values of the predicted concentration and the recovery at different phenolic concentrations were calculated (shown in Table 3).
As can be seen from Table 3, when the concentrations of 2,4-DCP, 2,4,6-TCP, and m-cresol were in the range of 2.0–10.0 mg/L, the predicted values showed little difference from the reference values, and the recovery ranged from 93.1% to 104.1% for 2,4-DCP, 95.0% to 107.1% for 2,4,6-TCP, and 93.6% to 101.0% for m-cresol. The recovery was poor when the concentrations of 2,4-DCP, 2,4,6-TCP, and m-cresol were lower than 2.0 mg/L. When the concentrations of phenol were in the range of 5.0–10.0 mg/L, there was little difference between the predicted values and the reference values, and the recovery was within the range of 93.0–107.1%. The recovery was poor when the concentration of phenol was lower than 5.0 mg/L.
Feasibility analysis of the determination method
According to the Beer–Lambert Absorbance law, absorbance is equal to the molar absorptivity multiplied by the path length and concentration of the analyte. The molar absorptivity of phenol is ∼1995 M−1 cm−1 at 270 nm, and m-cresol is ∼1778 M−1 cm−1 at 274 nm, which were estimated from the NIST Chemistry WebBook (https://webbook.nist.gov). At 0.1 mg/L, phenol should have a theoretical absorbance of 0.0021 U and m-cresol's theoretical absorbance is 0.0014. On most modern instruments, this approaches the practical limit of measurement, and, thus, noise and stray light become more dominant in the absorbance measurement (Skoog et al., 2007).
The detection limit of the UV-Vis absorption measurement for the phenolic compounds was determined by the method detection limit (MDL) procedure of the US Environmental Protection Agency (https://water.usgs.gov/owq/OFR99-193/detection.html). The specific steps are as follows: a five-point calibration curve (10.00, 5.00, 2.50, 2.00, and 0.50 mg/L) was prepared for each of the phenolic compounds. We then analyzed a check standard (0.80 mg/L) half-way between the two lowest calibration standards and determined the concentration of the check standards using the calibration curve. The MDL was determined by the Student's t-test at n − 1 degrees of freedom multiplied by the standard deviation of the check standard concentration (n was the number of replicates of the check standard, n = 7).
The MDL was the lowest concentration distinguishable from the noise. Accuracy was estimated using the mean recovery of the check standard concentration, and precision was estimated using the relative standard deviation (RSD) of the check standard concentration.
The determined MDL, the corresponding limit of qualification (LOQ), mean recovery, and RSD of the check standard concentration are shown in Table 4. The results showed that the LOQ of the UV-Vis absorption measurement for 2,4-DCP, 2,4,6-TCP, phenol, and m-cresol was 0.97, 0.50, 0.50, and 0.38 mg/L, respectively. When the measured concentration was greater than LOQ, there was a 99% possibility of the substance being measured in the sample, and the confidence of the quantitative result was high. The mean recovery and the RSD of the check standard for the four phenolic compounds were 94.2–117.7% and 3.63–9.22%, which were both within a reasonable range.
Method Detection Limit, Limit of Qualification of the UV-Vis Absorption Measurement for Phenolic Compounds, and Mean Recovery and Relative Standard Deviation of the Check Standard Concentration
Number of replicate determinations of the check standard = 7.
LOQ, limit of qualification; MDL, method detection limit; RSD, relative standard deviation.
It is clear from our data that 0.1 mg/L of 2,4-DCP, 2,4,6-TCP, phenol, and m-cresol is below the MDL, and is also normal for 0.1 mg/L of 2,4-DCP, 2,4,6-TCP, phenol, and m-cresol to have very high or low percent recoveries. It could be concluded that the prediction accuracy and recovery worsened with the increasing number of phenolic compounds and decreasing phenolic compound concentrations (Tables 1–3). As shown in Table 3, when the concentration difference of the 2,4-DCP, 2,4,6-TCP, phenol, and m-cresol was larger, the two phenolic compounds with high concentrations had high prediction accuracy, while the prediction accuracy of two phenolic compounds with lower concentrations was poor.
In some of the experiments (Table 3), the recovery of phenol was extremely high or low, although the concentration of phenol was higher than the LOQ. The similar phenomenon was also observed at the mixture of three phenolic compounds (Table 2), the prediction of phenols with the highest concentration was the most accurate, and the prediction of phenols with the lowest concentration was the worst, especially below the LOQ of the phenolic compounds. In the mixture of two phenolic compounds (Table 1), generally, the recovery of the phenolic compound was within a reasonable range when the concentration of phenolic compound was higher than the LOQ.
However, in the mixture of 2.0 mg/L phenol and 10.0 mg/L m-cresol, low recovery of m-cresol (89.9%) was predicted. In the mixture of 10.0 mg/L phenol and 2.0 mg/L m-cresol, high recovery of m-cresol (114.6%) was predicted. The reason for this phenomenon may be that the SVC and SVR models were affected by the excessive concentration differences between different phenolic compounds (Leng et al., 2017; Wang et al., 2019). As shown in Tables 1–3, when the concentrations of phenolic compounds were higher than 5.0 mg/L, whether in the mixture of two, three, or four phenolic compounds, the recovery was in the range of 93.0–107.1%. In different kinds of mixtures of phenolic compounds, the prediction accuracy was high when the concentration of phenolic compounds was higher than 5.0 mg/L.
In the Chinese standard for integrated wastewater discharge (GB 8978-1996), the maximum permissible emission concentrations of phenol, m-cresol, 2,4-DCP, and 2,4,6-TCP are 1.0, 0.5, 1.0, and 1.0 mg/L, respectively. In the Chinese discharge standard of pollutants for municipal wastewater treatment plants (GB 18918-2002), the maximum permissible emission concentrations (daily average) of phenol, m-cresol, 2,4-DCP, and 2,4,6-TCP were 0.3, 0.1, 0.6, and 0.6 mg/L, respectively.
When the water in drinking water sources was polluted by phenolic compounds, the concentrations of phenolic pollutants in the water were bound to rise sharply, and the concentrations were much higher than the standard values stated above. According to the above analysis on the predicted concentration and the recovery at different phenolic concentrations, it was feasible to use wavelet analysis and SVM to predict sudden pollution accidents caused by the phenolic compounds.
Conclusions
In the present study, a new method was developed by using continuous wavelet transform and SVM to predict the concentration of phenolic compounds in water.
In the mixture of two (m-cresol, phenol), three (2,4-DCP, m-cresol, and phenol), and four (2,4-DCP, 2,4,6-TCP, phenol, and m-cresol) phenolic compounds, the wavelet reconstruction effect of phenolic compounds improved with decreasing wavelet decomposition layers. In the mixture of different phenolic compounds, the reconstruction ERROR of the wavelet basis was always less than 0.045, PSNR was always more than 15, MSE was always less than 0.025, and the correlation coefficient, R, was always greater than 0.999. After wavelet decomposition and reconstruction, the spectra of phenolic compounds were smoother and noise elimination was obvious.
In the mixture of two, three, and four phenolic compounds, the prediction results of phenolic compound concentration using the SVM model were satisfactory. In the mixture of two phenolic compounds, when the concentrations of m-cresol and phenol were in the range of 0.5–10.0 mg/L, recovery was within the range of 89.8–114.6% for m-cresol and phenol. In the mixture of three phenolic compounds, when the concentrations of 2,4-DCP, m-cresol, and phenol were in the range of 2.0–10.0 mg/L, the recovery was within the range of 97.2–105.2%. In the mixture of four phenolic compounds, when the concentrations of 2,4-DCP, 2,4,6-TCP, phenol, and m-cresol were in the range of 5.0–10.0 mg/L, the recovery was within the range of 93.0–107.1%.
The methods proposed in the present work provide an alternative method to warn of sudden water pollution caused by phenolic compounds.
Footnotes
Author Disclosure Statement
No competing financial interests exist.
Funding Information
This work was supported by the Open Project of Nanjing University & Yancheng Academy of Environmental Protection Technology and Engineering, Jiangsu Industrial Technology Research Institute, Research Institute of Water Environment Engineering Technology (Yancheng) (NDYCKF201707), the National Natural Science Foundation of China (51208163, 21876040), and the Fundamental Research Funds for the Central Universities (PA2019GDQT0010, JZ2018HGTA0214).
References
Supplementary Material
Please find the following supplemental material available below.
For Open Access articles published under a Creative Commons License, all supplemental material carries the same license as the article it is associated with.
For non-Open Access articles published, all supplemental material carries a non-exclusive license, and permission requests for re-use of supplemental material or any part of supplemental material shall be sent directly to the copyright owner as specified in the copyright notice associated with the article.