
Abstract
Recently, the endocrine-disrupting and carcinogenic compound di-(2-ethylhexyl) phthalate
Introduction
Phthalic acid esters (PAEs) are a group of environmental pollutants and endocrine-disrupting compounds (He et al., 2013). PAEs are widely detected in the environment, such as in surface water, marine sediments (Yuan et al., 2010; Rabet et al., 2019), municipal wastewater treatment plants (WWTPs) (Huang et al., 2010), and sludge (Chang et al., 2007). The compound di-(2-ethylhexyl) phthalate (DEHP) is one of the most important PAEs that is widely used as a plasticizer in building materials and as an additive in cosmetics production (Zhao et al., 2018). DEHP has received increasing attention in recent years due to its interference with the reproductive system (Shih et al., 2018; Aydemir et al., 2019). It is listed as a priority pollutant, along with di-n-butyl phthalate (DBP), diethyl phthalate (DEP), and di-n-octyl phthalate (DOP), by the U.S. Environmental Protection Agency (Chao and Cheng, 2007). The DEHP concentration in domestic wastewater ranges from 6.71 to 464 μg/L (Giulivo et al., 2016). The concentration of DEHP in municipal wastewater ranges from 150 μg/L to 8.5 mg/L (Bergé et al., 2014). The DEHP concentrations in sewage sludge have been found to range from 1200 to 1250 mg/kg (Xu et al., 2017).
DEHP has also been detected in WWTPs and reported in influent, effluent, and dewatered sludge (Huang et al., 2008; Pham et al., 2011). This indicated that DEHP could be further introduced into the soil through water and sludge applications (Roslev et al., 2007; Huang et al., 2008; Pham et al., 2011). Due to its carcinogenic and teratogenic effects on humans (Xu et al., 2017; Zhang et al., 2018), DEHP should be effectively removed from WWTPs to minimize the risk to human health. Researchers have developed a range of approaches, including physical, chemical, and biological methods, to remove DEHP. Although physical and chemical methods are effective in removing contaminants, they can lead to secondary contamination. Therefore, the metabolic breakdown of DEHP by microorganisms is currently considered to be one of the major routes of DEHP removal (Wu et al., 2013; Iman et al., 2017). Several degradation bacteria belonging to the genera—Sphingomonas, Pseudomonas, Rhodococcus, Microbacterium, and Gordonia—have been isolated from various environments (Wu et al., 2011; Wang et al., 2012, 2019; Jin et al., 2014; Zhao et al., 2018). However, DEHP has a low water solubility and high octanol–water partition coefficient (logKow = 7.5) (Turner and Rawling, 2000), which makes DEHP biodegradation difficult. Hence, it is necessary to explore effective enhancement methods for the biodegradation of DEHP.
To date, most of the DEHP biodegradation research has been focused on aerobic degradation (Yang et al., 2014; Zhao et al., 2018; Wang et al., 2019), and the published literature on anaerobic degradation is rare. Even though aerobic degradation is a fast way to remove DEHP, it is also energy intensive. Compared with aerobic degradation, anaerobic treatment provides many benefits, including lower energy requirements, methane generation, and lower biological sludge production (Petropoulos et al., 2016). Therefore, further study should be conducted to improve the efficiency of the anaerobic degradation of DEHP.
Previous studies have revealed that phthalate esters with longer alkyl chains (e.g., DOP and DEHP) were more difficult to degrade than phthalate esters with shorter alkyl chains (e.g., DEP and DBP) (Jianlong et al., 2000; Chang et al., 2004). Studies (Chang et al., 2004; Chao and Cheng, 2007; Rafael-Vázquez et al., 2018) have shown that some bacteria can degrade phthalate esters with longer alkyl chains, such as DEHP, but with poor efficiency. It is necessary to develop methods to enhance DEHP degradation and understand the anaerobic degradation process. The existing evidence suggests that more biodegradation and mineralization can be expected using cometabolic substrates (Saratale et al., 2009). This is because multiple metabolic capacities can increase the number of catabolic pathways available for contaminant biodegradation (He et al., 2013).
In recent years, cometabolism has been reported as being used for the bioremediation of refractory organic matter, and it has achieved favorable results (Saratale et al., 2009; Huang et al., 2010; Dong et al., 2011). One study showed that the addition of yeast can stimulate DEHP degradation (Chang et al., 2005), but little is known about the microbial process involved in degradation.
Microorganism is the main contributor for pollutant removal. The microbial community structure and activities play an important role in maintaining the stable operation of a system (Wen et al., 2015). Therefore, a better understanding of microbial community dynamics with regard to DEHP wastewater in a bioreactor will result in more effective reactor designs and improve DEHP wastewater treatment efficiency. The goals of this study are to: (1) investigate whether cometabolic substrates (glucose and yeast exact) can enhance DEHP biodegradation in an anaerobic bioreactor, (2) understand how cometabolism affects the performance of a bioreactor and the associated microbial communities, and (3) identify the predominant microorganisms responsible for DEHP anaerobic degradation. The results from this study can provide useful information for DEHP biodegradation in practical engineering applications, especially for full-scale WWTPs.
Materials and Methods
Anaerobic reactor and synthetic DEHP wastewater
The DEHP used in this study was the analytical standard with a purity >99.0% (Sigma Chemical Co.). All of the solvents used for the dilution and extraction of DEHP were of high-performance liquid chromatography quality or better. A laboratory-scale (1.54 L) extended granular sludge bed (EGSB) bioreactor was built using Plexiglas, as described in Fig. 1. This EGSB reactor was studied for 293 days, which was divided into three successive phases. Phase I: domestication and start up with a gradual increase in DEHP concentrations (0.2, 0.4, and 0.6 mg/L) during 1–181 days; Phase II: enhancement with glucose (concentrations of 1, 2, 5, and 10 g/L) during 182–239 days, and the DEHP concentration was 6 mg/L. Phase III: enhancement with yeast exact (concentrations of 0.1, 0.2, 0.3, and 0.4 g/L) during 239–293 days. In Phase III, the glucose was not added, and the DEHP concentration was 6 mg/L.
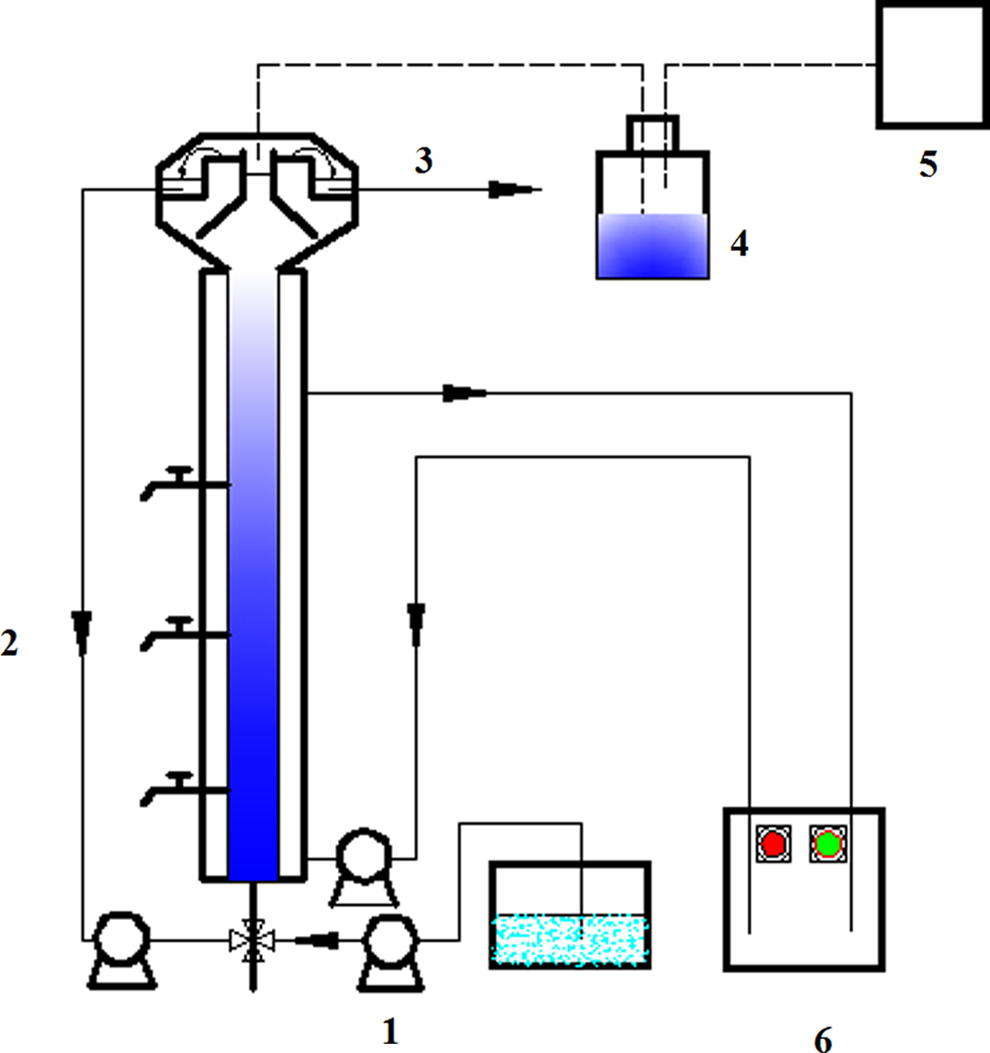
Schematic diagram of the EGSB reactor. (1) Influent peristaltic pump; (2) Recirculation system; (3) Effluent; (4) Water-sealed; (5) Gas collection unit; (6) Water bath. EGSB, extended granular sludge bed.
The DEHP concentrations designed in this experiment were based on studies related to DEHP environmental concentrations and microbial physiology and growth (Luo et al., 2008; Pham et al., 2011; Iman et al., 2017). The ratio of glucose and yeast extract to DEHP was chosen based on microbial physiology and growth. In addition, the concentration ladders of glucose and yeast were according to the current reports regarding enhanced DEHP biodegradation (Saratale et al., 2009; Xu and Chen, 2012).
Seed sludge was collected from a full-scale sequencing batch reactor used to treat municipal wastewater. The inoculated sludge had a mixed liquor volatile suspended solids (MLVSS) concentration of 17.4 mg/L, and ∼0.6 L was utilized to start up the EGSB reactor. During phases II and III, the influent concentration of DEHP was maintained at 0.6 mg/L. Peristaltic pumps (Huasheng, China) were used to feed the EGSB reactor, with a constant influent flow rate and a hydraulic retention time of 24 h. The operational temperature was maintained at 35 ± 2°C using a water bath. The pH was controlled within the range of 6.8–7.2 by adding NaOH or HCl. The liquid upflow velocity was kept stable at 1.5 m/h using a peristaltic pump. NH4Cl and KH2PO4 were added to maintain a C:N:P = 250:5:1. A trace metal solution was also added that contained FeSO4·7H2O 5 g, CuSO4·5H2O 100 mg, MnCl2·4H2O 500 mg, KI 80 mg, CoCl2·6H2O 200 mg, H3BO4 1 g, and ZnCl2 1 g in 1 L of DEHP wastewater.
Sampling and chemical analysis
The EGSB reactor performance was primarily evaluated using the removal amounts of chemical oxygen demand (COD) and DEHP. The effluent quality of COD and DEHP was monitored every day. Granule sludge samples were selectively collected based on the performance of the EGSB reactor and stored at −80°C for further DNA analysis. COD was measured according to a previous study (Xu and Chen, 2012). The extraction and pretreatment of DEHP from the samples were presented in a previous study (Sun et al., 2008). The DEHP was analyzed using an Agilent 6890N GC coupled with an Agilent 5973 mass spectrometer detector and HP-5MS capillary column (Agilent Co.). The instrumental parameters consisted of an injector temperature of 250°C, an ion source temperature of 180°C, and the order of the temperature program and times was the following: the column started initially at 60°C and was maintained for 2 min, then increased to 290°C at a rate of 3°C/min and held for 30 min. The carrier gas was helium at a constant flow rate of 1.2 mL/min. The 1 μL sample was injected in the splitless mode.
DNA extraction and PCR amplification
The total DNA was extracted from the sludge samples using the Power Soil DNA Isolation Kit (MOBIO Laboratories, Inc.) according to the manufacturer's protocol. PCR amplification was conducted using the Bio-Rad thermal Cycler. The primers for the bacteria were BAC27F (5′-AGAGTTTGATCCTGGCTCAG-3′) and BAC1492R (5′-GGTTACCTTGTTACGACTT-3′). The primers for archaea were ARC25F (5′-CYGGTTGATCCTGCCRG-3′) and ARC958R (5′-YCCGGCGTTGAMTCCAATT-3′) (Li et al., 2014). The reaction volume contained a PCR Mix 15 μL, DNA templates 1 μL, primers 0.2 μL, and ddH2O 25 μL. The final concentrations of the DNA and primers in the PCR mix were ∼100 ng/L and 10 μM, respectively. The DNA amplification procedure for both bacteria and archaea was in the following order: The procedure began with an initial denaturation for 5 min at 95°C, followed by 30 cycles of denaturation at 94°C for 30 s, annealing at 56°C for 1 min, and extension at 72°C for 3 min. The final extension step was 10 min at 72°C. The PCR products were treated on 1% agarose gel, and the concentrations and quality were checked on a NanoDrop ND-1000 (Thermo Fisher Scientific). The DNA was further purified using the PCR Cleanup Purification Kit (Transgen, China).
Fluorescence in-situ hybridization
The fluorescence in situ hybridization (FISH) analysis was used to investigate the distribution of archaea and bacteria in the EGSB reactor. Granule sludge samples (170, 230, 292 days) were collected at each phase when the reactor was stable. The samples were fixed in 4% paraformaldehyde at 4°C for 1–3 h. The 9 μL hybrid buffer was slowly added to the sample surface on the slide, and the 1 μL probe was mixed with the hybrid solution. The abovementioned slides were removed from the wet box of hybridization and eluted in the eluent at 48°C for 20 min. The slides were then placed in 4°C ultrapure water, the remaining eluent was washed away, and the slides were then taken out and dried in a dark place. The probes used in the FISH analysis were Arc915 (for archaea) and EUB338 (for bacteria). The laser scanning confocal microscope (LSM510 Zeiss, Germany) was used for observation and imaging. The images were treated using ImageJ software.
q-PCR analysis
According to the performance of the EGSB reactor, the granule sludge samples (at 45, 112, 159, 181,199, 214, 225, 239, 252, 264, 280, and 292 days) were selected for q-PCR. The copy numbers of total bacterial and archaeal 16S rRNA genes from the sludge samples were determined by q-PCR on an ABI 7500 real-time PCR system instrument (Applied Biosystems). The purified PCR products were ligated into pMD18-T vectors (TaKaRa, Japan) and transformed into competent Escherichia coli DH5a (TaKaRa), as described in the manufacturer's protocol. Plasmid DNA was extracted using the Plasmid Extraction Mini Kit (Transgen). The 20 μL reaction mixture contained 10 μL of SYBR Premix Ex Taq™ II (TaKaRa), 0.6 μL of each primer (finial concentration in the PCR mixture is 10 μM), 1 μL of genomic DNA (80 ng/L), and 7.8 μL ddH2O. The procedures were as follows: preheated at 95°C for 5 min, then denatured at 94°C for 1 min, annealed at 56°C for 1 min, extended at 72°C for 3 min for 30 cycles, and finally, extended at 72°C for 8 min. All of the standard plasmids and 16S rRNA samples were repeatedly measured in triplicate. The plasmid standard curves were obtained using 10-fold serial dilutions of the plasmid DNA.
Illumina MiSeq sequencing and postanalysis
The granule sludge samples (at 45, 112, 159, 181,199, 214, 225, 239,252, 264, 280, and 292 days) were collected for Illumina MiSeq. The V3–V4 region of 16S rDNA gene was amplified. The total DNA extraction from the samples was the same as described in the paragraph of section 2.3. The primers for bacteria (Caporaso et al., 2012) and archaea (Wang et al., 2015) were employed in the PCR reactions. Both forward and reverse primers were tagged with adapter, pad, and linker sequences. Each barcode sequence was added to the reverse primer for pooling multiple samples in one run of the MiSeq sequencing (Zhou et al., 2015). The amplified products were loaded on 1.2% agarose gel, and the purification was performed using the E.Z.N.A.TM Gel Extraction Kit (OMEGA Bio-Tek, Inc.). The DNA concentration and quality were determined using the FTC-3000™ real-time PCR. The amplicons were then used for Illumina MiSeq sequencing. After sequencing, all of the raw reads were analyzed using the quantitative insights into microbial ecology (QIIME) standard pipeline (Fadrosh et al., 2014) to trim off the low-quality reads, adaptors, barcodes, and primers. The remaining 16S rRNA sequences were clustered into operational taxonomic units (OTUs) using UCLUST by setting a 0.03 distance limit. By using the cluster file, the Shannon diversity index was calculated in MOTHUR (Wen et al., 2015) (V1.33.3).
Statistical analysis
All of the data were analyzed using the SPSS statistical software package (Version 22.0) by a one-way analysis of variance (ANOVA) followed by least significant difference tests. The graphical work was conducted using Origin 8.0. The correlations among the microbial community, cometabolism, and DEHP removal and their interactions were tested using a two-way ANOVA at p < 0.05 and p < 0.01. All the parametric tests were followed by Tukey's post hoc tests after significant main effects.
Results
Performance of the EGSB reactor
The COD and DEHP removal efficiency were used to evaluate the performance of the EGSB reactor. The operations of the EGSB reactor were divided into three phases, and it continuously operated for 293 days (Fig. 2). Figure 2b–e shows the detailed image when the reactors reached the stable condition. During phase I (1 to 181 days), the DEHP removal rate gradually increased and reached 55% on day 112, when the DEHP concentration was 0.2 mg/L. During the first few days (from 1 to 4 days), the DEHP removal rate reached 5.5%, which was possibly caused by the adsorption of the granular sludge, not biological degradation. There was a sudden drop on day 5. The DEHP concentration had an obvious impact on the reactor's performance, and two dramatic declines were found in 113 and 161 days. The DEHP removal rates quickly decreased from 55.7% to 31.3% when the DEHP concentration increased from 0.2 mg/L to 0.4 mg/L. The lowest DEHP removal rate of 35.3% was achieved with a continuously elevated DEHP concentration (0.6 mg/L). The change trend for the COD removal was similar to the DEHP removal. A possible reason was that the DEHP was the primary contributor to the COD in this study.
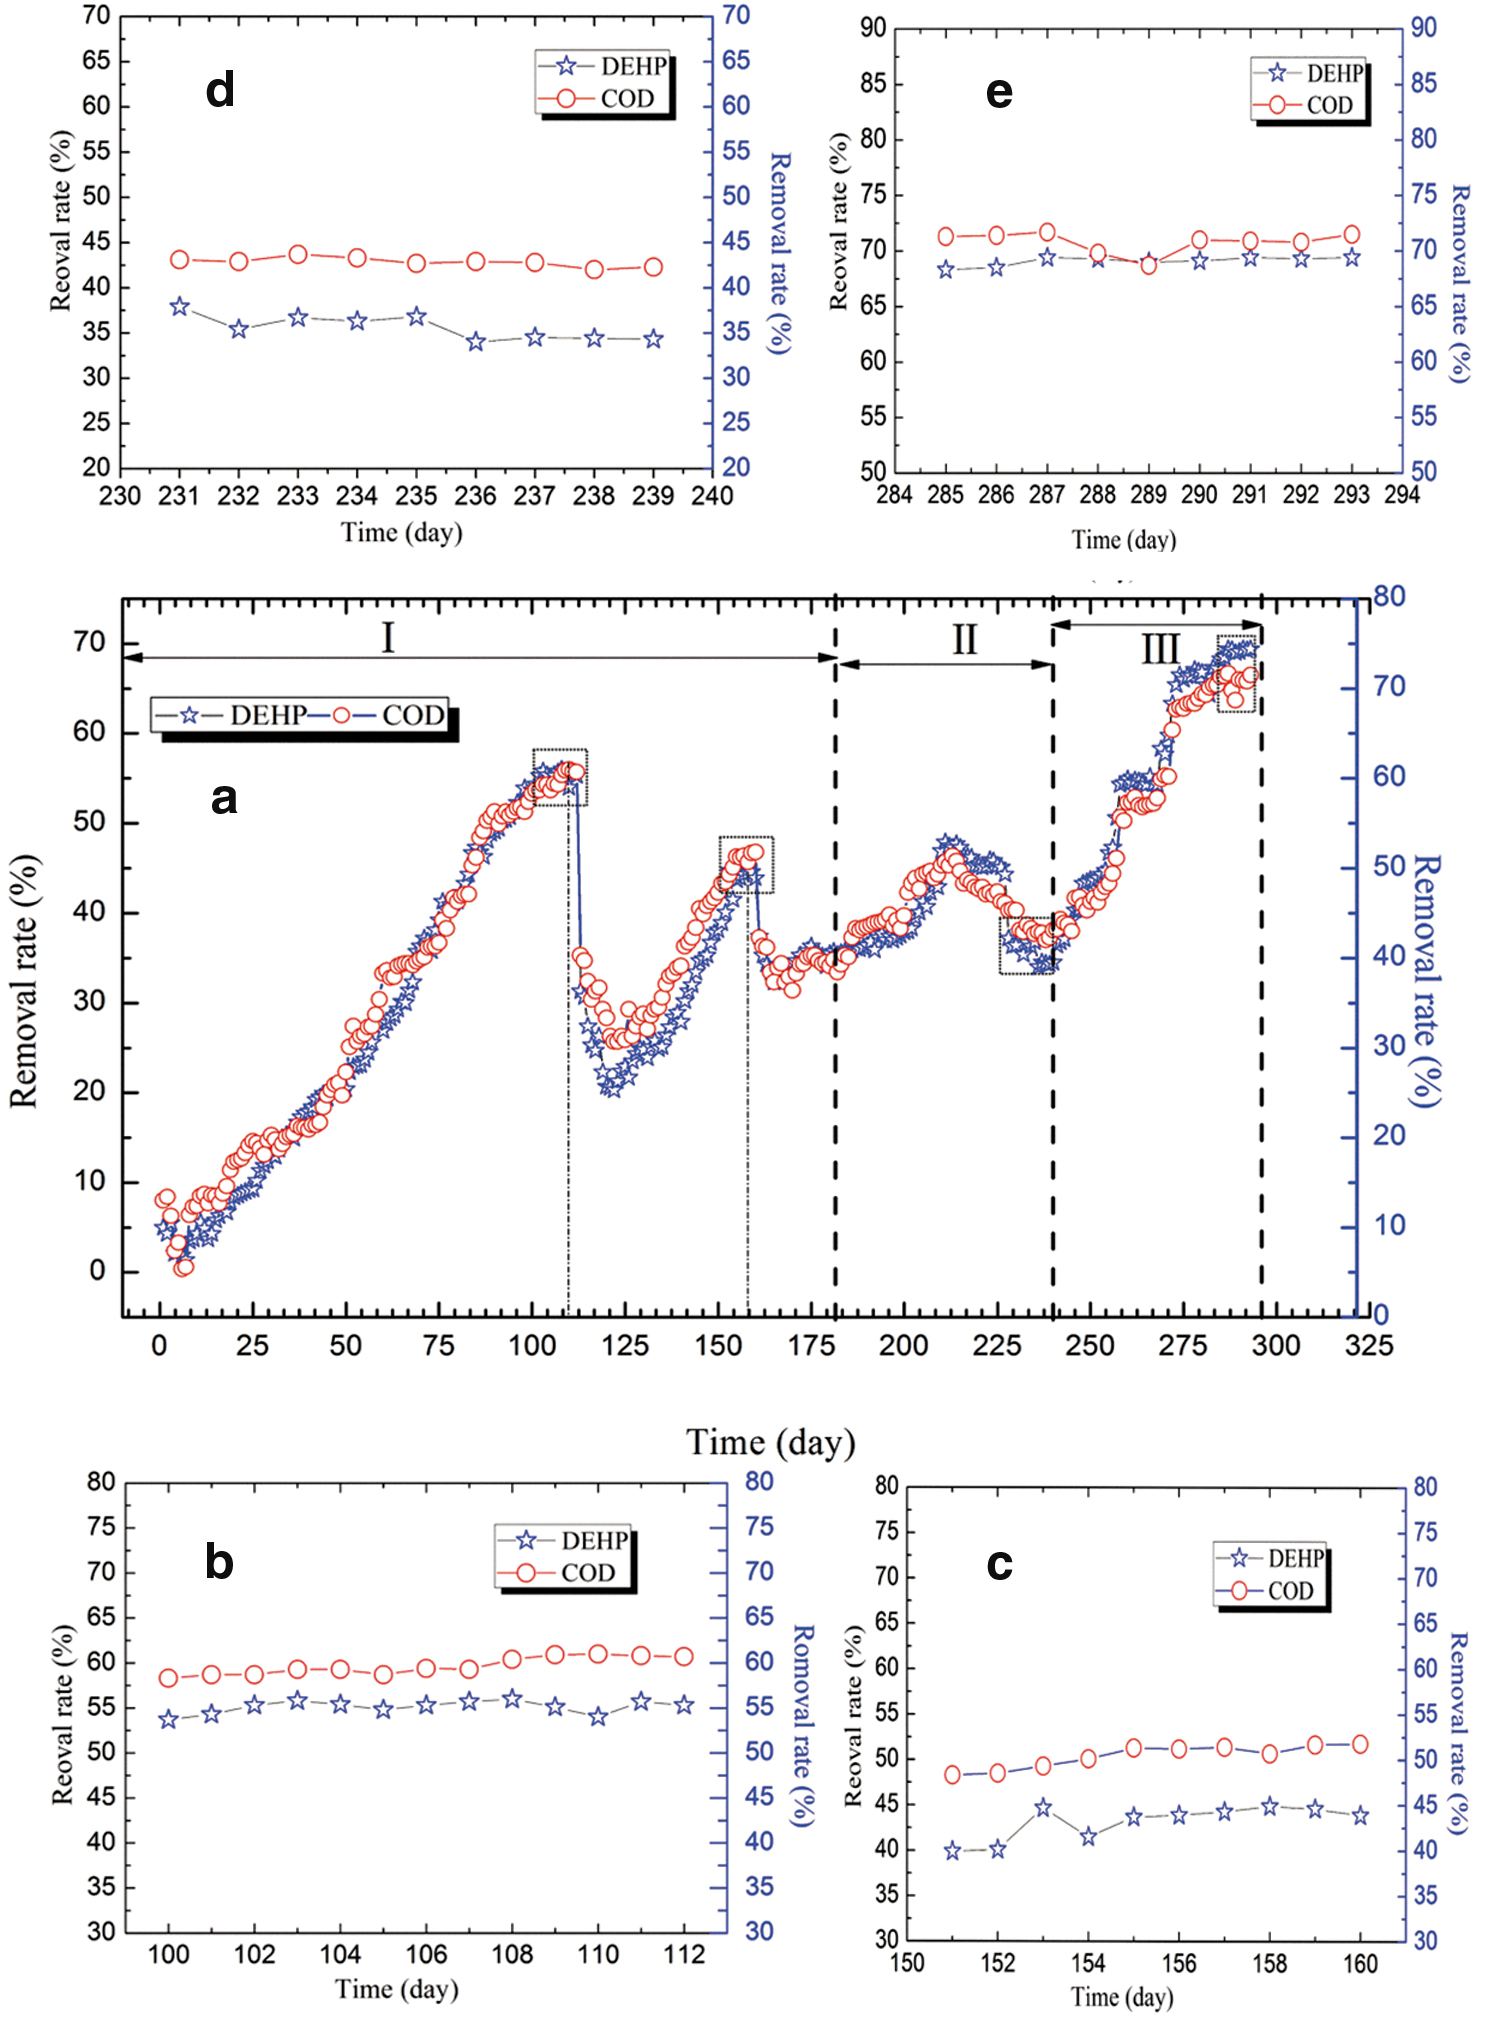
Performance of the EGSB reactor for the removal of COD and DEHP throughout the trial
The DEHP removal rate slightly increased from 35.3% to 37.3% when the 1 g/L glucose was added (Fig. 2). When the glucose concentration increased to 2 g/L, the enhancement effect was obvious, and a 47.6% degradation rate was achieved. However, the degradation rate dropped to 34.5% when the glucose concentration exceeded 5 g/L. These results suggest that low concentrations of glucose could improve DEHP degradation, while high concentrations may inhibit DEHP degradation. Subsequently, during phase III, varying concentrations of yeast, ranging from 0.1 to 0.4 g/L, were added to the EGSB reactor. Figure 2 shows that the presence of the yeast extract significantly promoted DEHP degradation under any tested concentration. The highest DEHP degradation rate of 70.1% was found in 287 days when the yeast extract concentration reached 0.4 g/L.
Figure 3 shows the average DEHP removal during different operating periods when the reactor was running steadily. When the DEHP concentration increased from 0.2 to 0.6 mg/L, the degradation rate decreased significantly. The enhancement effect was not significant when 1 g/L glucose (p > 0.05) was added, whereas the addition of 2 g/L glucose significantly promoted DEHP degradation. The inhibitory effect of glucose on DEHP degradation was observed when the added amount of glucose was 10 g/L. Yeast significantly enhanced DEHP degradation (p < 0.05).
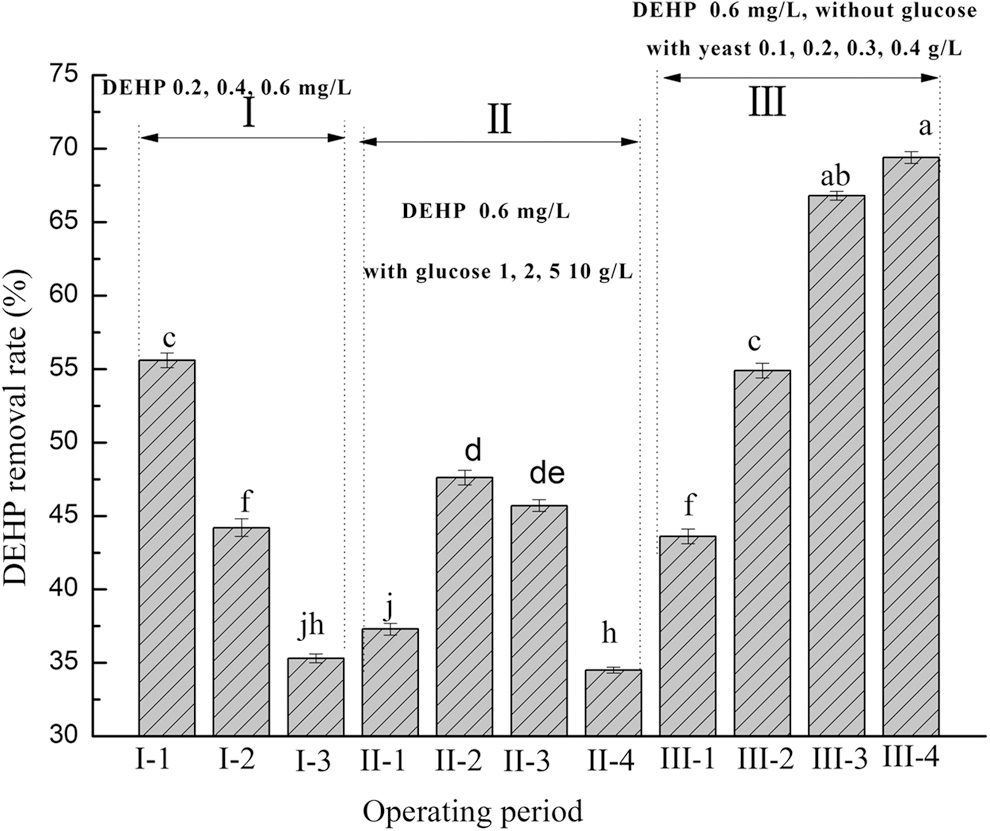
Average DEHP removal at different operating periods with reactor steady running. I (-1,2,3,4): phase I with DEHP 0.2, 0.4, and 0.6 mg/L; II (-1,2,3,4): phase II with glucose 1, 2, 5, and 10 g/L, the DEHP concentration was 6 mg/L; III (-1,2,3,4): phase III with yeast 0.1, 0.2, 0.3, and 0.4 g/L, the glucose was not added and the DEHP concentration was 6 mg/L.
Fluorescence in situ hybridization
The distribution and structure relationship between the archaea and bacteria in the granular sludge were roughly investigated by FISH. Figure 4 shows the quantity and relationship of the archaea and bacteria during the three distinct phases. Figure 4a shows that the bacteria (green) were dominant, and the archaea (blue) were rarely detected in phase I. With the addition of the cometabolism substrates, the quantity of archaea increased. The archaea were outside of the granular sludge, while the bacteria were inside the granular sludge (Fig. 4b). The quantity of archaea steadily increased when yeast was added in phase III. The archaea and bacteria were closely bound together (Fig. 4c), which may be related to the DEHP removal efficiency.
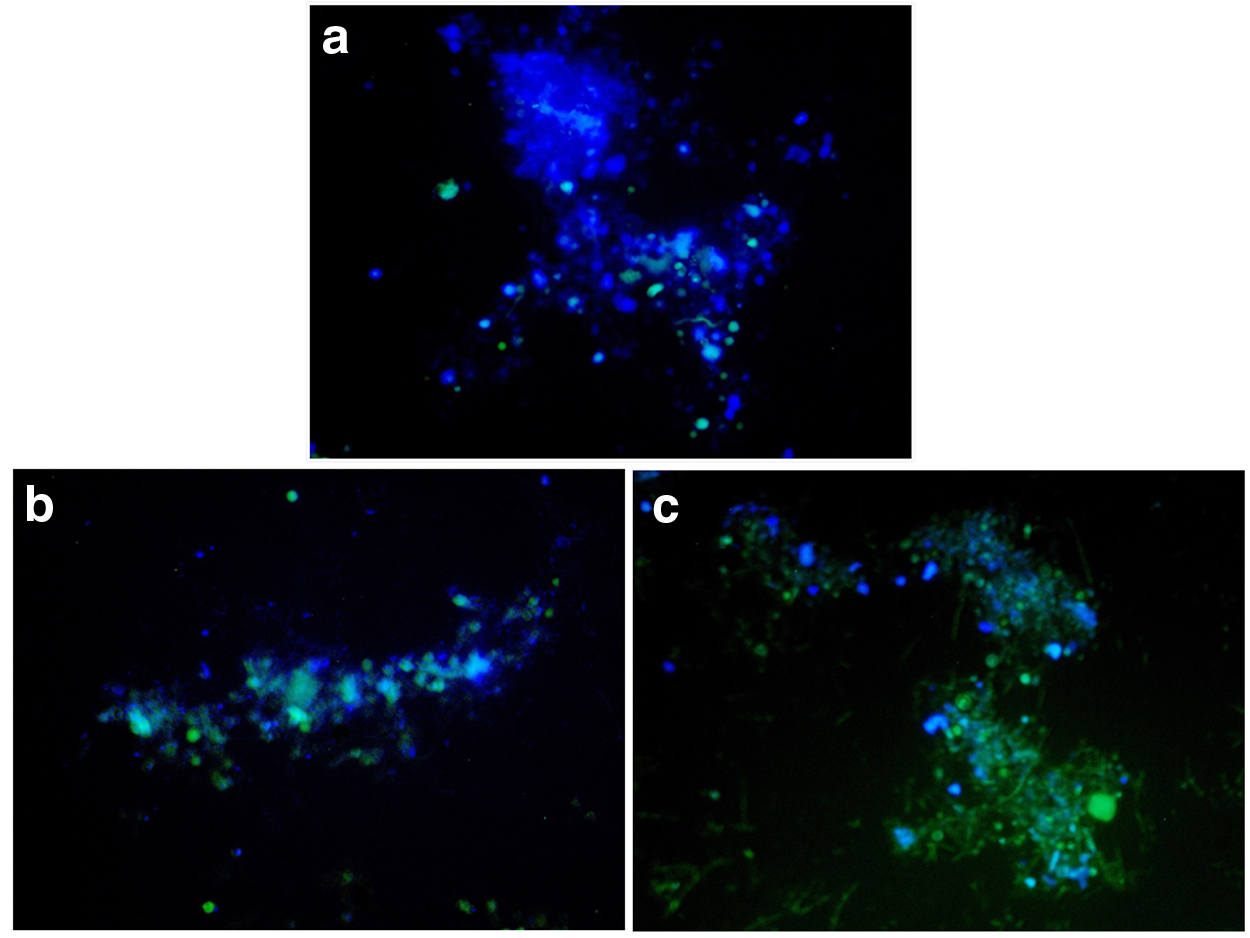
FISH images of archaea and bacteria at different phases.
q-PCR of bacteria and archaea
The quantification of the bacteria and archaea was conducted by q-PCR (Fig. 5). During the domestication period, the amount of the total bacteria dropped from 4.7 × 10⁸ gene copies per gram VSS (45 days) to 2.1 × 10⁸ gene copies per gram VSS (181 days) when the DEHP concentration increased from 0.2 mg/L to 0.6 mg/L (45 to 181 days). Although the fluctuations were found during phases II and III, the quantity of bacteria recovered reached 2.6 × 10⁸ gene copies per gram VSS in 292 days. For the archaea, there was also a quick decline in the domestication period and a progressive recovery to 2.0 × 10⁷ gene copies per gram VSS at the end of phase III. On the whole, the change trend for the bacterial quantity was not completely consistent with the DEHP removal efficiency. Therefore, the DEHP removal was probably related to the change in the microbial community structures, which will be discussed later.

Absolute quantification of the 16S rRNA gene concentration of bacteria and archaea on the different sampling dates. Error bars indicate standard deviation (n = 3).
Bacterial community dynamics in the bioreactor
To understand the microbial populations responsible for DEHP anaerobic degradation, the phylogenetic composition of both the archaea and bacteria were examined using MiSeq sequencing. The bacterial community composition at the phylum and genus levels is shown in Fig. 6. An obvious difference in the bacterial community was observed between 45 and 292 days. Overall, Chlorobi, Actinobacteria Thermotogae, and ɛ-Proteobacteria showed a decreasing trend. In contrast, Spirochaetes and δ-Proteobacteria presented an increasing trend.

Bacterial community composition during the operating period.
Most importantly, Bacteroidetes and Firmicutes were predominant throughout the trial (Fig. 6a). At the preliminary stage of phase I, Firmicutes, Bacteroidetes, Proteobacteria, and Actinobacteria together represented 50% of the bacterial community. Proteobacteria accounted for 28% of the total bacterial population, and five Proteobacteria classes (α-, β-, γ-, δ-, and ɛ-Proteobacteria) were present. With the elevated DEHP concentrations, the abundance of Chlorobi and Thermotogae decreased 50% and 33%, respectively, until 181 days. In phase II, Chlorobi and Actinobacteria continuously decreased and dropped to 4% and 3%, respectively, in 239 days, whereas the abundance of Spirochetes increased to 11%. It was also notable that δ- Proteobacteria dramatically increased and reached 14% in 239 days. In phase III, δ-Proteobacteria and Spirochetes kept increasing and became the dominant phyla in the reactor, with a relative abundance of 17% and 13%, respectively.
Figure 6b shows the bacterial community structure at the genus level. The results demonstrated that the addition of glucose and yeast as cometabolic substrates caused an apparent shift in the bacterial community distribution. On the beginning day (45 days), the community was abundant, and many genera were involved. These included Clostridium, Tepidimicrobium, Bellilinea, Thauera, and Actinobaculum. In phase II, Paludibacter, Thermotoga, and Actinobaculum began to decrease, whereas Desulfurella, Desulfococcus, and Desulfobacter quickly increased. With the addition of yeast during phase III, Hyphomicrobium disappeared from the reaction system, and Actinobaculum and Levilinea dramatically dropped.
In contrast, Desulfurella, Desulfococcus, Desulfobacter, and Spirochaeta become predominant in the EGSB system, accounting for 53% of the total bacterial population. The corresponding abundances of Desulfurella, Desulfococcus, Desulfobacter, and Spirochaeta in 292 days were 16%, 11%, 12%, and 14%, respectively. By combining this information with the data from Fig. 2, we see that the increased abundance of Desulfurella, Desulfococcus, and Desulfobacter was concomitant with the evaluated DEHP removal rates, suggesting that these phyla were likely to be related to DEHP degradation.
Archaeal community dynamics in the bioreactor
The archaeal communities in the EGSB reactor primarily consisted of Methanobacteria, Methanomicrobia, Thermoplasmata, and Methanococci at the phylum level (Fig. 7a). Methanomicrobia and Methanobacteria were dominant on 45 days, accounting for 66% of the total archaeal population. With the addition of glucose and yeast, the Thermoplasmata and Methanobacteria showed a declining trend, whereas the relative abundance of Methanococci began to increase and reached a maximum of 39% in 292 days. Glucose and yeast had little effect on Methanomicrobia, maintaining a relatively stable proportion ranging from 34% to 37%.
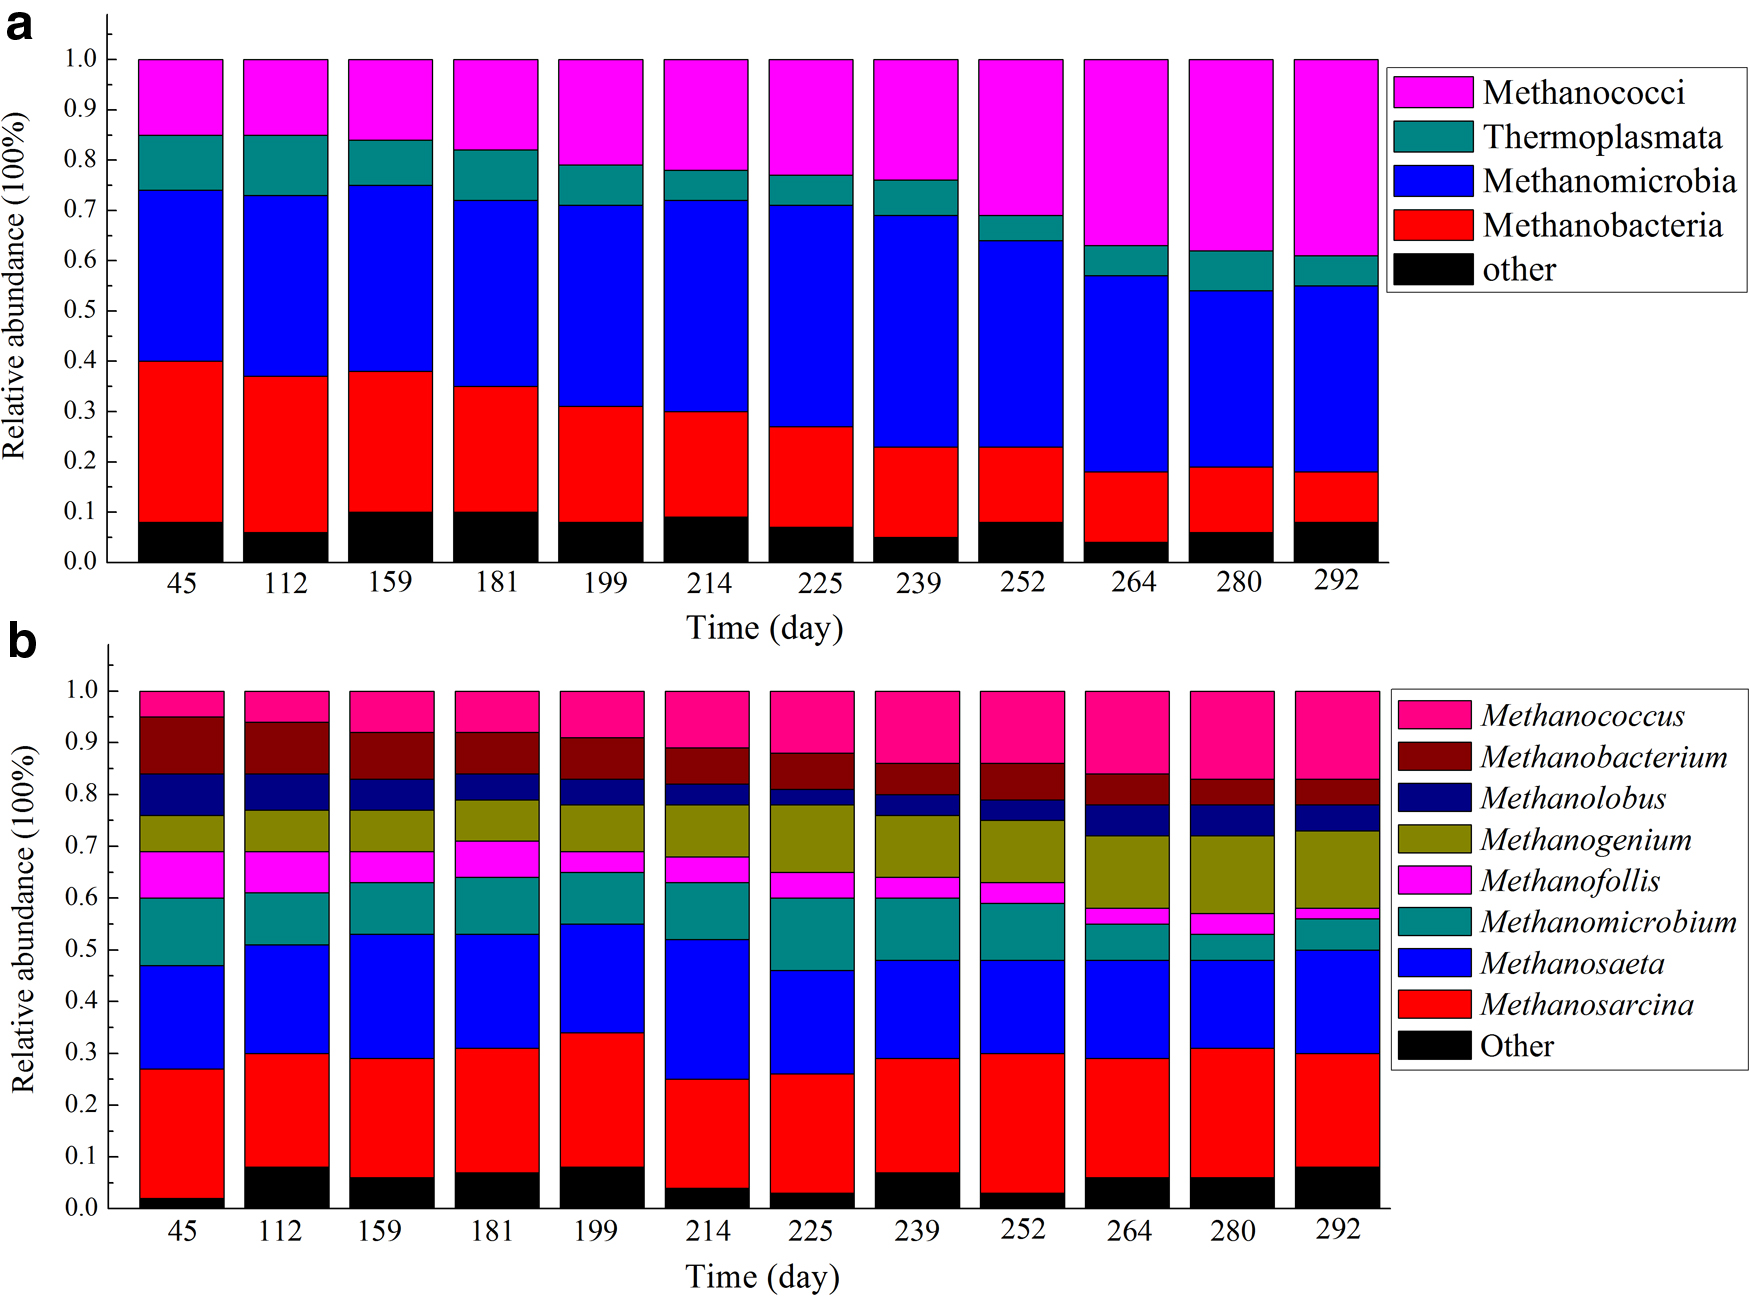
Relative abundance of archaeal species during operating period.
During the initial period, the relative abundance of Methanosarcina and Methanosaeta together was 45%. However, Methanomicrobium, Methanofollis, Methanogenium, Methanolobus, Methanobacterium, and Methanococcus existed in the EGSB reactor without obvious proportional differences (Fig. 7b). With domestication (45–181 days), Methanomicrobium, Methanofollis, Methanolobus, and Methanobacterium began to decline. Although the abundance of archaea was fluctuant during phases II and III, the general trend was that with the addition of glucose and yeast, Methanogenium and Methanococcus gradually increased, and their relative abundances reached 15% and 17% in 292 days. In addition, Methanosarcina and Methanosaeta were relatively stable throughout the entire trial.
Microbial diversity analysis
The bacterial and archaeal diversity were analyzed after sequencing (Fig. 8). The Shannon index of the bacteria and archaea showed a declining trend, suggesting the specialization of the community through the emergence and selection of the most adapted microbial community. During the domestication period, the Shannon index of the bacteria decreased, changing from 4.7 (45 days) to 3.9 (181 days). Subsequently, a slight fluctuation in the Shannon index was observed in phase II when glucose was added, with a variation range of 3.4–3.6. Finally, the Shannon index dropped to 2.3 in the ending period of phase III (292 days). The change in the Shannon index for the archaea was nearly the same as that for bacteria. Both the bacteria and archaea communities eventually reached a relatively steady state at the end of the trial.
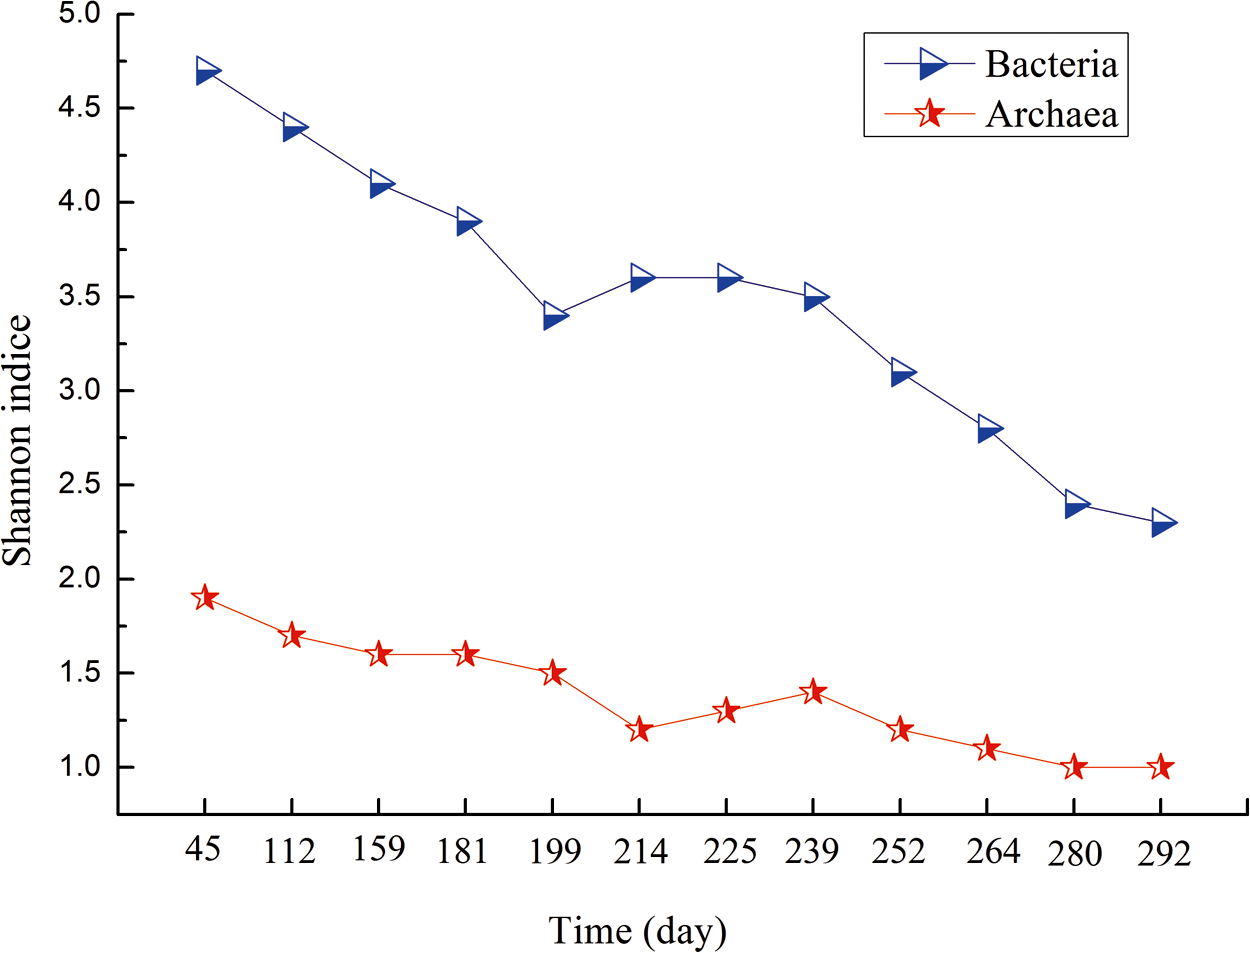
Shannon index of bacteria and archaea on different sampling days.
Table 1 shows the correlation test results among the microbial community, cometabolic substrates, and DEHP removal during the different phases. The bacterial community and the DEHP removal were not significantly correlated in phase I, which means that DEHP removal in the start-up period was primarily affected by other factors. In phases II and III, the bacterial community composition played an important role in DEHP removal, whereas the quantity of bacteria and DEHP removal had no significant correlation (p > 0.05). It is worthy of note that the DEHP removal was closely related to the archaeal community and quantity throughout the trial, especially in phase III, where the correlation reached an extremely significant level (p < 0.01). This means that the archaeal activity and quantity may have been a limiting factor in the EGSB reactor for the treatment of DEHP wastewater.
Correlation Among Microbial Community, Cometabolism and Di-(2-Ethylhexyl) Phthalate Removal
All the parametric tests were followed by Tukey's post hoc tests after significant main effects. *p < 0.05, **p < 0.01, I- Rem, DEHP removal at phase I; II –Rem, DEHP removal at phase II; III –Rem, DEHP removal at phase III.
DEHP, di-(2-ethylhexyl) phthalate.
Discussion
DEHP is one of the most frequently detected and refractory organics in WWTP influent, effluent, and dewatered sludge (Roslev et al., 2007; Huang et al., 2008). Given its refractory characteristics, many enhancement methods, including immobilization and the addition of cometabolic substrates and surfactants, have been tested at the laboratory scale (Xu and Chen, 2012; Yu et al., 2014). Cometabolism and the use of surfactants have been found to be effective approaches. It was reported that anaerobic degradation rates were enhanced 40% by the addition of the surfactants brij 35 and triton N101 at one critical micelle concentration (Chang et al., 2005). However, some surfactants are themselves contaminants, which means that these only have limited applications in practice.
This research was based on a practical engineering application. The purpose was to solve the problem of the effluent discharge standard in a local plastic factory (Dexin Plastic Products Co., Ltd., Sichuan province, China). In this study, the effects of the cometabolism by glucose and yeast on the DEHP removal and microbial community dynamics were investigated in an EGSB reactor. The start-up time of the EGSB reactor was lengthy, and it took 181 days to make the reactor reach its steady state with a 38.5% removal efficiency. The low DEHP removal efficiency and long start-up process were related to DEHP characteristics and the slow formation of granular sludge in the anaerobic reactor.
As noted earlier, PAEs with longer alkyl chains are more difficult to degrade than PAEs with shorter alkyl chains (Tian et al., 2016). The average DEHP degradation rate in the mesophilic anaerobic digestion of sludge has been found to be less than 35% in WWTPs (Marttinen et al., 2003; Yuan et al., 2003). DEHP can be degraded under anaerobic conditions, but some degradation intermediates may be generated during the degradation process. Therefore, the removal rate of COD, theoretically, should be lower than the DEHP removal rate.
In this study, the COD removal efficiency was generally higher than the DEHP removal rate. The probable reason was that glucose and yeast are easily utilized carbon sources for microorganisms, thus leading to a higher COD removal rate than that of DEHP. Considering the low removal efficiency and slow start-up of EGSB reactors with DEHP, researchers have used some pretreatment techniques (e.g., ultrasonication and Fenton oxidation). Pham et al. (2011) used ultrasonication and Fenton oxidation to treat DEHP in wastewater sludge, and they found a removal rate of up to 85%.
Glucose is usually selected as a study objective in refractory organic biodegradation. This study indicated that glucose at low concentrations (1, 2 mg/L) promoted DEHP degradation, while glucose inhibited DEHP degradation when the concentration exceeded 10 mg/L. The probable reason for this phenomenon was that the microorganisms preferentially used the excessive glucose, while reducing the use of DEHP. Generally, when various pollutants coexist in an anaerobic system, due to the excellent biodegradability, small molecules of organic matter are usually more competitive in substrate utilization for biological metabolism and microbial growth (Li et al., 2014). The result found in this study was not completely consistent with previous research (Huang et al., 2010), where the inhibitory effects were not detected. It is speculated that the difference may have been caused by the glucose concentration ranges used in different studies. However, even with the same glucose concentration, the effects (enhancement or inhibition) of glucose were different. All of these results imply that the experimental parameters, especially the glucose concentrations, were important in evaluating glucose's effect on the DEHP degradation.
The enhancing effect of yeast on DEHP removal was significant. The DEHP removal rate doubled when 0.4 mg/L yeast was added compared with no addition of cometabolic substrates. The effect of yeast on the DEHP degradation was similar to that found in previous research (Chang et al., 2005; Dong et al., 2011). Due to the discrepancies in the anaerobic degradation conditions in different studies, the enhancement effects of yeast were not the same. The concentrations (>0.2 mg/L) designed in this experiment were higher than the general level of the inlet DEHP concentration in WWTPs reported in the literature (Gavala et al., 2003; Roslev et al., 2007). This means that this enhanced method is feasible for treating DEHP wastewater and is a promising DEHP degradation application.
Anaerobic degradation is considered an important wastewater treatment technology as far as energy is concerned. Compared with aerobic research, DEHP anaerobic studies are relatively rare, and most of them have been conducted in serum bottles. Reports regarding DEHP wastewater anaerobic treatment in engineering practice are rare. In a wastewater biological treatment system, the steady operation of the reactor depends on the members of the microbial community and their activity. Hence, understanding the community structure and dynamics is vital for maintaining the system's stability.
In this study, an obvious shift in the microbial community and diversity were observed when the DEHP concentration increased and cometabolic substrates were added. Both the bacterial and archaeal diversity dropped and became more specific. Firmicutes and Bacteroidetes, which are generally considered the dominant phyla in anaerobic systems (Rosenkranz et al., 2013), occupied a relatively high abundance in the EGSB reactor from start-up to the end. Firmicutes and Bacteroidetes were also widely reported to be related to organic matter degradation (Chen et al., 2014; Okada et al., 2014). Spirochetes and δ-Proteobacteria were also major bacterial groups in the DEHP treatment system. At the genus level, Clostridium and Tepidimicrobium, which belong to Firmicutes, existed in the system during the reactor's operation. Spirochaeta, Desulfurella, Desulfococcus, and Desulfobacter gradually increased and became the predominant bacterial groups with enhanced DEHP removal. Phyla like Desulfococcus and Desulfobacter are important in maintaining a stable anaerobic bioreactor (Vavilin, 2007). Clostridiales are fermentative organisms thought to use hydrocarbon intermediates to generate organic acid precursors (e.g., acetate and formate) (Sherry et al., 2012). Desulfurella and Desulfococcus have also been reported to be related to the anaerobic degradation of aromatic compounds (Delforno et al., 2015). It appears that Desulfurella, Desulfococcus, and Desulfobacter are related genera for DEHP biodegradation. This result confirmed the study of Chang et al. (2005), which indicated that methanogenic sulfate-reducing bacteria and eubacteria were involved in the anaerobic degradation of PAEs. However, the detailed genera of the methanogenic sulfate-reducing bacteria were not identified. Members of the Spirochaeta family have been reported to be responsible for refractory compound degradations in oil and other environments (Cheng et al., 2013). The FISH results indicated that the archaea began to increase with the addition of cometabolic substrates.
Therefore, combined with the results of the microbial community and biodiversity analyses, it can be speculated that the archaea may be connected with the enhanced removal of DEHP, and they are the key microbial community during the process of DEHP anaerobic degradation. These results suggested that Clostridium, Tepidimicrobium, Spirochaeta, Desulfurella, Desulfococcus, Desulfobacter, Paludibacter, and Actinobaculum collaboratively completed the DEHP hydrolysis/acidification, hydrogenesis, and acetogenesis process.
The primary archaea phyla included Methanobacteria, Methanomicrobia, Methanococci, and Thermoplasmata. Methanococci gradually increased and became dominant in the reactor with enhanced DEHP removal efficiency. Methanococcus, belonging to Methanococci, has been reported to have relatively special and diverse biochemical pathways of methanogenesis, and it can use CO/H2 to produce methane (Liu et al., 2006). The archaea genera found in the EGSB reactor included both acetotrophic methanogens (e.g., Methanosaetaceae) and hydrogenotrophic methanogens (e.g., Methanofollis). The acetotrophic methanogens, Methanosaetaceae and Methanosarcina, maintained relatively stable proportions, which was important for the reactor's stabilization.
A previous study stated that Methanosaeta contributed to the stable performance of anaerobic reactors (Ozgun et al., 2015). Figure 7b shows a shift in the hydrogenotrophic methanogenic community from Methanobacterium and Methanofollis to Methanococcus and Methanogenium, indicating that Methanococcus and Methanogenium were more adaptive in the DEHP biodegradation process. Hence, Methanococcus and Methanogenium likely played an important role in the methanogenesis process in the treatment of DEHP wastewater, although the precise character of this role remains unknown. The decreased Shannon diversity of both bacteria and archaea over time implied the specialization of the community through the emergence and selection of the most adapted microbial community.
It should be noted that in this study, only limited concentrations of glucose and yeast were examined However, the results suggest that cometabolic substrates (glucose and yeast) were effective in enhancing DEHP anaerobic degradation. In fact, this method has been proven to be effective in practical DEHP wastewater treatment in factories. Although it is relatively cheap to adopt this method, the cost still needs to be reduced. The associated engineering parameters will be reported, but efforts are still needed to reduce costs. Desulfurella, Desulfococcus, Desulfobacter, Methanogenium, and Methanococcus displayed specificity in DEHP degradation. Hence, it is necessary to pay attention to their activity and quantity during the process of operating EGSB reactors. The archaeal community and its quantity were significantly correlated with DEHP removal, which implies that archaea may be an important factor that affects an EGSB reactor's performance. Considering the different biological characteristics of these detected phyla, including hydrolysis/acidogenesis and hydrogen-producing acetogenic bacteria and archaea, designing an anaerobic reactor with two phases may be an effective way to promote DEHP removal. In addition, combined reactors, such as anaerobic–aerobic reactors, could further enhance DEHP biodegradation during the wastewater treatment process.
Conclusion
This study demonstrated the notable effect of cometabolism on DEHP wastewater treatment. Glucose and yeast had significant impacts on the anaerobic degradation of DEHP. Low concentrations of glucose effectively promoted the DEHP removal rate. A high glucose concentration inhibited DEHP removal. Yeast significantly promoted DEHP removal at the tested concentrations. Spirochaeta, Desulfurella, Desulfococcus, and Desulfobacter were the predominant bacterial communities in the EGSB reactor, and they existed concomitantly with the increased DEHP removal efficiency. Archaea Methanosaeta, Methanosarcina, Methanococcus, and Methanogenium were involved in the high performance of the EGSB reactor. Therefore, these phyla possibly play an important role in the DEHP wastewater anaerobic treatment process.
Footnotes
Acknowledgments
The authors are thankful to the editor and the anonymous reviewers for their valuable comments to improve the quality of this article.
Author Disclosure Statement
No competing financial interests exist.
Funding Information
This work was supported by the National Natural Science Foundation of China (No. 51808363).