
Abstract
Biocarriers, whose performance directly influences the effects of wastewater treatment, are the core of biofilm technology. In this study, the effects of a carrier's internal diameter size on biofilm characteristics were systematically investigated. Tubes with different internal diameter (2, 4, 6, 8, and 10 mm) were cut into stub tubes as biocarriers used in five laboratory-scale sequencing batch biofilm reactors for this experiment. Among all the carriers, the large internal diameter ones exhibited the highest biomass and biofilm thickness except total biomass. Carriers with a smaller (<6 mm) or large (>8 mm) diameter structure limited either wastewater to flow over carrier's internal surface or mass to be transferred into the depth of the excessively thick biofilm in which extracellular polysaccharides (especially the tightly-bound layer extracellular polymeric substances) were accumulated, resulting in a reduction of biofilm dehydrogenase enzyme activity (DHA). By contrast, medium internal diameter (6–8 mm) carriers had the best performance in terms of biofilm activity and nutrient removal. During the biofilm's mature period, biomass, biofilm thickness, and extracellular polymeric substances (especially for proteins) all showed higher positive correlation with the internal diameter size ranging from 2 to 10 mm. Controlling the biofilm characteristics by selecting an appropriate carrier diameter size is important to ensure proper microbial biomass, activity, and renewal rate in wastewater treatment.
Introduction
The biofilm processes have a number of advantages such as high biomass concentration, good nutrient removal efficiency, anti-shock to water quality fluctuation (temperature, pH, and toxic compounds), operational flexibility, and low excess sludge (Wei et al., 2015; Mao et al., 2017), which are widely used in many wastewater treatments. In the process of sewage treatment, microorganisms (bacteria, fungi, algae, microfauna, etc.) adhere to carriers through hydraulic power and self-aggregation to form an active membrane-like biofilm composed of microorganisms and their metabolites (Hu et al., 2016).
Biofilm characteristics directly determine wastewater treatment efficiency. Thus, researchers have investigated a variety of biofilm property indexes during the past decades (Hu et al., 2013a). Extracellular polymeric substances (EPS), as an important component of biofilm, play an important role in maintaining the integrity of biofilm structure and the smoothness of the channel for metabolite transfer inside biofilm. EPS often divide into soluble layer EPS (S-EPS, outer layer), loosely-bound layer EPS (LB-EPS, middle layer), and tightly-bound layer EPS (TB-EPS, inner layer) (Oberoi and Philip, 2017; Su and Zhang, 2018; Jiang et al., 2019). Biofilm thickness can characterize the microbial structure, whereas mixed liquid suspended solids (MLSS) and mixed liquid volatile suspended solids reflect microbial and active microbial biomasses to a certain extent. Some biochemical indexes have also been frequently applied to investigate biofilm characteristics, for example, dehydrogenase enzyme activity (DHA), which can reflect microbial activity to a certain extent (Yu et al., 2007; Tarjányi-Szikora et al., 2013).
The rapid and stable attachment of microorganisms on the surface of a packing material (carriers) is an indicator of a successful application of the biofilm process (Nguyen et al., 2010). Numerous factors affect biofilm formation on the surface of a carrier (Wimpenny, 1996), which are usually summarized in three aspects: the carrier surface, microbial, and environmental characteristics (Hadjiev et al., 2007). Among them, the carrier surface is the most basic and has consistently been a research topic in the biofilm field. Studies have shown the carrier type (Young et al., 2016; Dias et al., 2018), and the chemical properties of the carrier surface (He et al., 2019) greatly influence the biofilm characteristics that attach to supporting media. For example, the zeolite exhibits a high attachable surface (∼2,000 m2/g). However, very small pore (1.0–1.5 nm) drastically limits mass transfer and diffusion of dissolved oxygen (DO), resulting in low activity of attached biofilm (Ahmad et al., 2017). Similarly, polymer organic can provide an improved environment for biomass growth, but are largely limited by the weak chemical properties of its surface (Le et al., 2016). The physical properties of support media also affect film hanging (Dias et al., 2018). Nguyen et al. (2010) used polyurethane sponges with different sizes (1 × 1 × 1 cm, 2 × 2 × 2 cm, and 3 × 3 × 3 cm) as biocarrier for a film-hanging operation under anaerobic and aerobic conditions. The medium-sized (2 × 2 × 2 cm) sponge exhibited the best biomass growth and removal efficiency of pollutants. Fox et al. (1990) found that a carrier with a rougher surface was conducive to biofilm accumulation and reduction of the biomass loss caused by flow shearing.
Although there are many studies on the chemical properties of the carrier surface, a few studies on the physical properties of the carrier, such as the internal diameter size of a carrier which has a great impact on biofilm characteristics, appear to have been overlooked. The carrier with small internal pores can create a large specific surface area for biofilm hanging, but impurity accumulation in the small pores easily clogs and influences biofilm activity and renewal (Rauch, 2014). Properly enlarging the internal diameter size of a carrier could help to maintain a higher degree of cell viability and allow the good growth of microorganisms (Feng et al., 2019). Nevertheless, the biofilm in larger pores is easy to detach due to high hydraulic shear, and the specific surface area inside the carrier is also reduced. Therefore, only the suitable internal size of the carrier can ensure appropriate biofilm detachment, renewal, and keeping stable activity.
The objective of this study was to (1) investigate the effects of internal diameter size on biofilm characteristics, including biomass, biofilm thickness, biofilm component EPS, DHA, and wastewater treatment performance. (2) Analyze the correlation between the internal diameters of carriers and biofilm characteristics. This study provides a theoretical basis for the selection and development of biocarriers in practical engineering.
Materials and Methods
Experimental wastewater
The experiments were conducted using synthetic wastewater, which was prepared by adding glucose, ammonium chloride, and potassium dihydrogen phosphate into tap water. Then, the synthetic wastewater was mixed with domestic sewage (taken from a municipal wastewater treatment plant in Maanshan City, China) at a ratio of 9:1 to produce experimental wastewater. The concentration of chemical oxygen demand (CODCr), ammonia nitrogen (NH4+-N), and PO4−-P was 518–582, 26–34, and 4.85–6.28 mg/L, respectively, and the pH was maintained in 7.5–8.0 using phosphate buffer solution. All chemicals were analytical grade reagents (Sinopharm).
Biocarrier
Five internal diameter PVC transparent plastic pipes purchased from a local market (Shanghai Hongxin Rubber & Plastic Hardware Co., Ltd.) were used. These pipes were cut into 12 mm length tubular carriers with five different internal diameters of 2, 4, 6, 8, and 10 mm, which were named d2, d4, d6, d8, and d10, respectively. Then, all biocarriers were soaked in 20 mg/L NaCl solution for 1 day, washed thoroughly using distilled water, and dried at room temperature. The physical parameters of the carriers are shown in Table 1.
Main Physical Characteristic Parameters of Tubular Carriers Used in This Experiment
The d2, d4, d6, d8, and d10 represent the tubular carrier with internal diameter of 2, 4, 6, 8, and 10 mm, respectively.
Experimental setup and operation
Five cylindrical reactors made of organic plastic with diameter of 10.20 cm, height of 23.10 cm, and the effective volume of 1.5 L were operated in parallel. Tubular carriers of d2–d10 were deposited on the supporting layer of the above reactors to provide a medium for biofilm attachment and growth, with a filling rate of 40%. The supporting layer made of yarn mesh was circled by a wire and fixed on above the microporous aerator in the reactor bottom. The pores (2 mm) in mesh can disperse hydraulic action, reduce the impact of large bubbles on the carrier biofilm, and improve inoculating efficiency.
The reactor was operated in a batch aeration mode at two cycles per day. Each cycle included four stages: influent (10 min), aeration (600 min), sedimentation (90 min), and effluent (20 min). The experiment was conducted at room temperature (20°C ± 5°C). Oxygen was provided by an air pump (SHB-IIIG; Zhengzhou Greatwall Scientific Industrial and Trade) at a 0.2 L/min, and DO in the aeration stage was kept at 2.58–5.24 mg/L. The experiments were started with the inoculation method (the active sludge was taken from a wastewater treatment plant in Maanshan City, China). To ensure the amount of inoculated sludge, the water exchange rate was maintained at ∼50% during the inoculation period. After 2 weeks, dispersed sludge particles appeared on the internal surface of all carriers, and the water exchange rate was changed to 100%.
Analysis method
Biomass
A certain number of carriers were taken from the upper, middle, and lower parts of each reactor. Biofilms were removed off from these carriers by scraping and shaking. Subsequently, the carrier with residual biofilm was stirred using a magnetic stirrer (CJ78-1; MKN) at 800 rpm until no visible biofilm was seen on the carriers. The weight of the biofilm suspended solids (SS) and volatile suspended solids (VSS) was measured in accordance with a standard method (NEPA, 2002). Then, biofilm biomass was calculated as area density (biofilm biomass weight per unit surface area, mg/cm2). In addition, the product of the biofilm biomass area density and the total specific surface area of the carrier were expressed as biofilm biomass volume density (total biofilm biomass of the reactor, mg/dm3).
Biofilm thickness
The thickness of the attached biofilm on the tubular carriers was determined by volume-area formula (Elenter et al., 2007), which is the ratio of the wet weight of biofilm on a unit mass carrier to the carrier surface area, under the assumption of a homogeneous biofilm with a wet density
where mw is the wet weight of biofilm on carriers, and A is the internal surface area of the tubular carrier.
EPS extraction and analysis
The biofilm EPS of S, LB, and TB were extracted using a milder heating method (Li and Yang, 2007). The extracted protein (PN) and polysaccharide (PS) of the different layers were determined according to the modified Lowry method (Fang et al., 2014) and the phenol sulfuric acid method (Chen, 2012), respectively. Previous studies (Liu and Fang, 2002) showed that PS and PN account for 70–80% of the total amount of EPS. Therefore, EPS (mg/g, based on the dry weight of the biofilm) were obtained through the sum of the total amount of extracted polysaccharide (Tol-PS) and the total amount of extracted protein (Tol-PN) of the different layers.
Dehydrogenase enzyme activity
DHA was determined using a modified 2,3,5-triphenyl tetrazolium chloride (TTC) method (Tarjányi-Szikora et al., 2013): after all the reagents were added, the sample was refrigerated for 24 h at 4°C rather than directly incubated (SHA-B) in aqueous thermostat and then incubated and extracted. After improvement, TTC could be diffused into the entire biofilm layer, and the amount of the extractable triphenylformazan (TPF) increased. DHA was expressed as mg TF/(g SS·h).
Physicochemical characteristics of wastewater
Measurements of CODCr, NH4+-N, total phosphorus (TP), and MLSS were carried out in accordance with the Chinese standard method (NEPA, 2002). DO and the temperature in the reactors were monitored using a portable DO analyzer (JPBJ-608; Labsen), whereas pH was observed using a digital display pH meter (pHS-25; Shanghai Precision Scientific instrument Co., Ltd.).
Statistical analysis
The software SPSS (version 19; Chicago, IL) was utilized to analyze the correlation between the internal diameter sizes of the carriers and the biofilm characteristic and the wastewater removal efficiency.
Results and Discussion
Biofilm formation on carriers with different internal diameter size
During the biofilm formation period, the white translucent tubular carriers sank in the wastewater and accumulated on the support layer (Fig. 1a). From the fourth day, scattered light-colored spots appeared on the internal surface of the carriers (Fig. 1b), indicating that the adhered microorganisms multiplied rapidly to develop microcolonies, and then the spots spread continuously. In next 10 days, a flocculent attachment with a pale yellowish appearance appeared on the carriers. After that, the carrier internal surface was gradually covered by a young biofilm (Fig. 1c). Microscopic (BX53; Olympus) examination showed abundant algae and Bodo sp. in the wastewater. The amount of biofilm that adhered to carriers was gradually stabilized; the species and quantities of microfauna were also increased with biofilm growth, and Monas sp., Paramecium sp., Epistylis sp., Vorticella sp., Chilodonella sp., Rotifer, and Nematode emerged sequentially. In addition, biofilm formation speed and microbial community development on the large internal diameter carrier (d6–d10) were faster than the small internal diameter carrier (d2–d4). On the 28th day, the biofilm on d8 and d10 carriers formed a stable and dense structure with a muddy yellow color (Fig. 1d), the microfauna became stable, and the CODCr removal rate was more than 85%. All these findings indicated that the biofilm tended to mature, which was similar to previous studies (Alnnasouri et al., 2011; Canals et al., 2013). After the 40th day, the biofilm on all carriers reached a mature stable state, presenting a yellow-brown mud layer with a certain thickness (Fig. 1e).
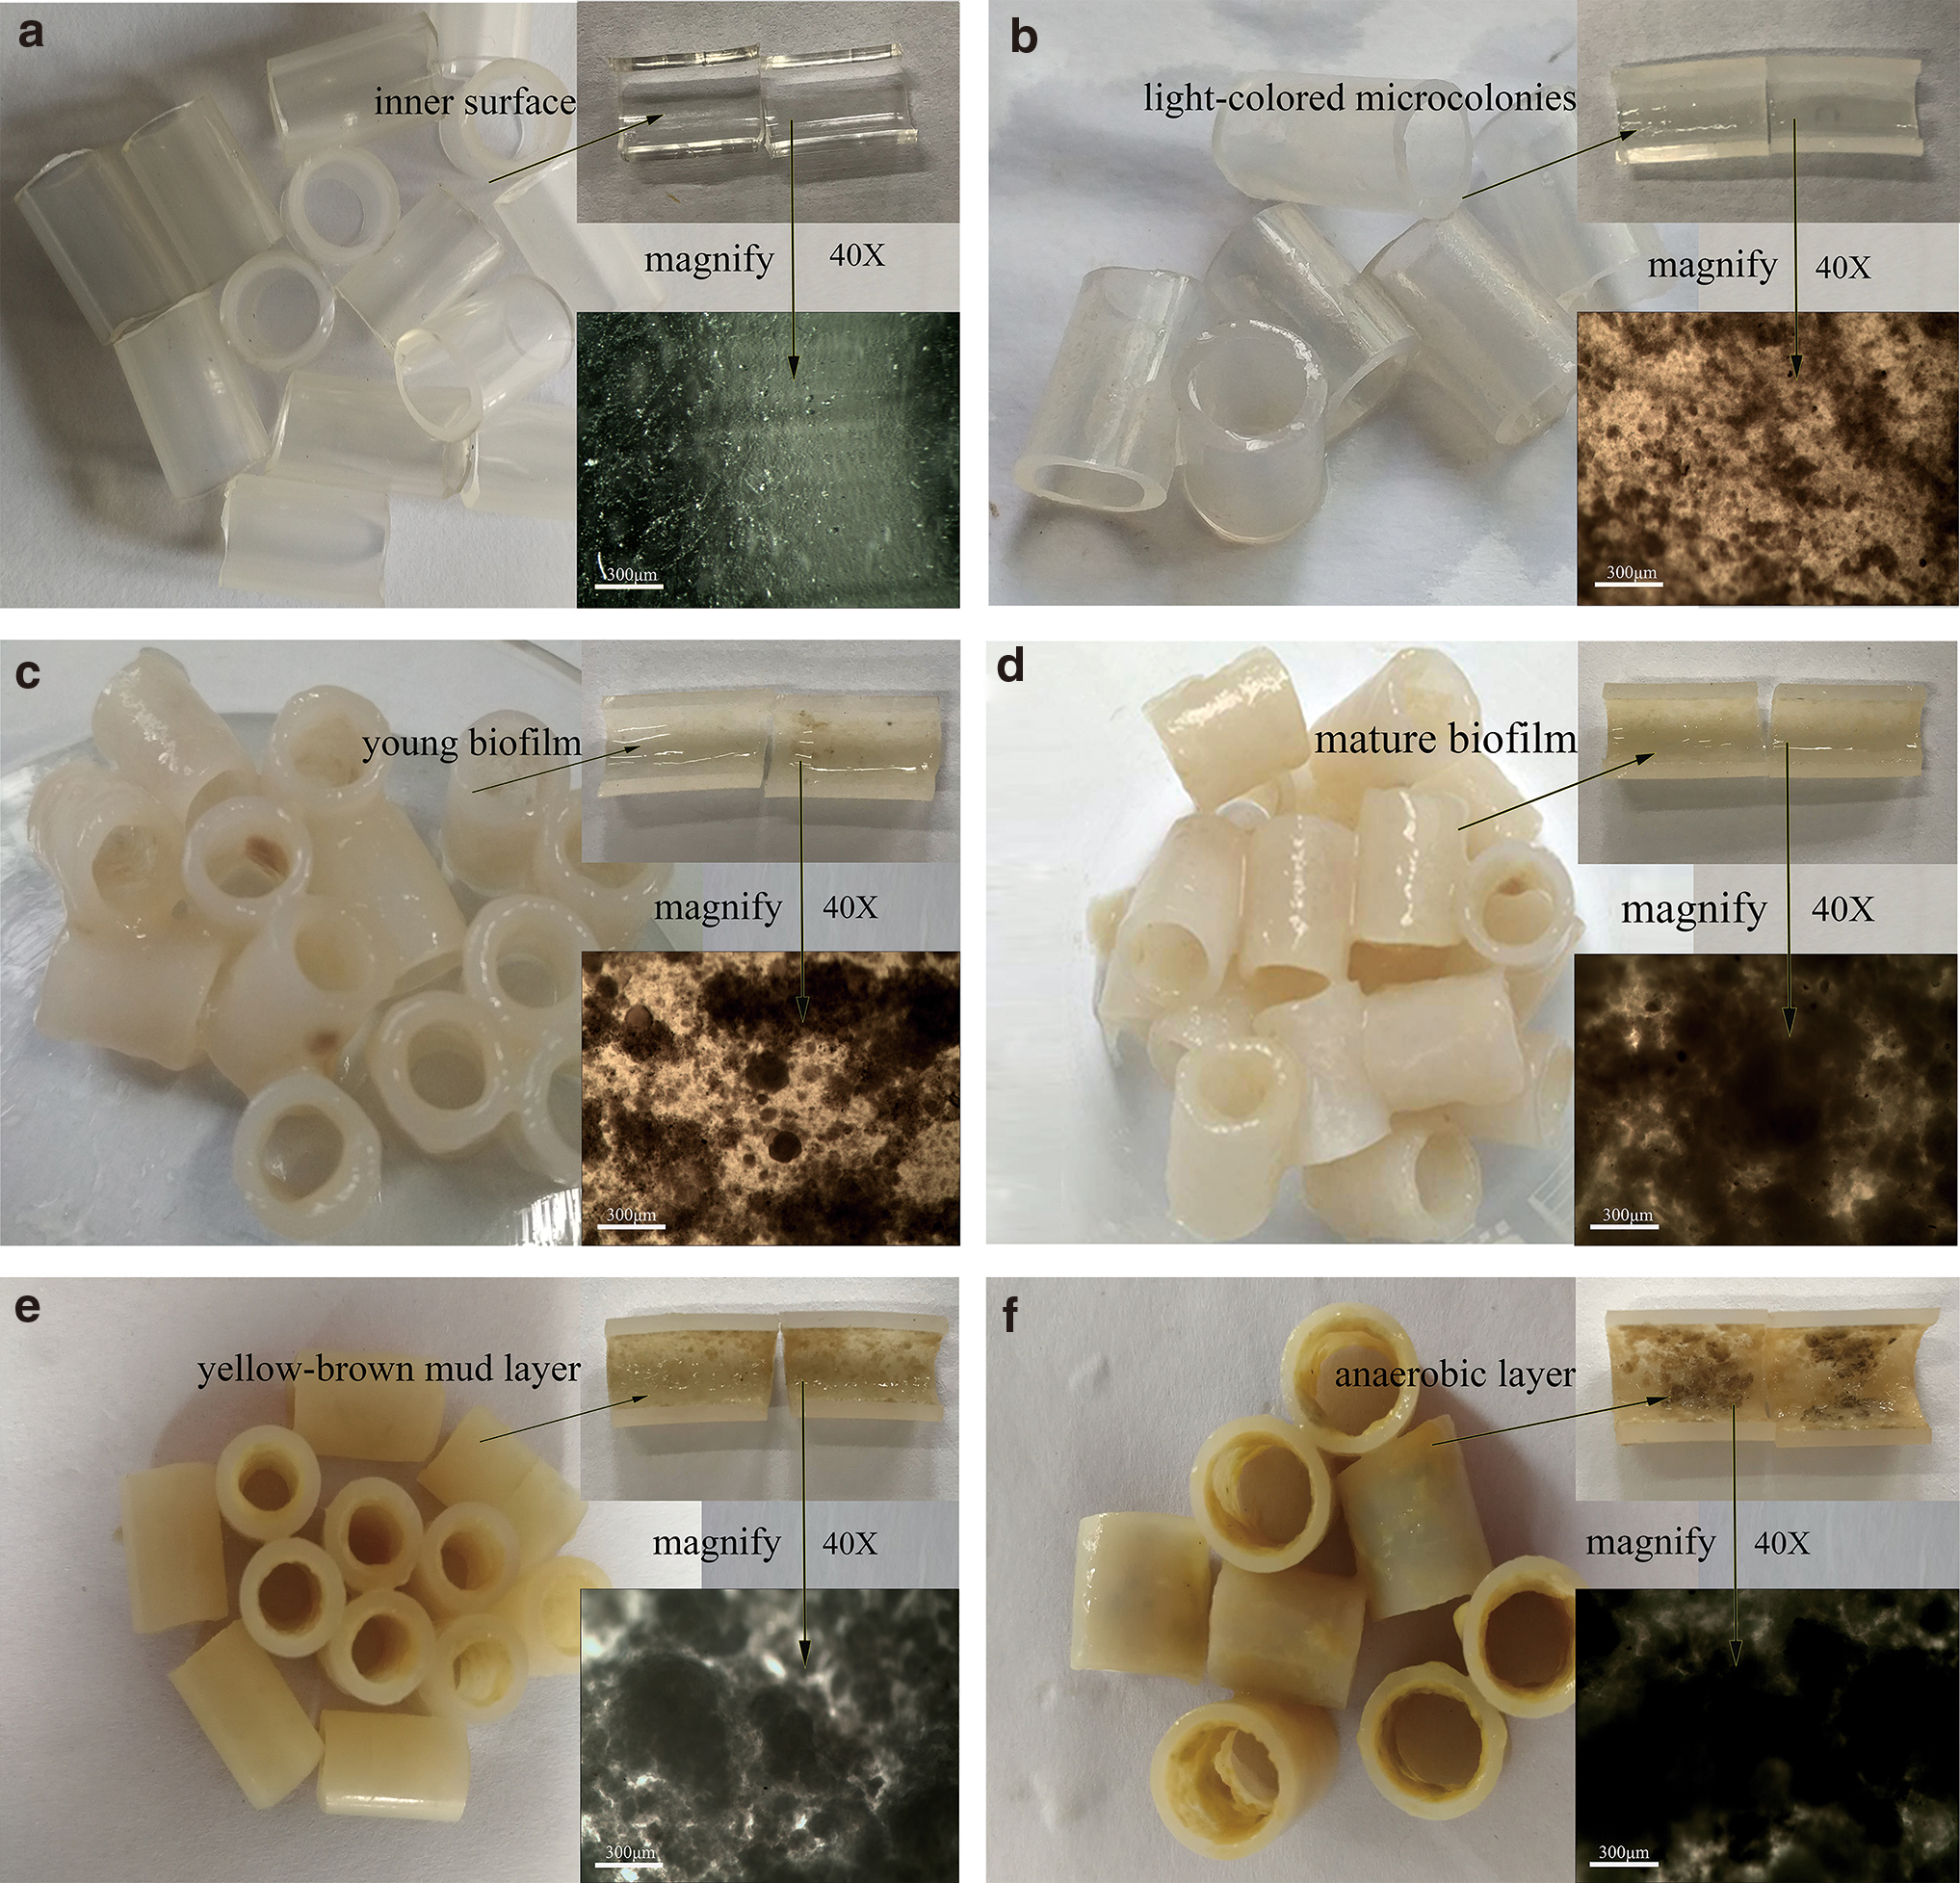
Images of biofilm adhering to the tubular carriers with internal diameter of 6 and 10 mm.
Effect of carrier internal diameter size on biofilm characteristics
Effect on biomass increase
During the experiment, for reducing the continuous accumulation of suspended biofilm or detached ones at the bottom of the reactors, the following operations were performed: (1) the water discharge rate was increased from 50% of inoculation period to 100% at the end of an operation cycle; and (2) the reactor was backwashed regularly to remove the residual biofilm loosely attaching on the internal surface of reactor. Figure 2 presented the dynamic variation of biofilm biomass on carriers with different internal diameter size during the experiment.
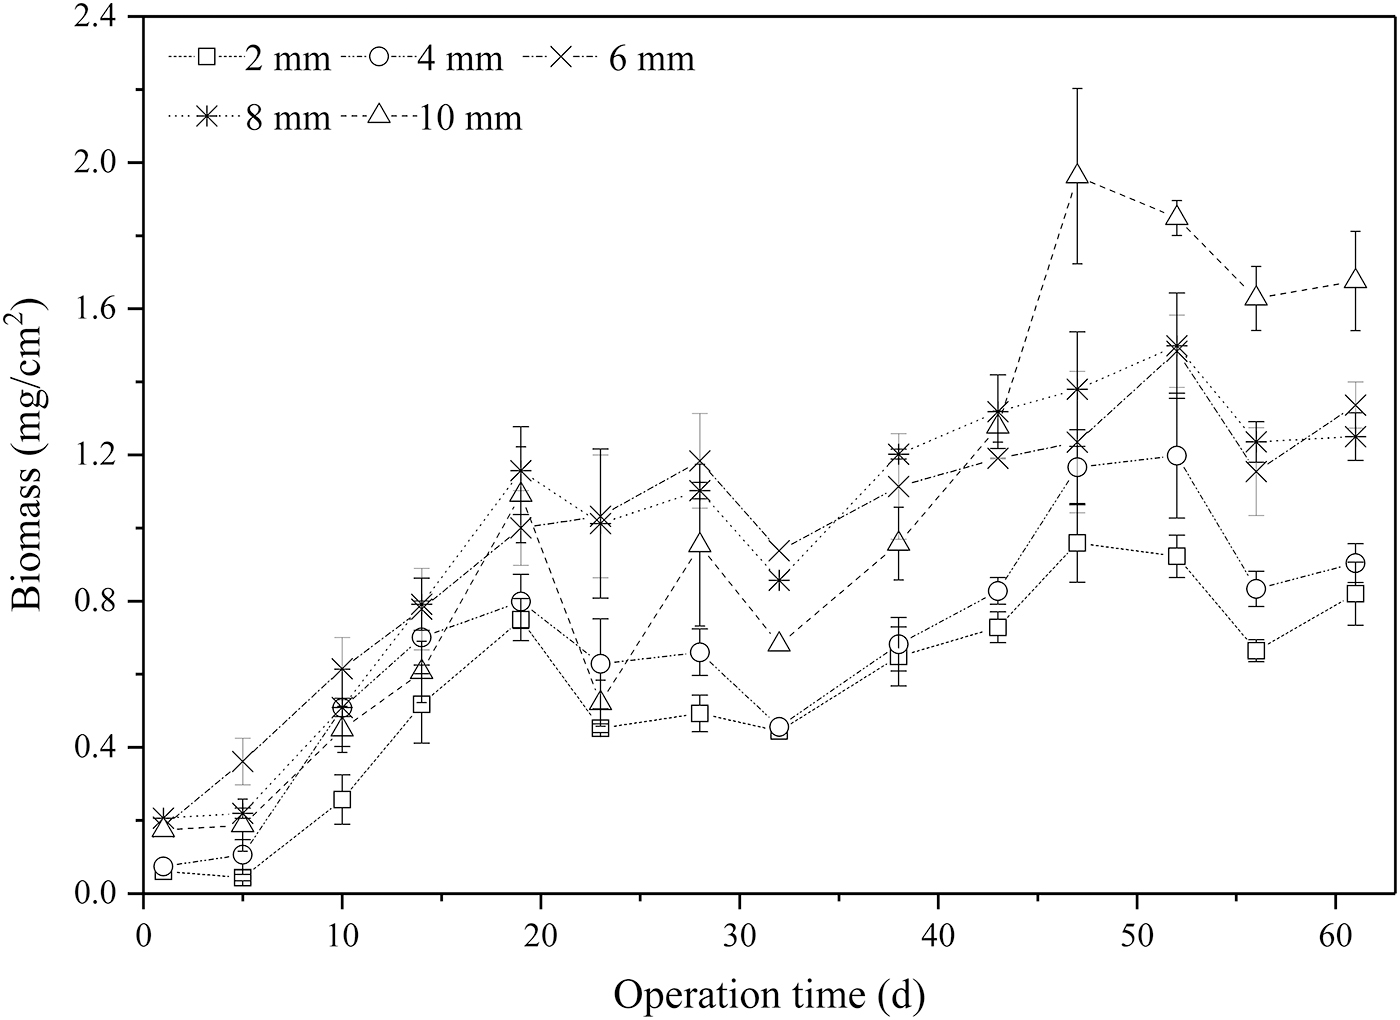
Dynamic variation of biofilm biomass on tubular carriers with different internal diameter sizes.
Zhu et al. (2015) found that the variation of biomass exhibited three discernible stages, including biofilm accumulation (0–16 days), biofilm sloughing and updating (16–28 days), and biofilm maturation (28–45 days). This experiment was generally consistent with the previous study's findings. During the first 19 days, biofilm biomass on all carriers increased significantly, from 0.140 ± 0.0598 to 0.852 ± 0.149 mg/cm2. It can be explained that after a lack of competition of activated sludge for nutrients and DO after removing the surplus sludge, the biofilm microorganisms grew dramatically. Biofilm biomass on all carriers fluctuated slowly from operation days 19–39 due to factors, such as hydraulic shearing and organic load, and the way of biofilm attachment to a carrier gradually changed from physiochemical attachment to biochemical adhesion (Hu et al., 2013a; Swain et al., 2018). During biofilm maturation (43–61 days), the biofilm biomass on the tubular carriers (from the d2 to d10) was 0.819 ± 0.112, 0.986 ± 0.163, 1.280 ± 0.118, 1.334 ± 0.096, and 1.679 ± 0.234 mg/cm2, respectively. This result indicated that the biofilm biomass area density increased with internal diameters from d2 to d10. Large internal diameter provided ample space for biomass expansion. Furthermore, in the reactor with the same volume filling rate, less attached surface would make the unit area of carriers with large internal diameter obtain more nutrients.
The test of biofilm hanging presented a similar variation of biofilm biomass on different carriers in which the growth rate of biofilm increased with the increase in internal diameter size (except for several sample data of d10). Differently sized carriers could influence pathways and hydraulic velocities of flow, thereby producing an impact on oxygen and substrate mass transfer and biofilm growth (Herrling et al., 2015). A high void ratio of the large internal diameter carrier increased wastewater circulation inside the carrier compared with the small internal diameter one. Such increase is beneficial to the early biofilm biomass area density and shortens reactor start-up time. However, the high void also produces more intense hydraulic shearing and other physicochemical impacts, accelerating the speed of microorganisms detaching from carriers; as a result, biofilm biomass dramatically fluctuated (Renner and Weibel, 2011). When biofilm matured, the biofilm growth rate was approximately similar to the shedding rate, so the biomass on carrier became relatively stable.
The dynamic change of total biomass in each reactor was the same as the biofilm biomass area density (Fig. 3). Although the total biomass of the large internal diameter carrier remained higher in the operation stage, the difference among the total biofilm biomass on all carriers was much smaller compared with the biofilm biomass area density, especially in the stable mature stage (after 43 days). Total biofilm biomass from d2 to d10 was stable at 2,338.10 ± 319.05, 2,463.75 ± 406.87, 2,678.13 ± 248.11, 2,527.55 ± 181.78, and 2,663.15 ± 370.70 mg/dm3, respectively, whereas the range was only 12.7%. This result indicated that the total biofilm biomass in reactors filled with different internal diameter carriers could reach the maximal system environmental capacity through their own way under the same operating condition (aeration rate, organic load, temperature, etc.), which made the total biomasses equal to each other. The total surface area of the large internal diameter carrier for the biofilm attachment is small; however, it could reach a similar total biofilm biomass as the small internal diameter carrier by increasing the unit area biofilm biomass (Fig. 2), whereas the small internal diameter carrier does the opposite.
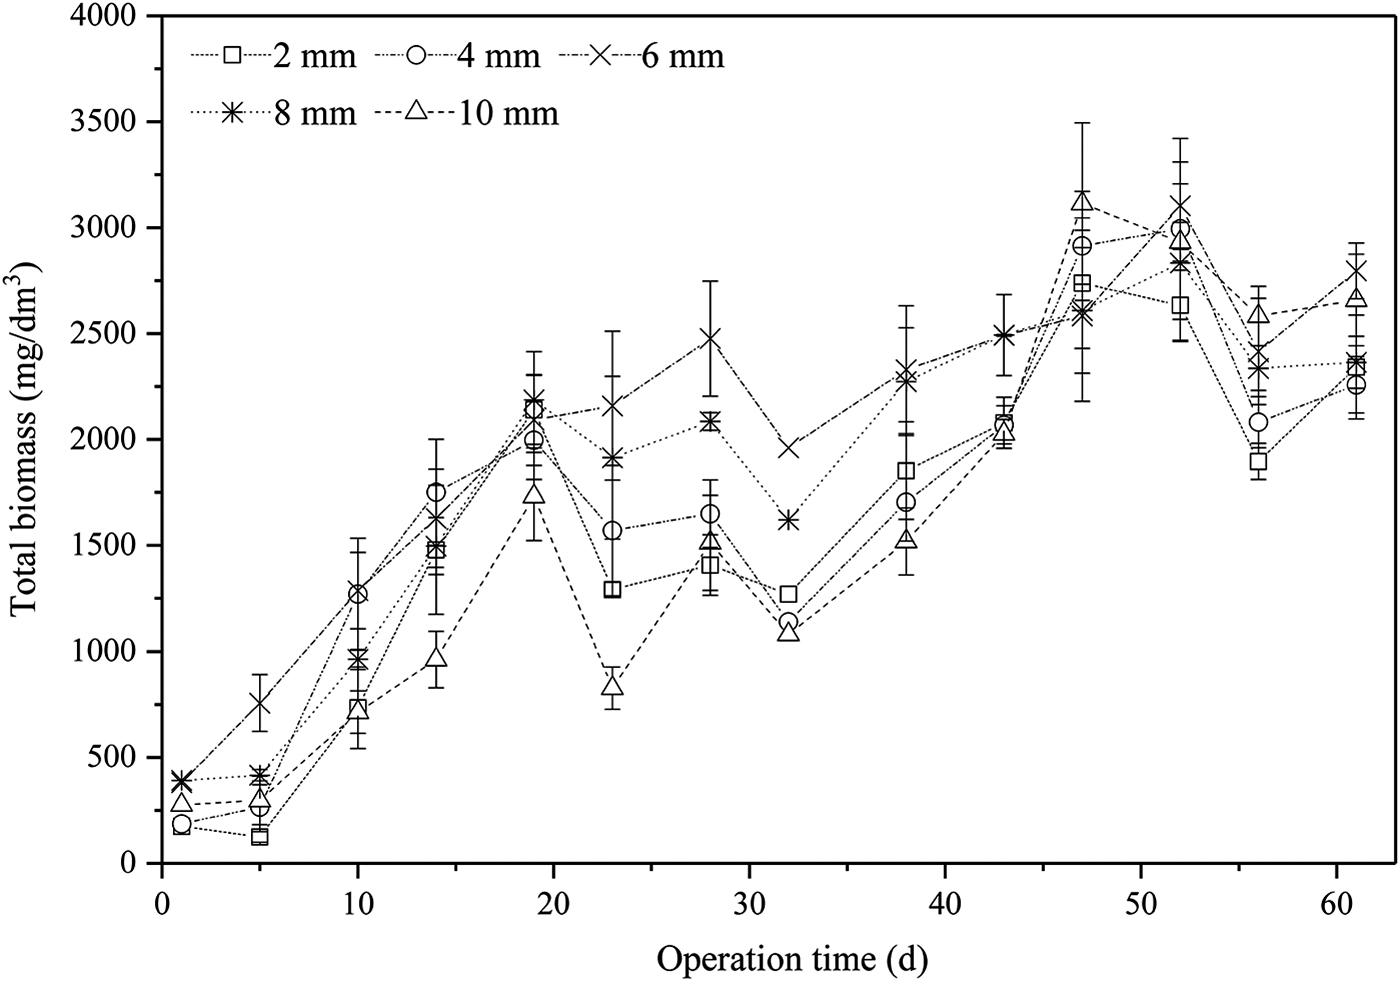
Dynamic change of total biofilm biomass in different reactors.
In the initial stage of the first 19 days, the total biofilm biomass in the reactors with the large internal diameter carrier had no evident advantage; even the lowest total biomass appeared in a few samples of reactors with d10 carriers. However, reactors with d6–d10 tubular carriers could quickly achieve high pollutant removal efficiency. The average removal rate of CODCr, NH4+-N, and TP could reach 70.1–78.2%, 80.1–87.5%, and 58.4–60.7%, respectively, whereas reactors with the d2–d4 carriers were only 40.4–47.6%, 82.1–86.7%, and 51.5–52.5%, respectively. This result could be attributed to the high biological activity of the large internal diameter carriers in the initial stage of biofilm formation. The highest total biomass appeared in the reactors with d6–d10 carriers in 19–38 days. In addition, pollutant removal of these reactors was also the best at this stage. By contrast, the total biomass in the reactors with the d2 and d4 carriers was relatively lower, but the removal rate of CODCr and TP increased considerably to 66.6–70.7% and 66.8–70.0%, respectively. After 43 days, the biofilm on the carriers all seemed to be mature, and each system had a stable removal performance of nutrients (Supplementary Table S1).
Effect on biofilm thickness
The average thickness variation of biofilm in the experiment is shown in Fig. 4. In the early stage, the effect of internal diameter size on biofilm thickness was not prominent. The biofilm thickness on the d2–d10 tubular carrier ranged from 0.136 to 0.192 mm (16–18 days), with a range of 29.2%. However, the limitation of carrier internal diameter size on the growth of biofilm thickness became evident with biofilm development. The biofilm thickness on the large internal diameter carrier (d6–d10) still had a considerable increase after the fluctuation period, whereas the biofilm thickness on the small internal diameter carrier (d2, d4) grew weakly. Thus, the difference in biofilm thickness between the two sizes gradually widened. When the biofilm matured and stabilized (58–61 days), the order of biofilm thickness was as follows: d10 (0.338 ± 0.050 mm) > d6 (0.273 ± 0.048 mm) > d8 (0.238 ± 0.024 mm) > d4 (0.187 ± 0.038 mm) > d2 (0.166 ± 0.032 mm). The biofilm thickness of d10 was nearly twice as high as that of d2.
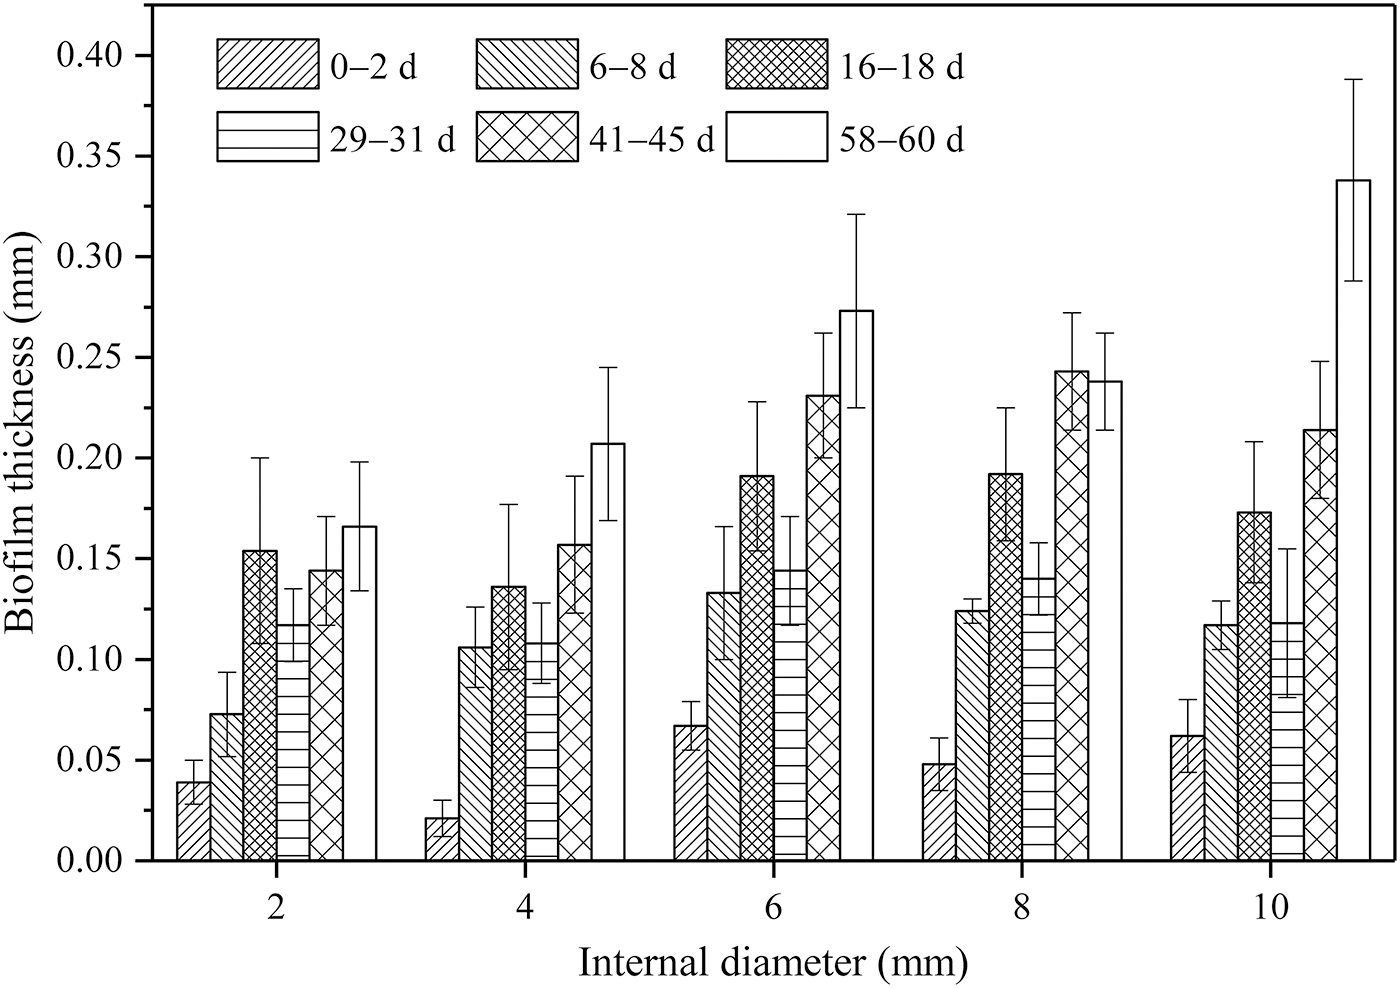
Biofilm thickness variation of the different internal diameter tubular carriers during the operation.
Biofilm thickness can directly affect biofilm structure and substance transfer inside biofilm. A too thick biofilm increases the surface roughness of the biofilm and affects the flow over the boundary layer and substance transfer to the depths of biofilm (Gong et al., 2007). And a thin biofilm would have a modest treatment performance for its sensitivity to fluctuations in water quality and accumulation of harmful metabolic products. After 30 days, black parts in the biofilm on the internal wall of the large internal diameter carrier (d6–d10) were observed periodically (particularly obvious on d10, as shown in Fig. 1f). These black parts were an anaerobic layer of biofilm. When the biofilm thickness reached a certain value, microorganisms inside the biofilm could hardly obtain carbon sources and other nutrients from the external environment. Therefore, microbes in the biofilm entered an endogenous respiration phase and lost their attachment ability, so the biofilm came off from the carrier periodically. Then, a new biofilm layer developed on the carrier surface from which the aging biofilm had detached. The results also showed that the carrier with 6–8 mm in internal diameter (d6–d8) was more suitable than others given that such biofilm had the best condition for biofilm shedding and renewal.
Effect on EPS concentration and components
The contents of EPS components in various biofilm layers on the different internal diameter size carriers are shown in Fig. 5. PS contents on carriers from d2 to d10 were 35.441, 34.849, 34.709, 38.486, and 46.835 mg/g, respectively, and the PN contents were 58.359, 62.217, 67.485, 76.042, and 91.141 mg/g, respectively. EPS component analysis showed that PN content was greater than PS content, the PN/PS was 1.65–1.98, and higher PN/PS was beneficial to the stability of biofilm aggregation (Jiang et al., 2019). PN contents in the different biofilm layers (10.811, 8.342, and 51.805 mg/g, respectively) were also higher compared with PS (5.653, 4.833, and 27.583 mg/g, respectively). These results were consistent with previous experimental observations of biofilm (Chen et al., 2013; Fu et al., 2017; Tan et al., 2018). The contents of the biofilm S-EPS and LB-EPS on the five carriers were similar, and the range between PS (19.7%) and PN (23.5%) was low. Compared with TB-EPS, S-EPS and LB-EPS located in the middle and outer layers of biofilm were relatively loose and fluid. When exposed to wastewater for a long time, the outer-layer EPS adhered to organic and inorganic substances to form a stable mucus layer. Thus, its content was relatively fixed. By contrast, the contents of each component in the TB-EPS were significantly higher compared with the S-EPS and the LB-EPS, accounting for 69–76% of the Tol-EPS. This finding was consistent with the results of previous scholars on EPS (Yu et al., 2009; Dominiak et al., 2011).

EPS distribution in different layers of biofilm on internal surfaces of carrier. EPS, extracellular polymeric substances.
As the internal diameter increased from 2 to 10 mm, the Tol-EPS increased from 93.800 to 135.976 mg/g, with an increased rate of 45.0%. This increase was primarily caused by the amount of TB-EPS. Changes in growth conditions could affect the growth rate of microorganisms in biofilm and thus influence EPS production (Li et al., 2008). Large internal diameter carriers (d6–d10) had high biofilm thickness and biomass, which also depended on secretion and accumulation of EPS (Wen et al., 2004). Given that the large internal diameter allowed microorganisms to obtain suitable growth conditions (nutrient, DO), their growth rate and metabolic activity enhanced, and their ability of EPS secretion increased. Furthermore, EPS could promote intercellular cooperation and signal transmission, protect cells from external influences, and maintain biofilm stabilization (Sheng et al., 2010). Large internal diameter carriers had high microbial biomass and complex microbial community structures, which produced additional protective EPS to adapt to living environment.
Effect on DHA
Generally, DHA can directly reflect the amounts of active microorganisms in the wastewater treatment system and its ability to degrade organic matter (Hu et al., 2017). DHA variation of the biofilm in the five sequencing batch biofilm reactors is shown in Fig. 6. During the initial proliferative stage (0–19 days), the biofilm DHA on d2–d10 gradually increased from 0.514 to 0.775 mg/(g·h) to 5.791 ± 1.543–25.692 ± 4.369 mg/(g·h). On the 19th day, the biofilm DHA on the 6–10 mm carrier was 1.595–4.437 times greater than 2–4 mm, which indicated that the biofilm DHA content of the large internal diameter carriers (d6–d10) was higher than the small diameter carriers (d2–d4) in the initial stage. Within the period of 19th to 39th day, the biofilm DHA fluctuated violently, and the values varied between 1.823 ± 0.265 and 73.307 ± 8.542 mg/(g·h). This result was 2.041–4.083 times greater than that in the biofilm at the proliferative stage. From the early to the middle stages, the biofilm DHA exhibited incremental change with an “M” pattern, which may be due to the rapid growth of biofilm in the initial stage. Then, under the action of hydraulic shearing, biofilms fall off continuously to increase its metabolic capacity. Subsequently, microbial adhesion ability on carriers would improve greatly.
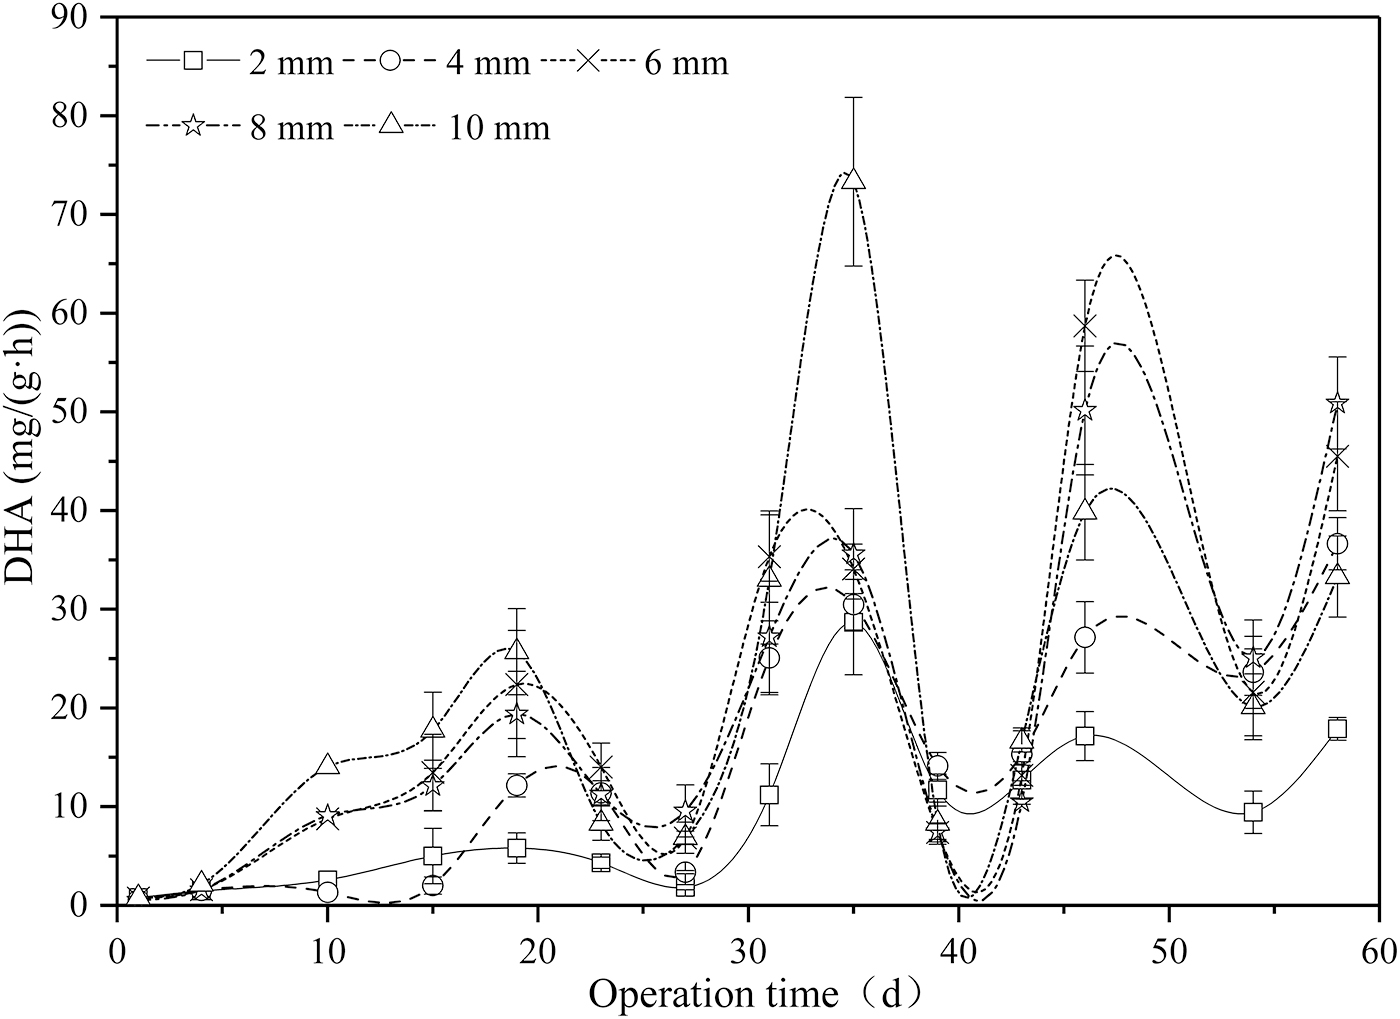
DHA variation of biofilm on tubular carriers during the operation. DHA, dehydrogenase enzyme activity.
The biofilm DHA exhibited a change with an “N” pattern when the biofilm reached maturity (39–58 days). As the biofilm thickened to a certain extent, an anaerobic layer was formed inside the biofilm and produced activity limits. Hence, the periodical detachment and renewal of biofilm could ensure the biofilm's high biological activity (DHA). Carriers' biofilm DHA content was listed in the following order: d8 ≈ d6 > d10 > d4 > d2. The same findings were obtained by Tarjányi-Szikora et al. (2013): a large particle sized (12–15 mm) Perl™ carrier presented higher DHA compared with zeolite and Biolite™ with particle size of 2–5 mm. Thus, the large internal diameter carrier has a property of swift speed of mass transfer and DHA. However, excessive biofilm thickness (such as d10) could result in a compact biofilm structure, so the TB-EPS content in the internal layer of biofilm increased. Zhou et al. (2013) found that excessive extracellular PS would block the channels and holes inside the sludge and hinder the mass transfer of substrate and oxygen. Therefore, biofilm metabolism and DHA decreased.
Correlation between the internal diameter size of carriers and the biofilm characteristics
According to the above results, it perhaps concluded that the internal diameter size of tubular carriers had a significant influence on biofilm characteristics. The correlation between the internal diameter and the biofilm physical characteristics and biochemical characteristics and even nutrient removal efficiency are summarized in Fig. 7.
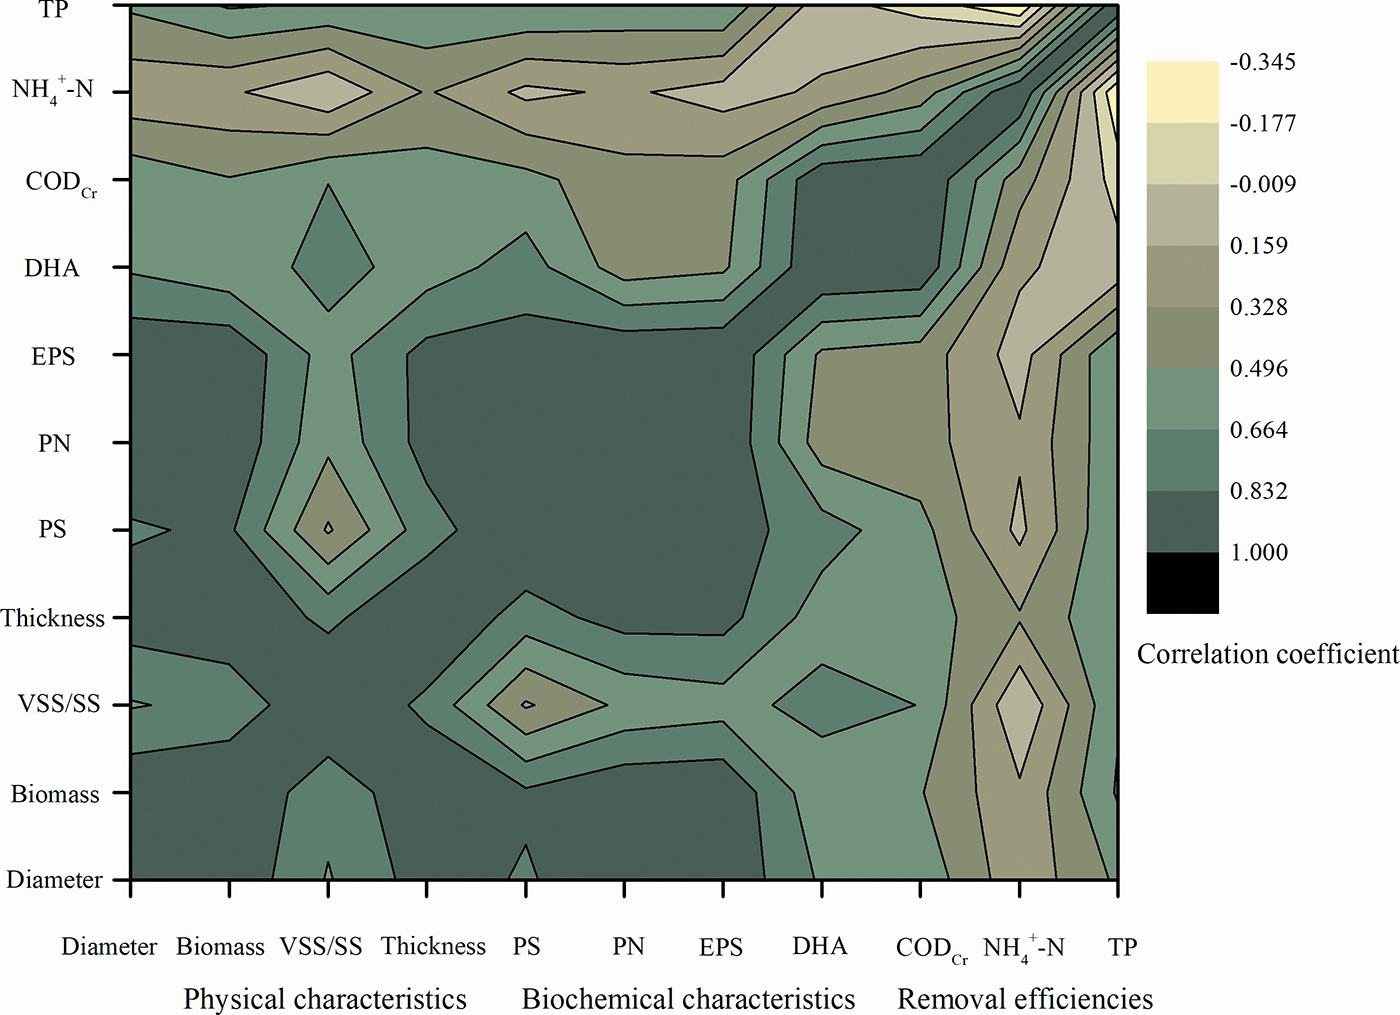
Matrix diagram of correlation coefficients between the diameter sizes of carriers and biofilm characteristics.
In terms of the biofilm physical characteristics, a positive correlation was observed between the internal diameter size of the carrier and biofilm biomass (r = 0.972, p < 0.01), thickness (r = 0.916, p < 0.05), and VSS/SS (r = 0.650). This conclusion demonstrated that system biomass could be enhanced by increasing biological concentration per unit area of the large internal diameter carrier (d6–d10). Meanwhile, large internal diameter size is beneficial to the proportion of active biofilm biomass, given that the small internal diameter is easily clogged by accumulating impurities (Jin et al., 2010). In addition, a significantly high positive correlation among biofilm biomass, thickness, and EPS concentrations was obtained. Coefficients (r) between biomass and PS, PN, and EPS were 0.860, 0.972 (p < 0.01), and 0.978 (p < 0.01), respectively, and that between biofilm thickness and PS, PN, and EPS were 0.758, 0.897 (p < 0.05), and 0.893 (p < 0.05), respectively. According to Wei and Ma (2013), biofilm EPS are a mixture of PSs and PNs that act as a “glue” to bind microbial cells. Thus, the EPS secreted by microbial metabolism increased with the number of microorganisms in biofilm.
In terms of biofilm biochemical characteristics, the internal diameter size of carriers was positively correlated with PS (r = 0.813), PN (r = 0.962, p < 0.01), and EPS (r = 0.972, p < 0.01). It may, therefore, be assumed that the larger diameter size is beneficial to secretion and accumulation of EPS (especially for PNs). The correlation between biofilm DHA and carrier internal diameter was not obvious (r = 0.640); a smaller or larger internal diameter could limit biofilm DHA.
No significant correlation was observed between the carrier internal diameter size and the nutrients' removal efficiencies. The correlation coefficients of the carrier diameter and the removal rate of CODCr, NH4+-N, and TP were 0.612, 0.209, and 0.524, respectively (Supplementary Table S2). The result indicated that carrier with larger or smaller internal diameter is not conducive to removal efficiency. In wastewater biological treatment system, microbial biomass and activity are the main factors affecting the performance of wastewater biological treatment (Hu et al., 2013b). Researchers should also focus on the influence of the carrier structure (internal size) on the microorganism activity while developing high specific surface packing material. For the tubular carrier with 2–10 mm in internal diameter, 6 and 8 mm had the best pollutant removal effect (CODCr, NH4+-N, and TP higher than 94.8%, 98.6%, and 76.1%, respectively). Therefore, 6–8 mm is a suitable internal diameter for tubular carrier.
Conclusions
In this study, the experiments were conducted to investigate the effects of the internal diameter size of carriers (2, 4, 6, 8, and 10 mm) on biofilm characteristics and wastewater treatment performance. Among all the carriers, the medium internal diameter carriers (6–8 mm) exhibited the highest performance in terms of biofilm activity and nutrient removal. The smaller internal diameter (<6 mm) carriers and the larger internal diameter (>8 mm) ones didn't show a good performance. Their structure limited either wastewater to flow over carrier's internal surface or mass to be transferred into the depth of the excessively thick biofilm in which extracellular PSs (especially the TB-EPS) were accumulated, resulting in a reduction of biofilm DHA. Small internal diameter carriers (2–4 mm) had a low area density of biofilm biomass but nearly total biomass of reactors as other carriers, which can be attributed to its high specific surface area. During the biofilm's mature period, a strong positive correlation existed between the internal diameter (2–10 mm) of carriers with biomass (r = 0.972, p < 0.01), biofilm thickness (r = 0.916, p < 0.05), and EPS (r = 0.972, p < 0.01). This study is important for selecting an appropriate carrier's internal diameter to ensure proper microbial biomass and activity in wastewater treatment.
Footnotes
References
Supplementary Material
Please find the following supplemental material available below.
For Open Access articles published under a Creative Commons License, all supplemental material carries the same license as the article it is associated with.
For non-Open Access articles published, all supplemental material carries a non-exclusive license, and permission requests for re-use of supplemental material or any part of supplemental material shall be sent directly to the copyright owner as specified in the copyright notice associated with the article.