
Abstract
Organic micropollutants (MPs), such as pesticides, pharmaceuticals, industrial compounds, and waste breakdown products occurring in waters at ng/L-μg/L levels are a threat to ecosystems and human health. Adsorption of MPs using granular activated carbon (GAC) is an increasingly common treatment process. Biochar is a promising low-cost, environmentally sustainable surrogate for GAC in diverse water quality applications. Challenges remain, however, for accurately simulating real-world biochar and GAC adsorbers in laboratory experiments. The goal of this research was to develop a scale-up procedure for predicting the adsorption of organic MPs from water containing background dissolved organic matter (DOM) by GAC and biochar using bench-scale column tests. The removal of 11 native MPs in wastewater effluent by GAC and biochar was quantified using pilot-scale adsorbers and rapid small-scale column tests (RSSCTs). Batch isotherm studies were conducted and RSSCT data were fit with two different surface and pore diffusion models to obtain equilibrium and kinetic parameters for each MP-adsorbent combination. The diffusion models were used to predict MP breakthrough at full scale, and predictions compared with pilot column data. A third scale-up approach was applied using a fouling index to account for the effects of DOM competition and pore blockage on MP uptake. A fourth approach was applied using direct empirical correlation between early MP breakthrough in RSSCT and pilot columns. The criterion for comparison of the ability of model-based and empirical scale-up approaches to accurately simulate pilot-scale adsorption was the number of bed volumes treated until MP breakthrough at 10% of the influent concentration (BV10%). Data obtained in this study as well as from the literature were used to develop an empirical regression based on RSSCT BV10% values to provide a user-oriented, conservative approach to predicting full-scale MP breakthrough that can be used for the design and operation of biochar and GAC treatment systems.
Introduction
Granular activated carbon (GAC) is widely used in water treatment for removal of dissolved organic micropollutants (MPs) such as pesticides, pharmaceuticals, industrial compounds, and breakdown products from consumer goods at ng/L to μg/L levels. As an alternative to GAC, biochar adsorbent is rapidly gaining popularity, especially in applications where economic and resource constraints are stringent and where sustainability considerations are prioritized (Kearns et al., 2014, 2015b, 2019; Shimabuku et al., 2016; Thompson et al., 2016). A number of studies have quantified uptake of MPs from wastewater effluent (WW) by biochar using laboratory bench-scale column tests, for example, Kimbell et al. (2017) and Tong et al. (2018). However, these and other studies suffer from significant limitations such as using adsorbate concentrations much higher than typically found in WW or environmental waters. Additionally, most studies use biochars generated under laboratory conditions such as furnaces purged with inert gases and subjected to chemical modification by washing with strong acids or bases, which has been shown to dramatically alter biochar adsorption properties (Zhang et al., 2013). Experiments using high adsorbate concentrations and laboratory-produced biochars are unlikely to accurately simulate real-world treatment scenarios (Kearns et al., 2019). Finally, biochar column studies to-date have not made use of mass transfer modeling approaches for scaling and prediction of MP removal in full-scale adsorbers. Accordingly, the intention of this work is to develop a scaling approach for using rapid laboratory bench column tests to accurately simulate MP removal by representative carbonaceous adsorbents under real-world treatment scenarios.
From a design perspective, the ability to predict MP removal in real-world treatment systems using biochar or GAC adsorbents with models and laboratory bench-scale techniques is attractive because pilot studies are expensive, time consuming, and require large volumes of water. However, scaling mass transfer of MPs in fixed bed adsorbent systems is made difficult by background dissolved organic matter (DOM), which is ubiquitous in natural and anthropogenic waters. DOM constituents block adsorbent pores and compete with target MPs for adsorption sites and thus reduce adsorbent capacity (Knappe et al., 1999; Li et al., 2003a, 2003b; Corwin, 2010; Shimabuku et al., 2014, 2016; Kennedy et al., 2015, 2017). This is termed “DOM fouling.” DOM fouling affects both adsorption capacity and kinetics (Li et al., 2003a, 2003b; Kennedy and Summers, 2015) and has been shown to be particle size dependent where larger adsorbent particles are more susceptible to fouling than smaller particles (Corwin and Summers, 2010). This complicates accurate simulation of MP breakthrough using scaled-down experiments and a single systematic approach for predicting MP removal in full-scale treatment systems has not evolved (Kennedy et al., 2017).
A popular laboratory approach for studying MP uptake by adsorbents is the rapid small-scale column test (RSSCT). The RSSCT was originally developed to simulate organic compound removal by GAC, but has been extended to other adsorbates and adsorbents such as arsenic and granular ferric hydroxide (Badruzzaman et al., 2004). Since biochar is a (micro-)porous carbonaceous material similar to GAC, we hypothesize that the RSSCT will also be useful for quantifying MP uptake in biochar adsorbers. The RSSCT uses the concept of similitude to scale the adsorption process using dimensionless parameters developed from the dispersed-flow pore and surface diffusion model (PSDM) (Crittenden et al., 1986, 1987). Two key assumptions for perfect similitude are that (1) adsorbent properties (e.g., adsorption capacity, bulk density, porosity) do not change when the adsorbent is crushed and (2) substances that compete with target MPs for adsorption sites exhibit the same particle size dependence as target MPs (Crittenden et al., 1986, 1987). However, in practice, these conditions are usually not met and thus RSSCT results often do not adequately simulate full-scale data (Corwin and Summers, 2010).
There are two common RSSCT design approximations—proportional diffusivity (PD) and constant diffusivity (CD). The CD approach assumes that MP intraparticle diffusion kinetics does not depend on adsorbent particle size, whereas the PD approach assumes a linearly proportional dependence of MP intraparticle diffusion kinetics on adsorbent particle size. At this time there is no clearly superior approach for all situations (Summers et al., 2014). Both methods tend to overpredict MP removals at full-scale unless a scaling factor (SF) is applied that accounts for the nonlinear relationship between DOM fouling and adsorbent particle size (Corwin and Summers, 2010). One advantage of the CD method is understood by inspecting the RSSCT design equation [Eq. (1)]:
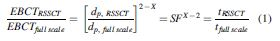
where EBCT stands for empty bed contact time, dp is particle diameter, SF is scaling factor, and t is operation time. For CD, the diffusivity factor X is equal to 0, whereas for PD it is equal to 1. Therefore, CD-RSSCTs can be completed in a shorter time than PD-RSSCTs. The CD-RSSCT approach was selected for this study using “microcolumn” hardware (described in the Materials and Methods section) to save time and minimize the volume of test water needed.
Adsorption models are based on equilibrium parameters (e.g., Freundlich isotherm coefficients) as well as external and internal mass transfer coefficients describing film diffusion (kf), pore diffusion (Dp), and surface diffusion (Ds). Models that have been used to describe adsorption in fixed-bed contactors include the homogeneous surface diffusion model (HSDM) and the PSDM. The contribution of Ds to internal mass transfer is sometimes much greater than Dp (Baup et al., 2000; Ye et al., 2019). However, often the contribution from Dp is significant and should not be neglected—adsorbed DOM could inhibit surface diffusion, for example (Ocampo-Perez et al., 2013, 2017). High-molecular-weight constituents of DOM, such as biopolymers and large humic substances, do not penetrate carbon pores and coat interior surfaces due to size exclusion effects (Velten et al., 2011; Zietzschmann et al., 2014; Kennedy and Summers, 2015; Shimabuku et al., 2017). Additionally, DOM fouling of adsorbent columns is time dependent and spatially dependent. Fresh adsorbent experiences little fouling, so surface diffusion is likely. The adsorbent column also has a chromatographic effect on DOM, so DOM constituents (and their ability to influence surface diffusion) differ depending upon location along the column (Velten et al., 2011; Anumol et al., 2015; Kennedy and Summers, 2015; Shimabuku et al., 2017). Differentiating between the relative contributions of pore and surface diffusion to overall intraparticle mass transport of MPs is an ongoing challenge not resolved by this study.
Batch and column tests using different-sized adsorbent particles preloaded with DOM demonstrated that MP adsorption capacity and intraparticle diffusion kinetics is a function of particle size when DOM is present (Li et al., 2003a, 2003b; Corwin and Summers, 2010) Accordingly, Corwin and Summers (2010) developed an empirical method for applying a fouling index (FI) to account for the differential effects of DOM fouling experienced by full-size adsorbent particles compared with crushed adsorbent used in RSSCTs. Model-based and empirical approaches are promising yet subject to limitations which have so far restricted their applicability (Corwin, 2010; Corwin and Summers, 2012). Moreover, while GAC has been well studied, to our knowledge, no studies have been published describing scaling approaches for fixed bed contactors using biochar adsorbent.
The objective of this study was to collect MP breakthrough data from CD-RSSCT and pilot columns containing biochar and GAC treating WW to determine a scaling approach to predict adsorbent bed life for high levels of MP removal (i.e., C/C0 up to 0.10). Specific objectives were to fit RSSCT breakthrough data using the HSDM and PSDM, and evaluate full-scale MP breakthrough model predictions against pilot column data. A second objective was to investigate empirical approaches to pilot-scale MP breakthrough prediction using (1) the FI approach, and (2) by direct correlation of early breakthrough data from RSSCT and pilot columns. The overall goal was to compare these four scale-up approaches to identify the apparent best available method for predicting adsorbent bed life for achieving high levels of MP removal. This research is motivated by the need for simplified experimental procedures and user-oriented tools for designing water treatment systems that can utilize different types of carbonaceous adsorbents, remove a wide variety of organic chemical MPs, and accommodate a range of background water chemistries.
Materials and Methods
Adsorbents
A 200-L (55 gal) drum oven gasifier operated in forced draft mode using a 1/25 horsepower electric squirrel cage blower was used to generate biochar from hardwood pellets (HWP) at 900°C over a period of 120 min and then water quenched. The feedstock was pelletized mixed hardwoods purchased from a home and garden supply store. No information about which hardwoods were included in the mix was given on the product packaging. Previous work has shown that wood species does not exert a significant influence on biochar sorption properties. Rather, the pyrolysis process—temperature, time, gas phase composition, and sweep rate—govern the development of sorption properties (Kearns et al., 2019). Biochar pellets were then dried to ∼10% moisture content, ground, and sieved to obtain the size fraction retained between #8 and #30 U.S. standard mesh sieves (average particle diameter 1.285 mm). This HWP biochar has been investigated for adsorption of herbicides (Kearns et al., 2019) and perfluoroalkyl acids (Inyang and Dickenson, 2017) in previous studies, and has been shown to have higher adsorption capacity than conventionally generated anaerobic pyrolysis biochars (Kearns et al., 2019). It is referred to in this study simply as “biochar.”
The commercially available GAC used in this study was generated by steam activation of bituminous coal (Norit GAC 830, average particle diameter 1.285 mm), referred to in this article simply as “GAC.” For bottle point batch isotherm testing, biochar and GAC were ground by hand in a mortar and pestle to pass a U.S. standard 200-mesh sieve (<0.074 mm). For small column testing, biochar and GAC were ground by hand in a mortar and pestle to obtain the fraction retained between #100 and #200 U.S. standard sieves (average particle diameter 0.108 mm). Particle diameters reported are log-mean values of upper and lower sieve sizes. Laboratory-grade organic-free (“DI”) water was used to wet sieve biochar and GAC for RSSCTs because a preliminary study indicated that dry sieving did not remove all particles smaller than 0.074 mm.
Treated wastewater and adsorbates
Tertiary-filtered WW from a full-scale wastewater treatment facility in Las Vegas was used as test water for batch tests and column experiments. Full-scale treatment of WW involved conventional activated sludge treatment (secondary treatment) comprising of a modified Johannesburg process for biological nitrogen and phosphorus removal followed by tertiary treatment by dual media (anthracite and sand) filtration. The WW contained 11 native MPs, which consisted of 10 pharmaceuticals and personal care products (PPCPs) and one flame retardant. All compounds ranged in concentration from a few tens to a few hundreds of ng/L, except for sulfamethoxazole (∼1 μg/L) and sucralose (∼38 μg/L). These were the only native MPs that were present at concentrations above limits of detection. The MPs, their concentrations, and key physical/chemical properties are summarized in Table 1. Additional MP properties used in adsorption modeling, such as Abraham solvation parameters, film mass transfer coefficients, and surface diffusivities are given in Supplementary Table S1.
Wastewater Micropollutants Quantified in This Study and Some of Their Physical/Chemical Properties
Molar volume, solubility, and logD values (pH 7.4) were obtained from the ChemSpider website.
RSSCT C0 values are an average of two measurements, taken at the beginning and end of the 3-week period during which all small column and batch tests were conducted, and differed by only a few percentage points. For the pilot column tests, MP were quantified in the influent monthly and these values varied by 10–20%. Average concentrations are listed here. Previous work has shown that, in the presence of DOM in the mg/L-TOC range, MP removal at ng/L to μg/L levels is independent of concentration on a relative (percent removal) basis (e.g., Shimabuku et al., 2016; Zietzschmann et al., 2016).
CAS RN, Chemical Abstracts Service Registry Number; DEET, N,N-diethyl-meta-toluamide; DOM, dissolved organic matter; MP, micropollutant; RSSCT, rapid small-scale column test; TCEP, tris(2-chloroethyl) phosphate.
Sodium azide (100 mg/L) was added to WW used in isotherm and small-column tests to inhibit MP biodegradation. All small column and batch tests were conducted within a 3-week period. Samples were collected, refrigerated, and shipped to Southern Nevada Water Authority for immediate analysis. Batch and RSSCT C0 values reported are an average of two measurements, taken at the beginning and end of the 3-week period during which all small column and batch tests were conducted, and differed by only a few percentage points. For the pilot column tests, MPs were quantified in the influent monthly and these values varied by 10–20%. Average concentrations are reported in this study. Previous work has shown that, in the presence of DOM in the mg/L-TOC range, MP removal at ng/L to μg/L levels is independent of concentration on relative (percent removal) basis (Shimabuku et al., 2016; Zietzschmann et al., 2016).
Adsorbent characterization
Ground biochar and GAC were dried at least overnight at 105°C before characterization, batch tests, and RSSCT experiments. Surface area and pore size distribution were measured by N2 gas adsorption using an Autosorb iQ MP3 (Quantachrome Instruments, Boynton Beach, FL). The contribution to total surface area by area within micropores (<2 nm pore diameter) was determined using the “t-plot” statistical thickness method. “Nonmicropore” area was inferred by assuming that surface area in pores larger than micropores was predominantly located in pores 2–34 nm (i.e., the contributions to total surface area from macropores and particle external surfaces were small). Biochar and GAC pore size distributions were calculated from N2 adsorption isotherms using quenched solid density function theory (QSDFT). Nonlocal density functional theory (NLDFT) has traditionally been used for characterizing activated carbons and other microporous carbonaceous materials (Ravikovitch et al., 2000; Braida et al., 2003; ISO, 2014). However, traditional NLDFT models gas adsorption as occurring in idealized independent slit-shaped pores with molecularly smooth walls. Molecular simulations have demonstrated that surface roughness, heterogeneities, and defects significantly influence the shape of adsorption isotherms (Do and Do, 2006; Guo et al., 2012). For carbonaceous materials such as GAC and biochar this results in mismatches between theoretical and experimental adsorbate layering transitions (Neimark et al., 2009; Landers et al., 2013; Puziy et al., 2016). These appear as artificial gaps in calculated pore size distributions. For example, for N2 adsorption at 77 K layering transitions in NLDFT occur at relative pressures corresponding to pore filling in pores around 1 and 2 nm in width (Neimark et al., 2009; Landers et al., 2013; Puziy et al., 2016). Artifacts around these pore sizes are consequential for correctly interpreting MP adsorption data in the presence of DOM constituents that compete with target MPs for sorption sites and block pores. QSDFT takes into account surface inhomogeneities, and has been demonstrated to overcome the artifacts associated with NLDFT (Neimark et al., 2009; Gor et al., 2012).
Pilot testing
Pilot column experiments were conducted at the full-scale WW treatment facility as described before. Six-inch (15.2 cm)-diameter columns were packed with granular GAC (25.8 kg) and biochar (12.0 kg) for bed densities of 485 and 225 kg/m3, respectively. Each pilot adsorber received full-scale tertiary-filtered WW at a constant flow rate of 1.77 gallons per minute (GPM; 6.7 L/min), hydraulic loading rate of 9 GPM ft2 (22.2 m/h), and an empty bed contact time (EBCT) of 7.94 min. The bed depth for adsorbers was 9 ft 6 in (2.93 m). Pilot column operating parameters are summarized in Table 2. Columns were operated in downflow mode. The biochar pilot column was run to ∼29,000 BV over a period of 23 weeks and the GAC pilot column was run to 62,000 BV over a period of 1 year. Flow rates were continually monitored by an automated system. Air scouring and backwashing of each filter was conducted biweekly to minimize the build-up of headloss in the packed media. During the pilot study, weekly grab samples were collected for the tertiary-treated wastewater for turbidity, DOC, temperature, and pH measurements. DOC measurements were performed following the standard method, SM5310 B, using a Shimadzu TOC total organic carbon analyzer. The water quality parameters during the pilot testing were 0.4 ± 0.1 Nephelometric Turbidity Units (NTU), 6.8 ± 0.2 for pH, 26.2°C ± 4.4°C for temperature, and ∼5 mg/L for dissolved organic carbon. Pilot column influent and effluent samples were collected in 1-L amber glass bottles preserved with sodium azide (100 mg/L) and ascorbic acid (50 mg/L) packed on ice, and immediately transported to the laboratory for MP analysis. Samples were concentrated through automated solid-phase extraction using Waters Oasis HLB cartridges and a Dionex Auto Trace 280 workstation and analyzed through isotope-dilution liquid chromatography with tandem mass spectrometry (LC/MS-MS) using an API 4000 triple-quadrupole mass spectrometer (Applied Biosystems, Foster City, CA) (Vanderford and Snyder, 2006).
Pilot column and Constant Diffusivity–Rapid Small-Scale Column Test Operational Parameters
Particle diameters reported are log-mean values of upper and lower sieve sizes.
CD, constant diffusivity; GAC, granular activated carbon; GPM, gallons per minute.
Isotherm testing
Bottle point isotherm experiments were conducted at North Carolina State University in the same WW used in pilot column tests using six adsorbent doses ranging from 1 to 54 mg/L for GAC and 3 to 142 mg/L for biochar. Suspensions were agitated for 2 weeks to reach adsorption pseudoequilibrium (contact time established previously (Kearns et al., 2014, 2015a, 2015b) and filtered through prefired (550°C for 5 h) glass fiber membranes (1.2 μm Whatman GF/C) to remove adsorbent before preservation, refrigeration, and analysis by LC/MS-MS as described above.
Small-column testing
CD-RSSCT operational parameters are also summarized in Table 2. RSSCTs were designed to simulate the full-scale EBCT 7.9 min using a novel small-column apparatus (4 mm inner diameter × 10 mm inner length) constructed from refillable HPLC guard column hardware (Moeller Medical, Germany). The ratio of column diameter to particle size was greater than 10:1, which is sufficient for avoiding wall effects (Knappe et al., 1999).
Due to the limited volume of test water available for this study, it was necessary to minimize the size of the adsorbent column so that run times of
Results and Discussion
Pore and surface area characterization
Biochar and GAC surface areas and pore size distributions are shown in Fig. 1. The data in Fig. 1 indicate significant apparent porosity in the 0.6–0.7 nm range. However, pore size measurements using N2 gas are not reliable in this range of pore sizes. Also, pores this small are not relevant for the organic MP adsorbates in this study with molecular weights in the 200–400 Dalton range, as they experience size exclusion. The total porosity of carbonaceous adsorbents as well as the distribution of pore volume between micropores (<2 nm) and mesopores (2–34 nm) are factors that influence MP adsorption, especially in the presence of DOM (Pelekani et al., 1999; Li et al., 2003b; Velten et al., 2011; Kennedy and Summers, 2015). Previous studies with biochar and GAC have supported the hypothesis that greater mesoporosity can help to alleviate pore blockage and adsorbent susceptibility to DOM fouling compared with sorbents that are more homogeneously microporous (Pelekani and Snoeyink, 1999; Matsui et al., 2002a, 2002b; Li et al., 2003a; Kearns et al., 2019). Researchers have postulated that biochar mesopores appear to be important for facilitating diffusion of target compounds into pore networks and for providing pathways for molecules to access deeper and smaller pores (Xiao and Pignatello, 2015, 2016). The data displayed in Fig. 1 indicate that the GAC used in this study possessed over 2 × the total surface area, nearly 3 × the micropore surface area, and about 1.3 × the nonmicropore (“mesopore”) surface area as the biochar used in this study. Biochar microporosity peaked in pores around 0.7 nm in width, with a smaller peak around 1.4 nm. GAC microporosity peaked around 1.0 nm, and both adsorbents displayed a small peak around 3.8 nm. It can be inferred from the data in Fig. 1 that a combination of greater micro- and meso- porosity contributed to better MP uptake by GAC compared with biochar in this study (discussed in later sections). This accords with other work that showed that a model incorporating a weighted sum of microporosity and mesoporosity correlated with uptake of a range of neutral and ionized organic compounds by biochars (Lattao et al., 2014; Xiao and Pignatello, 2015).

GAC (triangles) and biochar (circles) micropore, mesopore, and total SA and pore size distribution measured by N2 gas adsorption. GAC, granular activated carbon; SA, surface area.
Isotherm study
Representative isotherms for meprobamate adsorption from WW by GAC and biochar are shown in Fig. 2a. Adsorption isotherms for the other 10 MPs are shown in Supplementary Fig. S1. In agreement with previous work, GAC possess about 10 × the MP pseudoequilibrium adsorption capacity on a per-mass basis of this biochar when significant quantities of DOM are present (Kearns et al., 2019). Freundlich isotherm parameters KF (in units of (mg/kg)(L/μg)1/n) and 1/n (unitless) were obtained from isotherm data using Equation (2), where qe (mg/kg) and Ce (μg/L) stand for equilibrium solid- and liquid-phase concentrations, respectively. Freundlich isotherm parameters (Supplementary Table S2) were used in the HSDM to fit RSSCT data and predict pilot column MP breakthrough as described in the next section.

Meprobamate adsorption by GAC (triangles) and biochar (circles) in bottle-point isotherm tests

Predicting full-scale MP breakthrough using RSSCT data
To assess the accuracy of pilot-scale MP breakthrough predictions by modeling and empirical approaches, comparisons were made with pilot column data. Two methods were used for inputting equilibrium parameters into HSDM and PSDM calculations. The first method, here referred to as the “isotherm approach,” used Freundlich isotherm parameters (KF, 1/n) measured in batch tests for each MP-adsorbent combination (Supplementary Fig. S1). The second method, here referred to as the “K* approach,” estimated an effective capacity term (K*, setting 1/n = 1) from RSSCT breakthrough data for each MP-adsorbent combination (Summers et al., 2014). Equilibrium capacity terms used to fit HSDM and PSDM to RSSCT breakthrough data were adjusted for obtaining capacity terms used to generate pilot breakthrough curve predictions by applying a fouling factor (Y) based on a single principal component analysis (PC1) and MP-specific Abraham solvation parameters (S, A, B, V, and E) as shown in Equations (3) and (4) and described in the following sections (Summers et al., 2014).

HSDM application: isotherm approach
The HSDM was fit to RSSCT data by inputting column operational parameters (EBCT, adsorbent mass, bed density, particle density, particle diameter, C0, flow rate), Freundlich isotherm parameters experimentally obtained for each adsorbent-MP combination, and film diffusion coefficients (kf) for each adsorbent-MP combination calculated using the Gnielinski correlation (Crittenden et al., 2012) into the Fixed-Bed Adsorption Simulation Tool (FAST 2.1) software (Schimmelpfennig and Sperlich, 2011), and adjusting the surface diffusion coefficient (Ds) until the model output produced the best visual fit to the RSSCT data. DsRSSCT values obtained for each MP-adsorbent combination ranged from 10−14 to 10−11 cm2/s. Dspilot values were obtained by multiplying DsRSSCT values by the SF (11.9), following the method described by Summers et al. (2014). DsRSSCT and Dspilot values are provided in Supplementary Table S2. These values are consistent with the range of expected surface diffusivities for MP adsorption from water containing DOM onto activated carbons (Baup et al., 2002; Li et al., 2003a; Schideman et al., 2006; Zhang et al., 2009; Summers et al., 2011; Piazzoli and Antonelli, 2018). If the entire RSSCT breakthrough curve could not be well fit, preference was given to obtaining the best fit to early breakthrough, that is, C/C0 <0.20. Ds values obtained through fitting the HSDM to RSSCT data were then used to predict pilot column breakthrough by changing the inputs in FAST 2.1 software to reflect pilot column operational parameters (i.e., EBCT, adsorbent mass, particle diameter, C0, flow rate, kf, Dspilot) and rerunning the model calculations. Representative HSDM fits to RSSCT data and HSDM predictions for comparison to pilot column breakthrough data for meprobamate adsorption onto biochar and GAC are shown in Fig. 2f and h, respectively. HSDM fitting parameters and predictions are shown for all MPs in Supplementary Fig. S2a and Supplementary Table S3.
The HSDM underpredicted meprobamate removal expressed as bed volumes to C/C0 = 0.10 (BV10%) in the biochar pilot column by about 40% and overpredicted meprobamate removal in the GAC pilot column by more than a factor of 2. For biochar, meprobamate BV10%HSDM = 250 BV and BV10%pilot = 440 BV. For GAC, meprobamate BV10%HSDM = 6,500 BV and BV10%pilot = 3,200 BV. Pilot column predictions of MP BV10% values using the HSDM were within 20% of observed values for atenolol and sulfamethoxazole for biochar, and sucralose and sulfamethoxazole for GAC. The HSDM overpredicted carbamazepine and sucralose removal by factors of 1.7 and 2.3, respectively, for biochar. For GAC, the HSDM overpredicted fluoxetine, carbamazepine, primidone, meprobamate, and atenolol by factors of 1.4, 1.8, 1.9, 2.0, and 6.6, respectively.
HSDM application: K* approach
RSSCT breakthrough data were used to estimate an effective adsorption capacity term (K*RSSCT, with 1/n set equal to 1) (Summers et al., 2014) and adjusting DsRSSCT in the FAST 2.1 software interface (Schimmelpfennig and Sperlich, 2011) to obtain the best visual HSDM model fit to RSSCT data for each MP-adsorbent combination. Dspilot values were obtained by multiplying DsRSSCT values by the SF ( = 11.9) as described above. K*pilot values were obtained by applying the FI calculated using Abraham solvation for each MP parameters (Supplementary Table S1) to the corresponding K*RSSCT values for each MP-adsorbent combination (Summers et al., 2014). Dspilot and K*pilot values were then inputted to the FAST 2.1 software and the HSDM model simulation rerun using pilot column operational parameters (i.e., EBCT, adsorbent mass, particle diameter, C0, flow rate, kf). DsRSSCT, K*RSSCT, Dspilot, and K*pilot values for each MP-adsorbent combination are provided in Supplementary Table S2. Representative HSDM fits to RSSCT data and HSDM predictions for comparison to pilot column breakthrough data for meprobamate adsorption onto biochar and GAC are shown in Figs. 2g and i, respectively. For GAC, meprobamate BV10%HSDM = 12,000 BV (BV10%pilot = 3,200 BV). For biochar, meprobamate BV10%HSDM = 660 BV (BV10%pilot = 440 BV). Pilot column prediction of MP BV10% using the HSDM was within 20% of the observed value only for tris(2-chloroethyl) phosphate (TCEP) removal in the biochar pilot column. In general, full-scale MP breakthrough was not well predicted by the HSDM using the K* approach. Model fitting parameters and predictions are given in Supplementary Fig. S2b and Supplementary Table S3. For GAC, the HSDM overpredicted removal for all MPs, except for N,N-diethyl-meta-toluamide (DEET) by factors ranging from 1.3 to 7.4. For biochar, the HSDM overpredicted removal for all MPs, except DEET, fluoxetine, and TCEP by factors ranging from 1.5 to 4.8.
PSDM application: isotherm approach
The PSDM was fit to RSSCT data and used to predict MP breakthrough from pilot columns using the procedure described by Summers et al. (2014) and the AdDesignS software package (Michigan Technological University, Houghton, MI). MP physical/chemical properties inputted into AdDesignS are provided in Supplementary Table S1. Briefly, RSSCT operational parameters and MP physical/chemical properties and measured isotherm parameters KF and 1/n were inputted into AdDesignS, and the tortuosity (τRSSCT) and surface-to-pore-diffusion-flux-ratio (SPDFRRSSCT) were adjusted to until the PSDM model output visually overlapped the breakthrough curve data. The FI (Y) was then calculated using Abraham solvation parameters and applied to adjust KFRSSCT (with 1/n held constant) to obtain KFpilot. Tortuosity (τpilot) was obtained by dividing τRSSCT by the SF ( = 11.9) (Summers et al., 2014). In the cases studied here, it was not necessary to invoke surface diffusion for the full-size granular adsorbent (i.e., SPDRFpilot = 1e−30). The PSDM was then rerun by inputting pilot column operational conditions (i.e., EBCT, adsorbent mass, particle diameter, C0, flow rate, KFRSSCT, 1/n, τpilot) into AdDesignS. KF, τ, and SPDFR values used for RSSCT data fitting and pilot breakthrough prediction are provided in Supplementary Table S2. RSSCT data fits and pilot predictions are shown in Supplementary Fig. S3a. Representative PSDM fits to RSSCT data and HSDM predictions for comparison to pilot column breakthrough data for meprobamate adsorption onto biochar and GAC are shown in Fig. 2b and d, respectively. For GAC, meprobamate BV10%PSDM = 6,700 BV (BV10%pilot = 3,200 BV). For biochar, meprobamate BV10%PSDM = 500 BV (BV10%pilot = 440 BV). PSDM fits and predictions are given for the other MPs in Supplementary Fig. S3b and Supplementary Table S3. Pilot column predictions of MP BV10% values using the PSDM were within 20% of observed values for DEET, meprobamate, and sulfamethoxazole for biochar. For GAC, MP BV10% values using the PSDM were within 20% of observed values for DEET and sulfamethoxazole. For GAC, PSDM overpredicted removal for all other MPs by factors ranging from 1.2 to 5.2. For biochar, the PSDM overpredicted MP removal for primidone, sucralose, TCEP, carbamazepine, and atenolol by factors of 1.4–2.5.
PSDM application: K* approach
The PSDM was fit to RSSCT data and used to predict MP breakthrough from pilot columns using the procedure described by Summers et al. (2014) and the AdDesignS software package (Michigan Technological University, Houghton, MI). MP physical/chemical properties inputted into AdDesignS are provided in Supplementary Table S1. Briefly, RSSCT operational parameters and MP physical/chemical properties were inputted into AdDesignS and the effective adsorption capacity term (K*), tortuosity (τ), and SPDFR were adjusted to until the PSDM model output visually overlapped the breakthrough curve data. The FI was then calculated using Abraham solvation parameters, applied to adjust K*, τ, and SPDFR for full-size granular adsorbent, and the PSDM rerun using pilot column operational conditions (i.e., EBCT, adsorbent mass, particle diameter, C0, flow rate). K*, τ, and SPDFR values used for RSSCT data fitting and pilot breakthrough prediction are provided in Supplementary Table S2. Representative PSDM fits to RSSCT data and HSDM predictions for comparison to pilot column breakthrough data for meprobamate adsorption onto biochar and GAC are shown in Fig. 2c and e, respectively. For GAC, meprobamate BV10%PSDM = 8,600 BV (BV10%pilot = 3,200 BV). For biochar, meprobamate BV10%PSDM = 450 BV (BV10%pilot = 440 BV). PSDM fits and predictions are given for the other MPs in Supplementary Fig. S3b and Supplementary Table S3. Pilot column predictions of MP BV10% values using the PSDM were within 20% of observed values for meprobamate, primidone, sulfamethoxazole, and TCEP for biochar. For GAC, full-scale MP breakthrough was not well predicted by the PSDM—MP removal was overpredicted by factors ranging from 1.4 to 6.9. For biochar, the PSDM overpredicted MP removal for atenolol, carbamazepine, and sucralose by factors ranging from 1.8 to 2.8.
FI model application
A third method for adjusting RSSCT data to predict MP breakthrough in full-scale columns is the application of a FI, shown in Equations (5) and (6):
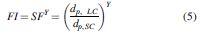
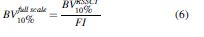
where dp is the adsorbent particle diameter, LC and SC denote large column and small column, respectively, SF is the scaling factor, and Y is the fouling factor (Corwin and Summers 2010). FI is used to adjust RSSCT data to correct for the effects of fouling, which more severely reduce adsorption capacity in full-scale columns compared with RSSCTs [Eq. (6)]. Although complete full-scale breakthrough curves can be acquired using Equations (5) and (6) and RSSCT data, here we are concerned with early breakthrough and so have chosen to focus on BV10% as a basis for comparison.
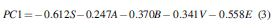
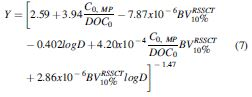
Kennedy et al. (2017) developed an approach to estimate the fouling factor Y based on physical parameters relevant to adsorption, including the ratio of initial MP concentration to DOC concentration (C0, MP/DOC0), the pH-dependent octanol/water partition coefficient (log D), and MP BV10%RSSCT values [Eq. (7)]. MP BV10%RSSCT values are considered a system property that incorporates adsorbent type, particle size, column operation conditions, and background water chemistry. Note that these factors can interact in ways that result in relatively similar Y values for MPs despite differences in BV10% values.
The Y estimation method underpredicted meprobamate removal by the biochar pilot column by 50% (BV10%Y estimation = 220 BV; BV10%pilot = 440 BV) and overpredicted meprobamate removal by the GAC column by 40% (BV10%Y estimation = 4,400 BV; BV10%pilot = 3,200 BV). Pilot column breakthrough predictions generated using the Y estimation method for the other MPs are provided in Supplementary Table S3. For biochar, the Y-estimation method overpredicted atenolol removal by a factor of 1.4 and predicted carbamazepine removal within 5% of the observed value. The Y-estimation method underpredicted biochar removal of the other MPs by factors ranging from 20% to 60% of observed values. For GAC, the Y-estimation method overpredicted removal of atenolol and primidone by factors of 2.5 and 1.2, respectively, and underpredicted removal of the other MPs by factors ranging from 30% to 60% of observed values.
Empirical approach and model comparison
A simple empirical approach developed by Kennedy et al. (2017) used a linear regression to relate natural logarithm-transformed MP BV10% values for 73 pairs of RSSCT and pilot column data points [Eq. (8)]
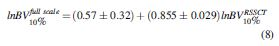
The ± values shown in Equation (8) are standard error values associated with the linear regression performed on the dataset (n = 73) by Kennedy et al. This method underpredicted meprobamate removal in the biochar column by 40% (BV10%empirical = 260 BV; BV10%pilot = 440 BV), but was within 5% of the observed value in the GAC column (BV10%empirical = 3,300 BV; BV10%pilot = 3,200 BV). For biochar, carbamazepine and TCEP breakthrough predicted with this method were within 20% of observed values, and atenolol removal was overpredicted by a factor of 1.3. For GAC, the predicted BV10% value for primidone was within 10% of the observed value, and atenolol removal was overpredicted by a factor of 1.7.
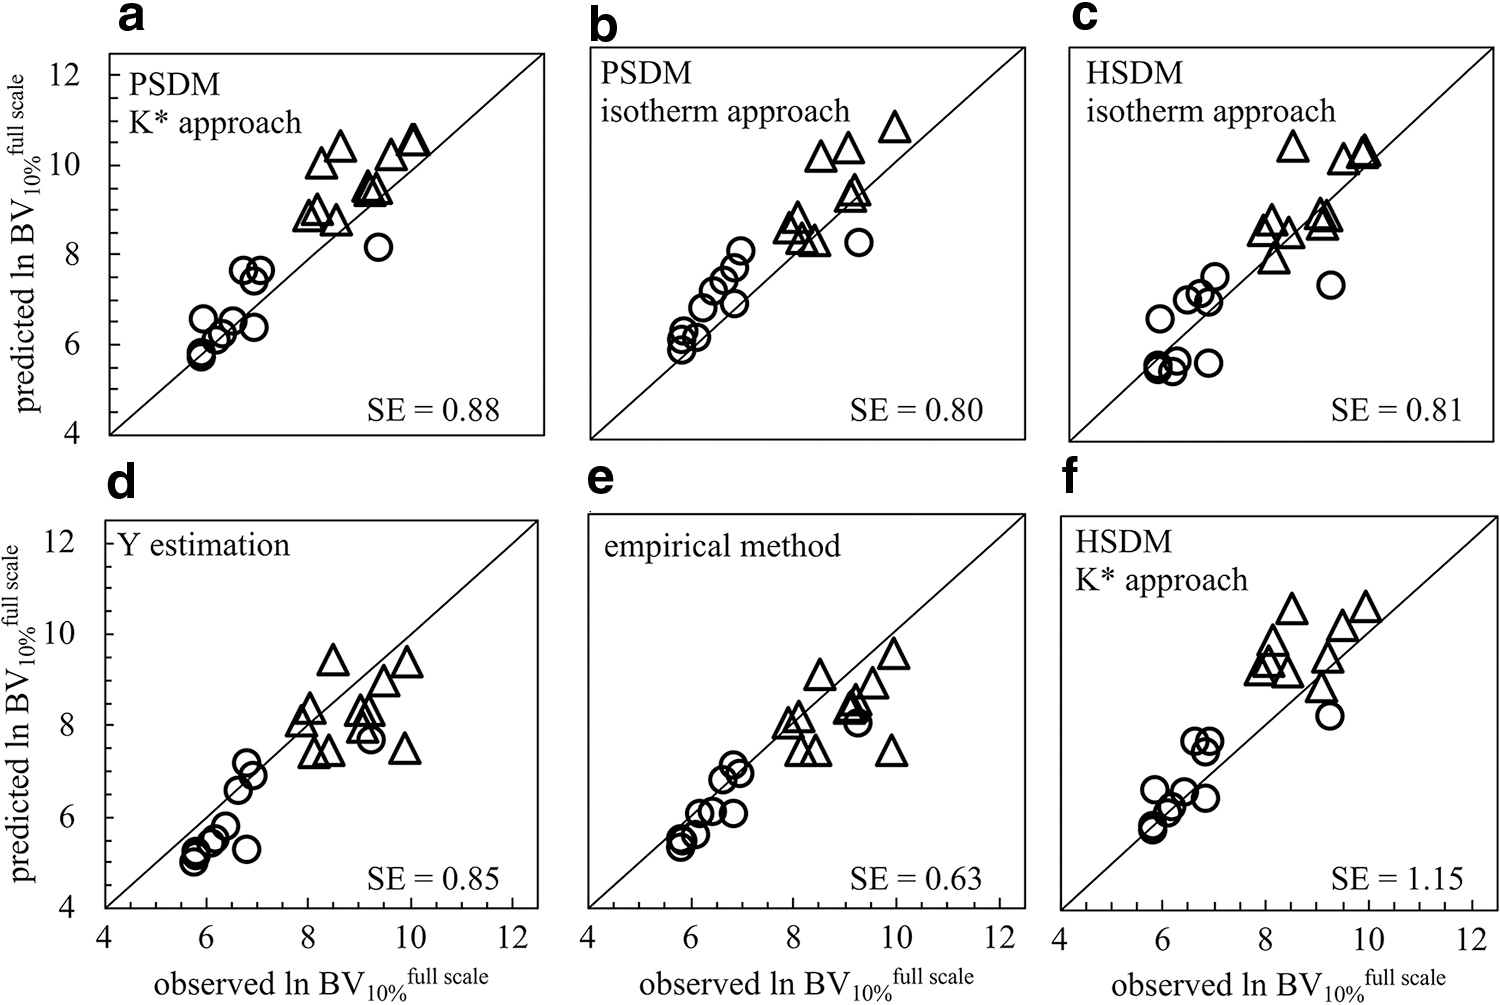
Predicted lnBV10%pilot values obtained using the empirical method, the fouling factor (Y) estimation method, and the HSDM and PSDM isotherm and K* approaches are compared with lnBV10%pilot obtained from pilot column studies in Fig. 3. Standard error values were calculated for scale-up method by comparing predicted lnBV10%pilot to the line of equality representing 1:1 correspondence between predicted and observed values. The empirical method (Eq. (7); Fig. 3e) exhibited the lowest standard error (0.63) compared with the HSDM isotherm and K* approaches (0.81 and 1.15; Fig. 3c, f, respectively), Y-estimation (0.85; Fig. 3d), and the PSDM K* and isotherm approaches (0.88 and 0.80; Fig. 3a, b). Thus, while not providing insight into adsorption mechanisms in the presence of DOM, the empirical approach based on BV10% values appears to be the strongest for predicting full-scale adsorber performance.
Comparison between observed lnBV10% values from pilot column tests with biochar (circles) and GAC (triangles) and lnBV10% values predicted using RSSCT data with PSDM
In an effort to extend and diversify the regression approach developed by Kennedy et al. (2017) to additional MPs, water types, RSSCT approaches, and carbonaceous adsorbents, additional data from the literature (Corwin and Summers, 2010; Kempisty, 2014; Collins et al., 2018) as well as the data gathered in this study were appended to the dataset used by Kennedy et al. The 73 BV10% pair values used by Kennedy et al. included agrichemicals or breakdown products thereof (n = 28), PPCPs or metabolites thereof (n = 19), volatile organic compounds (VOCs; n = 20), disinfection byproducts (DBPs; 4), and the manufacturing additive 1,4-dioxane (n = 2). Literature values were obtained for an additional 21 BV10% pair values consisting of DBPs (n = 4), per-/poly-fluoroalkyl substances (n = 5), and VOCs (12). This study contributed additional BV10% pair values consisting of PPCPs (n = 19) and the flame retardant TCEP (n = 2). Thus, the empirical regression in Equation (9) includes MPs from several compound classes. Similar to this study, the studies from which literature data were obtained also focused primarily on weakly adsorbing compounds. From the perspective of water utility management, these compounds would most likely dictate adsorbent regeneration or replacement frequency. The dataset used by Kennedy et al. contained BV10% pair values determined in surface water (SW, n = 54) and groundwater (GW, n = 19). The literature data added additional BV10% pair values obtained in SW (n = 4) and GW (n = 17), and this study contributed BV10% pair values obtained in WW (n = 18). Kennedy et al. obtained BV10% pair values for bituminous coal-based GACs (n = 60), lignite coal-based GACs (n = 6), and coconut shell-based GACs (n = 7). Literature values added BV10% pair values for bituminous (n = 9) and coconut (n = 12) GACs. This study contributed additional BV10% pair values for bituminous GAC (n = 10) and biochar (n = 11). BV10% pair values used by Kennedy et al. included data collected using the PD-RSSCT approach (n = 67) as well as the CD-RSSCT approach (n = 6). The literature data contributed additional BV10% pair values collected in PD (n = 9) and CD (n = 12) mode, and this study contributed BV10% pair values from CD-RSSCT experiments (n = 21).
Over the entire dataset, full- and pilot-scale EBCTs ranged from 7 to 15 min, and DOC values ranged from 0.4 to 4.9 mg/L. Therefore, the dataset represents a diverse range of adsorbent types, MP target adsorbates, contact times, and background water chemistries. The full dataset (n = 115) was used to develop the regression shown in Fig. 4 and Equation (8). The ranges shown by dotted lines in Fig. 4 and the ± values on the coefficients of Equation (8) are upper and lower 95% confidence intervals (CI). CI are presented in Equation (9) rather than standard error values (CI95% = 1.96 × standard error) as a user-oriented approach to applying this regression. BV10% values can be obtained by running an RSSCT using the adsorbent, MP(s), and water matrix of interest, and then translated using Equation (9) to project performance of a full-scale adsorber with a 95% level of confidence.
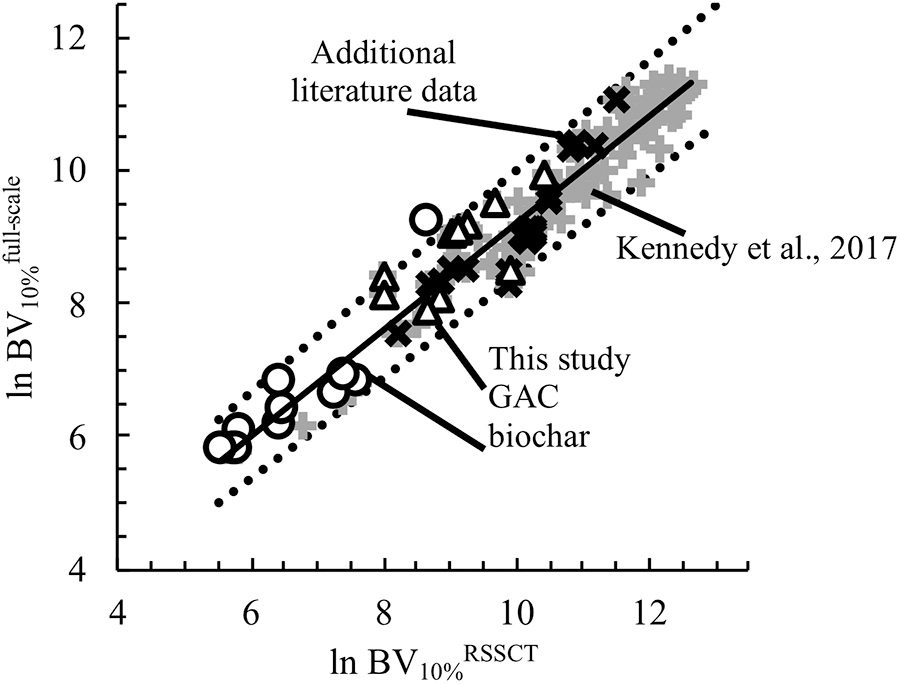
Empirical regression for predicting full-scale ln BV10% values from ln BV10%RSSCT values. Dotted lines represent upper and lower 95% confidence intervals around the regression (solid line). The dataset used by Kennedy et al. is shown by gray pluses, the additional literature data incorporated into the regression are shown by black Xs, and the data collected in this study are shown by open symbols.

Further research is needed to expand our understanding of MP adsorption mechanisms in dynamic fixed-bed systems, especially in the presence of DOM fouling and competitive adsorption. Moreover, this study quantified abiotic adsorption processes but did not consider biotransformation of MPs. However, because this study focused on early breakthrough of weakly adsorbing compounds, it is unlikely that biodegradation had a strong influence on BV10% values. If high levels of MP removal (C/C0 ∼10%) are desired, the empirical approach given in Equation (9) provides a simple user-oriented method for estimating full-scale breakthrough from rapid, small-scale laboratory benchtop experiments. It is noteworthy that the correlation is robust over three orders of magnitude, that is, for BV10% values ranging from ∼250 to 250,000. This likely encompasses the range of practical operation times for carbon adsorber units. Furthermore, the empirical relationship can be refined as more data become available, likely reducing the breadth of the 95% CI and providing more precise guidance for the design and operation of carbon adsorbers treating a variety of water types. Two important limitations of the empirical approach should be mentioned, however. First, its applicability is limited to early breakthrough. At longer run times, such as BV50%, breakthrough curve shapes for different MPs diverge and the empirical correlation weakens. Second, it provides little insight into mass transfer and adsorption mechanisms. For example, it cannot delineate the relative contributions of film, pore, and surface diffusion to MP uptake kinetics.
Conclusions
Batch isotherm tests, pilot column tests, and CD-RSSCTs were conducted in tertiary-filtered wastewater to develop a scale-up approach that accurately predicts MP breakthrough in full-scale biochar and GAC treatment systems. The HSDM and PSDM were fit to CD-RSSCT data using measured and inferred equilibrium capacity parameters, and then translated to predict pilot column breakthrough. A FI approach based on the MP-specific parameters C0/DOC0, BV10%RSSCT, and logD was also used to predict pilot column breakthrough, as well as a direct empirical correlation of BV10%RSSCT and BV10%pilot value pairs. For the conservative criterion of achieving ∼90% MP removal (i.e., BV10%), the direct empirical approach provided the most robust predictive approach for scale-up of the methods studied. Literature data combined with data obtained in this study were used to develop a user-oriented and continually refinable empirical approach to estimating full-scale MP breakthrough for a diverse range of MPs, carbonaceous adsorbents, and background water chemistries from relatively easy-to-conduct RSSCT studies.
Footnotes
Acknowledgments
The authors gratefully acknowledge the funding support from the Water Environment and Reuse Foundation (WE&RF 13-10) for the pilot-scale study. They would like to give special thanks to the Southern Nevada Water Authority's staff, including Mandu Inyang for performing the pilot-scale column testing, and data analysis thereof, of WW in Las Vegas with GAC and biochar, and Marco Velarde for assistance with pilot operation, Oscar Quiñones for the analysis of native MPs, Brett Vanderford for data review, and Janie Holady, Josephine Chu, and Derek Pattinson for sample preparation, coordination, and water quality analysis.
Author Disclosure Statement
No competing financial interests exist.
Funding Information
The pilot-scale study was funded by Water Environment and Reuse Foundation project WE&RF13-10. The lead author received support from a US-EPA STAR Fellowship.
References
Supplementary Material
Please find the following supplemental material available below.
For Open Access articles published under a Creative Commons License, all supplemental material carries the same license as the article it is associated with.
For non-Open Access articles published, all supplemental material carries a non-exclusive license, and permission requests for re-use of supplemental material or any part of supplemental material shall be sent directly to the copyright owner as specified in the copyright notice associated with the article.