
Abstract
To establish an evaluation method for the ecological benefits of rocky desertification control in karst areas, data reference was provided for the benefits of the national comprehensive control project of rocky desertification. This article analyzed the spatiotemporal variation characteristics of soil conservation, water yield, and net primary productivity (NPP) of southwestern China using GIS spatial analysis technology and INVEST Model, the trade-offs and synergistic relationship between ecosystem services and its influencing factors were discussed. The results showed that: (1) During the 15 years, the average value of ecosystem services showed an increasing trend. NPP, water yield, and soil conservation were increased by 43.04 gC/m2, 4.37 mm, and 15.4 t·ha−1, respectively. (2) There was a synergistic relationship between NPP and soil conservation. Increased NPP could improve soil erosion, while water yield exhibited trade-off relationship with NPP and soil conservation. (3) Over the past 15 years, the average comprehensive score of the ecological condition in the study area has increased from 0.30 to 0.31, meanwhile the ecological situation of the study area is gradually improved. (4) Through the analysis of hotspots, we found that more than half of the regions had no hotspots for ecosystem services, meanwhile this region was mainly karst area. Through this study, the trade-offs and synergies between ecosystem services were understood. The ecological benefits of rocky desertification control were evaluated based on the background of ecosystem services, which also provided a reference for the subsequent research on rocky desertification control.
Introduction
Ecosystem is the basis for human survival and development, which is an irreplaceable natural resource and natural asset (Xie et al., 2015). Ecosystem services are the benefits that people derive from natural ecological processes (Bakalowicz, 2005). They mainly include supply, management, and cultural services that directly affect human wellbeing, as well as the support services to maintain above three (Costanza et al., 1997). The ecosystem service functions with complex relationships interact with each other, which are usually expressed as trade-offs and synergies relationship (Chen et al., 2008), this synergy refers to positive interactions, emerging when more services are enhanced simultaneously (Constantina et al., 2019) (i.e., the efforts to protect the coral can increase algal grazing and recreation opportunities (Hughes et al., 2007)). Trade-offs arise when the utilization of one service decreases the benefits provided by another service [i.e., recreational hunting has a negative effect on beekeeping (García-Nieto et al., 2013)]. A correct understanding of the trade-offs and synergies between ecosystem services is of great significance for improving the overall benefits of ecosystem services and achieving a “win-win” for regional development and ecological protection (Vidal-Legaz et al., 2013).
Now, in-depth studies have been performed by many researchers on the trade-offs and synergies between ecosystem services (Li et al., 2018; Washbourne et al., 2020). For example, Tian et al. (2016) used SWAT and CASA models to study the trade-offs and synergies among net primary productivity (NPP), water yield, and sediment yield in typical karst basins in southwestern China. Fu and Yu (2016) analyzed the relationship between land use change and ecosystem services according to the exploration of ecosystem service trade-offs and regional integration methods. Li et al. (2018) took the Guanzhong basin as an example to quantify the trade-offs and synergies among grain yield, water yield, and soil conservation in the study area; Sun et al. (2019) analyzed the spatial and temporal variation and influencing factors of ecosystem service trade-off and synergy on the Loess Plateau; Feng et al. (2017) explored the trade-offs and influencing factors of ecosystem services in the Loess Plateau; Hatanaka et al. (2011) employed tree age classification to analyze the trade-off relationship between carbon sequestration and biodiversity; Onaindia et al. (2013) explored the trade-off relationship between biodiversity, carbon sequestration, and water supply based on the different carbon prices. Many excellent performances were achieved. However, the previous researches always focus on the quantitative study on the trade-off and synergy between ecosystem service functions, therefore, the actual applications are rare.
The largest concentrated contiguous area of karst in China is distributed in the southwest karst mountain area centered on the Yunnan–Guizhou Plateau (Yuan, 1993). It has the characteristics of weakly resistance to external disturbances (Bai et al., 2013), thin soil, and the low vegetation coverage (WU et al., 2012; Deng et al., 2020); Southwest Karst rocky desertification is the primary ecological problem in the southwestern region. It is highly valued by the state and all walks of life (WU, 2016).This study area was selected considering the particularity of its geological and geomorphological characteristics. From the perspective of ecosystem service functions, the ecological benefits of karst rocky desertification control were evaluated through the analysis of the trade-offs and synergy relationship between the ecosystem service functions, people's understanding of karst ecosystem have been improved, also providing some references for the evaluation of ecological governance benefits.
Study area
The southwestern region is located at 97°21′∼117°19′ E, 20°13′∼34°19′N (Fig. 1a), and is composed of Yunnan Province, Sichuan Province, Chongqing City, Hubei Province, Hunan Province, Guangdong Province, Guizhou Province, and Guangxi Autonomous Region (Fig. 1b). Its topographical structure is complex, mainly based on plateaus and mountains, with a total area of 1.94 million km2. The southwestern region is a place where karst is concentrated in China. The area of the karst area is 530,700 km2, accounting for 27.36% of the total area in the southwest (Yuan, 2008). The main climatic types are the humid north subtropical monsoon climate in Sichuan Basin, the middle and south subtropical monsoon climate in the low latitude plateau of Yunnan–Guizhou and the alpine cold zone climate. The annual average temperature is above 15°C, the annual average precipitation is over 1100 mm, and the rainfall and heat are in the same period (Yuan, 2008). The bedrock of the karst ecosystem consists mainly of pure carbonate rocks (25%) and impure carbonate rocks (23%), whereas the bedrock in the rest of the region is composed of clastic rocks (Yuan, 1999).
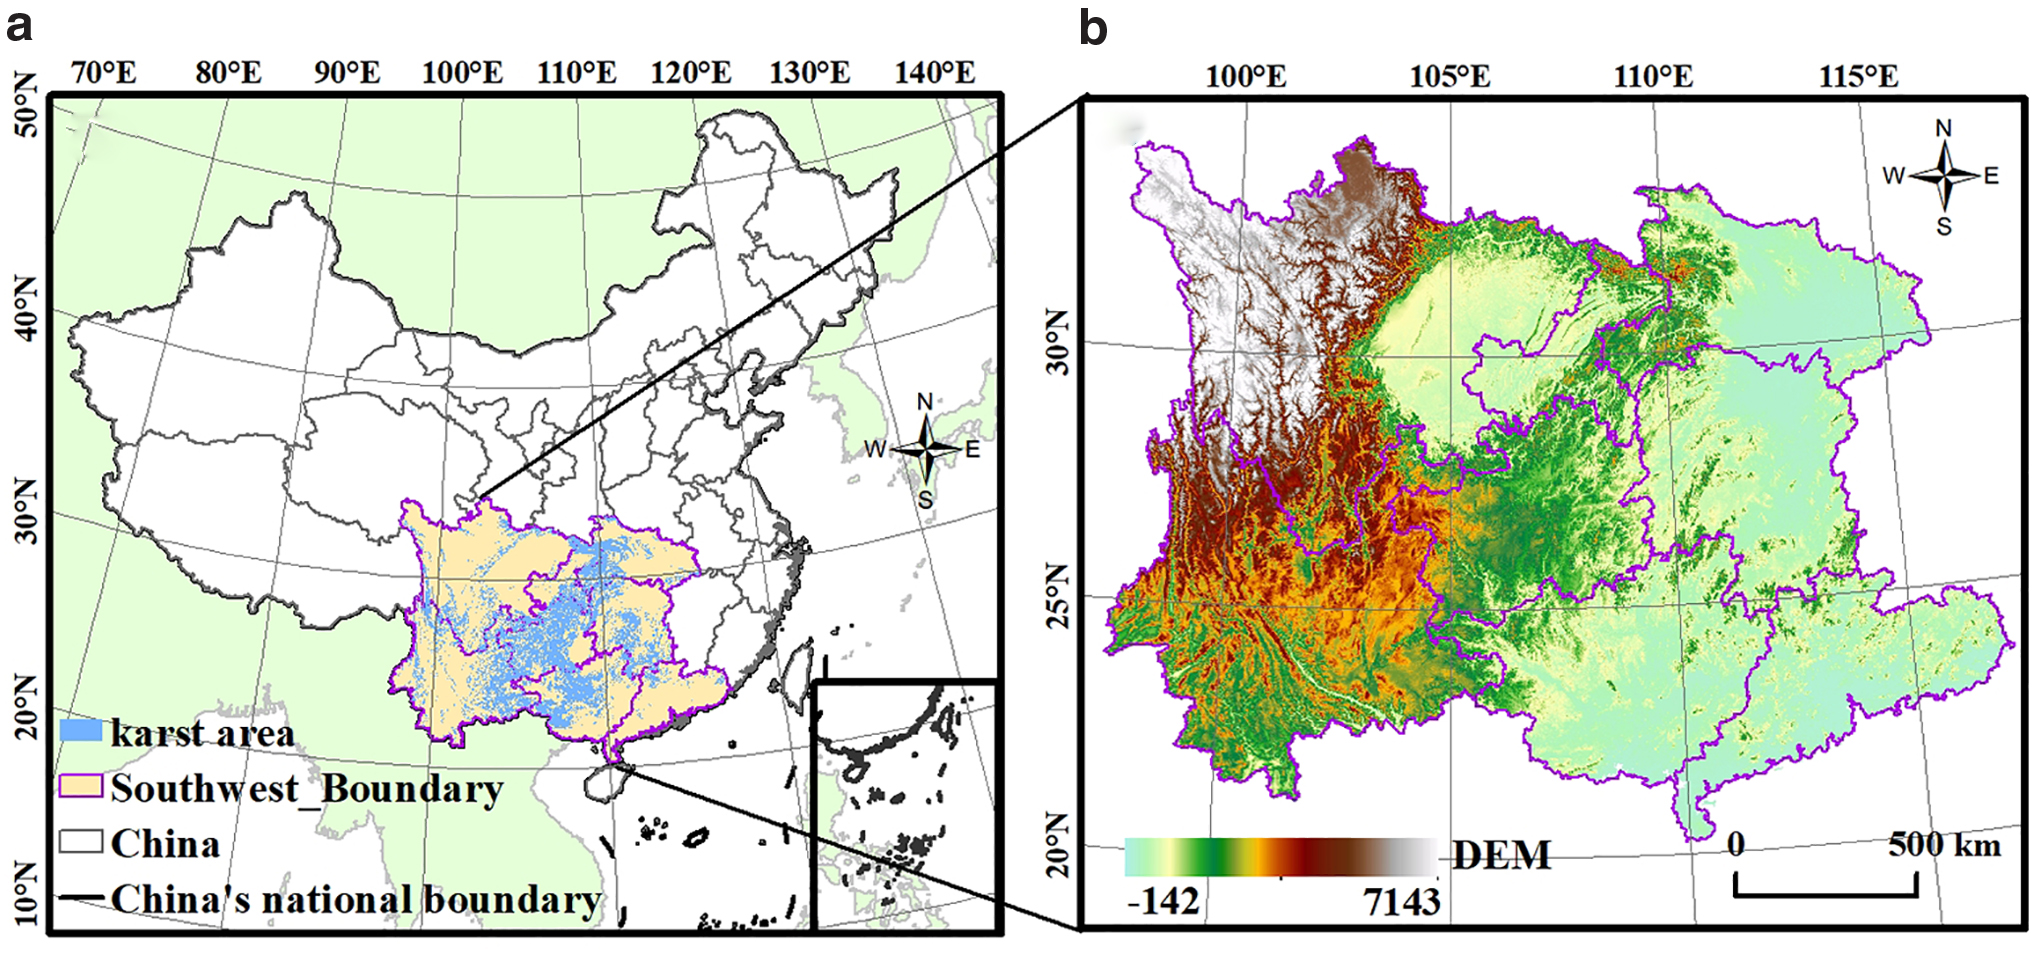
Location map of the study area
Materials and Methods
Data sources
NPP is an important component of the terrestrial carbon cycle and directly reflects vegetation productivity and surface quality (Zhao et al., 2019). The NPP data used in this article are the MOD17A3 global NPP data from NTSG (Numerical Terradynamic Simulation Group) from 2000 to 2015, with a spatial resolution of 30 arc seconds (0.0083°), the data format is Geo TIFF, and the projection format is WGS84 latitude and longitude projection, the scale factor is 0.1 (Zhao et al., 2005; Guo et al., 2006). Data are the annual NPP of terrestrial ecosystems, which were obtained by the NPP estimation model established by reference to the BIOME-BGC model and the solar energy utilization model, and it has been widely used in global and regional NPP and carbon cycle research (Li and Wang, 2018).
The remaining data mainly include land use type map, rocky desertification grade distribution map, administrative division map, DEM, meteorological data, and evapotranspiration in Southwest China. The data sources are shown in Table 1.
Data Sources Table
NPP, net primary productivity.
Methods
Water yield
In this article, the water balance method (Zhang et al., 2009; Xiao et al., 2000; Wang et al., 2019) is adopted to calculate the water yield in the research area, and the calculation formula is:
Y is the average annual water yield (mm), P is the average annual rainfall (mm), E is the interannual evapotranspiration (mm).
Soil conservation
Soil conservation is an important component of ecosystem services and functions (Wang et al., 2019, Bai et al., 2020). The INVEST model's soil and water conservation module formula is as follows:
In the formula, SC is soil conservation, RKLS is potential soil erosion amount, and USLE is actual soil erosion amount. Their units are t/ha·a−1. The USLE was widely applied in multiple previous researches (Fu et al., 2005, Hu et al., 2019, Sun et al., 2014). The calculation formulas of RKLS and USLE are as follows (see Supplementary Data for detailed steps):
R—rainfall erosivity; K—soil erodibility factor; LS—Slope length factor; C—Crop/vegetation cover and management factors; P—Erosion control practice factor.
Comprehensive score of ecosystem services
According to the three indicators of NPP, water yield, and soil conservation in the study area, the comprehensive score of ecosystem service functions in the study area is calculated (Fan et al., 2011). The formula is as follows:
(A represents the comprehensive score of the ecosystem service functions, mi represents the weight value of the i-th indicator, Ai indicates the dimensionless value of the i-th indicator. Xi indicates the actual value of the i-th indicator,
Results
Evaluation of ecosystem services
Net primary productivity
The highest values of NPP in 2000 and 2015 were 1824 gC/m2 and 1872 gC/m2 respectively, which exhibited the increased 48 gC/m2 of NPP in 2000–2015. The distribution of NPP in 2000 and 2015 showed a similar spatial pattern from Figure 2a, b. The average value of NPP in the study area showed an increasing trend in the past 15 years (Fig. 2c), with an increased range of 0–1103 gC/m2, whereas the decreased NPP was concentrated in the south of the research area, with a decreased range of −916 to 0 gC/m2.

Spatial distribution
Water yield
The highest value of water yield in Southwest China in 2000 and 2015 was 1587.84 mm and 1844.42 mm, respectively (Fig. 3a, b). The study area is located at the tropical and subtropical humid regions, the spatial distribution of water yield was low in the northwest and high in the southeast, whereas the total water yield in recent 15 years was increased by 16.15% with an increasing trend (Fig. 3c). The spatial distribution pattern of its water yield has also changed accordingly. In 2000, the high-value areas of water yield were mainly concentrated in the southeast direction of Guangdong and Guangxi provinces, whereas the low-value areas were mainly concentrated in the western part of Sichuan Province. The water yield showed a decreasing trend from the southeast to the northwest between 2000 and 2015, which is relatively consistent with that of precipitation affected by the monsoon climate.

Spatial distribution
Soil conservation
The highest values of soil conservation were 2214.18 t·ha−1 and 2592.01 t·ha−1, respectively, in 2000 and 2015. The highest value of soil conservation in 2000–2015 was increased by 377.83 t·ha−1. It can be noted that the soil conservation in 2000 and 2015 was basically the same in the spatial distribution pattern (Fig. 4a, b), but the total soil conservation was increased by 17.06% with an increasing trend. From 2000 to 2015 (Fig. 4c), the area of soil conservation increased more significantly compared with the soil conservation. While the increased area in soil conservation was particularly evident in northeastern Guangxi and central Sichuan.

Spatial distribution
Ecosystem services of different land use types
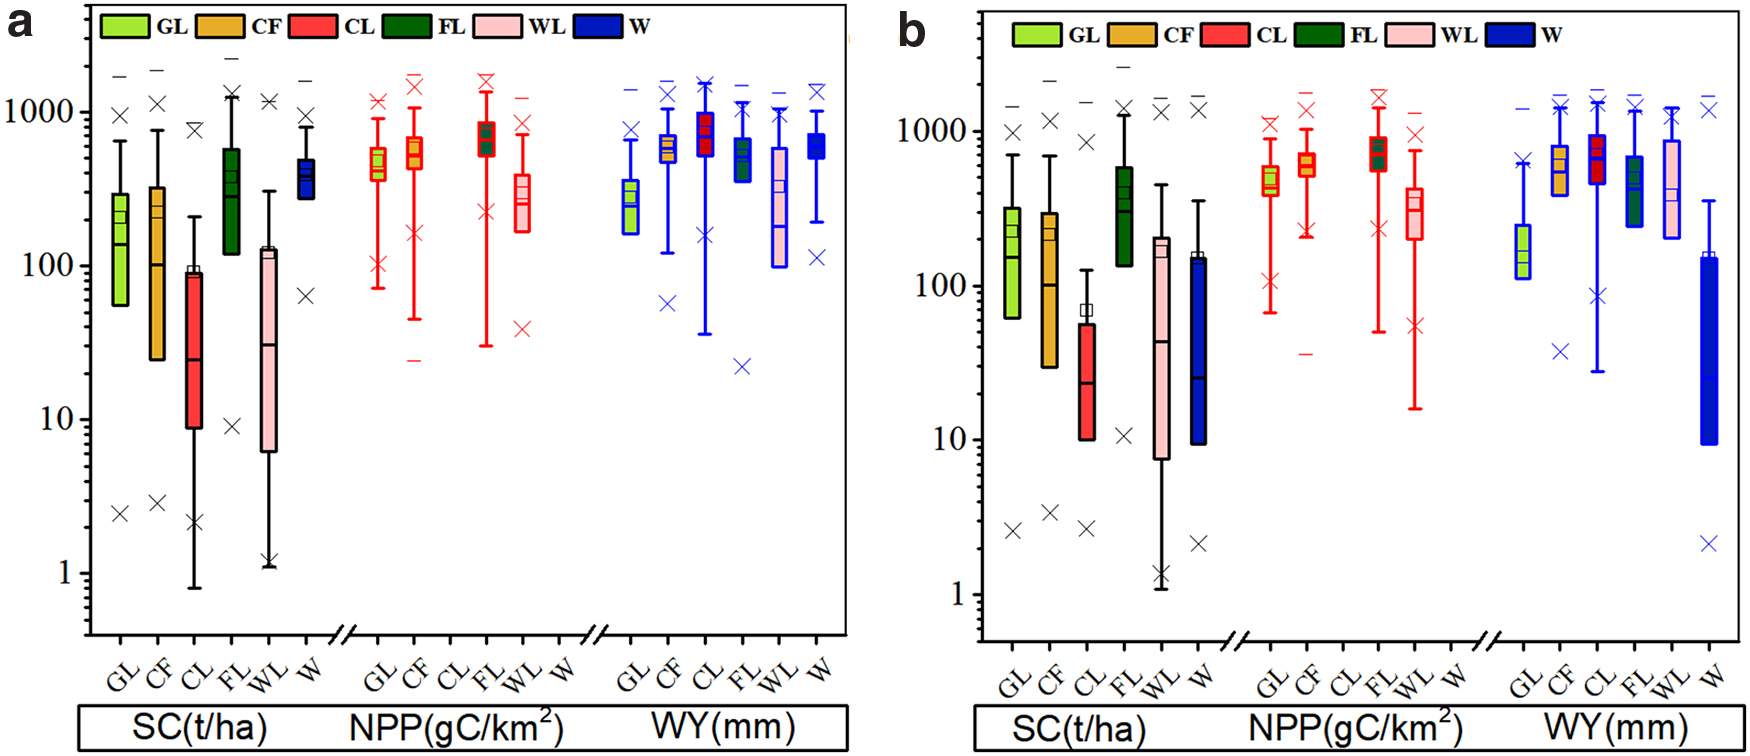
We calculated the values of three different ecosystem services under different land use types (Fig. 5). In 2000 and 2015, the highest soil conservation and NPP in the study area were obtained on the forest land, while the water yield was the largest on the construction land. The vegetation coverage of the forest land is high and the species is rich. The natural photosynthesis of the vegetation fixes a large amount of carbon to the plants and the soil, while the trees rooted in the soil have strong soil conservation ability (Lang, 2017), as a result, the soil conservation of the forest land and the NPP was the largest. The construction land prevents the infiltration of rainfall due to the impermeability of its constituents and materials, forming surface runoff, meanwhile the amount of evapotranspiration of the construction land is small, and the water consumption capacity is weak, thus leading to the large water yield.
Spatial distribution of soil conservation in 2000
In 2000, the order of soil conservation under different land use types was: forest land > water area > cultivated land > grassland > wetland > construction land; soil conservation capacity was related to rainfall, soil texture, vegetation coverage, topography, and other factors (Lang, 2017). The sediment deposition in the water has the ability of interception of the soil to a certain degree; the crops covering the surface of the cultivated land have obvious protective effects on reducing the occurrence of wind and water erosion, which also play a good role in maintaining water and soil for preventing erosion; Grassland has a significant effect on the soil conservation. Herbs are closer to the soil surface and perform better than other plant species, which can better maintain the soil and effectively prevent the erosion of the surface soil. Most of the construction land is naturally exposed, with little ability to block sediment and reduce erosion.
The amount of water yield under each land use type is: Construction land>forest land>cultivated land>water area>wetland>grassland, because of the construction materials, the construction land has a large amount of water; many forests in the forest land possess excellent water storage function; and the amount of water yield by cultivated land is small. Additionally, the irrigation and transpiration of crops consumes a certain amount of water. On the other hand, the shallow roots of crops also have a certain interception effect on rainfall, reducing the formation of runoff; the waters contain a large number of rivers, lakes, reservoirs, etc. the water conservancy facilities store a certain amount of precipitation through effective interception of surface runoff, which hinders the formation of runoff, thus resulting in small water yield in the waters.
The order of NPP values under different land use types is: forest land > cultivated land > grassland > wetland, carbon stocks is highly correlated with vegetation coverage. The cultivated land fully covered by crops can effectively control the soil moisture, and the residual crops withering into the soil can also contribute to the storage of carbon; A large number of herbaceous plants on the grass store carbon in plants and soil through photosynthesis, which has strong carbon storage capacity; wetland aquatic organisms will absorb a part of carbon, leading to the smallest NPP.
Trade-off and synergy analysis between ecosystem services
Correlation between ecosystem services
The creation of fishing net tools was applied to collect samples of various ecosystem services, eliminating outliers, Spearman correlation analysis of soil conservation, water yield, and NPP in different years was carried out by SPSS, then the relevant indexes of different ecosystem service functions were obtained (Table 2). From the table, it can be noted that soil conservation in the study area in 2000, 2015, and 2000–2015 was positively correlated with NPP with respective relevant indices of 0.253, 0.372, and 0.230, which all exceeded the test of 0.01 significant level. The water yield in the study area in 2000, 2015, and 2000–2015 was negatively correlated with soil conservation and NPP with respective correlation coefficients of −0.462, −0.344, and −0.28, which also exceeded the 0.01 significant level test. According to the changes in the function of various ecosystems in the study area for 15 years, soil conservation was positively correlated with NPP, meanwhile water yield was negatively correlated with NPP and soil conservation.
Correlation Table Between Ecosystem Service Functions
at 0.01 level.
Trade-off and synergy analysis of ecosystem services in different land use types
The quantity of different ecosystem services of the same land use type will also change accordingly as time goes by. We use the regional statistical tool to calculate the average of three ecosystem services under different land use types. Origin was used to create the rose map of ecosystem services in different land use types in the study area from 2000 to 2015 (Fig. 6). Figure 6 shows that ecosystem services in forest land and cultivated land exhibit largest value compared with other land types, and the value of each ecosystem service in the unused land is the lowest. From 2000 to 2015, the NPP under different land use types showed a growing trend in different years. The soil conservation also showed an increasing trend under different land use types. The carbon storage was highly associated with vegetation coverage. The increased NPP was beneficial to reduce water yield and soil erosion, which also contributed to the increased soil conservation (Tian et al., 2016). NPP and soil conservation increased simultaneously in the different land use types, whereas NPP is negatively correlated with water yield, so NPP has a synergistic relationship with soil conservation, and water yield and NPP mainly shows the trade-off relationship. The relationship between soil conservation and water yield was synergistic in cultivated land, however, the trade-offs relationship mainly occur in forest land, grassland, wetland, and unused land.
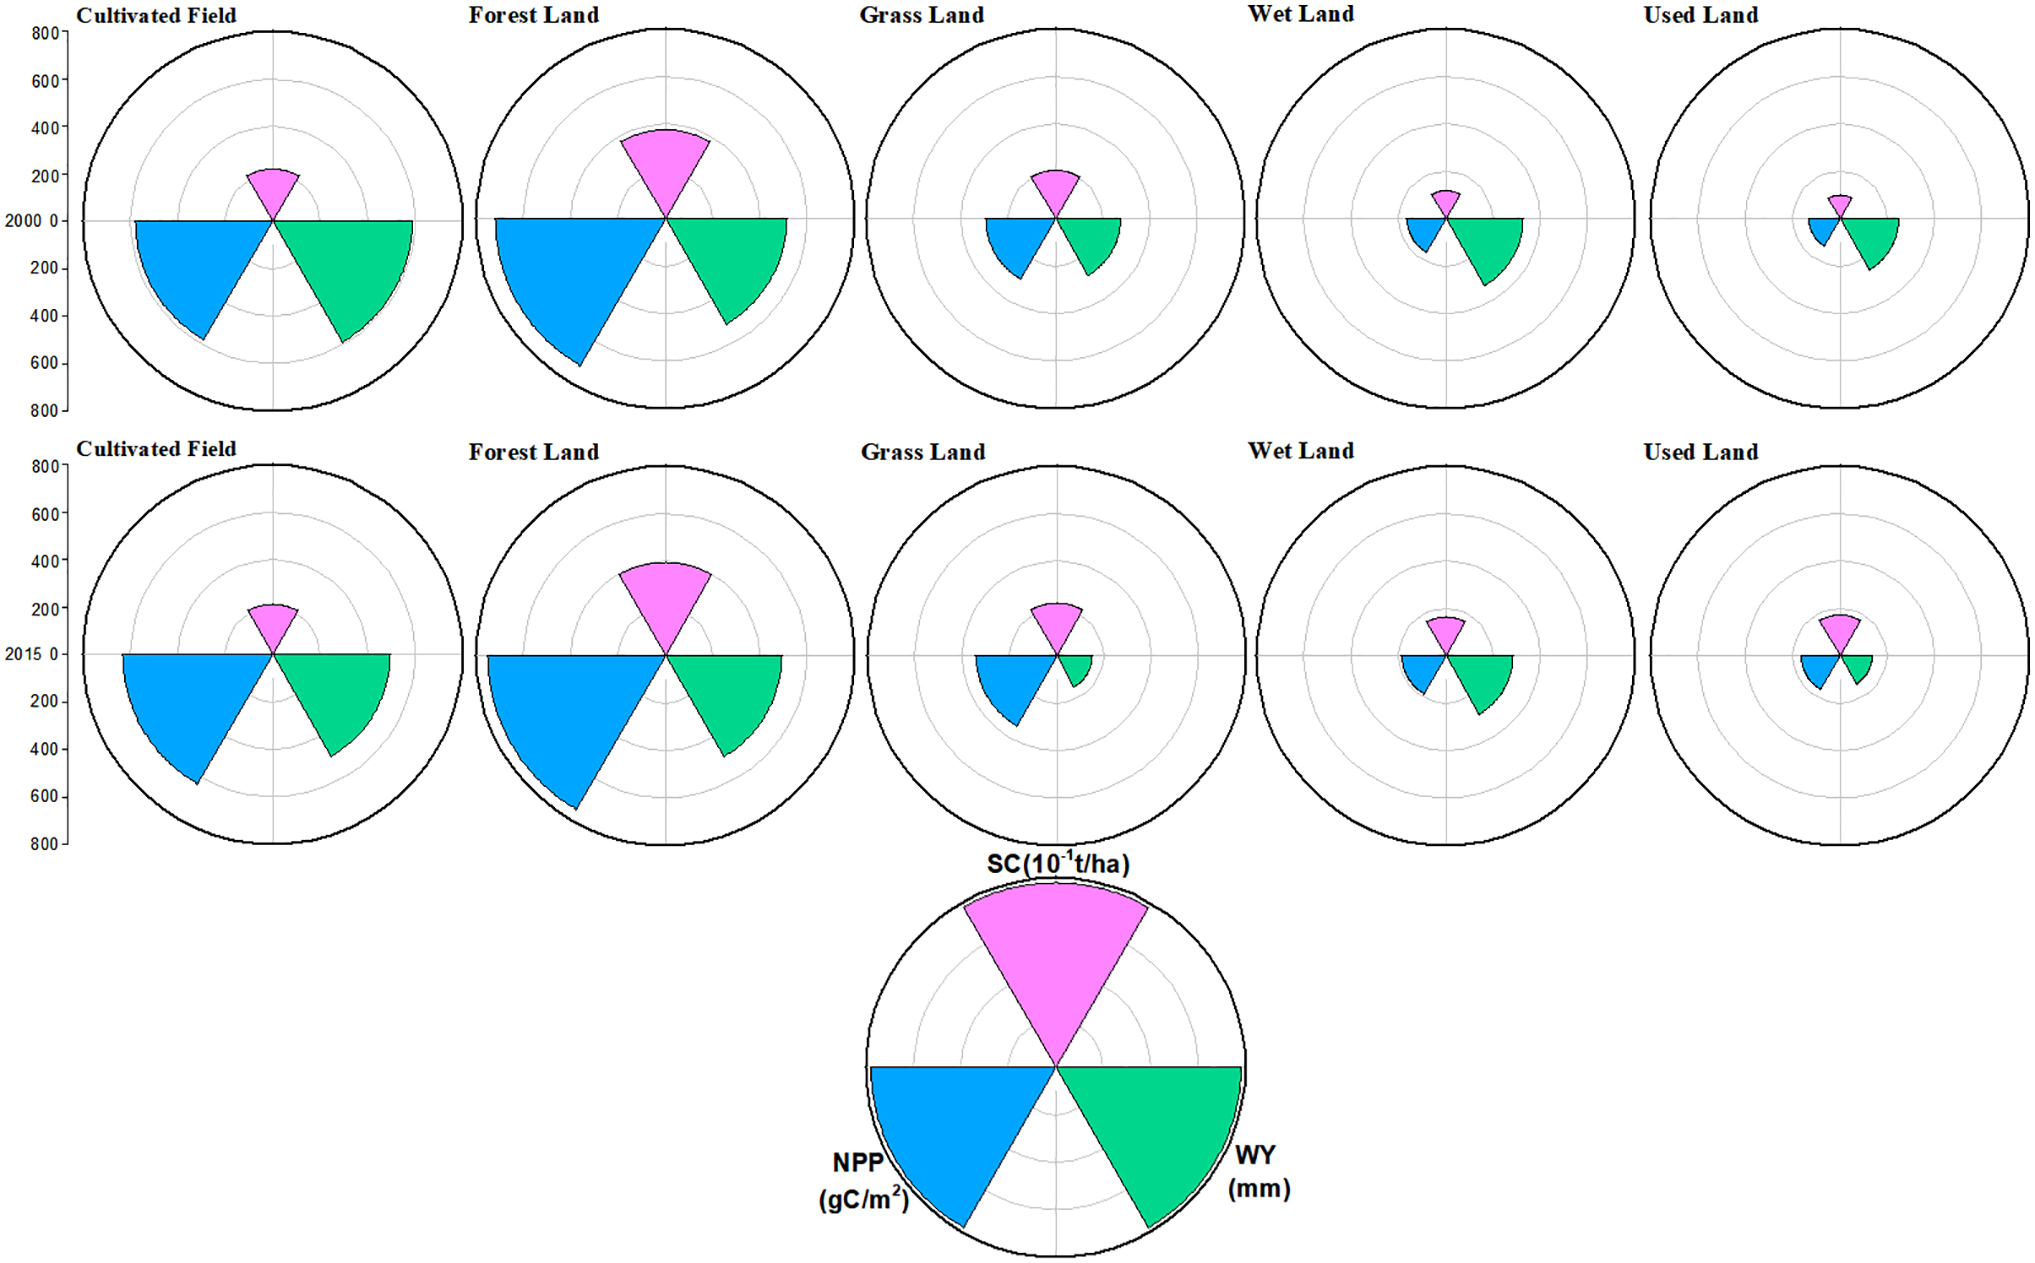
The rose map of ecosystem services in different land use types in study area from 2000 to 2015.
Discussion
Evaluation of the benefits of rock desertification control
We standardized each indicator (NPP, soil conservation and water yield) to a range of 0–1 based on the range standardization method. According to the formula in comprehensive score of ecosystem services, the comprehensive score map of the ecological situation of the study area is obtained as shown in Fig. 7. In 2000, the comprehensive score of the ecological situation of the study area is 0.0002–0.52 with the average score of 0.30. In 2015, the comprehensive score of the study area was 0.0055–0.63 with an average score of 0.34. The comprehensive score of the ecological status of the study area was increased from 2000 to 2015, indicating that the ecological situation of the study area has improved gradually.
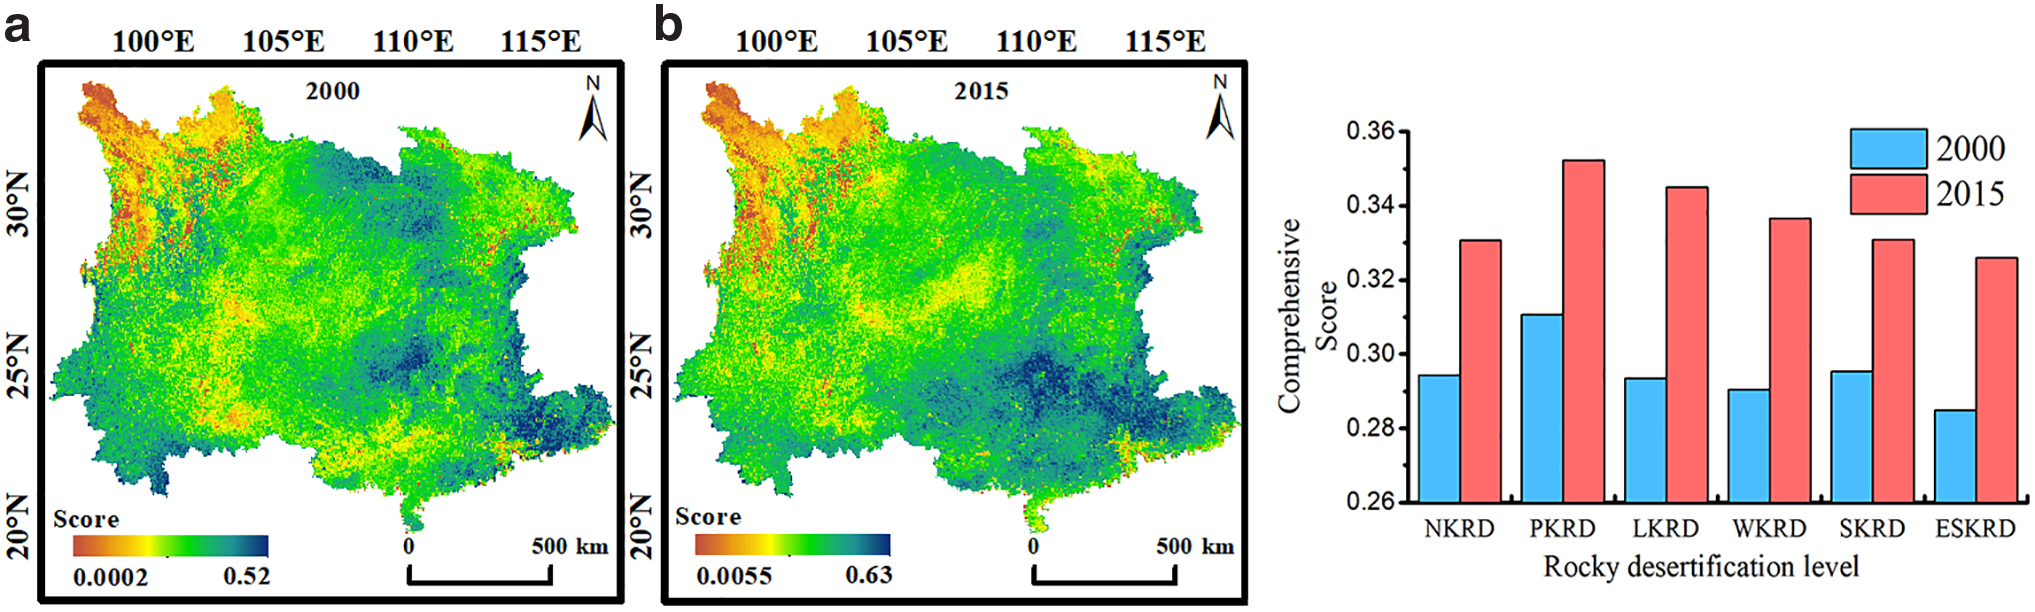
Comprehensive score of ecosystem services in 2000
The higher comprehensive score in the study area results in the better ecosystem service functionality. Combined with Fig. 7 and Table 3, the study area is mainly dominated by potential karst rocky desertification and little karst rocky desertification. In the case of karst rocky desertification area (karst rocky desertification = Little karst rocky desertification+Mild karst rocky desertification+Serious karst rocky desertification+Extremely serious karst rocky desertification) in the southwest, it can be noted from Table 3 that the area of LKRD in the southwest exhibited growing trend and the area was increased by 3343 km2 in 15 years from 2000 to 2015. The areas of moderate, severe, and extremely severe rocky desertification showed a decreasing trend, which was decreased by 6259.34, 7745.44, and 1987.37 km2, respectively. Meanwhile the average score of potential and little rocky desertification areas is higher than that of other rocky desertification grades. This can be mainly explained by nonserious rocky desertification phenomenon in this area, the ecological environment is better than other areas, However, the ecological environment is destroyed by the influence of various human activities although no rocky desertification exists in the no-karst rocky desertification area. In addition, the comprehensive score decreases with the enhanced grade of rocky desertification in the karst rocky desertification area.
Statistical Table of Area of Rocky Desertification of Different Grades in Southwest China from 2000 to 2015 (km2)
ESKRD, extremely serious karst rocky desertification; LKRD, little karst rocky desertification; MKRD, mild karst rocky desertification; NKRD, no karst rocky desertification; PKRD, potential karst rocky desertification; SKRD, serious karst rocky desertification.
Impact of ecological engineering and climate change on ecosystem services
The varied precipitation and temperature play an important role during the process of soil conservation, water yield, and NPP changes (Su and Fu, 2013). We calculated the annual average temperature and precipitation, respectively, which was plotted as shown in Fig. 8, the straight lines drawn through the two figures are the trend lines. From 2000 to 2015, the study area exhibited a trend of climate warming and drying (Fig. 8). Correlation analysis shows that precipitation in the study area seriously restricts the change of water yield (r2 = 0.81**), and the decrease of precipitation contributes to the increased amount of soil conservation (r = −0.16**), which is consistent with similar results of McFarlane et al. (2012) and Fang et al. (2011). Temperature variation is positively correlated with NPP (r2 = 0.36**). Peng et al. (2009) demonstrated that the raised temperature increases NPP by enhancing photosynthesis through metabolism and increasing nutrient availability through higher decomposition rate to increase carbon fixation, which thus agrees well with our results.
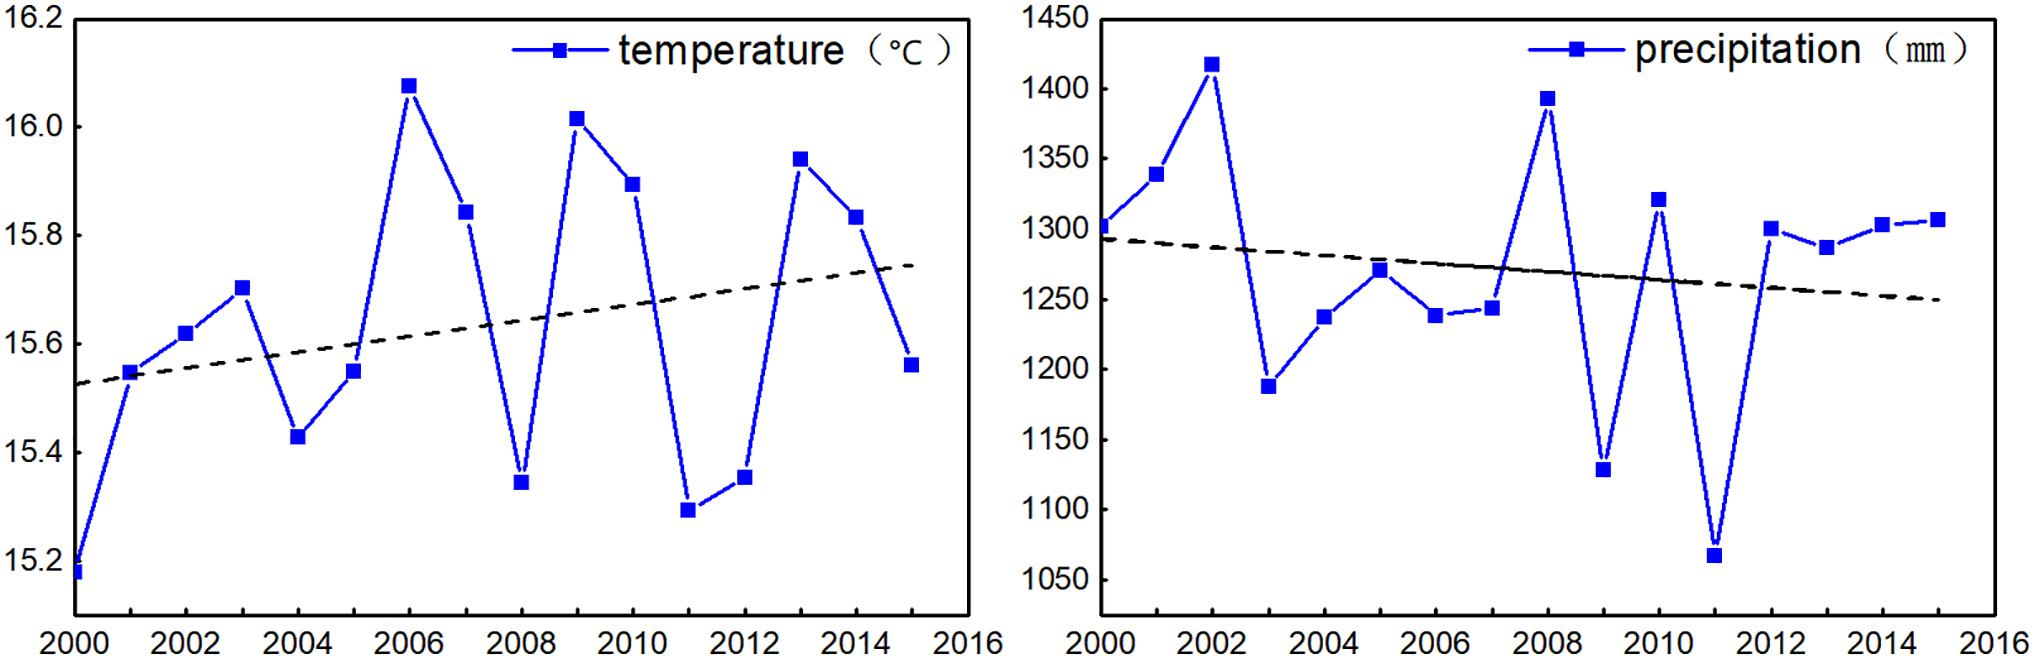
Changes of temperature and precipitation in the study area from 2000 to 2015.
In addition, the unreasonable utilization of land will also cause a series of ecological problems, which is one of the main driving forces to degrade ecosystem service function (Li et al., 2013). To repair the ecosystem, the country has implemented a bunch of ecological protection and construction projects such as natural forest protection, Grain for Green, and comprehensive treatment of karst rocky desertification in the karst area around the theme of rock desertification control and ecological restoration in the karst area (Geng et al., 2006). Through the implementation of a series of ecological restoration projects (Fig. 9), land use/covering has been significantly changed (Liu et al., 2018), which has also affected the changed ecosystem services in the study area. Lu Yudong et al. (2006) pointed out that the vegetation coverage in the basin has been improved with increased plant species and quantity, meanwhile the sediment volume and runoff have decreased with reduced soil erosion, leading to the distinct repair effect (Lu et al., 2006) upon the implementation of ecological restoration project in the southwest soil and rock mountain area.
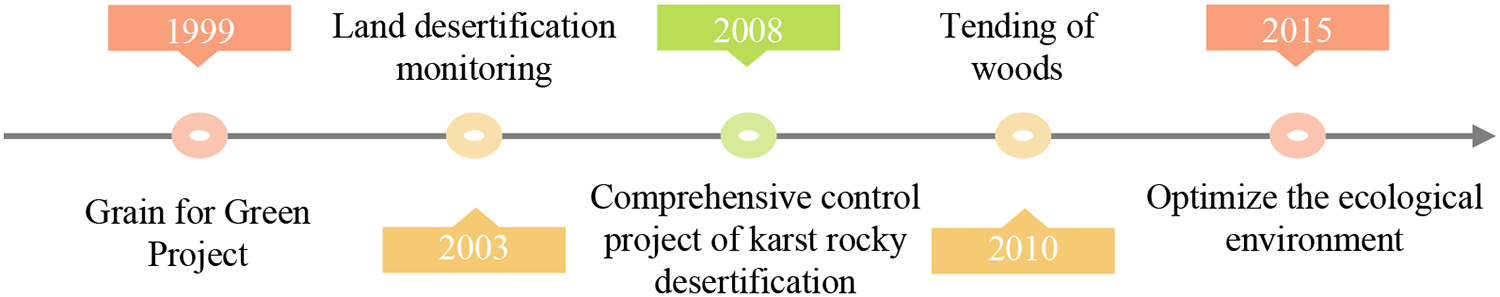
Major ecological events in southwest China in the past 15 years.
Hotspot analysis of ecosystem services
Based on spatial hotspot analysis, the ecosystem services of the study area in 2000 and 2015 were classified according to the raster proportion by the quantile method; the raster number of each level accounted for 20% of the total raster number (Li et al., 2016). High-value area samples were selected for superposition, the number of hotspots will be 3 when they are all high values, by analogy, if there are two functions are high values, the number of hotspots will be 2. From the Figure 10, it can be noted that the overlap proportion of high-value items of ecosystem services was low. In the study area, the proportion of grids with high values of the three ecosystem services was 0.96% and 0.45% in 2000 and 2015, respectively. The proportion of high-value overlapping grids with two ecosystem services is 10.96% and 10.33%, respectively; Only one ecosystem service had a high value of grids accounting for 29.25% and 38.48% of the total grids, respectively; The proportion of grids without high-value areas was 58.81% and 50.60%, respectively. In the past 15 years, the hotspots of ecosystem services in the study area have changed, the distribution area of non-hotspots is the largest, which shows a decreasing trend. The area where the number of hotspots is 1 is widely distributed, but it exhibits an increasing trend, and it is most obvious in the southeastern part of the study area. The area where the number of hotspots is 2 is relatively scattered, which is mostly distributed on the forest land. The distribution area of hotspots with a number of 3 is very small, and the land use type is mainly cultivated land.
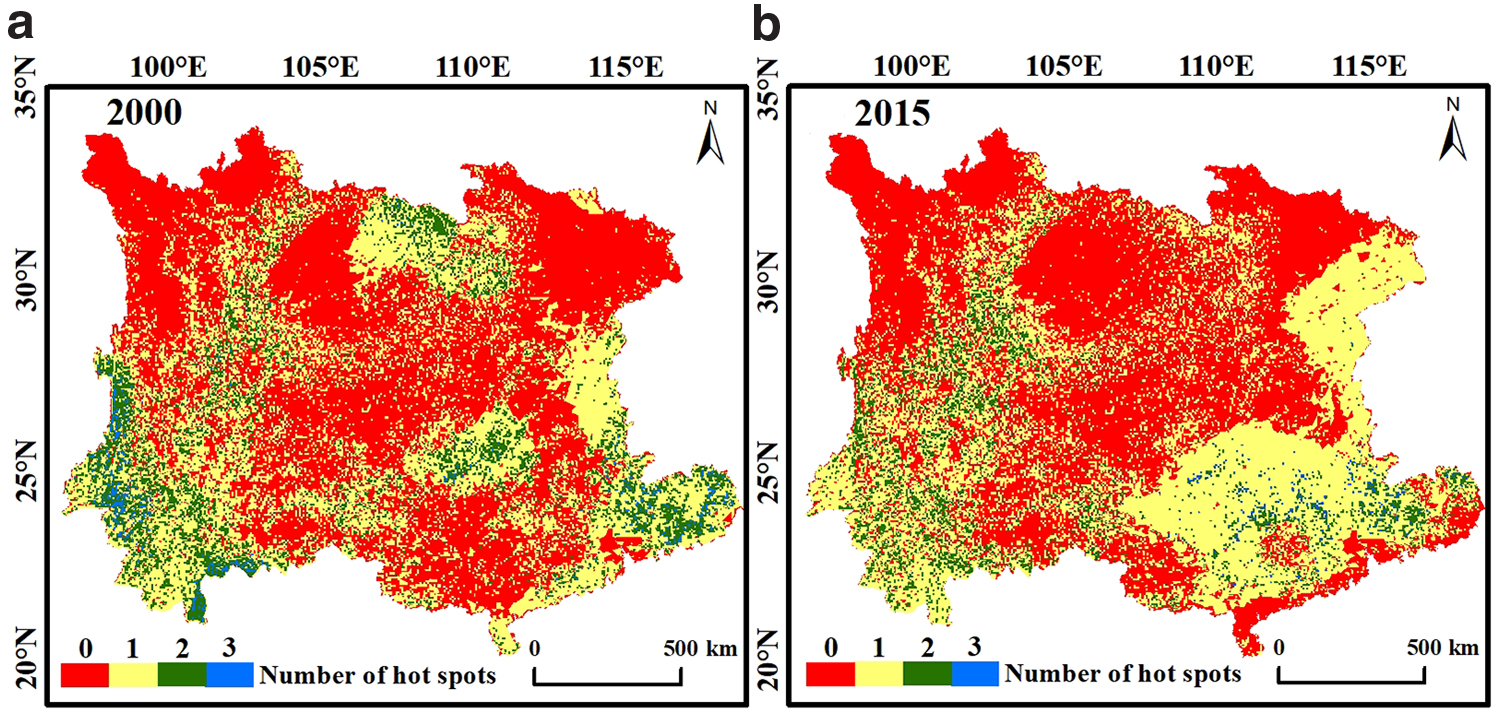
Distribution of ecosystem service function hotspots in 2000
The number of hotspots of ecosystem services in the study area is correspondingly reduced as the rocky desertification grade increases (Table 4). In the no karst rocky desertification area, hotspots in each ecosystem service function shows the largest number. As the grade of rocky desertification increases, the proportion of hotspots in each ecosystem service function is gradually reduced. In the serious and extremely serious karst rocky desertification area, almost no hotspots is observed in gathered three ecosystem services, because the serious surface exposure in karst rocky desertification area is seriously degraded by ecological environment, so the ecosystem service functions are also weak.
The Proportion of Hotspots in Different Karst Rocky Desertification Grades (%)
Conclusions
The southwest China was selected as the research area in this article, we studied the spatial and temporal changes of NPP, water yield, and soil conservation of the area in 2000 and 2015, and analyzed the trade-offs and synergies among these three ecosystem services. The main conclusions are as follows:
All ecosystem services in the study area showed an increasing trend from 2000 to 2015. NPP, water yield, and soil conservation were increased by 2.63%, 16.15%, and 17.05%, respectively. Forest land has the highest contribution rate of 51% and 59% to NPP and soil conservation, respectively. The highest value of water yield is achieved in the forest land, but the cultivated land contributes 49% of the water yield. Among the different land use types, the land with the strongest NPP, soil conservation, and water supply capacity is cultivated land and forest land. There is a trade-off relationship between the water content of the five major land types and NPP, and the NPP maintains a synergistic relationship with the soil. Soil conservation and water yield are synergistic in cultivated land, however, the trade-off relationship is dominant in forest land, grassland, wetland, and unused land. The comprehensive score of the ecosystem increased by 23.3%. Through the implementation of a series of ecological restoration projects, the ecological condition of the research area gradually improved. The multiecological service hotspots in the study area are mainly distributed in the southwest and southeast, the region is mainly non-karst ecosystems, and the most ecosystem services are provided by forest land. More than 50% of the regions have no ecosystem service hotspots, which are mainly karst areas.
To maximize the function of ecosystem services, policy makers should focus on improving soil conservation in the western part of the study area, water yield services in the southeast, and NPP and strengthening the implementation of ecological projects based on the balance of ecosystem services. Ecosystem service functional trade-offs are employed to develop ecological protection and management policies that could improve human wellbeing and enhance human capacity to respond to changes in the natural environment.
Footnotes
Author Disclosure Statement
No competing financial interests exist.
Funding Information
This research work was supported jointly by the Strategic Priority Research Program of the Chinese Academy of Sciences (No. XDA23060100), the National Key Research Program of China (No. 2016YFC0502300 & No. 2016YFC0502102), Western Light Talent Program (Category A) (No. 2018-99), United Fund of Karst Science Research Center (No. U1612441), Science and Technology Plan of Guizhou Province of China (No. 2017–2966).
References
Supplementary Material
Please find the following supplemental material available below.
For Open Access articles published under a Creative Commons License, all supplemental material carries the same license as the article it is associated with.
For non-Open Access articles published, all supplemental material carries a non-exclusive license, and permission requests for re-use of supplemental material or any part of supplemental material shall be sent directly to the copyright owner as specified in the copyright notice associated with the article.