
Abstract
Naturally occurring arsenic is one of the most important groundwater contaminants threatening drinking water quality worldwide, but the extend of the risk is geographically variable. In this research, arsenic contamination is investigated in groundwater resources of Sirjan Plain, Iran. Seasonal sampling (winter 2015 to spring 2017) was done in the wells and the arsenic concentration in water resources was measured. The results showed that the arsenic concentration during the sampling period varied from 1 to 200 μg L−1 such that 68.1% of the groundwater samples contained arsenic more than the 10-μg L−1 limit set by World Health Organization (WHO). Studying clay layers in well logs revealed a geographic correlation between clay layer thickness and high arsenic concentration. To predict fluctuations of groundwater level, the quantitative plain mathematical model was prepared using the finite difference method and the MODFLOW model was prepared in Groundwater Modeling System (GMS) software. Finally, the changes in arsenic concentration were forecasted based on the obtained results. For this purpose, the level of observation wells in September 2010 was considered a steady period. The hydraulic head of all piezometers was calibrated, where the data of the piezometric well level from October 2010 to September 2016 (in 72 months) were considered an unsteady period. The model was validated for 12 months from October 2016 to September 2017. The prediction period set in the model is from October 2017 to September 2022. The results showed that with the increased use of groundwater and declining water levels, the arsenic concentration was increased, as well. This is due to the oxidation of minerals in the clay layer and the subsequent release of arsenic into groundwater. In conclusion, by water consumption management and reduced use of groundwater resources in the Sirjan Plain, the arsenic concentration would increase at a lower rate.
Introduction
Arsenic is the most important naturally occurring metalloid with the highest contamination potential among toxic trace elements in the environment (Bundschuh et al., 2013; Barats et al., 2014). This element is known as a very dangerous carcinogen (Smith et al., 1992) and one of the most important environmental pollutants, especially in groundwater (Ahmadi Jebelli et al., 2017).
Groundwater is one of the water supply resources for millions of people in the world. Therefore, its contamination has major effects on human health, industry, agriculture, and the environment (Jousma et al., 1987). Arsenic contamination in groundwater resources has become a serious threat to human health (Chang et al., 2013). Several studies have proven an association between the arsenic content of water and diabetes and cancers of the skin, lung, liver, kidney, and bladder (Duker et al., 2005; Litter et al., 2010; Camacho et al., 2011). According to the British Geological Survey (BGS) and Department of Public Health Engineering (DPHE), 57 million and 35 million people may drink arsenic-contaminated water above 10 and 50 μg L−1, respectively (BGS and DPHE, 2001; Chakraborti et al., 2010). The U.S. Environmental Protection Agency reduced the maximum permissible concentration of arsenic in drinking water from 50 to 10 μg L−1in 1993 (Thakur et al., 2011).
In the environment, arsenic exists in oxidation states, including −3, 0, +3, and +5. In natural waters, it mainly exists in inorganic forms of pentavalent arsenate [As(V)] and oxyanions of trivalent arsenite [As(III)] (Smedley and Kinniburgh., 2002). As(V) predominates surface water under oxidizing conditions. On the other hand, in anoxic water under reducing conditions, As(III) becomes stable (Kelly et al., 2005). Arsenic mobilization in groundwater is mainly controlled by adsorption on metal oxyhydroxides and clay minerals. Arsenic also exists in mineral form in pyrite (i.e., arsenopyrite). The groundwater table decline due to overpumping causes pyrite (and/or arsenopyrite), oxidation, and dissolution, which leads to the release of arsenic to the groundwater.
The concentration of arsenic in soils is greater than that in rocks (Yan-Chu, 1994). Generally, clay and silty soils contain a larger amount of arsenic compared to sandy soils (O'Neill, 1995). Huang et al. (2006) established statistically significant relationships between arsenic concentration and silt and clay contents in many of Chinese soils. The arsenic contamination of groundwater resources has been observed in many parts of the world, such as Argentina, Mexico, Bangladesh, India, Nepal, Thailand, China, Taiwan, Vietnam, Chile, and Romania (Smedley and Kinniburgh, 2002).
Zhou et al. (2016) examined the spatial distribution of arsenic in the groundwater resources in the northern, eastern, and southern parts of Xinjiang, China. They reported that more than 12% of groundwater resources have arsenic levels above 10 μg L−1 and the arsenic concentration is increased with an increase in sampling depth. Shrestha et al. (2015) investigated the arsenic contamination of groundwater resources in Kathmandu, Nepal. According to their results, the range of variations in arsenic concentration was between 3 and 137 μg L−1. Also, 17% and 26% of groundwater wells exceeded World Health Organization (WHO)-permissible arsenic concentration of 10 μg L−1 for drinking water premonsoon and postmonsoon, respectively.
Yadav et al. (2014) investigated the spatial and temporal changes in arsenic concentrations in the groundwater of the Ganges Basin in Nepal and showed that the mean concentration of arsenic was maximum (3100 μg L−1) in summer and minimum (36.7 μg L−1) in winter. They also state that spatial variations in arsenic concentration were probably due to the geographic conditions of the area and the depths of the wells. Han et al. (2013) studied the spatial variations in arsenic in Yinchuan Plain, China. According to this study, arsenic had significant spatial variations in groundwater in the studied area. The concentration of arsenic in deep groundwater (40–250 m), except for seven wells, was less than 10 μg L−1 with a mean of 7 μg L−1. In comparison, in the shallow groundwater (4–40 m), the arsenic concentration varied from 1 to 177 μg L−1. Francisca and Carro Perez (2009) used Kriging interpolation method to determine the spatial distribution of arsenic in groundwater in Cordoba Province, and Argentina, and concluded that about 90% of the region contained arsenic over the standard limits.
Munk et al. (2011) investigated the seasonal fluctuations and arsenic mobility in groundwater resources in Anchorage, Alaska. They performed sampling from May to October 2007 from eight drinking water wells to determine the inorganic arsenic species (As+3 and As+5) and other chemical-physical parameters of the groundwater. The positive correlation of arsenic concentration with water level showed that the highest arsenic concentration occurred during the recharge period of the aquifer. Moreover, positive relationships with dissolved Fe and supersaturation concerning secondary Fe oxides demonstrate that the arsenic is likely associated with the Fe oxides that are partially dissociated under the dominating reducing conditions of the aquifers.
Guo et al. (2012) investigated the spatial variations of arsenic and fluoride concentrations in the groundwater in the city of Shahai located in Inner Mongolia. According to the obtained results, arsenic had wide spatial variations within 0.96 to 720 μg L−1in the region, and 71% of the samples contained arsenic above the WHO standard limits for drinking water (10 μg L−1). The fluoride concentration ranged from 0.3 to 2.57 μg L−1, and there was no significant correlation between the concentrations of arsenic and fluoride. Moreover, they showed that low arsenic concentrations (<10 μg L−1) are found in groundwater at depths less than 10 m. On the other hand, high groundwater arsenic concentration is associated with aquifers that have thick overlying clay layers. Lee et al. (2007) prepared a spatial distribution map of arsenic using the Kriging method in Lanyang Plain, in northeastern Taiwan, and identified the critical areas of the groundwater of the plain.
In Iran, arsenic contamination has been reported in provinces such as East Azerbaijan and Kurdistan. This element pollutes both public water and groundwater in this area (Sadeghi et al., 2017). According to a cross-sectional study in East Azerbaijan province, the mean arsenic concentration is 1030 μg L−1 in water samples in this area. In this regard, the incidence of hypertension and skin lesions due to arsenic exposure has been reported in Ghopuz village. Hence, some types of cancer in this region can be attributed to arsenic exposure through potable water (Sadeghi et al., 2017). Pazand and Javanshir (2013) studied groundwater arsenic contamination in the Rayen area (SE Iran) and showed that about 25.62% of water samples had an arsenic concentration above the WHO-permissible value for drinking water. Based on the results, the highest concentration of arsenic in these samples is up to 25,000 μg L−1.
Sadeghi et al. (2017) evaluated arsenic concentration and its dispersion in drinking water in Ardabil city during four seasons. By statistical analysis, they showed that arsenic concentration in 75, 88, 47, and 69% of samples in fall, winter, spring, and summer, respectively, exceed the WHO and Iranian national standard (10 μg L−1). The mean arsenic concentrations in spring, summer, fall, and winter were 10.87, 14.6, 19.89, and 15.9 μg L−1, respectively, and its total annual mean concentration was 15.32 μg L−1. Abbasnejad et al. (2013) examined the concentration of arsenic in the groundwater resources of Bardsir Plain, Iran. The results showed that the arsenic concentration ranged from 1.3 to 454.5 μg L−1 and its mean concentration during the sampling was 134.2 μg L−1.
In Iran, the springs, hand-dug wells, and deep wells are used for drinking purposes. Since the quality of drinking water, especially in terms of arsenic concentration, affects the life of a large number of people, monitoring the water resources for ensuring the community health is of great significance. Groundwater is the only source of potable freshwater in Sirjan Plain. In this plain, the highest share of water sources is consumed by livestock and agricultural purposes (Dehbandi et al., 2019). So it is required to have a good understanding of the quality and spatial distribution of groundwater in the study area regarding arsenic contamination and to detect zones with a high concentration of arsenic.
The main objectives of the present study are as follows: (1) to evaluate arsenic contamination in groundwater resources in the Sirjan Plain, Iran, (2) to examine the relationship between changing groundwater level and the release of arsenic, and (3) to predict arsenic concentration to September 2022.
Materials and Methods
Study area
Sirjan is a city in Kerman Province, which is located in the southeast of Iran. The population of the city is about 324,000 and the economic system of this region is based on activities in the agricultural and industrial sectors. The groundwater resources of Sirjan Plain provide the major part of drinking and agricultural water consumption in the region, such that 98% of the water taken from the aquifer is consumed in the agricultural activities.
The research region is Sirjan plain, with the area of about 3982 km2 between the geographic longitude of 54° 57′ and 56° 26′ E and geographic latitudes of 28° 47′and 29° 58′N. The study area is a part of the basin of the Central Plateau of Iran. Sirjan as the largest city in the area is situated in the center of the plain. The region has a semiarid climate with a maximum temperature of about 27.8°C in July and a minimum temperature of 4.3°C in January. The average potential evaporation of the area is 3250 mm per annum. The humidity in the area varies from a minimum of 27% to a maximum of 48%. The average annual precipitation is about 156 mm (Rahnama and Mirabbasi, 2010). The maximum and minimum heights of area are 3813 and 1650 m above sea level (m.a.s.l), respectively (Mirabbasi and Eslamian, 2010). The major recharge of the Sirjan Plain is related to the basins and streams in the east and northeast. In this plain, groundwater is used for various purposes such as drinking, agricultural, domestic, and industrial needs. The groundwater depth level varies across the plain surface. This depth – as a function of the exploitation conditions of the aquifer and the topography and physical properties of the soil – varies from the maximum of 140 m to less than 20 m. Figure 1 presents the geographic location, geological map, and positions of sampling points of Sirjan Plain.

Geographic location, geological map, and positions of sampling points of Sirjan Plain (Soheili, 1995).
Sampling of the groundwater resources
To examine the arsenic contamination of groundwater resources of Sirjan Plain, after conducting primary field studies and taking into account the position of the observation wells, the seasonal sampling (winter 2015 to spring 2017) was carried out from agricultural and drinking wells near observation wells. Water samples were collected in 1 L polyethylene bottles washed previously with 5% nitric acid and double-distilled water. Samples were stored at 4°C and transferred to a laboratory after adding 1 mL of concentrated nitric acid. In laboratory experiments, arsenic was measured by inductively coupled plasma mass spectrometry.
Mathematical modeling
To predict groundwater table variation in Sirjan Plain, its mathematical model was built, assuming a similar groundwater harvest condition. The Groundwater Modeling System (GMS) version 7.1 software was used to simulate the groundwater flow. This software supports the groundwater numerical code MODFLOW. The aquifer was modeled as a single-layer unconfined system.
Based on the surface area of the modeling area, it was divided into 500 × 500 m pixels. All modeling information required in this study was supplied from the Ministry of Energy of Iran. DEM maps with a scale of 1:250,000 were used to determine ground-level evaluation. Transmissivity of the aquifer and its specific yield were reported to be 352 to 867 m/day and 0.0035 to 0.0435, respectively. To prepare hydraulic conductivity information layer of the aquifer, its initial hydraulic conductivity was calculated using its transmissivity value and saturated thickness. Next, the aquifer was interpolated using the Kriging method and the results were generalized to the entire area. Discharge factors from the groundwater sources of the plain include aqueduct and exploitation wells constructed for drinking, agriculture, and industrial purposes.
Since the MODFLOW model does not have a package for introducing the aqueducts, they were introduced as well to the model. The discharge statistics of the wells and aqueducts are available on an annual basis, but the selected modeling unit is on a daily basis. Therefore, applying a simplification assumption, the needed daily data were homogenously calculated for all days year-round for both steady and unsteady conditions.
The input and output boundaries were determined based on the groundwater flow direction. According to the flow direction and topography of the study area, there are general head conditions in the north, northeast, southeast, and western parts and the other parts show no-flow boundary. Water table statistics of the piezometric wells for September 2010 were introduced as the initial conditions of the model.
Modeling data
The modeling data needed in this study (i.e., ground level, bedrock level, the location and exploitation level of the wells, the location and water level in the observation wells, the location of aquifer boundaries, hydraulic conductivity layer, and recharge) were introduced into the model. After building the constitutive model and setting the initial and boundary conditions, the model was calibrated under steady conditions. Investigating the unit hydrograph of groundwater in the plain and based on the available statistics and information indicate that the hydrograph of the most piezometers in the summer of 2010 has an almost constant value. So it can be assumed that the underground recharge and well discharge of the aquifer in these 3 months are in balance. As a result, the level of observation wells in September 2010 was considered a steady period.
In this research, the observation well level data were used for the calibration purpose. The hydraulic conductivity coefficient is among the parameters used for this purpose under steady states. Afterward, boundary conditions and surface recharge levels were adjusted to minimize the difference in calculation and observation results.
Calibration was done manually and using the PEST (Parameter Estimation) codes. Following the calibration, the piezometers were within the acceptable range (Fig. 2). After calibration of the model for steady state, it was calibrated for unsteady conditions. Specific yield (storage coefficient) is the most important parameter that was optimized through the calibration process for the unsteady state. To run the model under unsteady conditions, data of the piezometric well level from October 2010 to September 2016 (in 72 months) were considered an unsteady period. The model was validated for 12 months from October 2016 to September 2017. Through this process, the surface data and information were introduced to the model monthly. The values of exploitation well pump age and precipitation level for this period were imported to the model within 1-month intervals. Hydraulic conductivity, storage coefficient, and boundary conditions were considered constant variables.
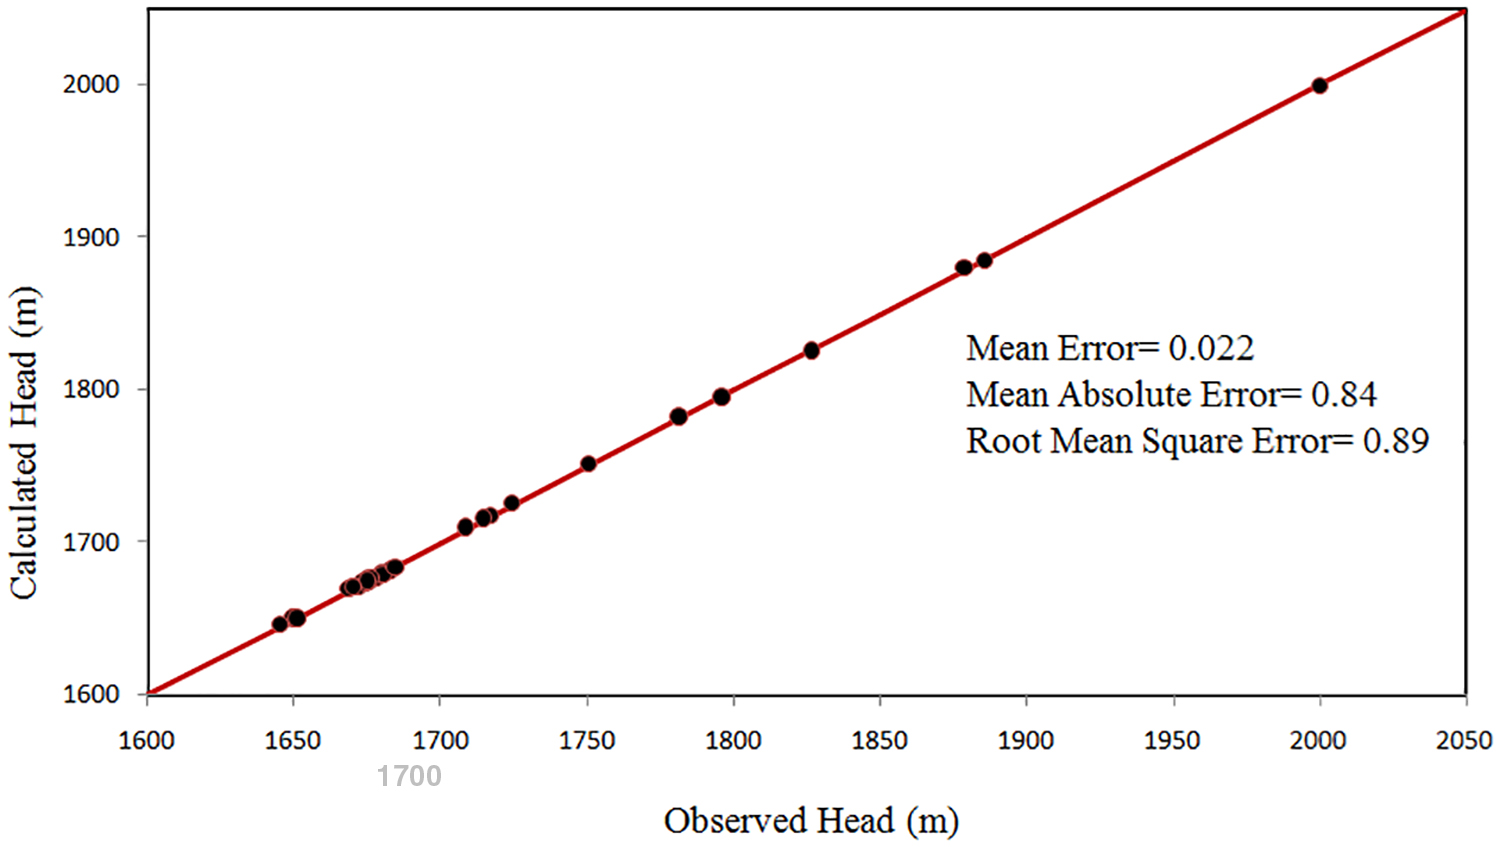
Groundwater model calibration diagram of Sirjan plain. Black points represent observed head versus calculated head for the steady state (September 2010). Red line is X = Y line.
Since the modeling objective of this study was predicting the water table, ensuring the validity of the prepared model allows simulating the future of the aquifer. In this research, the prediction period set in the model is from October 2017 to September 2022.
Results and Discussion
Analysis of arsenic samples
Table 1 presents the results of arsenic sampling. Also, Fig. 3 illustrates the average arsenic mapping prepared using inverse distance weighting method in ARCGIS10.1 for different sampling seasons. Also, arsenic concentration maps of groundwater resources of Sirjan plain during sampling seasons (winter 2015 to spring 2017) are shown in Supplementary Figs. S1–S5, respectively. As can be observed, the range of arsenic concentration in the groundwater samples varies from 1 to 200 μg L−1, with an average of 187 μg L−1. Moreover, during the sampling period, the amount of arsenic concentration had an increasing trend. The highest concentration of arsenic was in the northeast of the plain and parts of the central area, with a decreasing trend toward the north and south of the plain. The bar graph of the average arsenic concentration in the groundwater resources during sampling seasons is shown in Supplementary Fig. S6. As can be seen, 68.1% of the groundwater samples had an arsenic level above the standard limit of WHO. In other words, only seven locations had an arsenic level of less than 10 μg L−1.
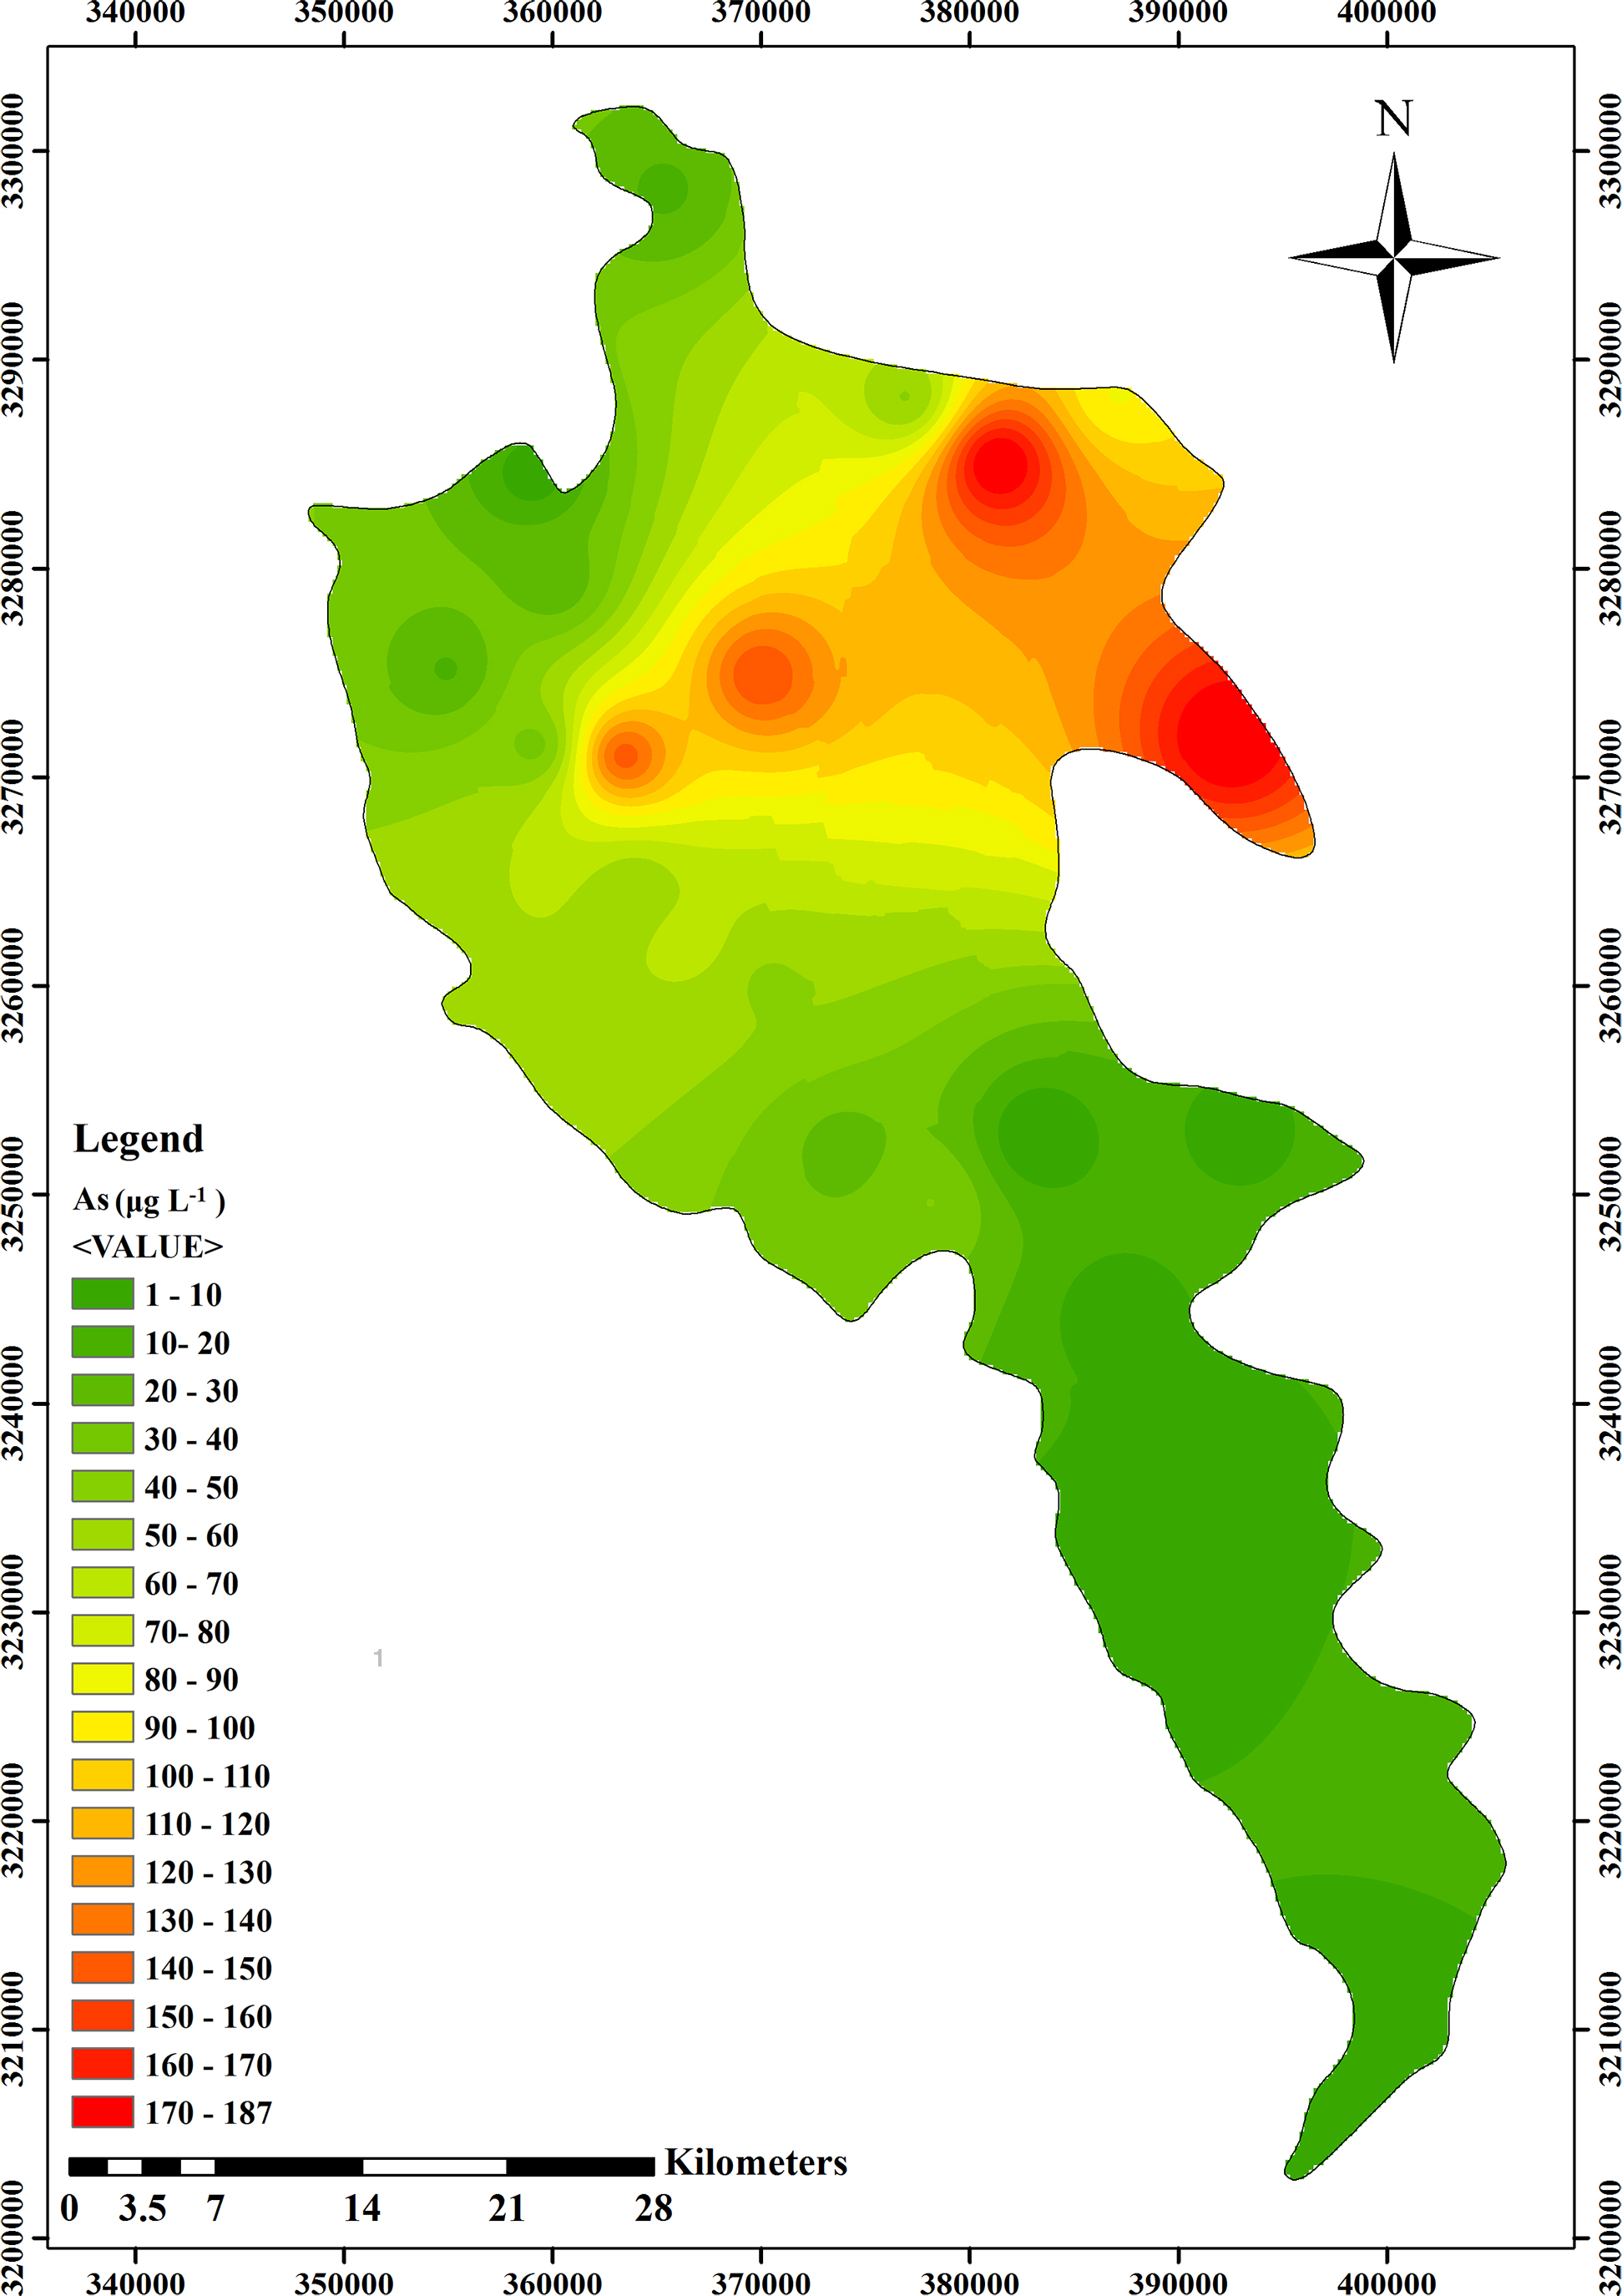
Average arsenic concentration of groundwater resources of Sirjan plain during sampling seasons (μg L−1) (winter 2015-spring 2017).
Results of Arsenic Sampling of Groundwater Resources
Analysis of clay layer
To evaluate the spatial connection between arsenic concentration and clay—considering that clay soils have more arsenic than sandy and other soils (O'Neill, 1995)—21 observation wells were selected across the plain surface and the layers of clay in them were examined. To this end, the observation well logs of the region were examined in terms of the overall thickness of the clay layer and unsaturated clay thickness (water level drop in the clay layer) during a 10-year statistical period (April 2005–2015). Figure 4 presents well log No. 5 and its groundwater level fluctuations. Also, groundwater level changes in observation wells No. 1, 2, 3, 8, 9, 15, and 20 located in the northeast, center, north, and south of the plain are shown in Supplementary Figs. S7–S13, respectively. (Report on Iran Energy Ministry, 2017). In these figures, W.T denotes a water table at the time of observation well drilling (June 1996). Likewise, W′.T and W′′.T show water table in April 2005 and 2015, respectively. As depicted, in Log 3, the layer is fully composed of clay and the unsaturated clay layer thickness in this area is higher compared with the other areas. In Logs 15 and 20 in the north and south of the plain, the layer is composed of sand. The information on the clay thickness and the unsaturated clay thickness of the logs is shown in Supplementary Table S1.
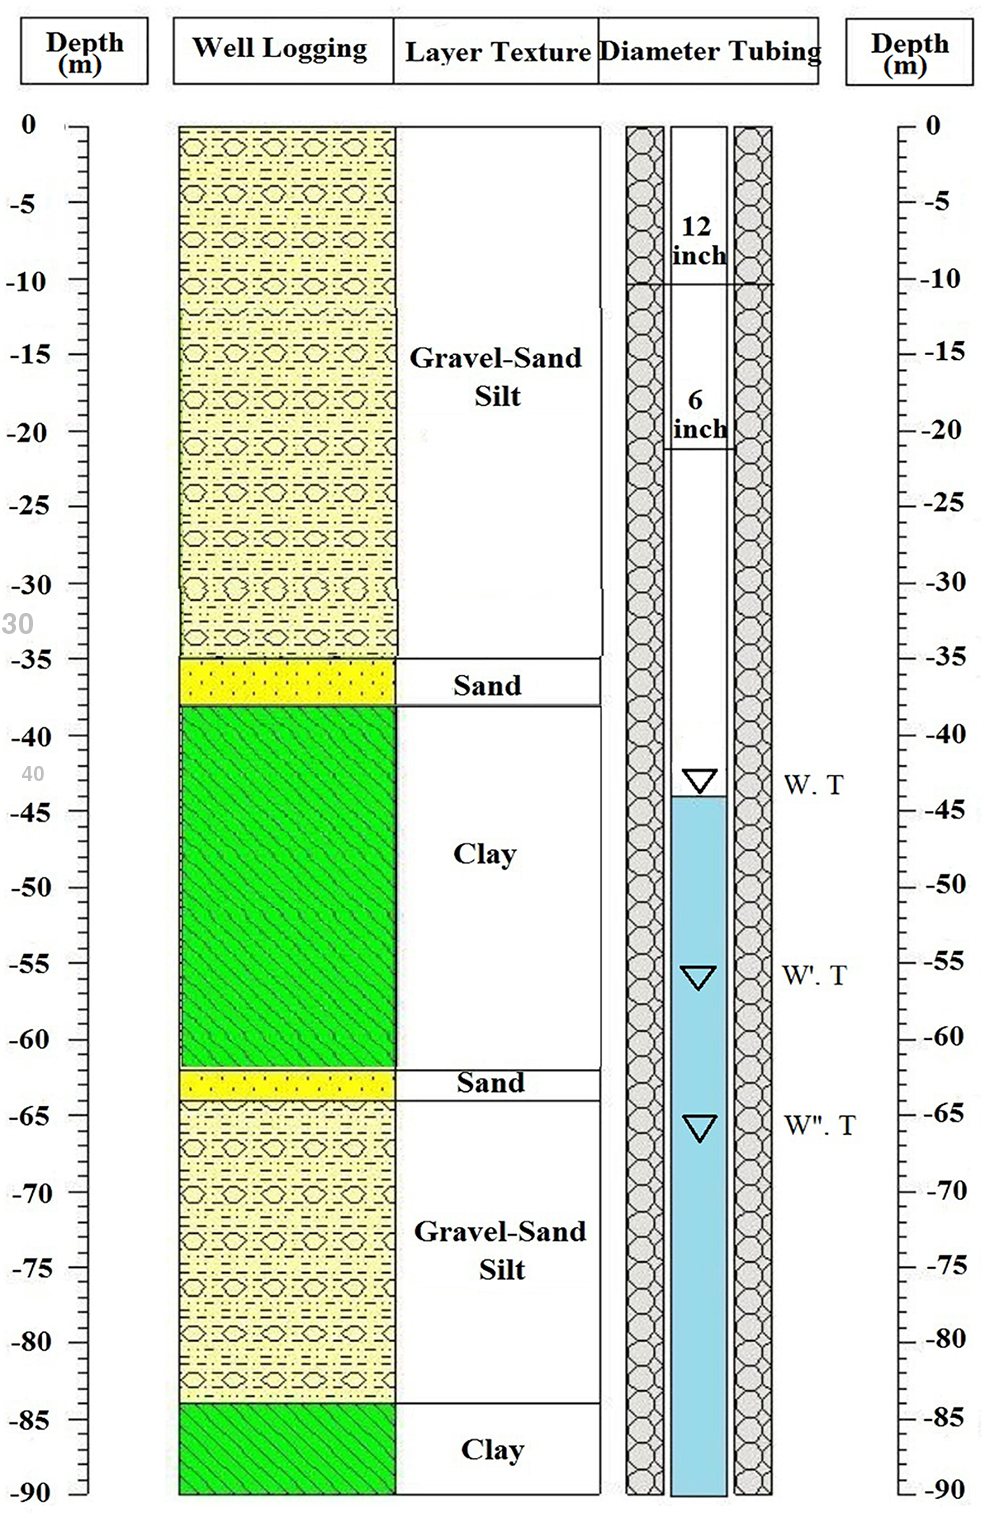
Groundwater level changes in observation well No. 5 (W.T, W′.T, and W′′.T dictate water table in June 1996, April 2005, and April 2015, respectively).
Influence of unsaturated clay thickness on arsenic concentration
The zoning map for the unsaturated clay thickness of observation wells (Fig. 5) was prepared according to the information in Supplementary Table S1. It was observed that unsaturated clay thickness in the region varied from 0 to 5.1 m. The highest thickness was in the northeast and central areas of the plain and the minimum thickness was in the southern and northern parts of the plain.
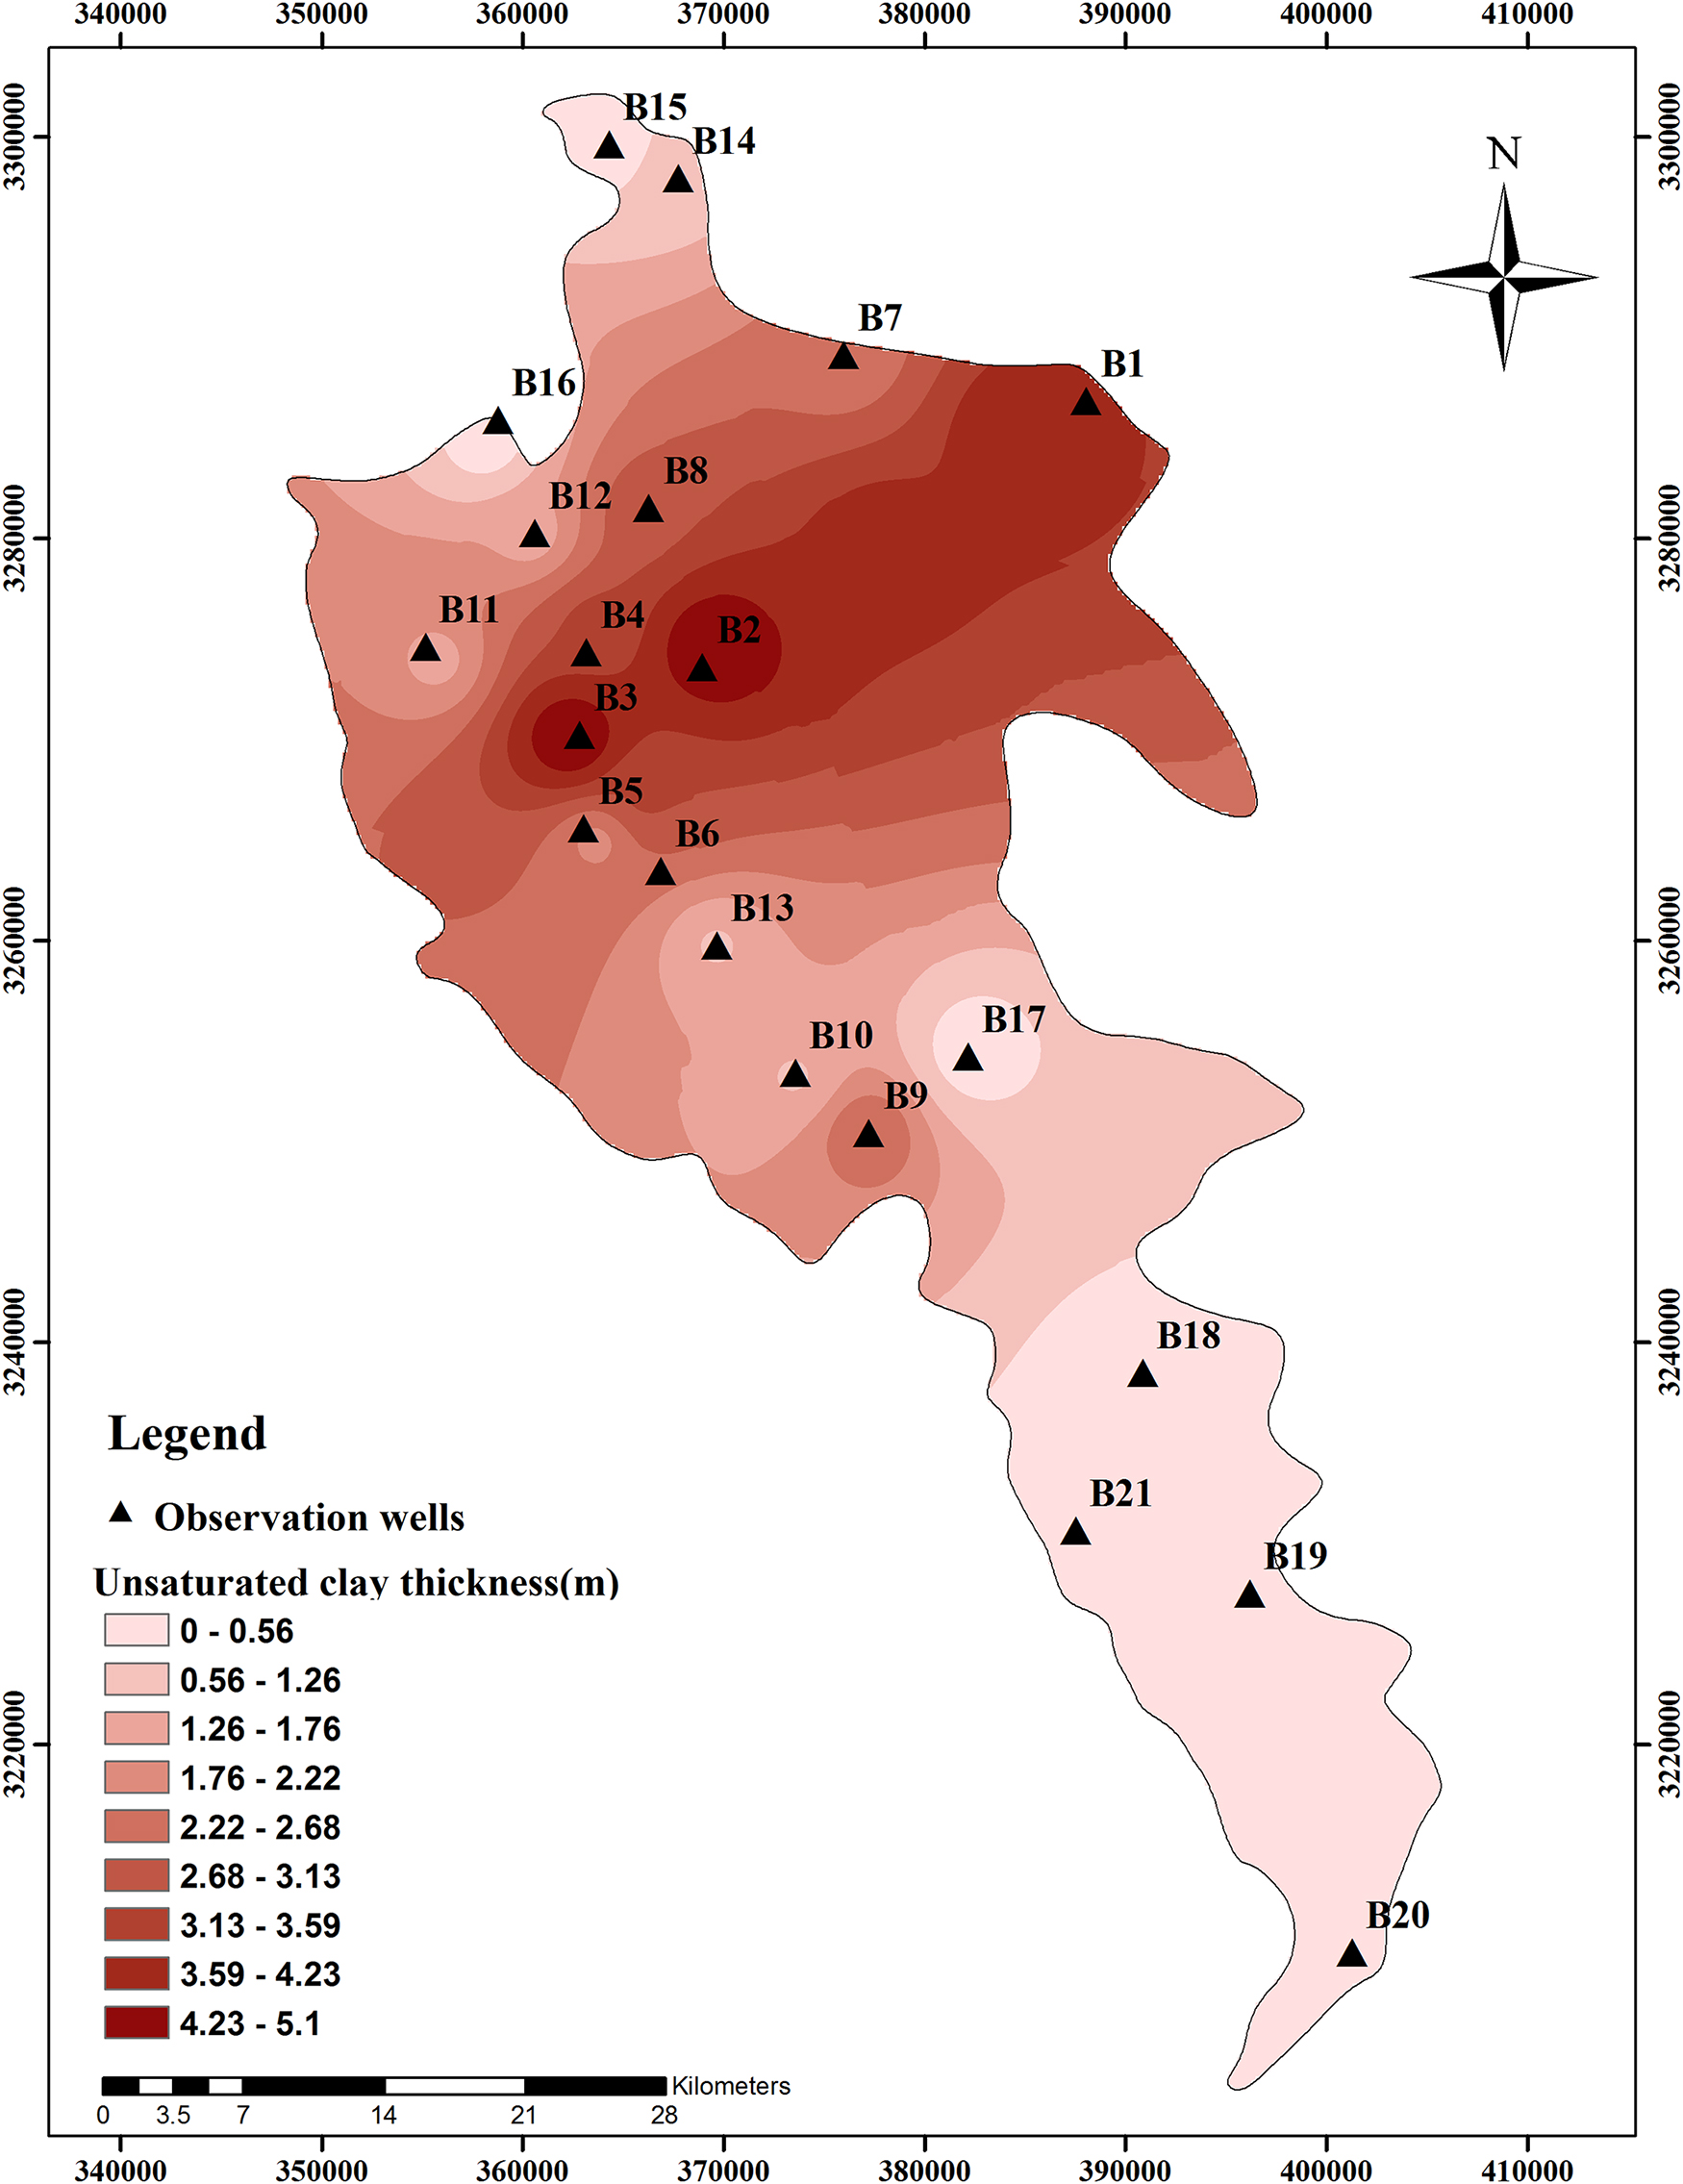
Zoning map of unsaturated clay thickness during a 10-year period (2005–2015).
By comparing the arsenic zoning of the groundwater resources in Sirjan Plain (Fig. 3) with the zoning map of the unsaturated clay thickness (Fig. 5), it was observed that the greater the thickness of unsaturated clay, the higher the arsenic concentration. In waters with reducing conditions close to that of neutral water, typically, desorption may not be expected because arsenic is present as As(III) and strongly sorbed to Fe-rich clays or iron oxides (Ravenscroft et al., 2009). Thus, arsenite is subjected to reductive conditions in the environment.
As the groundwater level declines, the oxidative conditions are created and minerals are oxidized, which lead to release of arsenic to the water. It was observed that there is no clay layer of the observation wells in the northern and southern parts of the plain, such as observation wells 15 and 20 (Supplementary Figs. S12 and S13). Hence, it can be expected that in these areas, despite the use of groundwater resources and water level drop, there would be no potential for increasing the arsenic concentration over time. Therefore, the wells in the southern and northern parts of the plain could be considered safe resources of drinking in terms of arsenic contamination.
Predicting arsenic concentration
Since groundwater level fluctuation is among the factors affecting the arsenic concentration in the plain, its concentration changes to September 2022 were predicted using quantitative modeling results.
In this research, the time period assigned to the model for prediction was the water year of 2017 to 2022. For example, the diagram of the water table dropping in the prediction period in observation well B2 in the center of the plain is shown in Supplementary Figure S14.
To relate arsenic concentrations to groundwater levels, information from observation well logs were used, because they had a higher probability for unsaturated clay thickness due to the water level drop and the existence of clay layer. Assuming other parameters affecting the arsenic concentration to be constant, observation wells B1, B2, and B3 were selected, and mathematical relationship was obtained between them in the water table level and arsenic concentration during the sampling period using the information in Table 2. In Supplementary Figs. S15–S17, relationship between water level and arsenic concentration in observation wells B1, B2, and B3 are shown. Table 3 presents the resulting correlation relationship along with an arsenic concentration in the mentioned observation wells. As can be seen, in observation wells B1, B2, and B3, for each meter of water table drop, the arsenic concentration was increased about 19.7, 17.7, and 54 μg L−1, respectively. Figure 6 presents the relationship between arsenic concentration and groundwater level in observation wells B1, B2, and B3 from winter 2015 to September 2022.

Relationship between arsenic concentration and water table level from winter 2015 to September 2022.
Water Table Level (M) and Arsenic Concentrations (μg L−1) in Observation Wells 1, 2, and 3 During the Sampling Period
Relationship Between Water Level and Arsenic Concentration in Groundwater Resources in Sirjan Plain and Prediction to September 2022
Where X refers to groundwater level (m) in the area of the observation wells and Y refers to arsenic concentration (μg L−1) in the same observation well area.
Conclusions
In this study, we assess arsenic contamination, evaluate the link between arsenic release and clay abundance, and predict the changes in its concentration in the groundwater resources of Sirjan Plain. To investigate the spatial and temporal distributions of arsenic in Sirjan Plain, the seasonal sampling (winter 2015 to spring 2017) was done from 22 groundwater resources with suitable distribution in the plain. The results showed that the range of changes in arsenic concentration in the groundwater samples varied from 1 to 200 μg L−1. Moreover, following the WHO standard, 68.1% of water existing in the plain was not appropriate for drinking. Comparing spatial zoning maps over the sampling period showed that the arsenic concentration had an increasing trend and the increase rate was greater in the northeastern part of the plain. The highest concentrations of arsenic were in the northeast of the plain and parts of the central area, while there was a descending trend toward the north and south of the plain. The results of studying clay layers in the observation wells showed that the high concentration of arsenic was related to the oxidation of minerals in the clay layer and the subsequent release of arsenic into groundwater. Therefore, due to the lack of clay layers in the observation wells in the northern and southern parts of the plain, including observation wells 15 and 20, it could be expected that in these areas, despite the use of groundwater resources and water level drop, there would be minimal potential for increasing arsenic concentration over time. Hence, the groundwater resources in the southern and northern parts of the plain can be considered safe resources for drinking purposes in terms of arsenic contamination.
To predict the changes in arsenic concentrations to September 2022, information on observation well logs was used, because they are more likely to have an unsaturated clay thickness due to the water level drop and the existence of clay layer. Assuming other parameters affecting the arsenic concentration to be constant, observation wells B1, B2, and B3 were selected in the northeast, center, and outlet of the plain, respectively, and an equation was extracted between the water table level and arsenic concentration during the sampling period. According to the modeling results and based on the resulting equations, it was found that to September 2022, in the observation well B1 in the northeast part of the plain, the water level might decline to 1213.82 m and arsenic concentration could increase up to 119 μg L−1. In observation well B2 in the center of the plain, the water level might decline to 1671.82 m and arsenic concentration may increase up to 233 μg L−1 toward the end of the prediction period. In observation well B3, the water level might drop to1643.51 m and thus arsenic concentration will increase to 273 μg L−1. Therefore, as the present groundwater discharge of aquifer continued, the quantity and quality of groundwater would decrease. Hence, by water consumption management and reduced use of groundwater resources in the Sirjan Plain, the arsenic concentration would increase at a lower rate.
Footnotes
References
Supplementary Material
Please find the following supplemental material available below.
For Open Access articles published under a Creative Commons License, all supplemental material carries the same license as the article it is associated with.
For non-Open Access articles published, all supplemental material carries a non-exclusive license, and permission requests for re-use of supplemental material or any part of supplemental material shall be sent directly to the copyright owner as specified in the copyright notice associated with the article.