
Abstract
Cyanotoxins, such as microcystin-LR (MC-LR), produced by harmful algae blooms are becoming a chronic issue drinking water utilities must manage. The removal of MC-LR by powdered activated carbon has been studied, but comparatively little information exists for granular activated carbon (GAC) treatment. Since many utilities already use GAC to treat other seasonal contaminants or to mitigate disinfection by-product formation, there is need to evaluate its performance. In this study, we present equilibrium isotherms and rapid small-scale column test (RSSCT) breakthrough curves for MC-LR adsorption onto GAC. Isotherms were completed for six different GAC from four carbon sources (hardwood, lignite, bituminous coal, and coconut) in the absence and presence of natural organic matter (NOM). The proportional diffusivity RSSCTs compared MC-LR and NOM breakthrough for three GAC sources (bituminous coal, lignite, and hardwood) at pH 7.8 and 9.5. The results indicate variations in GAC properties with material type, namely mesopore volume, affect adsorption capacity and time to breakthrough. MC-LR breakthrough followed the isotherm capacity trends and demonstrated breakthrough of MC-LR with the bituminous coal GAC an order of magnitude faster than for the lignite and hardwood GAC, reflecting their mesoporous surface areas. The influence of pH conducted on the bituminous GAC demonstrated little change in time to breakthrough; however, the slope of the breakthrough at pH 9.5 was more gradual than at pH 7.8, reflecting pH-dependence MC-LR competition with NOM. These findings indicate utilities should utilize mesoporous carbon in their current GAC process if they anticipate needing to remove cyanotoxins like MC-LR.
Introduction
Our surface water drinking water sources are increasingly hosting “harmful algal blooms” or “HABs” of cyanotoxin-producing cyanobacteria, which presents a challenge to public water systems. The most common toxin class, microcystins (MCs), are liver toxins that can also cause a range of symptoms from abdominal pain and headaches to internal bleeding and organ failure (Svrcek and Smith, 2004).
Following two instances of “do not drink” advisories in Carrol Township, Ohio in 2013. and Toledo, Ohio in 2014, the Ohio Environmental Protection Agency (EPA) promulgated OAC 3745-90-01 in June 2016 (He et al., 2016). This regulation requires public water systems in Ohio to develop and submit treatment optimization protocols when MCs are detected in raw water above 1.6 μg/L (the United States EPA 10-day Drinking Water Health Advisory level). Similar regulations are also being developed for other states in the United States [e.g., New Jersey, Rhode Island and Utah (Yeager and Carpenter, 2019)]. Water utilities and regulatory agencies are, therefore, seeking effective and implementable treatment approaches to optimize cyanotoxin removal and destruction.
MCs are a class of stable, nonvolatile, water-soluble cyclic heptapeptides with five fixed and two variable amino acids (Fig. 1). MC-LR includes leucine and arginine as its variable amino acids and is considered both the most toxic and frequently studied congener (USEPA, 2016). It is a large molecule with a molecular weight of 995.2 g/mol and molecular dimensions ranging from 1.1 to 2.94 nm (Donati et al., 1994; Pendleton et al., 2001; Sathishkumar et al., 2010). This complex molecule contains hydrophilic groups (carboxyl and amine) and a hydrophobic 3-amino-9-methoxy-2,6,8-trimethyl-10-phenyldeca-4,6-dienoic acid (ADDA) group lending it an amphipathic character (Rinehart et al., 1988). The two carboxyl groups and one ionizable amino group have reported pKa-values of 2.09, 2.19, and 12.48, respectively, resulting in a zwitterion with a net negative charge of −1 at pH ranges of interest (de Maagd et al., 1999).
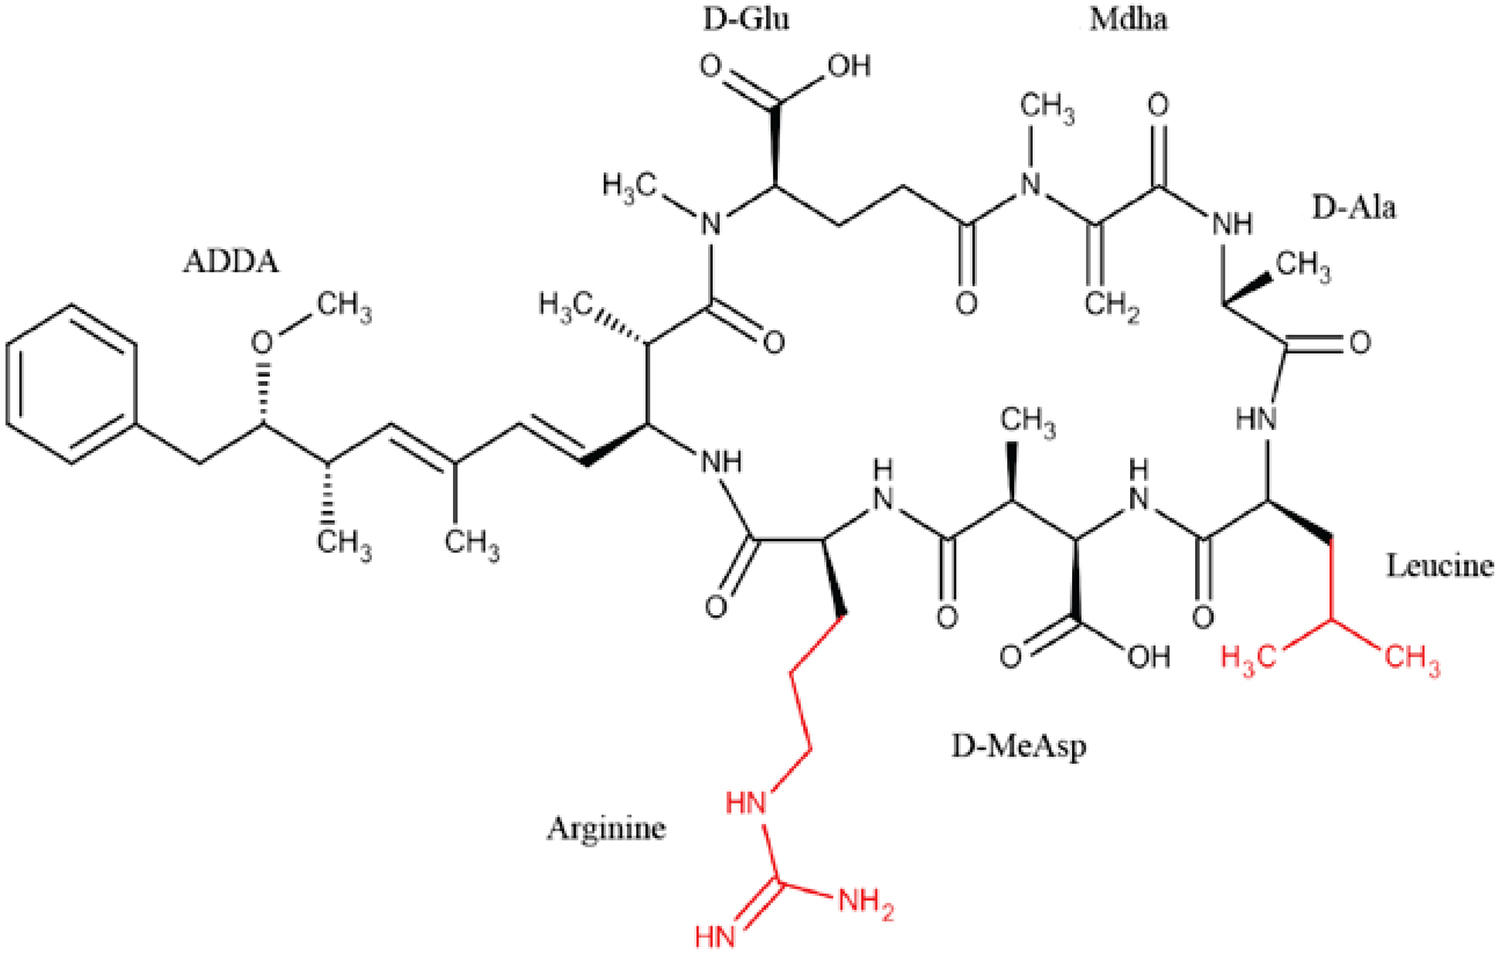
Structure of the MC-LR molecule, which comprises the following seven amino acids,
Conventional treatment (coagulation, flocculation, sedimentation, and filtration) can remove the cyanobacteria that hold and produce the toxins, but does not address dissolved extracellular toxin (He et al., 2016). Although many advanced processes are being explored (He et al., 2016), utilities without the ability to make large capital investments are focusing on optimizing existing oxidation or adsorption processes.
Adsorption onto activated carbon (i.e., powdered activated carbon [PAC] or granular activated carbon [GAC]) is a proven technology often already employed in treatment plants to reduce dissolved organics or to prevent formation of disinfection by-products (Wang et al., 2007). In some instances, utilities installed postfiltration GAC contactors to address seasonal contaminants such as atrazine. As utilities are anticipating regulations on emerging contaminants and seasonally detecting cyanotoxins in their source water, those with existing GAC contactors and those considering them are seeking quantification of the extent and duration of removal they can expect.
Water characteristics, including natural organic matter (NOM) concentration and type, pH, and ionic strength (IS), influence the adsorption of target compounds onto activated carbon (Summers and Roberts, 1988a, 1988b). NOM competes with trace organics for adsorption sites and larger NOM molecules can cause pore blockage (Campinas et al., 2013; Kennedy and Summers, 2015). Activated carbon surfaces are amphoteric and exhibit a net negative charge at pH values above the pHpzc (Newcombe et al., 1993; de Maagd et al., 1999; Marsh and Rodriguez-Reinosa, 2006), resulting in a net repulsive electrostatic interaction with the negatively charged MC-LR across a range of pH values. This, and other mechanisms (e.g., hydrophobic interactions), result in the observed increase of MC-LR adsorption with decreasing pH in purified water (Pendleton et al., 2001; Huang et al., 2007). In the presence of NOM, however, the opposite is observed (Bajracharya et al., 2019), presumably reflecting an increase in competitive interactions between the MC-LR and NOM molecules as the pH decreases. In this system of similar negative net charges, an increased solution ionic strength can cause shielding of electrostatic repulsion and thereby increase adsorption (Campinas and Rosa, 2006). Furthermore, an increase in ionic strength can shield the repulsion between fixed charges on NOM molecules, allowing a more coiled configuration, particularly for NOM isolated from soils or similar systems (Ghosh and Schnitzer, 1980). As the size of NOM molecules decreases, they can access smaller pore volumes of the activated carbon, which, in turn, increases NOM adsorption (Summers and Roberts, 1988b). This dependence in NOM adsorption to GAC with molecule size can influence competition with trace organics (Li et al., 2003b). Thus, pH, NOM, and ionic strength have interrelated impacts on the adsorption of MC-LR to activated carbon, which makes modeling and prediction of the adsorption process in temporally variable water compositions difficult.
The capacity of activated carbon to adsorb MC-LR reflects the activated carbon pore size and distribution as the size of the MC-LR molecule (∼1–3 nm) excludes it from fully accessing micropores (<2 nm) (Donati et al., 1994; Pendleton et al., 2001). It is possible, however, that hydrophobic portions of the MC-LR molecule (e.g., the ADDA group) could access the entrance to micropores. This size exclusion results in a molecular sieving effect such that carbons with more mesopores (2–50 nm) have a higher adsorptive capacity for MC-LR (Donati et al., 1994; Pendleton et al., 2001). The pore size distribution is influenced by the carbon source material with the typical order of mesoporosity being wood > lignite > bituminous coal > coconut (Marsh and Rodriguez-Reinosa, 2006). Consequently, MC-LR removal with activated carbon also frequently follows this same trend (e.g., Donati et al., 1994; Pendleton et al., 2001; Bajracharya et al., 2019).
Studies evaluating MC-LR adsorption to activated carbon were primarily generated using PAC in equilibrium adsorption batch and kinetic tests. Corresponding data on the use of GAC to remove MC-LR in fixed-bed flow-through reactors are sparse. In one study, Lambert et al. (1996) studied a full-scale treatment plant using a coconut-based GAC and found that, while conventional treatment could only reduce MCs to approximately half of intake concentrations, GAC could reduce raw water MCs by more than 80% until raw water concentrations were below 0.5 μg/L. Wang et al. (2007) used laboratory-scale columns to characterize MC removal due to adsorption versus biodegradation and found that, while both removal mechanisms were effective, sterilized adsorption-only columns with a coal-based GAC had greater removal with 70% removal of MC-LR and 40% removal of MC-LA after six months of operation. Chennette (2017) studied the impact of storage conditions for seasonal GAC contactors on the adsorptive capacity and kinetics of GAC and found a bituminous coal GAC preloaded with NOM benefitted MC-LR removal. Kelley et al. (2017) is the only study using rapid small-scale column tests (RSSCTs) and they determined from proportional diffusivity RSSCTs (PD-RSSCTs) with a bituminous coal GAC product that treatment significantly worsened with increasing NOM preloading. None of these studies compared removal with more than one GAC material and thus it is not known whether trends noted with PAC, such as an increase in MC-LR removal with increasing carbon mesoporosity, also occur with GAC. The role of solution composition on GAC removal of MC-LR is also poorly understood.
In this study, we assessed the impact of GAC source material, hence GAC properties, on the adsorption affinity, capacity, and breakthrough time for MC-LR in different matrix conditions. We begin by presenting equilibrium adsorption isotherms to assess the relative adsorption capacities of six commercially available GAC products from four different source materials (bituminous coal, lignite, hardwood, and coconut shell) in model water with and without competition from NOM. A selection of these GAC products was further characterized and used in a series of RSSCTs treating model water with organic matter to evaluate the influence of GAC properties and pH on time to breakthrough. From our adsorption isotherms, we confirm that, like PAC, source material influences the capacity of GAC to adsorb MC-LR, with material anticipated to have the greatest mesoporosity exhibiting greater adsorption capacities and longer times to breakthrough. Competition with NOM reduces MC-LR uptake. These results were translated to the RSSCTs, which demonstrated time to breakthrough correlated with the measured adsorption capacity. Interestingly, this breakthrough time did not vary with pH, but the slope did. Overall, these results provide insight into the use of GAC for treating MC-LR in drinking water and demonstrate that equilibrium adsorption capacities correlate well with time to breakthrough and the nature of the GAC properties.
Methods
Materials and reagents
MC-LR and nodularin
Dry MC-LR and nodularin were purchased from Beagle Bioproducts (Columbus, OH) and Cayman Chemical (Ann Arbor, MI) as dry films coating an amber glass vial and stored at −20°C. The dry toxin was dissolved by rinsing the vial with 1 mL of high-performance liquid chromatography-grade methanol (J.T. Baker) and then triple rinsing with water from a Millipore Milli-Q deionized (DI) water system to prepare stock solutions of 2,000 mg/L of MC-LR and 500 mg/L of nodularin. Stock solutions were stored at 4°C for <60 days and used as needed. The MC-LR stock was used for equilibrium batch test samples and RSSCT model water. The fraction of methanol in these systems from the MC-LR stock was <0.01 volume percent. The nodularin was used as an internal standard for the liquid chromatography-tandem mass spectrometry (LC-MS/MS) analyses. Stocks and samples containing MC-LR or nodularin were handled with glassware since plastics are known to adsorb the toxins (Hyenstrand et al., 2001). A certified analytical standard of 10.16 mg/L MC-LR in methanol stock was purchased from Sigma Aldrich for the development of calibration standards.
GAC adsorbent
Six commercially available GAC products were provided by Calgon Carbon (Moon Township, PA), Jacobi Carbons (Columbus, OH), Ingevity (North Charleston, SC), and Cabot Corporation (Alpharetta, GA). Each of these products is derived from one of four different source materials: bituminous coal, lignite coal, hardwood, and coconut. Properties of these materials from manufacturer-provided data are available in Table 1.
Manufacturer-Provided Properties of Selected Granular Activated Carbon Products
Size classified by manufacturer according to United States Standard sieve sizes.
Provided by manufacturer based on ASTM B604-05.
Manufactured by cCalgon Carbon, dIngevity, eCabot Corporation, fJacobi Carbons.
“—”: Information not provided by manufacturer.
BET, Brunauer–Emmett–Teller.
For the generation of equilibrium adsorption isotherms, each GAC product was ground using a glass mortar and pestle and sieved to collect the fraction passing the 200 mesh sieve (74 μm) and retained on the 400 mesh sieve (37 μm). Retained fines were removed by washing the sieves with DI water until the conductivity of the effluent and influent water matched. The prepared GAC was oven dried overnight at 120°C and stored in a desiccator until use.
For RSSCT experiments, the assessment was narrowed to one GAC product from each of the three most successful source materials. Nuchar WV-B 30 was selected as the only wood-based GAC. Filtrasorb-300 was selected as the bituminous coal-based GAC as it is frequently used in municipal water treatment plants in Ohio. Aquasorb-5000 was selected as the lignite coal-based GAC as it is available in a range of particle size classifications, thereby facilitating RSSCT scaling. A more narrow range in GAC particle size was required for the RSSCTs than the batch experiments, and thus, the GAC samples were ground and dry sieved to obtain the fraction passing the 230 mesh sieve (63 μm) and retained on the 325 mesh sieve (44 μm). The retained GAC was transferred to a glass vial, which was filled with 40 mL of DI water, sonicated for 30 s, left to settle overnight, and then decanted to remove fines. After three sonications, the decanting step was repeated until the decanted water had an ultraviolet (UV) absorbance <0.1 at a wavelength of 450 nm measured using a Shimadzu UV-vis. This method of preparation is referred to herein as the dry sieve/sonicate/decant (DSSD) method. The prepared GAC was oven dried overnight at 120°C and stored in a desiccator until use.
Model water composition
Laboratory experiments used a synthesized model water matrix designed to mimic the characteristics of surface water in Ohio as described by Bajracharya et al. (2019), which consists of inorganic salts and, except in the organic-free solution isotherm test, a fulvic acid standard. The typical model water has a pH of ∼8 and an ionic strength of 0.012 M. The model water was prepared by dissolving the inorganic salts (NaHCO3, CaCl2 · 2H2O, CaSO4 · 2H2O, MgSO4 · 7H2O, KCl, NH4NO3, FeCl3 · 6H2O, and Na2HPO4) in DI water and stirring overnight before adding organic matter. The organic matter was added from a 200 mg/L stock solution of Suwannee river fulvic acid (SRFA) that was prepared bimonthly. Dry SRFA obtained from the International Humic Substances Society (IHSS, Suwanee River Fulvic Acid Standard II) was dissolved in DI water to form the SRFA stock solution that was stored at 4°C for later use. When added to the model water at a concentration of 5 mg/L SRFA, the model water has a dissolved organic carbon concentration of ∼2.5 mg/L (Liu, 2018; Bajracharya et al., 2019).
While efforts were made to keep the model water matrix consistent, some experimental objectives required alterations to the model water design. In the equilibrium adsorption experiments, which were conducted both with and without SRFA, sodium azide was added as a microbial growth inhibitor. For the high pH RSSCT experiment, the model water was supplemented with increased sodium bicarbonate and sodium hydroxide. The amount of calcium and magnesium sulfates was reduced to minimize the increase in ionic strength associated with the bicarbonate addition. Refer to Supplementary Table S1 in the Supplementary Data for details of the model water composition.
Adsorbent characterization
The three GAC products used in the RSSCT experiments were analyzed for Brunauer–Emmett–Teller (BET) surface area, equivalent micropore surface area, and pore volume distribution by N2 isotherm data. Nitrogen gas adsorption was conducted on an ASAP 2020 (Micromeritics, Norcross, GA) with the assistance of the Subsurface Energy Materials Characterization and Analysis Laboratory at Ohio State University. Samples consisted of ∼100 mg of unground GAC product, oven dried for 24 h at 300°C (105°C for wood-based GAC). Samples were degassed for 24 h at 200°C before nitrogen gas dosing at −196°C. According to Partlan et al. (2016), grinding does not produce consistent changes in the surface area or distribution of pore sizes in activated carbon and thus we anticipate measurements on the unground material should represent the properties of the ground material. The low-pressure dose of the nitrogen adsorbate was 0.446 mmol/g with an equilibration interval of 30 s for each point generated on the adsorption isotherm. BET surface areas were determined from the 10 points in the 0.01–0.06 relative pressure (p/p0) range. The nonlocal density functional theory (NLDFT) with an infinite slit model was applied to the data collected over the full range in relative pressures to determine the pore size distribution and the equivalent micropore surface area. The pHpzc of select GACs was estimated by salt titration following Kosmulski (2001), as interpreted by Bajracharya et al. (2019) and described in the Supplementary Data with results presented in Supplementary Fig. S1.
Equilibrium adsorption batch test method
Equilibrium adsorption isotherms for MC-LR adsorption onto the six GAC adsorbents were generated in batches using a bottle point method in a model water matrix both with and without competing SRFA. The 200 × 400 mesh-prepared GAC was hydrated under a vacuum to form a 500 mg/L slurry that was kept stirring to maintain the suspension. Model water was prepared and spiked with MC-LR stock to an initial concentration of 50 μg/L and then spiked with GAC slurry to doses between 0 and 11 mg/L to generate a final volume of 100 mL. Duplicate samples were prepared at select concentrations of GAC (0, 1, and 5 mg/L); however, the data are presented as individual measurements. The bottles were capped and mixed at 150 rpm on an orbital shaker (Innova 2300; New Brunswick Scientific). After 72 h, a glass syringe was used to collect a sample and filter it through a 0.45 μm polyvinylidene difluoride syringe filter (Millex-GV; Millipore) into a vial for analysis through LC-MS/MS. The method closely follows that described by Bajracharya et al. (2019), who report <10% loss of MC-LR to factors other than adsorption to activated carbon. The resulting data were fit to the Langmuir and Freundlich isotherm models as described in the Supplementary Data.
RSSCT method
RSSCT experiments were conducted following ASTM D6586-03 to evaluate the impact of GAC type and pH on time to breakthrough. These followed a series of preliminary tests conducted to establish consistent operational conditions (Supplementary Data and Supplementary Table S2). The proportional diffusivity assumption was used to develop the scaling factor because the relatively large size of the MC-LR target compound and competitive background NOM are subject to size exclusion, and thereby have a linear proportionality between their respective diffusion coefficients and the GAC particle size (Summers et al., 1995). The PD-RSSCT scaling expression [Eq. (1)] assumes that internal diffusion decreases linearly with particle size and has been shown to accurately predict full-scale removal of NOM (Summers et al., 2013).
The scaling factor for the column was determined from the average particle radius of both full-scale GAC and the small-column GAC. The full-scale average particle diameter of 8 × 30 mesh samples was 1.45 ± 0.10 mm and the small-scale average particle diameter of 230 × 325 mesh samples was 53.3 ± 0.3 μm, resulting in a scaling factor of 0.0368. The small-column GAC was isolated between 230 and 325 mesh sieves by a modified version of ASTM D2862-16 that utilized hand shaking the sieve stack as opposed to mechanical shaking. This scaling factor was used to design a GAC bed volume (BV) and flow rate that scales to a full-scale empty bed contact time (EBCTFS) of 15 min.
Tests were conducted using a 0.38 cm inner diameter glass column (provided by Dr. Soryong Chae, University of Cincinnati) with external stainless steel end fittings (Fisher Scientific) and tygon tubing (Tygon® chemical; Masterflex). Before packing the column, ∼200 mg of the DSSD prepared 230 × 325 mesh GAC was hydrated in deionized water under a vacuum for ∼30 min. The column bed packing consisted first of a layer of glass wool, topped by glass beads onto which the GAC slurry was added until the target bed depth was reached. The GAC bed was then capped by a similar layer of glass beads and then glass wool. Influent model water was prepared in batches of 2–4 L in autoclaved glass reservoirs, which were kept at room temperature while running (22 ± 2°C) and switched out every 4 days. A 10 μm, stainless steel, low-pressure, slip-on inlet filter (Restek) was installed at the tubing intake. A peristaltic pump (Masterflex L/S Digital Pump with Easy-Load® II pump head; Cole-Parmer) was used to deliver the influent water to the column at a consistent flow rate. This flow rate was monitored on a daily basis and adjusted as needed. A fraction collector (Retriever 500®; Teledyne ISCO) separated effluent into ∼27 mL fractions.
Except in early method development where the flow rate and bed depth were being developed, columns were packed to a target bed depth of 1.5 cm run at a target flow rate of 0.31 mL/min needed to get the 15 min EBCTFS. Under these conditions, influent samples were collected from the influent reservoir approximately once every 24 h using a glass pipette and effluent samples were collected every 5.2 h from the fraction collector. Specific run conditions are summarized in Table 2. Once collected, samples were split into ∼5 mL for UV254 analysis, which was stored in a scintillation vial at 4°C for up to 5 days, and ∼1 mL for ultra-performance liquid chromatography (UPLC) and enzyme-linked immunosorbent assay (ELISA) analysis, which was frozen at −30°C until run on the UPLC and then refrozen until analyzed by ELISA.
Summary of the Rapid Small-Scale Column Test Run Conditions
All tests utilized a 0.38 in inner diameter glass column packed with the noted carbon prepared using a DSSD preparation method. The MC-LR was dissolved in the model water as described in Supplementary Table S1 at the noted pH.
MC-LR, microcystin-LR; GAC, granular activated carbon; DSSD, dry sieve/sonicate/decant.
It is important to note that this investigation used high influent MC-LR concentrations to generate detectable and conservative results. In addition, each RSSCT breakthrough curve was unique to the specific raw water conditions and influent concentration tested; therefore, results cannot be extrapolated to a lower influent concentration (Crittenden et al., 1986, 2012).
Analytical methods
In the equilibrium adsorption batch tests, the MC-LR concentrations were measured using a UPLC (Agilent, 1290) connected to a hybrid Triple Quadrupole/Ion trap mass spectrometer (AB Sciex; QTRAP5500) (LC-MS/MS). A C18 column (Waters; Acquity UPLC BEH 130 Å, 1.7 μm, 2.1 mm × 50 mm) was used at a flow rate of 0.45 mL/min. The gradient mobile phase consisted of (a) DI water and (b) acetonitrile, each spiked with 0.1% formic acid, which shifted from 68:32 to 20:80 a:b over the 5-min sample run. Sample injection volume was 5 μL and the limit of detection for MC-LR was 0.012 μg/L. Nodularin was used as an internal standard.
The LC-MS/MS was not available for use when we conducted the RSSCT experiments, and thus, effluent samples from the RSSCT columns were analyzed by UPLC with a photodiode array detector (Waters; Acquity H-class). UPLC analysis utilized the same C18 column used for LC-MS/MS. A gradient mobile phase of (a) Milli-Q water and (b) acetonitrile, each spiked with 0.05% trifluoroacetic acid, shifted from 75:25 to 30:70 a:b over 5.5 min of the 6-min run time. Injections were run in triplicate at 10 μL each and a detection limit of 2.8–3.8 μg/L was typical. Selected samples with MC-LR concentrations below the UPLC detection limit were reanalyzed using an ELISA kit [Abraxis; Microcystins(ADDA)-DM]. Analysis was conducted according to the instructions in the kit with a detection limit of 0.15 μg/L. Plates were read on a Synergy HTX multimode microplate reader.
UV-visible spectroscopy (Shimadzu UV-vis) was used to measure the UV absorbance at a wavelength of 254 nm (UV254) as a surrogate for organic matter breakthrough. Samples were stored at 4°C and measured within 5 days unfiltered using a quartz cuvette.
Results and Discussion
Adsorbent characterization
The pHpzc for the wood, lignite coal, and bituminous coal was 4.4, 6.5, and 6.7, respectively, implying that all the GACs have a net negative surface charge at the studied pH values of 7.8 and 9.5 (Supplementary Fig. S1). These findings agree with reported values in the literature for pHpzc of wood-based activated carbons that range from 3.4 to 4.6 (Donati et al., 1994; Newcombe and Drikas, 1997; Pendleton et al., 2001; Huang et al., 2007), and for coal-based activated carbons with pHpzc values that range from 5.8 to 7.8 (Newcombe et al., 1993; Newcombe and Drikas, 1997; Huang et al., 2007). Within the investigated range of pH, the MC-LR molecule is known to have a negative net molecule charge (de Maagd et al., 1999). Therefore, as MC-LR is a zwitterion, electrostatic attraction would only involve the positively charged amino group
The N2 adsorption isotherms for the GAC products (Supplementary Fig. S2A) indicate decreasing N2 adsorption capacity and BET surface area by material type in the order of wood (1,808 m2/g), lignite coal (1,414 m2/g), and bituminous coal (951 m2/g). This trend agrees with the literature reporting that wood-based activated carbons have high BET surface areas (Donati et al., 1994). The value obtained for bituminous coal-based activated carbon was consistent with values reported in the literature (863–1,329 m2/g) (Donati et al., 1994; Newcombe and Drikas, 1997) and the manufacturer-reported value (Table 1). However, the value obtained for the wood was high compared to those reported by the manufacturer (Table 1) and in the literature (1,197–1,366 m2/g) (Donati et al., 1994; Newcombe and Drikas, 1997). The lignite-based activated carbon also had a higher value obtained for BET surface area than the value reported by the manufacturer (Table 1). The NLDFT equivalent surface areas in combination with the BET surface areas indicate the order of mesoporosity increases as previously reported (Marsh and Rodriguez-Reinosa, 2006), in the order of wood, lignite coal, and bituminous coal (Supplementary Fig. S3), with the wood-based PAC demonstrating significantly greater proportion of total pore volume associated with pores between 2 and 10 nm (Supplementary Fig. S2B). This trend in pore distribution was confirmed by an older processing method that distributes pore volume into micropores and mesopores by the amount of N2 adsorbed at p/p0 < 0.4 and p/p0 > 0.4 (Donati et al., 1994; Newcombe and Drikas, 1997). See Table 3 for a summary of the carbon characterization data.
Summary of Adsorbent Characterization Data for Selected Granular Activated Carbon Products
Estimated by salt titration method, see Supplementary Data for details.
Determined by N2 gas adsorption at 77K using a Micromeritics ASAP 2020.
Subdivided amount of N2 adsorbed assigning p/p0 < 0.4 to micropores and p/p0 > 0.4 to mesopores and convert to liquid volume assuming molar volume of 35 cm3/mol (Newcombe and Drikas, 1993; Donati, 1994).
Manufactured by dCalgon Carbon, eIngevity, and fJacobi Carbon.
Equilibrium adsorption
Fits to the Langmuir isotherm provided similar fits as the Freundlich isotherm (Supplementary Tables S3 and S4), but since the Langmuir model better captured the plateau in adsorption for some data sets (Supplementary Figs. S4 and S5), only its fits to the data will be discussed. These results show that the adsorption capacity and affinity were highest for the wood-based carbon, followed by the lignite coal-based, bituminous coal-based, and coconut-based carbons (Fig. 2 and Supplementary Table S3). The wood-based GAC had the highest maximum adsorption capacity, Qm, value for MC-LR in model water at 26 μg/mg, and saw a 53% reduction in Qm in systems with 5 mg/L SRFA (Fig. 3 and Supplementary Table S3). Comparisons of Qm across studies are difficult due to differences in matrix composition (pH, ionic strength, and competing NOM type) and initial MC-LR concentration. For example, Donati et al. (1994) using 2.8 mg/L MC-LR0 reports Qm values of 220–280 μg/mg for a wood-based PAC, whereas Campinas and Rosa (2006) using 0.117–0.215 mg/L MC-LR0 found Qm values of 13–17 μg/mg for a wood-based PAC. The observed pattern of findings, however, agrees well with others who have consistently found that wood-based carbons have the highest Qm due to their high mesoporosity (Donati et al., 1994; Pendleton et al., 2001; Campinas and Rosa, 2006). The observed percent reduction in Qm for wood-based activated carbon from the addition of NOM was higher than that reported by others (e.g., Donati et al., 1994). This may reflect the larger particle size of the GAC (37–74 μm) relative to PAC (0.45–44 μm), which can increase the effects of pore blockage by NOM (Corwin and Summers, 2010; Bajracharya et al., 2019). The two tested lignite coal-based GACs had Qm values for MC-LR in model water ranging from 13 to 21 μg/mg and saw a 35–64% reduction in Qm from the addition of 5 mg/L SRFA. Bituminous coal-based GACs had Qm values for MC-LR in model water ranging from 6.0 to 10 μg/mg and saw a 57–80% reduction in Qm from the addition of 5 mg/L SRFA (Fig. 3 and Supplementary Table S3). These findings demonstrating a lower Qm for coal-based activated carbon relative to wood-based activated carbon were consistent with PAC studies where this pattern was attributed to differences in mesoporosity (Donati et al., 1994; Bajracharya et al., 2019). These findings also agree with Shi et al. (2012) who found that lignite coal-based PAC has nearly three times the mesopore volume of bituminous coal-based PAC. The equilibrium data for the coconut-based GAC were low and not described well with either isotherm equation. This finding was in agreement with Pendleton et al. (2001) and Donati et al. (1994), who found extremely low Qm for coconut-based carbons, which tend to lack mesoporosity. The adsorption affinity parameter, ba, decreased in the same order as Qm (wood > lignite coal > bituminous coal) and was substantially reduced in the presence of NOM, which competes for adsorption sites (Supplementary Table S3).
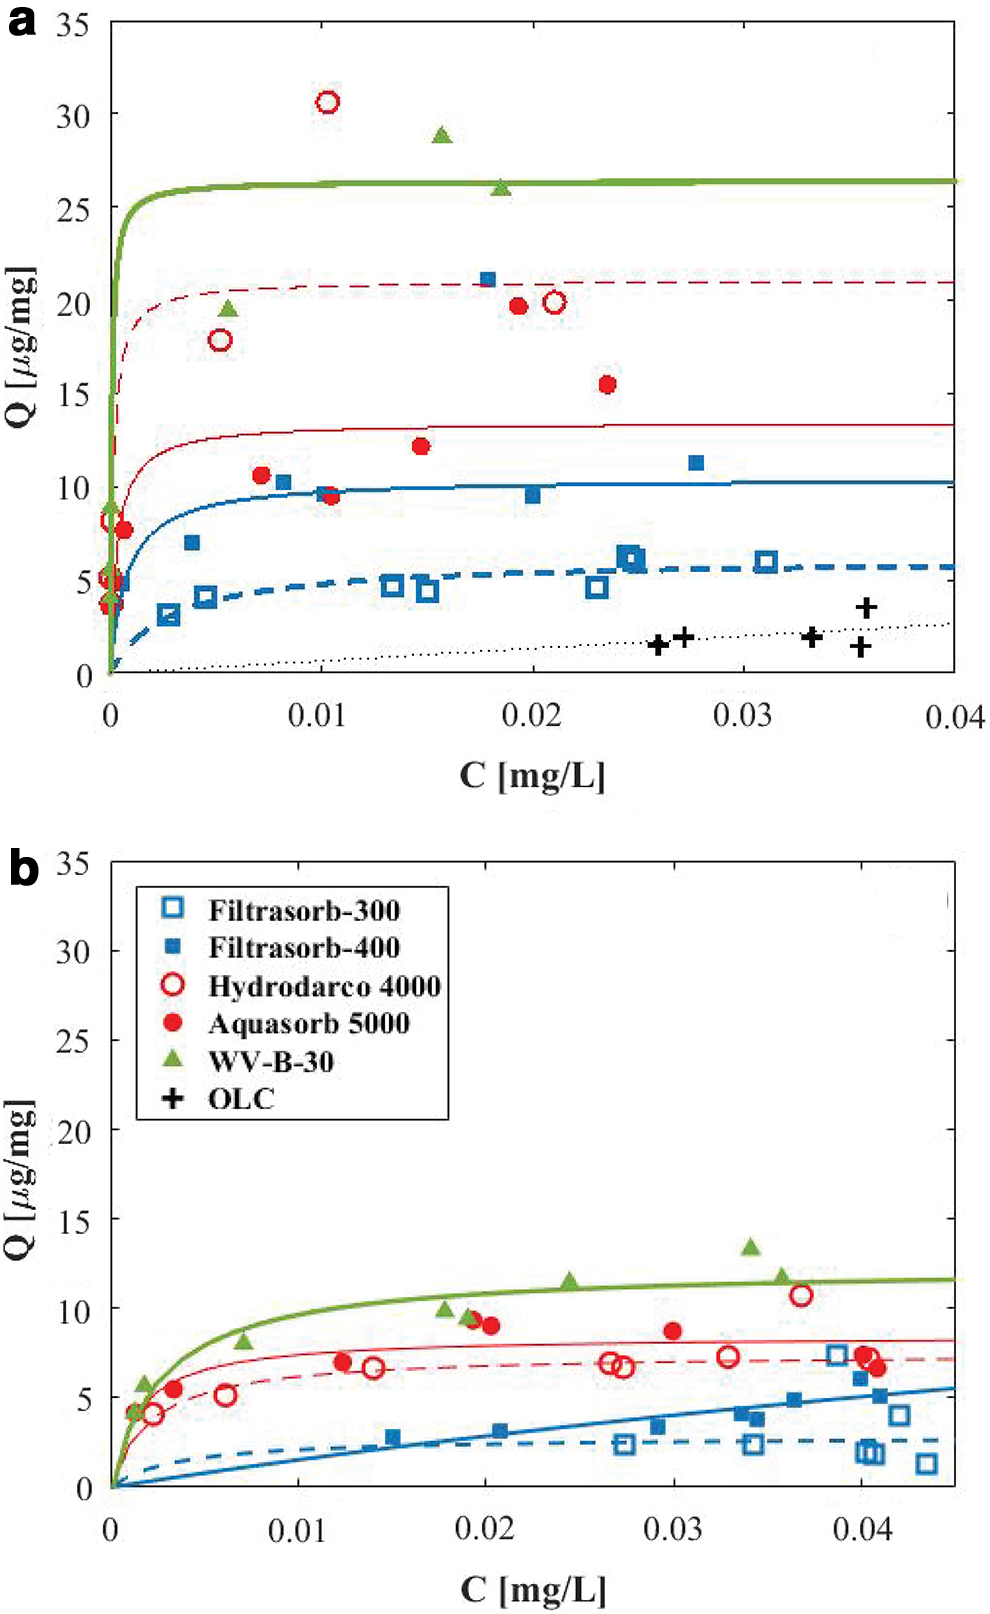
Equilibrium adsorption data and Langmuir isotherm fits for all GAC materials with no competing organic matter
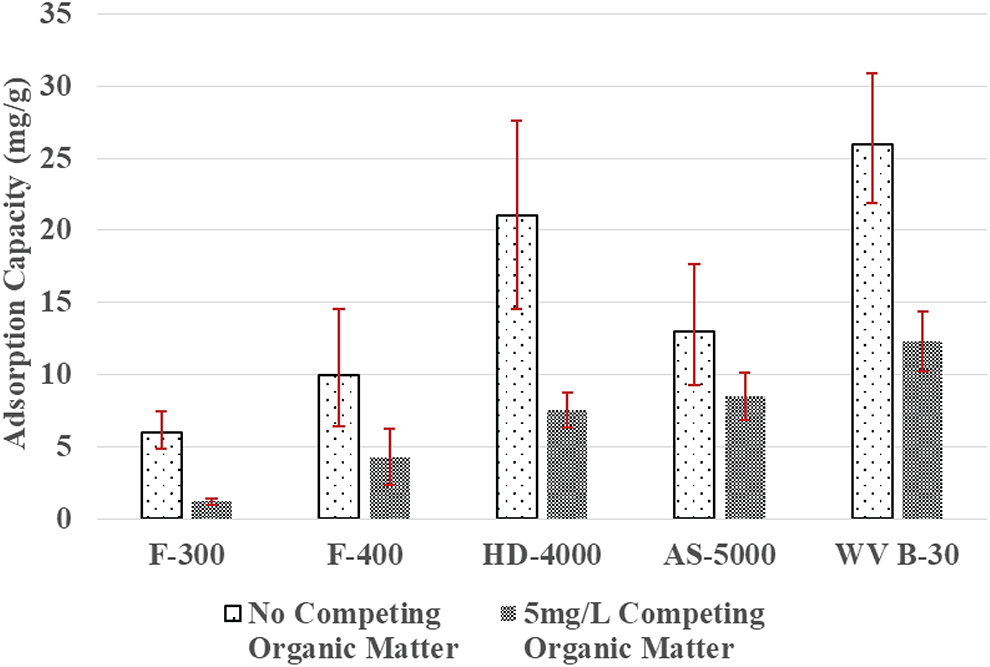
Summary of the MC-LR maximum adsorption capacity for tested GAC products with and without competing SRFA organic matter. Red bars indicate 95% confidence intervals. F, filtrasorb; HD, hydrodarco; AS, aquasorb.
This observed impact from the addition of SRFA may be different than the effect from the addition of a different type of NOM. SFRA has a molecular weight of ∼800–2,000 g/mol (Chin et al., 1994) and an average diameter of 1.2 nm (de Wit et al., 1993), and is largely composed of decomposed terrestrial vegetation. In contrast, the type of NOM in harmful algal bloom (HAB)-impacted surface waters may be more microbially based, resulting in a lower molecular weight, and consists of more aliphatic and more polar molecules (McKnight et al., 1994). Bajracharya et al. (2019) observed that adsorption of MC-LR to PAC in the presence of NOM from HAB-impacted surface water was slightly less than in the presence of an equal concentration of SRFA, which is consistent with the lower molecular weight and higher aliphatic and polar nature of algal-derived NOM, adsorbing more to activated carbon than larger size and less polar NOM (Kilduff et al., 1996).
RSSCT breakthrough
RSSCT breakthrough data consisted of influent and effluent data (ELISA and UPLC data aligned well, see Supplementary Fig. S6), which were manipulated into percent breakthrough (C/C0) curves for MC-LR and NOM breakthrough. The x-axis of the breakthrough curve can be displayed in small-scale column days, BVs treated, or scaled to full-scale operation based on the PD-RSSCT scaling equation. Error associated with the x-axis measurements includes (1) scaling error arising from uncertainty in the particle size radii, and (2) measurement error arising from uncertainty in the column inner diameter, GAC bed depth, and flow rate, which combine in the actual EBCTSC of the RSSCT column. These two types of errors compounded together into the calculation of the EBCTFS. Although the design target was 15 min, the column tests vary in their calculated actual EBCTFS from 13.7 to 17.9 min with an associated error of 18–19%. A full error analysis is presented in Supplementary Table S5.
Breakthrough by GAC source material
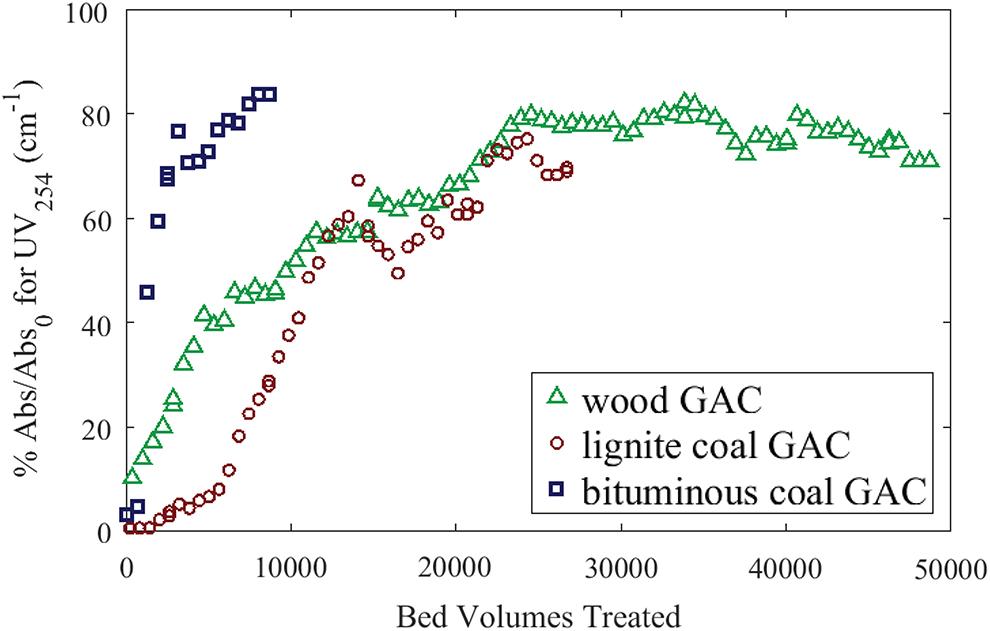
There was an observed difference in both the time to MC-LR breakthrough and the slope of the MC-LR breakthrough after this initial time to breakthrough, which depended on the GAC source material (Fig. 4 and Table 4). As expected from its lower observed maximum adsorption capacity relative to wood both in this study (Fig. 3) and others (Donati et al., 1994), the bituminous coal-based GAC experienced initial MC-LR breakthrough most quickly. At the lower, health advisory-based breakthrough thresholds, the wood and lignite coal performed similarly (Fig. 4 and Supplementary Tables S6 and S7). However, after this initial breakthrough, the elution of MC-LR from the column was more gradual for the wood GAC. The flattening of the breakthrough was studied by Kennedy et al. (2017), who found that it is related to NOM fouling, which leads to differences in the intraparticle diffusion causing spreading of the mass transfer zone (MTZ).
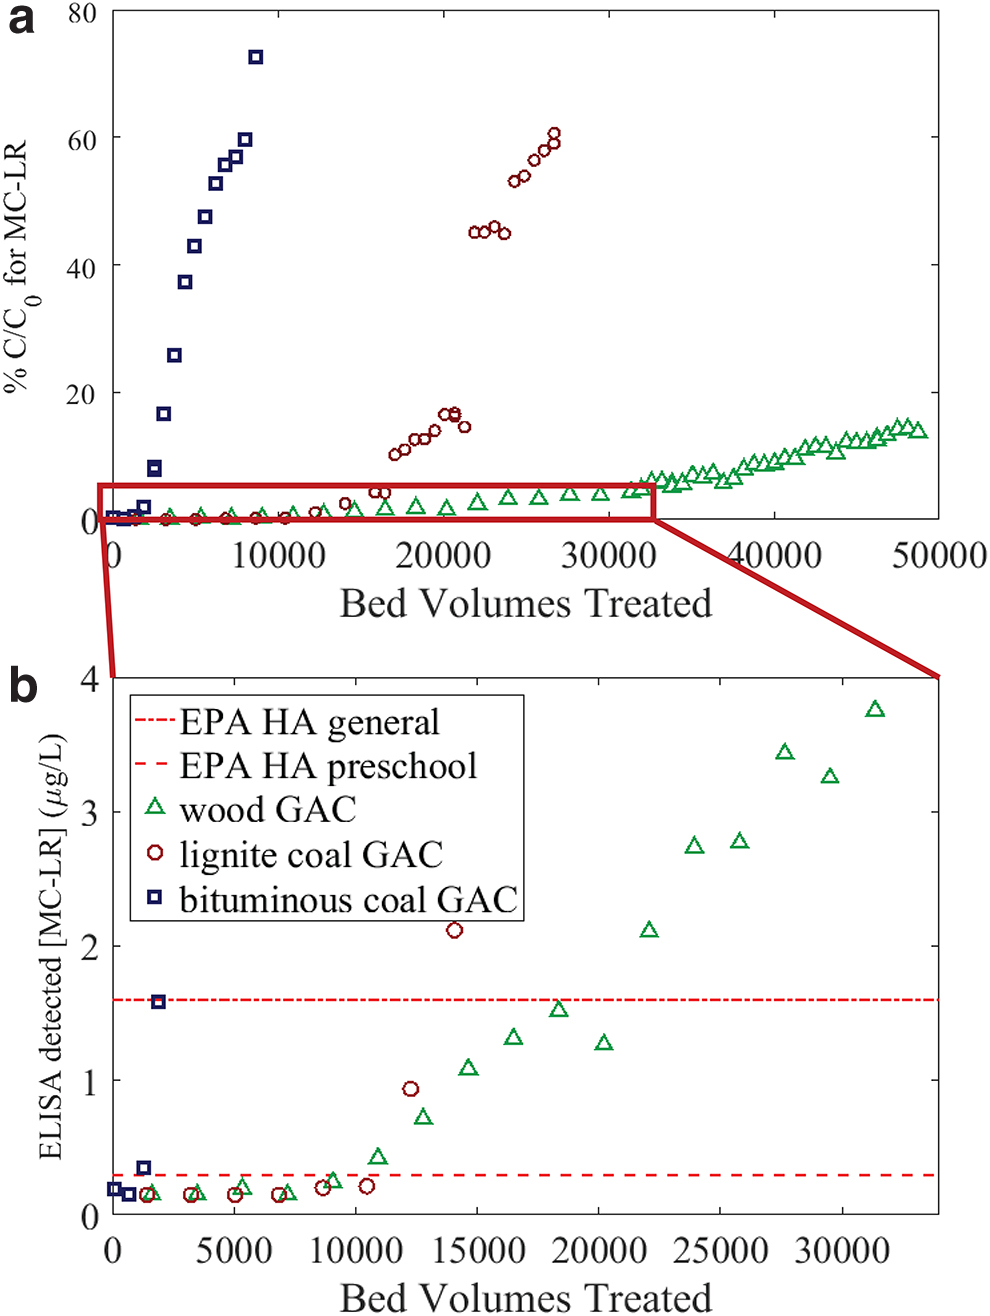
MC-LR breakthrough in RSSCT 12 (wood), RSSCT 8 (lignite coal), and RSSCT 9 (bituminous coal), with
Rapid Small-Scale Column Test Bed Volumes to Breakthrough for Selected Runs
BV, treated empty bed volumes to breakthrough (uses actual bed volume for each column); σBV, experimental and scaling error associated with the bed volumes to breakthrough; EBCTFS, full-scale empty bed contact time.
The observed time to breakthrough for NOM in all columns was shorter than for MC-LR (Figs. 4 and 5). NOM adsorption before micropollutant adsorption is termed preadsorption (Kennedy and Summers, 2015), meaning the portion of the column that the MC-LR interacts with was essentially preloaded with NOM. Preadsorption can cause fouling by NOM due to (1) direct site competition, which dominates at low micropollutant concentrations, and (2) pore blockage, which dominates at higher micropollutant concentrations (Kennedy and Summers, 2015). Pore blockage contributes to slowed adsorption kinetics for micropollutants by increasing intraparticle diffusion and tortuosity (Kennedy and Summers, 2015). The kinetic impacts of pore blockage are more pronounced in more microporous carbons where the adsorbed NOM occludes pore spaces, hindering both the extent and rate of micropollutant adsorption (Li et al., 2003a). This trend was not consistent with the more gradual slope of MC-LR breakthrough for more mesoporous wood- and lignite-based GAC products. Interestingly, the lignite coal experienced the latest breakthrough for the UV254 data; however, the quality of this UV254 data set was impacted by long holding times and lack of sample filtration.
Breakthrough of NOM in RSSCT 12 (wood), RSSCT 8 (lignite coal), and RSSCT 9 (bituminous coal) based on UV254 measurements. NOM, natural organic matter.
RSSCT runs were stopped once MC-LR breakthrough to the UPLC quantitation limit was achieved, resulting in different run times for the different carbon types, which may impact the degree to which biodegradation influenced MC-LR removal. Pilot column tests comparing GAC and biologically active carbon found that biological degradation takes effect after ∼15 days (Wang et al., 2007; Liu, 2018) and the column run times for the RSSCTs was 3.1 days for bituminous coal, 9.8 days for lignite coal, and 17 days for hardwood GAC. Thus, while the RSSCTs were generally conducted over a short enough period to avoid degradation, the potential for it does exist after 43,200 BVs (15-column day equivalent). It does not appear that this changes the overall observed trends and removal of MC-LR and NOM by the column.
Breakthrough by influent pH
The pH 7.8 and 9.5 columns performed similarly up to the point of the 1.6 μg/L health advisory-based breakthrough threshold with the pH 7.8 column slightly outperforming the higher pH column (Fig. 6). However, after ∼2,000 BVs were treated, there was an observed difference in the slope of the breakthrough curve with the pH 9.5 column experiencing a more gradual breakthrough. At higher pH, the increased negative charge on NOM would be expected to increase the electrostatic repulsion between NOM and the GAC surface leading to reduced interaction (Newcombe and Drikas, 1997). However, the more gradual slope observed at higher pH was not consistent with this prediction as a gradual slope typically reflects increased NOM fouling (Kennedy et al., 2017). Therefore, this change may be due to other MC-LR interactions with GAC that leads to a spread in the MTZ.

MC-LR breakthrough in RSSCT 9 (pH = 7.8. IS = 11.9 mM) and RSSCT 13 (pH = 9.5, IS = 30.5 mM) with
A portion of the increased interaction of MC-LR with the GAC surface with increasing pH may be due to the higher ionic strength of the model water at pH 9.5 (30.5 mM) relative to pH 7.8 (11.9 mM). The size of the NOM and MC-LR molecules decrease with increasing ionic strength or decreasing pH, which affects the portion of the pores they may be able to access (Donati et al., 1994). An increase in ionic strength will also increase the shielding effect of the repulsive forces between the like-charged NOM or MC-LR and GAC adsorbent, thereby increasing adsorption (Summers and Roberts, 1988b).
Although one might expect decreased adsorption capacity for MC-LR at higher pH due to its increased hydrophilicity (de Maagd et al., 1999), the increase measured was in agreement with Bajracharya et al. (2019) who found that, in the presence of competing NOM, the extent and the rate of MC-LR adsorption for bituminous coal-based PAC increased with increasing pH. This increase in MC-LR adsorption could reflect a decrease in NOM adsorption at higher pH where the increased negative charge on NOM increases electrostatic repulsion with the GAC surface and thus reduces adsorption (Newcombe and Drikas, 1997). This decreased interaction between NOM and the GAC surface would allow increased interaction between MC-LR and the GAC surface by decreasing both direct adsorption site competition and pore blocking by NOM (Ding, 2010). This hypothesis was supported by the NOM breakthrough curve, which found more rapid breakthrough of NOM at the higher pH (Fig. 7), indicating less interaction between the NOM and the GAC surface. However, this decrease in NOM fouling was not consistent with the more gradual slope observed for the RSSCT breakthrough curve at high pH.

Breakthrough of NOM in RSSCT 9 (pH = 7.8, IS = 11.9 mM) and RSSCT 13 (pH = 9.5, IS = 30.5 mM) based on UV254 measurements.
Conclusions
The results for the equilibrium adsorption experiments found that material type does have an effect on the adsorption capacity as this produces differences in pore volume and pore density. However, other factors such as activation method likely also have an influence. The addition of SRFA as competitive NOM decreased the maximum adsorption capacity for all GAC products tested to an extent that exceeded that reported by others. PD-RSSCT tests demonstrated that MC-LR breakthrough exceeded the Ohio EPA action level of 0.3 μg/L MC-LR for bituminous coal at 1,000 BVs treated and significantly later at 9,700 and 9,800 BVs treated for lignite and hardwood GAC, respectively. While the wood and lignite products exceed the action level at similar times, the MC-LR breakthrough was significantly more gradual for the wood-based GAC as time after initial breakthrough increased. This trend was not consistent with the expectation that the rate and extent of adsorption would be greater for the more mesoporous wood-based GAC.
When the pH of the model water matrix was shifted, breakthrough times for MC-LR were similar at the 0.3 μg/L MC-LR Ohio EPA action level for bituminous coal GAC at normal pH (7.8) and high pH (9.5). However, the slope of the pH 9.5 curve was more gradual than the pH 7.8 curve. This trend was inconsistent with an expected decrease in NOM fouling at elevated pH and merits additional study. Any interpretation of these reported full-scale breakthrough times must consider that this study was conducted at a high influent MC-LR concentration (100 μg/L) to generate detectable and conservative results; therefore the full-scale days to breakthrough must be considered in the context of the MC-LR influent concentration.
These findings indicate under the conditions studied that the most commonly used GAC media in Ohio (bituminous coal) was not as effective as other source material carbons for removal of MC-LR and that some lignite products may be comparable with wood. However, this cannot be extrapolated to its suitability for other contaminants of concern such as 2-methylisoborneol (MIB), geosmin, disinfection by-product precursors, or other organic molecules, and there are operational reasons for public utilities to choose a particular manufacturer.
Footnotes
Acknowledgment
The authors thank Dr. Jean-Christophe Cocuron from the Targeted Metabolomics Laboratory at Ohio State (now at University of North Texas) for his assistance with the LC-MS/MS measurements.
Author Disclosure Statement
No competing financial interests exist.
Funding Information
This research was supported by the Ohio Department of Higher Education through its Harmful Algal Bloom Research Initiative managed by Ohio Sea Grant. A portion of the work was also supported through the Ohio Water Development Authority through Award # 6836. K.V. was partially supported by a University Fellowship provided by The Ohio State University.
References
Supplementary Material
Please find the following supplemental material available below.
For Open Access articles published under a Creative Commons License, all supplemental material carries the same license as the article it is associated with.
For non-Open Access articles published, all supplemental material carries a non-exclusive license, and permission requests for re-use of supplemental material or any part of supplemental material shall be sent directly to the copyright owner as specified in the copyright notice associated with the article.