
Abstract
There are two main objectives of this study: the first was to examine the performance of Cucurbita moschata as sorptive media for the removal of Reactive Red 250 dye compound as a function of contact time, concentration, pH, particle size, flow rate, and bed depth; the second was to demonstrate that Adaptive Neuro-Fuzzy Inference System can be effectively used as a tool to model breakthrough profiles in fixed-bed column systems. The breakthrough curves of Reactive Red 250 were investigated in a fixed-bed column under different conditions. Besides, the mechanism of Reactive Red 250 uptake was analyzed based on the results obtained from Fourier transform infrared spectroscopy. At different pHs, the adsorbents' electrophoretic mobilities were determined to get information about the adsorption process. The adsorbed quantity of Reactive Red 250 dyestuff decreased with the initial pH, particle size, and flow rate augmentation. The total pore volume and Brunauer, Emmett, and Teller (N2) surface area of the particles were defined to be 0.0014 cm3/g and 1.06 m2/g, respectively. The highest observed and predicted bed capacities for Reactive Red 250 were 8.319–8.322 mg/g. The coefficient of determination and mean squared error for the optimal model were obtained to be 0.999 and 1.5 × 10⁻⁵. These findings indicate that the model can estimate the breakthrough profiles of Reactive Red 250 with high accuracy.
Introduction
Numerous dyestuffs are commercially available and used in various industries (Qiu et al., 2009). Most of the dyestuffs are toxic and carcinogenic, posing severe dangers to humans and aquatic organisms (Wang and Ariyanto, 2007). Dyestuffs can be categorized as cationic (basic), anionic (direct, acid, and reactive), and nonionic (disperse) (Mall et al., 2006). Reactive dyestuffs are the most preferred species in the industry because of their brilliant colors, colorfastness, and application advantages (Uzun, 2006). The discharge of these dyestuffs in the water ecosystems, too toxic to aquatic life, reduces the light diffusion into the deeper zones, diminishes the primary production, decreases the plants' photosynthesis, and deteriorates the water quality.
Numerous conventional systems, including electrochemical coagulation, chemical coagulation, advanced oxidation processes, flotation, membrane separation, photo-degradation, anaerobic treatment, and trickling filters, have been used in the removal of dyestuffs from wastewater (Delee et al., 1998; Robinson et al., 2001; Oguz and Keskinler, 2005, 2007; Oguz et al., 2005; van der Zee and Villaverde, 2005; Mondal, 2008). However, these methods include significant disadvantages, such as toxic sludge production, technical limitations, and high operational cost. Reactive dyestuffs are principally resistant to biodegradation and could not be uptaken by conventional systems (Mittal and Gupta, 1996). Removal of the reactive dyestuffs from textile effluents is problematic because of their high solubility in water, synthetic origin, and complex structure (Ozdemir et al., 2004). Therefore, adsorption has been confirmed to be a cost-effective and promising procedure. In the adsorption process designing, the adsorbent cost is an important parameter (Oguz and Ersoy, 2010). In this study, Reactive Red 250 was selected as a model dyestuff owing to its widespread usage in many dyeing applications and possible toxicity. Hence its removal is of great importance.
In recent years, much attention has been attracted to low-cost alternative materials such as industrial by-products, natural materials, and agricultural solid wastes in the removal of dyestuffs (Annadurai et al., 2002; Oguz and Ersoy, 2014). Different types of adsorbents such as the activated surface of banana and orange peels (Temesgen et al., 2018), native and modified fungus biomass (Arıca and Bayramoğlu, 2007), cross-linked chitosan/oxalic acid hydrogels (John et al., 2020), Helianthus annuus hairy roots (Srikantan et al., 2018), modified switchgrass biochar (Mahmoud et al., 2016), eggshell biocomposite beads (Elkady et al., 2011), amazon natural waste (Rigueto et al., 2020), and malt bagasse (Juchen et al., 2018) have been used to remove the reactive dyes from textile industry wastewater. Cucurbita moschata is a variety originating in either Central America or Northern South America. After discovery in the new world, the cucurbit cultivars known as squash or pumpkin were introduced into the old world (Hui, 2006). C. moschata is a crucial tropical vegetable planted all around the world. It has always been very popular because of its high yield, good storage life, usage in the more extended periods, high nutritional value, and fitness in transport. It is often marketed as human food and livestock feed. Commercially prepared pumpkin pie mix is most often made from C. moschata (Murkovic et al., 1996; Taylor and Brant, 2002; Aggarwal and Kotwal, 2009). In this study, C. moschata rind material was chosen as a biosorbent as it is natural, readily available, and low-cost biomass. To our information, no other research on the practice of C. moschata rinds in a fixed-bed column to determine the breakthrough curves of other dyes has been summarized in the literature so far. Hence, in this study, scientific research has been carried out to determine the biosorption potential of C. moschata rinds for Reactive Red 250.
Continuous-flow studies, which are more beneficial in large-scale wastewater treatment systems, have different superiorities over batch systems. They can be easily scaled up using a laboratory-scale process. A fixed bed is an influence process in the adsorption investigations as it has taken advantage of the concentration gradient known as a driving force, allows more effective use of the adsorbent pores, and ends up with a better quality of the effluent (Valdman et al., 2001; Oguz and Ersoy, 2010).
Statistical conventional methods, which are not only losing time but also does not describe the full effects of the parameters, cannot adequately designate the combined interactions between the input parameters. They can also lead to misinterpretation of the outputs (Montgomery, 2008). In recent years, it has attempted to overcome these difficulties using some statistical techniques. Adaptive Neuro-Fuzzy Inference System (ANFIS) has been widely used to analyze environmental data owing to its reliable characteristics to capture the nonlinear relationships between inputs and outputs (Turan et al., 2011). ANFIS is an effective method for modeling the input and output variables in complicated and nonlinear systems (Jang and Sun, 1995; Takassi et al., 2013). ANFIS produces the most efficient learning algorithm compared with other models. In recent years, ANFIS has successfully been used in water treatment and purification to model and simulate various adsorption processes (Brasquet et al., 1999; Yetilmezsoy and Demirel, 2008; Cavas et al., 2011; Ghaedi et al., 2013, 2014). ANFIS was used as a cognitive model in the removal of pollutants such as arsenic (III) and chromium (VI) (Mandal et al., 2015), prediction of the effluent quality of paper mill wastewater (Wan et al., 2011), groundwater pollution problem (Mategaonkar and Eldho, 2012), adsorption modeling of 1,3,4-thiadiazole-2,5-dithiol (Ghaedi et al., 2014), and the removal of chemical oxygen demand by Fenton process (Elmolla et al., 2010). However, scarcely any attention has been paid to model breakthrough profiles using ANFIS in fixed-bed column systems. Adsorption column studies are generally affected by many variables, including bed depth, biosorbent quantity, pH, particle size, and contact time. The effect of the variables on the breakthrough curves could be explained by ANFIS (Uluozlu et al., 2008).
There are two main objectives of this study: the first was to examine the performance of C. moschata as sorptive media for the removal of Reactive Red 250 dye compound as a function of contact time, concentration, pH, particle size, flow rate, and bed depth; the second was to demonstrate that ANFIS can be effectively used as a tool to model breakthrough profiles in fixed-bed column system. At different pHs, electrophoretic mobilities of the adsorbents were determined to understand the adsorption mechanism. Total pore volume and Brunauer, Emmett, and Teller (BET) (N2) surface area of the adsorbents were determined to be 0.0014 cm3/g and 1.06 m2/g, respectively.
Materials and Methods
Adsorbent and adsorbate preparation
C. moschata was preferred as an adsorbent since it was not previously used in other dyestuffs' adsorption. C. moschata was purchased from a local market in Erzurum, Turkey. After the useful parts were consumed, the remaining rinds were washed repeatedly with distilled water to remove the surface contamination. Afterward, they were dried in the open air for 120 h and were cut into small pieces, ground in a blender, and sieved to split into the various particle sizes (0.25–0.5, 0.5–1, and 1–2 mm).
The dyestuff of Reactive Red 250 was obtained from a textile weaving factory located in Gaziantep province for adsorption studies. The dyestuff is reactive species used in the dyeing of cotton products (R1). The dyestuff's initial pH value in the deionized water was between 7 and 8. A stock solution of 100 mg/L was prepared from Reactive Red 250. A series of 150 mL solutions were prepared from the stock solution at concentrations of 20 mg/L. The solutions' initial pH values were in the range of 2–10 (pH values were adjusted with 0.01 M NaOH and HCl). Five hundred milligrams of adsorbent was put in 150 mL flasks and placed in the incubator. Those were kept in the incubator for 30 min at 20°C and 300 rpm. After removing the solutions from the incubator, they were filtered through 45 μm filter papers. The concentration of Reactive Red 250 was defined using a spectrophotometer (R1) (UV Spectrophotometer, Shimadzu 160A; Japan). As a result of Reactive Red 250 analysis, batch adsorption tests showed that the best Reactive Red 250 removal was achieved at pH 2.5 under acidic conditions. However, the removal of Reactive Red 250 significantly decreased as pH increased, and the dye removal did not occur under the alkaline conditions. Because Reactive Red 250 removal efficiency at pH 2 was approximately equal to Reactive Red 250 removal at pH 2.5, pH 2.5 was chosen as the optimum pH. Therefore, column studies were carried out at pH 2.5. The dyestuff used in this investigation is water-soluble, and its typical spectrum (b) and chemical structure (a) is given in Fig. 1. As given in Fig. 1(b), the wavelength versus absorption graph shows a peak at a value of 550 nm for Reactive Red 250.
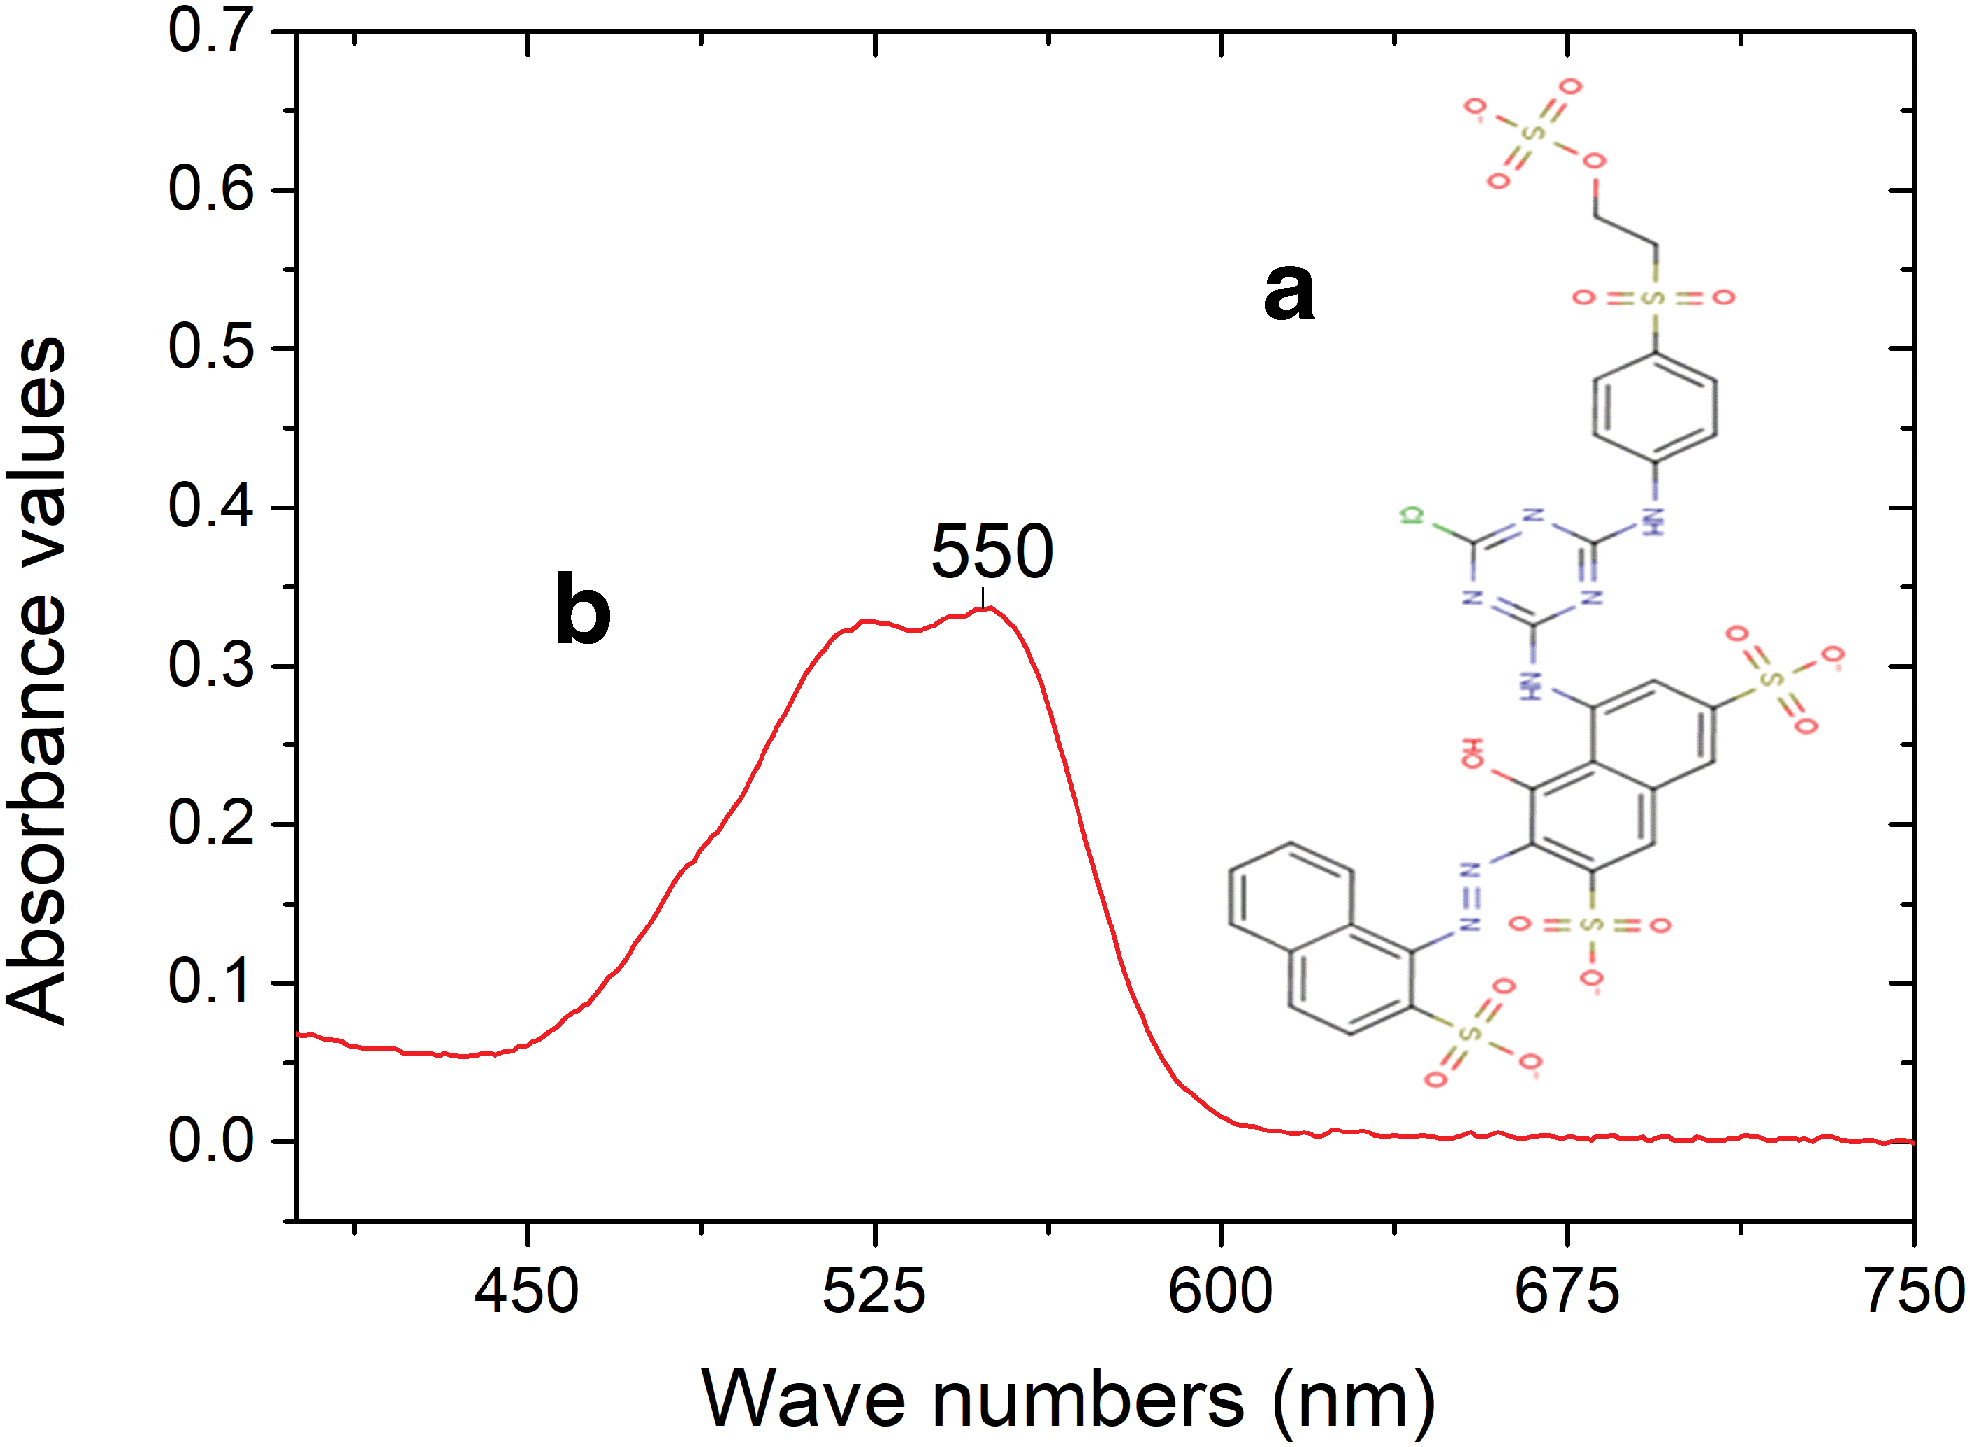
Molecular structure
The BET method was used to determine adsorbents' surface area by a Quantachrome QS-17 model apparatus (Brunauer et al., 1938). BET surface area of the pure adsorbent and the adsorbent with Reactive Red 250 were determined as 1.06 and 0.73 m2/g. The particles' pore volume was determined using an automatic volumetric adsorption analyzer (Micromeritics Gemini Model, 2385). Barrett–Joyner–Halenda method was used to calculate the pore distribution of the particles. The total pore volume was estimated at a relative pressure of 0.99. The pores' single-point adsorption volume less than the 63.0984 nm radius was calculated as 0.0012 cm3/g.
Fourier transform infrared (FTIR) spectra were obtained by a Perkin-Elmer 1720 spectrometer (16 scans; resolution, 2 cm−1). A micro-electrophoresis cell (zeta meter 3.0+) was used for zeta potential measurements.
Experimental column studies
Teflon columns with an inner diameter of 1 cm and depths of 5, 10, and 15 cm were used. A known amount (1.2, 2.4, and 3.6 g) of the adsorbent was placed in the fixed bed to attain the required column depth. A concentration of 10 mg/L, Reactive Red 250 dyestuff solution was transferred into the fixed-bed column by upstream. The operation in the fixed bed was deactivated when the effluent concentration approached the influent concentration. Reactive Red 250 dyestuff quantity transported in the fixed bed was determined by Equation (1).
where Co is the inlet concentration (mg/L), F is the flow rate (mL/min), and te is the exhaustion time (min).
The amount of Reactive Red 250 dyestuff retained in the fixed bed is obtained from the area under the adsorption curve [Eq. (2)]:
where q represents the amount of the retained dyestuff (mg), Co and Ct are the concentrations (mg/L) at the influent and effluent, respectively, Q is the flow rate (mL/min), m is the amount of the adsorbent in the fixed bed (mg), and t is the adsorption time (min).
The ANFIS methodology
The ANFIS toolbox of MATLAB was used to obtain Reactive Red 250 breakthrough curves in the fixed-bed column. ANFIS is an efficient method to overcome any investigation problem. Although many models have been offered to predict the dependent variables, they have an apparent disadvantage concerning processing time. As an alternative model, ANFIS has the advantages of internal system parameters providing a compact solution and fast calculation for multivariable problems (Petkovic et al., 2012). The fuzzy logic theorem has been recommended by Zadeh (1965) to describe the complicated systems. It has been successfully used for different applications such as chemical reactors and environmental systems.
The data were randomly separated into two parts (70% for training, and 30% for testing). A total of 265 and 114 data were used for training and testing subsets, respectively. ANFIS input layer consists of concentration, time, pH, particle size, flow rate, and bed depth. The output layer is (Ct/Co) (%). For the input layer, the Gaussian type membership function was used. The data were standardized by subtracting the mean of the series and dividing by the standard deviation. The architecture of ANFIS for the breakthrough curves of Reactive Red 250 is given in Fig. 2.
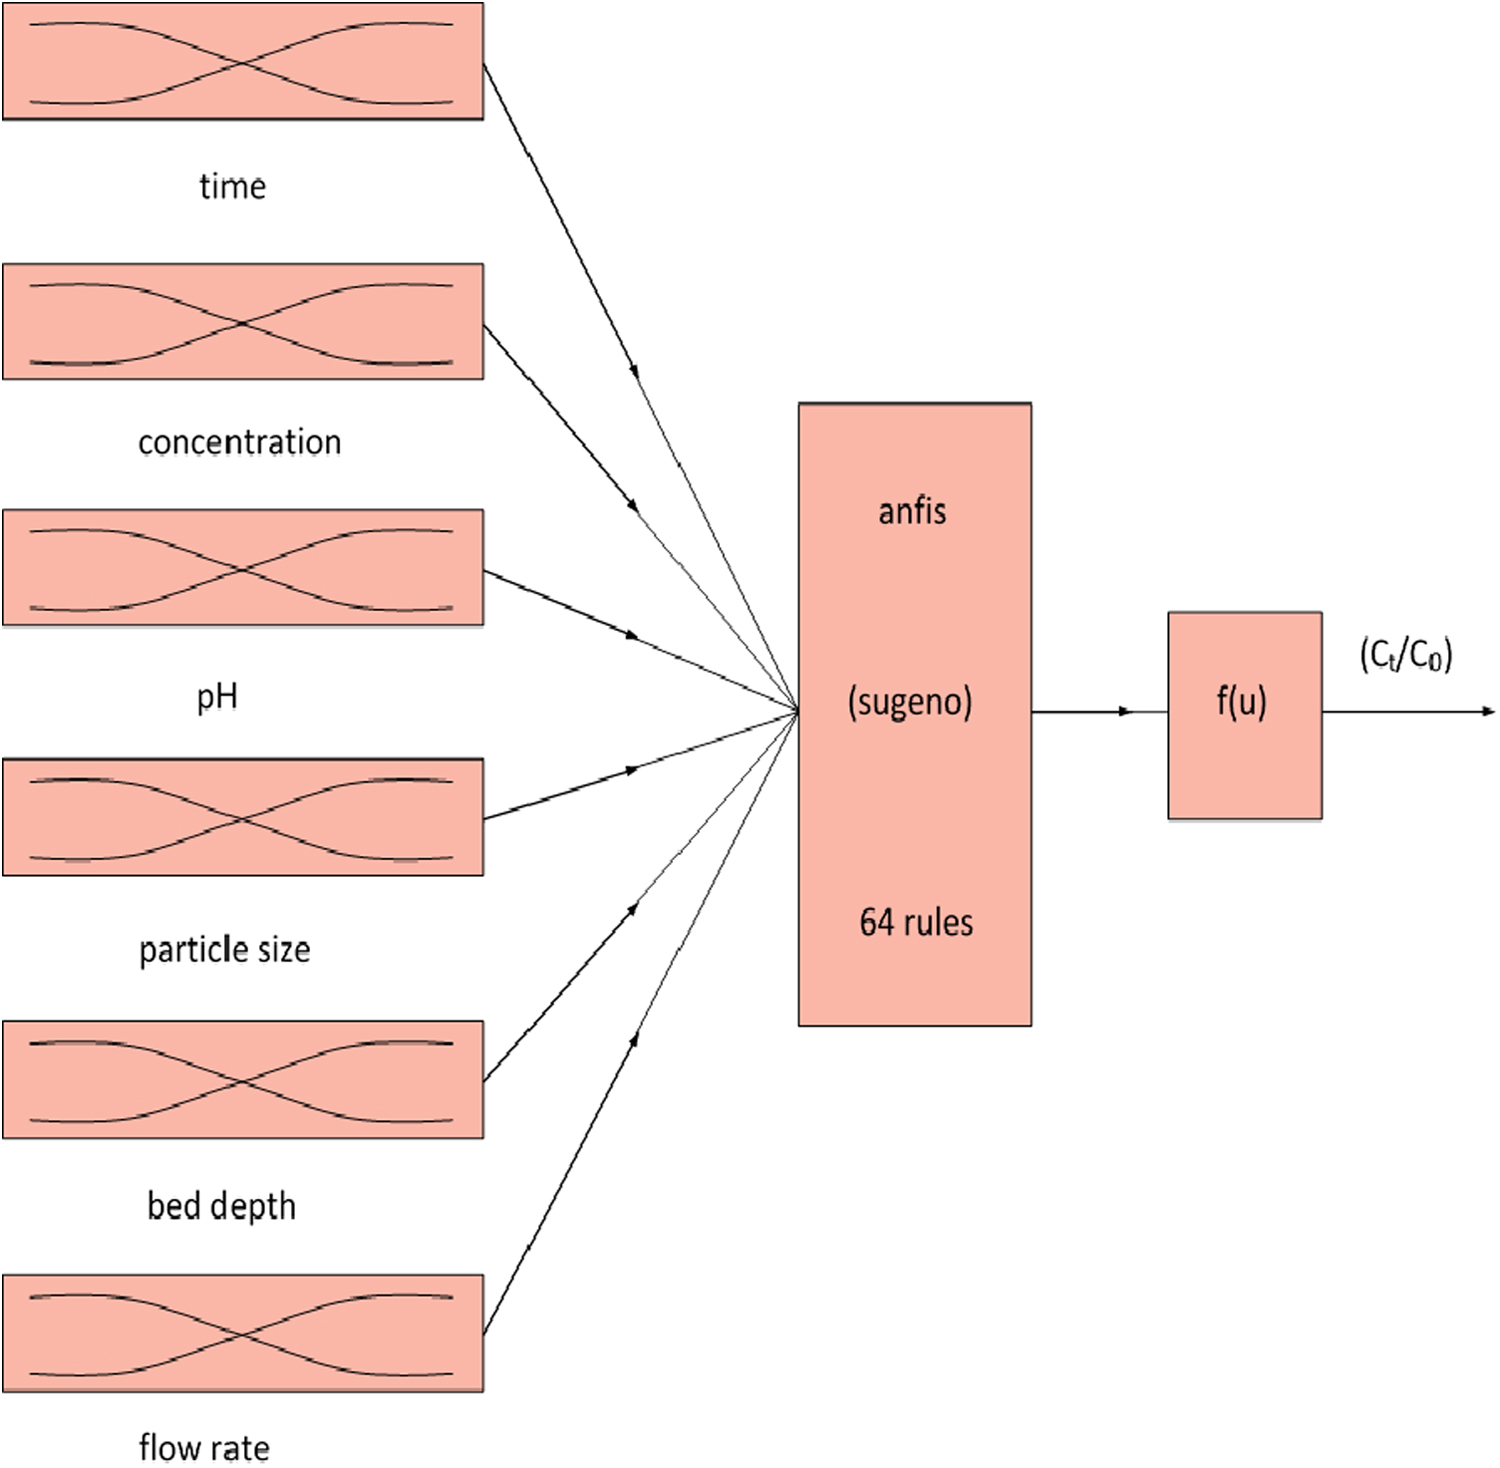
Architecture of the ANFIS. ANFIS, Adaptive Neuro-Fuzzy Inference System.
Results
Effect of the experimental conditions on the breakthrough profiles
Effect of the Reactive Red 250 concentration
The effects of the influent concentrations on the breakthrough profile shapes are given in Fig. 3(a). As given in Fig. 3(a), the observed and predicted adsorption capacities in the (Ct/Co) value of 98% reached (5.945, 5.945), (7.316, 7.333), and (8.319, 8.322) mg/g when the influent concentration was 10, 15, and 20 mg/L, respectively. The breakthrough profiles obtained at the various concentrations show that Reactive Red 250 was adsorbed on the C. moschata.
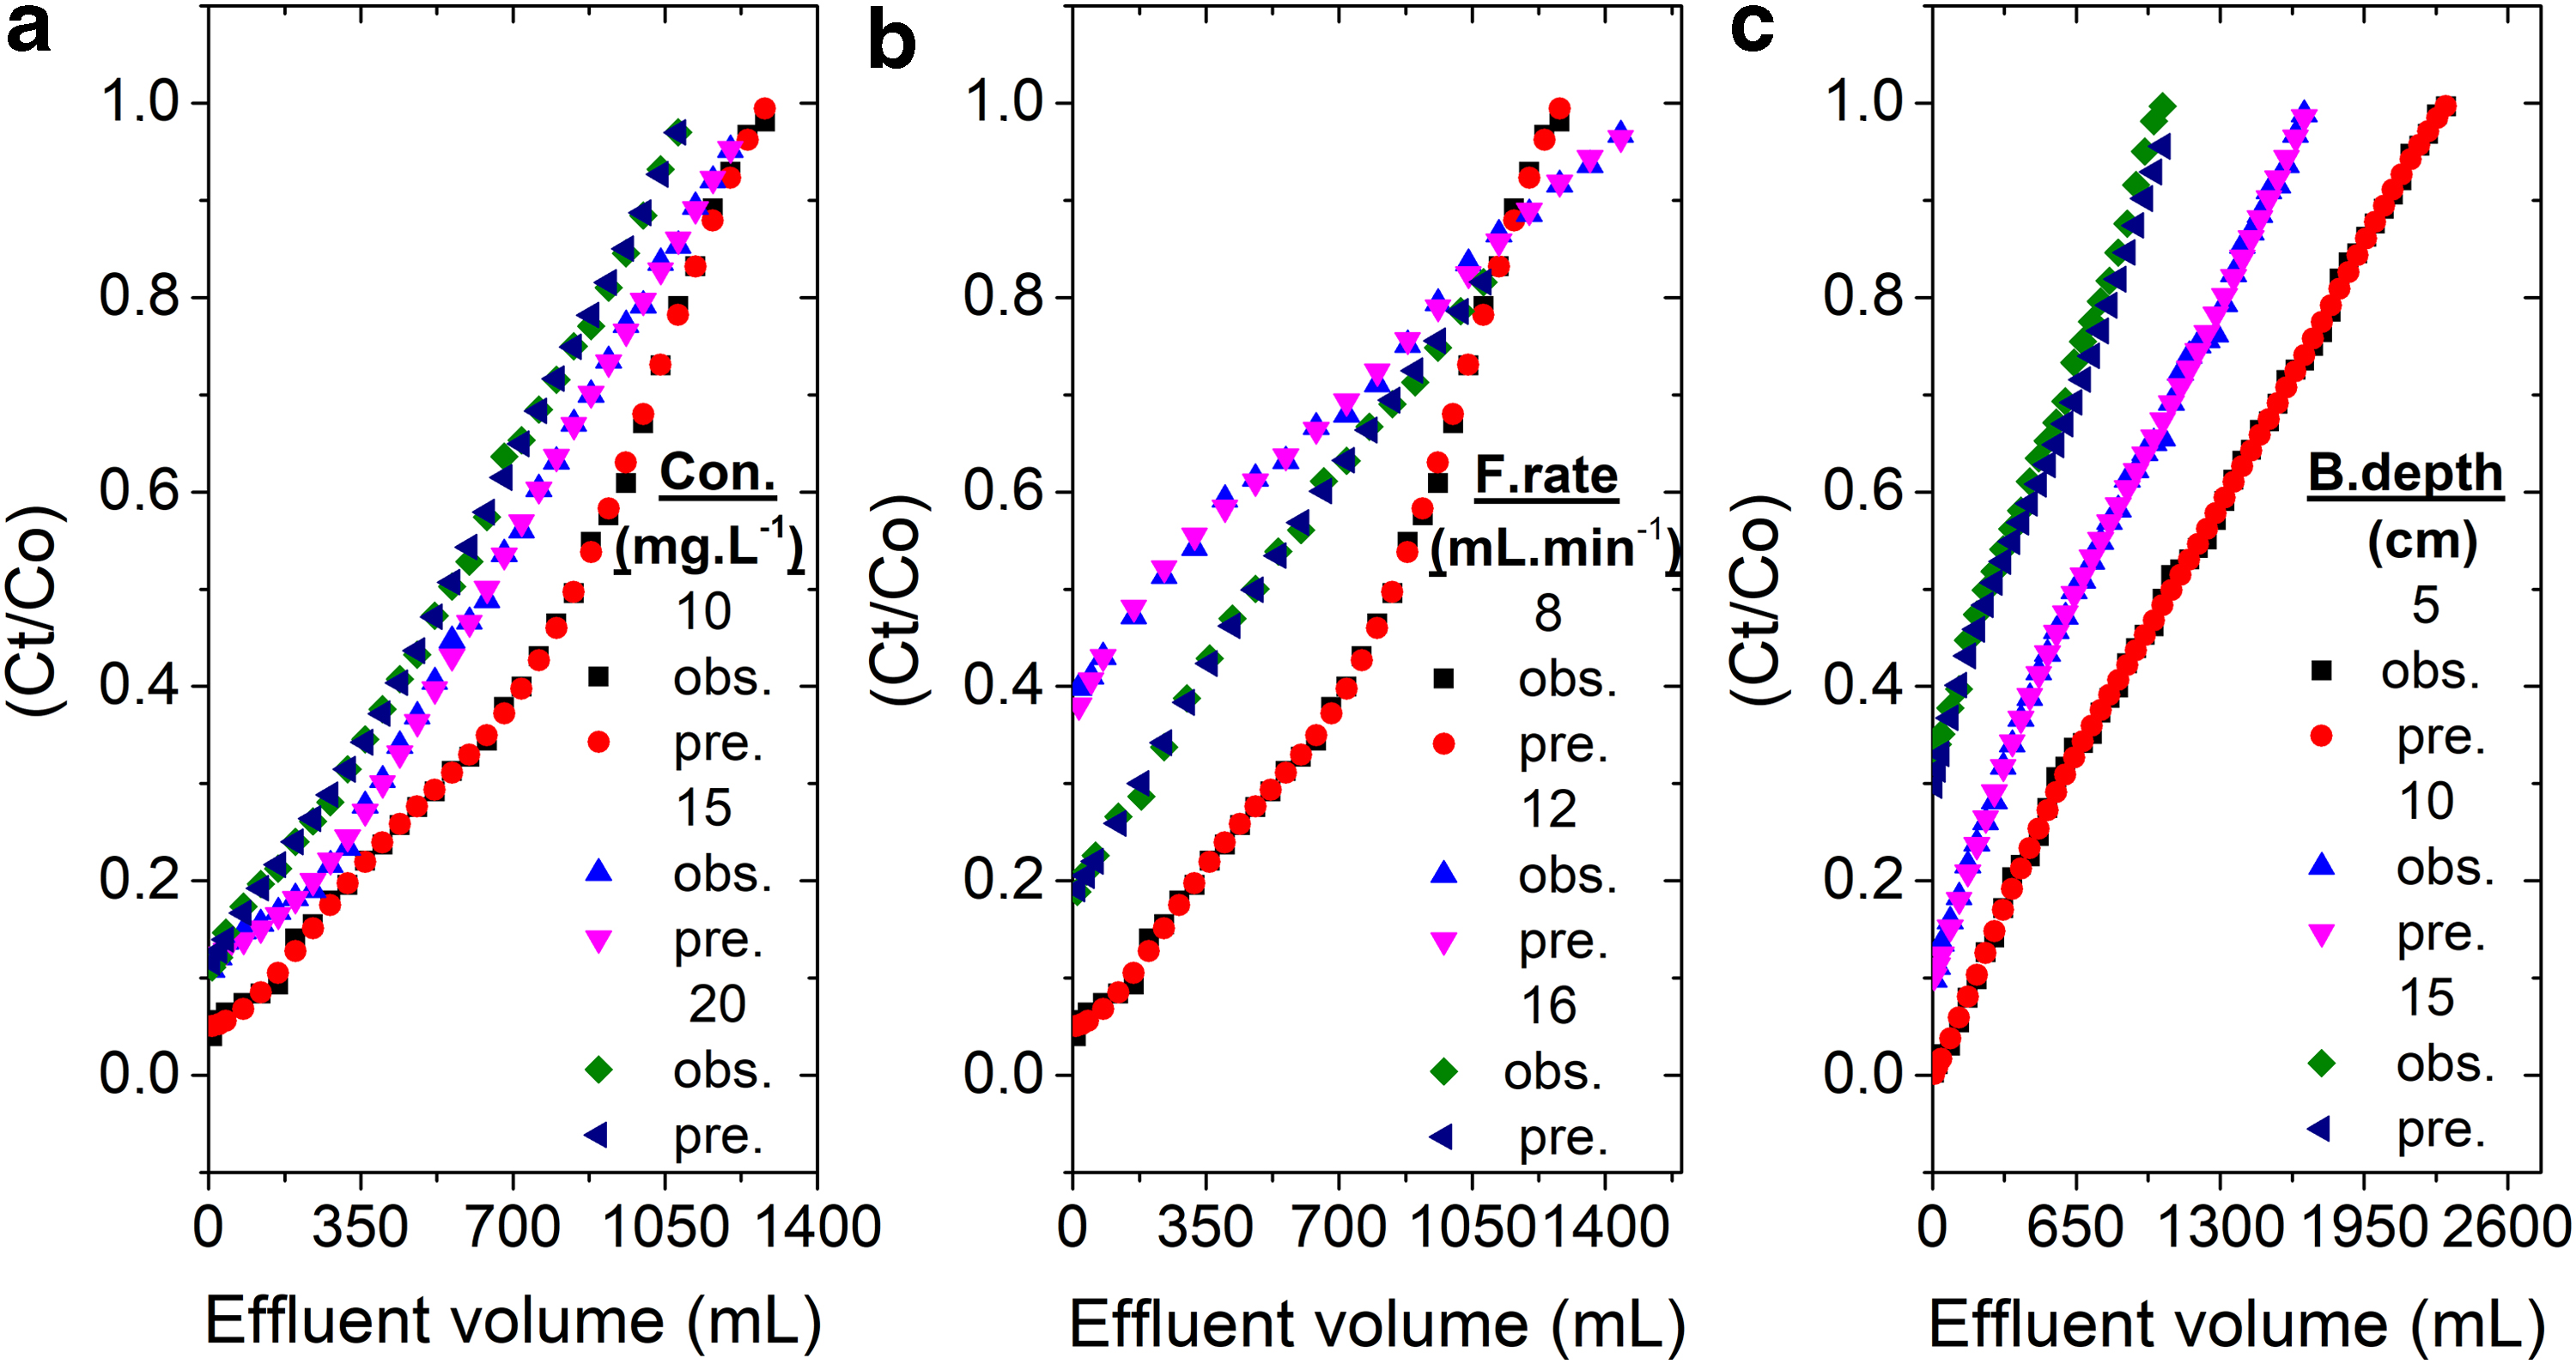
The observed and predicted breakthrough curves for Reactive Red 250 as a function of the inlet dyestuff concentration
Figure 3(a) illustrates that the effluent volume decreases with the inlet concentration's augmentation. The breakthrough profiles were distributed at the lower inlet dyestuff concentration, and the breakthrough volume occurred more slowly. As the inlet concentration augmented, sharper breakthrough profiles were obtained. These findings indicate that the concentration gradient affects the adsorbent capacity and effluent volume. As the inlet concentration increases, the dyestuff loading rate augments, and so does the driving force for the mass transfer (Goel et al., 2005).
The effect of the flow rate
The flow rates were, respectively, changed in the range of 8–16 mL/min, whereas the concentration of Reactive Red 250 in the influent solution was 10 mg/L. At different flow rates, the observed and predicted breakthrough profiles are given in Fig. 3(b).
The obtained findings show that the flow rate powerfully influences the adsorption of Reactive Red 250 on the particles of C. moschata. The breakthrough profiles shifted to the vertical axis with the augmentation of flow rate. Higher effluent concentration was observed under a higher flow rate condition until the effluent volume reached ∼1,100 mL. Figure 3(b) shows that the effluent concentration of Reactive Red 250 increased with the increase of the flow rate.
As the solution continued to flow, the fixed-bed column was saturated with Reactive Red 250. Concentration in the effluent approached the inlet concentration. The total concentration removal of Reactive Red 250 decreased with the augmentation of flow rate, and the maximum bed capacity was obtained at a flow rate of 8 mL/min. As given in Fig. 3(b), the observed and predicted adsorption capacities of Reactive Red 250 at the (Ct/Co) value of 98% reached (5.945, 5.945), (4.143, 4.143), and (3.121, 3.090) mg/g when the flow rates were 8, 12 and 16 mL/min, respectively.
Effect of the bed depth
When the particle sizes of 0.25–0.5 mm are used, a short circuit in the 15 cm column (short circuit occurred in only 15 cm column) was established. Thus, the particle sizes of 1–2 mm were used to prevent the short circuit in the bed depth of 15 cm. Besides, 1- to 2-mm-sized particles were used at all bed heights to compare bed capacities. The retainment of the dyestuff in a fixed-bed column depends on the amount of adsorbent or the bed depth. The particles' adsorption performance was researched at the bed depths of 5, 10, and 15 cm for the inlet concentration of 10 mg/L and the flow rate of 8 mL/min.
Figure 3(c) indicates the breakthrough profiles of Reactive Red 250 at various bed depths. For the three-bed depths, as the bed depth augments, the breakthrough time of Reactive Red 250 augments, which is explained by the bed service time. As given in Fig. 3(c), the observed and the predicted adsorption capacities in the (Ct/Co) value of 98% were obtained to be (2.676, 2.808), (2.812, 2.809), and (2.890, 2.888) mg/g when the bed depth was 5, 10, and 15 cm, respectively. At the bed depth of 5 cm, the adsorbent was more quickly saturated as the adsorption at the binding sites was faster.
Effect of the pH
pH is an essential factor in the fixed bed studies, and the pH of the solution has a more powerful effect on the removal of Reactive Red 250 in the fixed bed. When the solution's pH value was 2, the highest adsorbent capacities and the most extended effluent volume were obtained.
As given in Fig. 4(a), the observed and predicted adsorbent capacities at the (Ct/Co) value of 98% reached (5.945, 5.945), (3.700, 3.700), and (1.684, 1.679) mg/g when pH values of the solution were 2, 2.5, and 3, respectively.
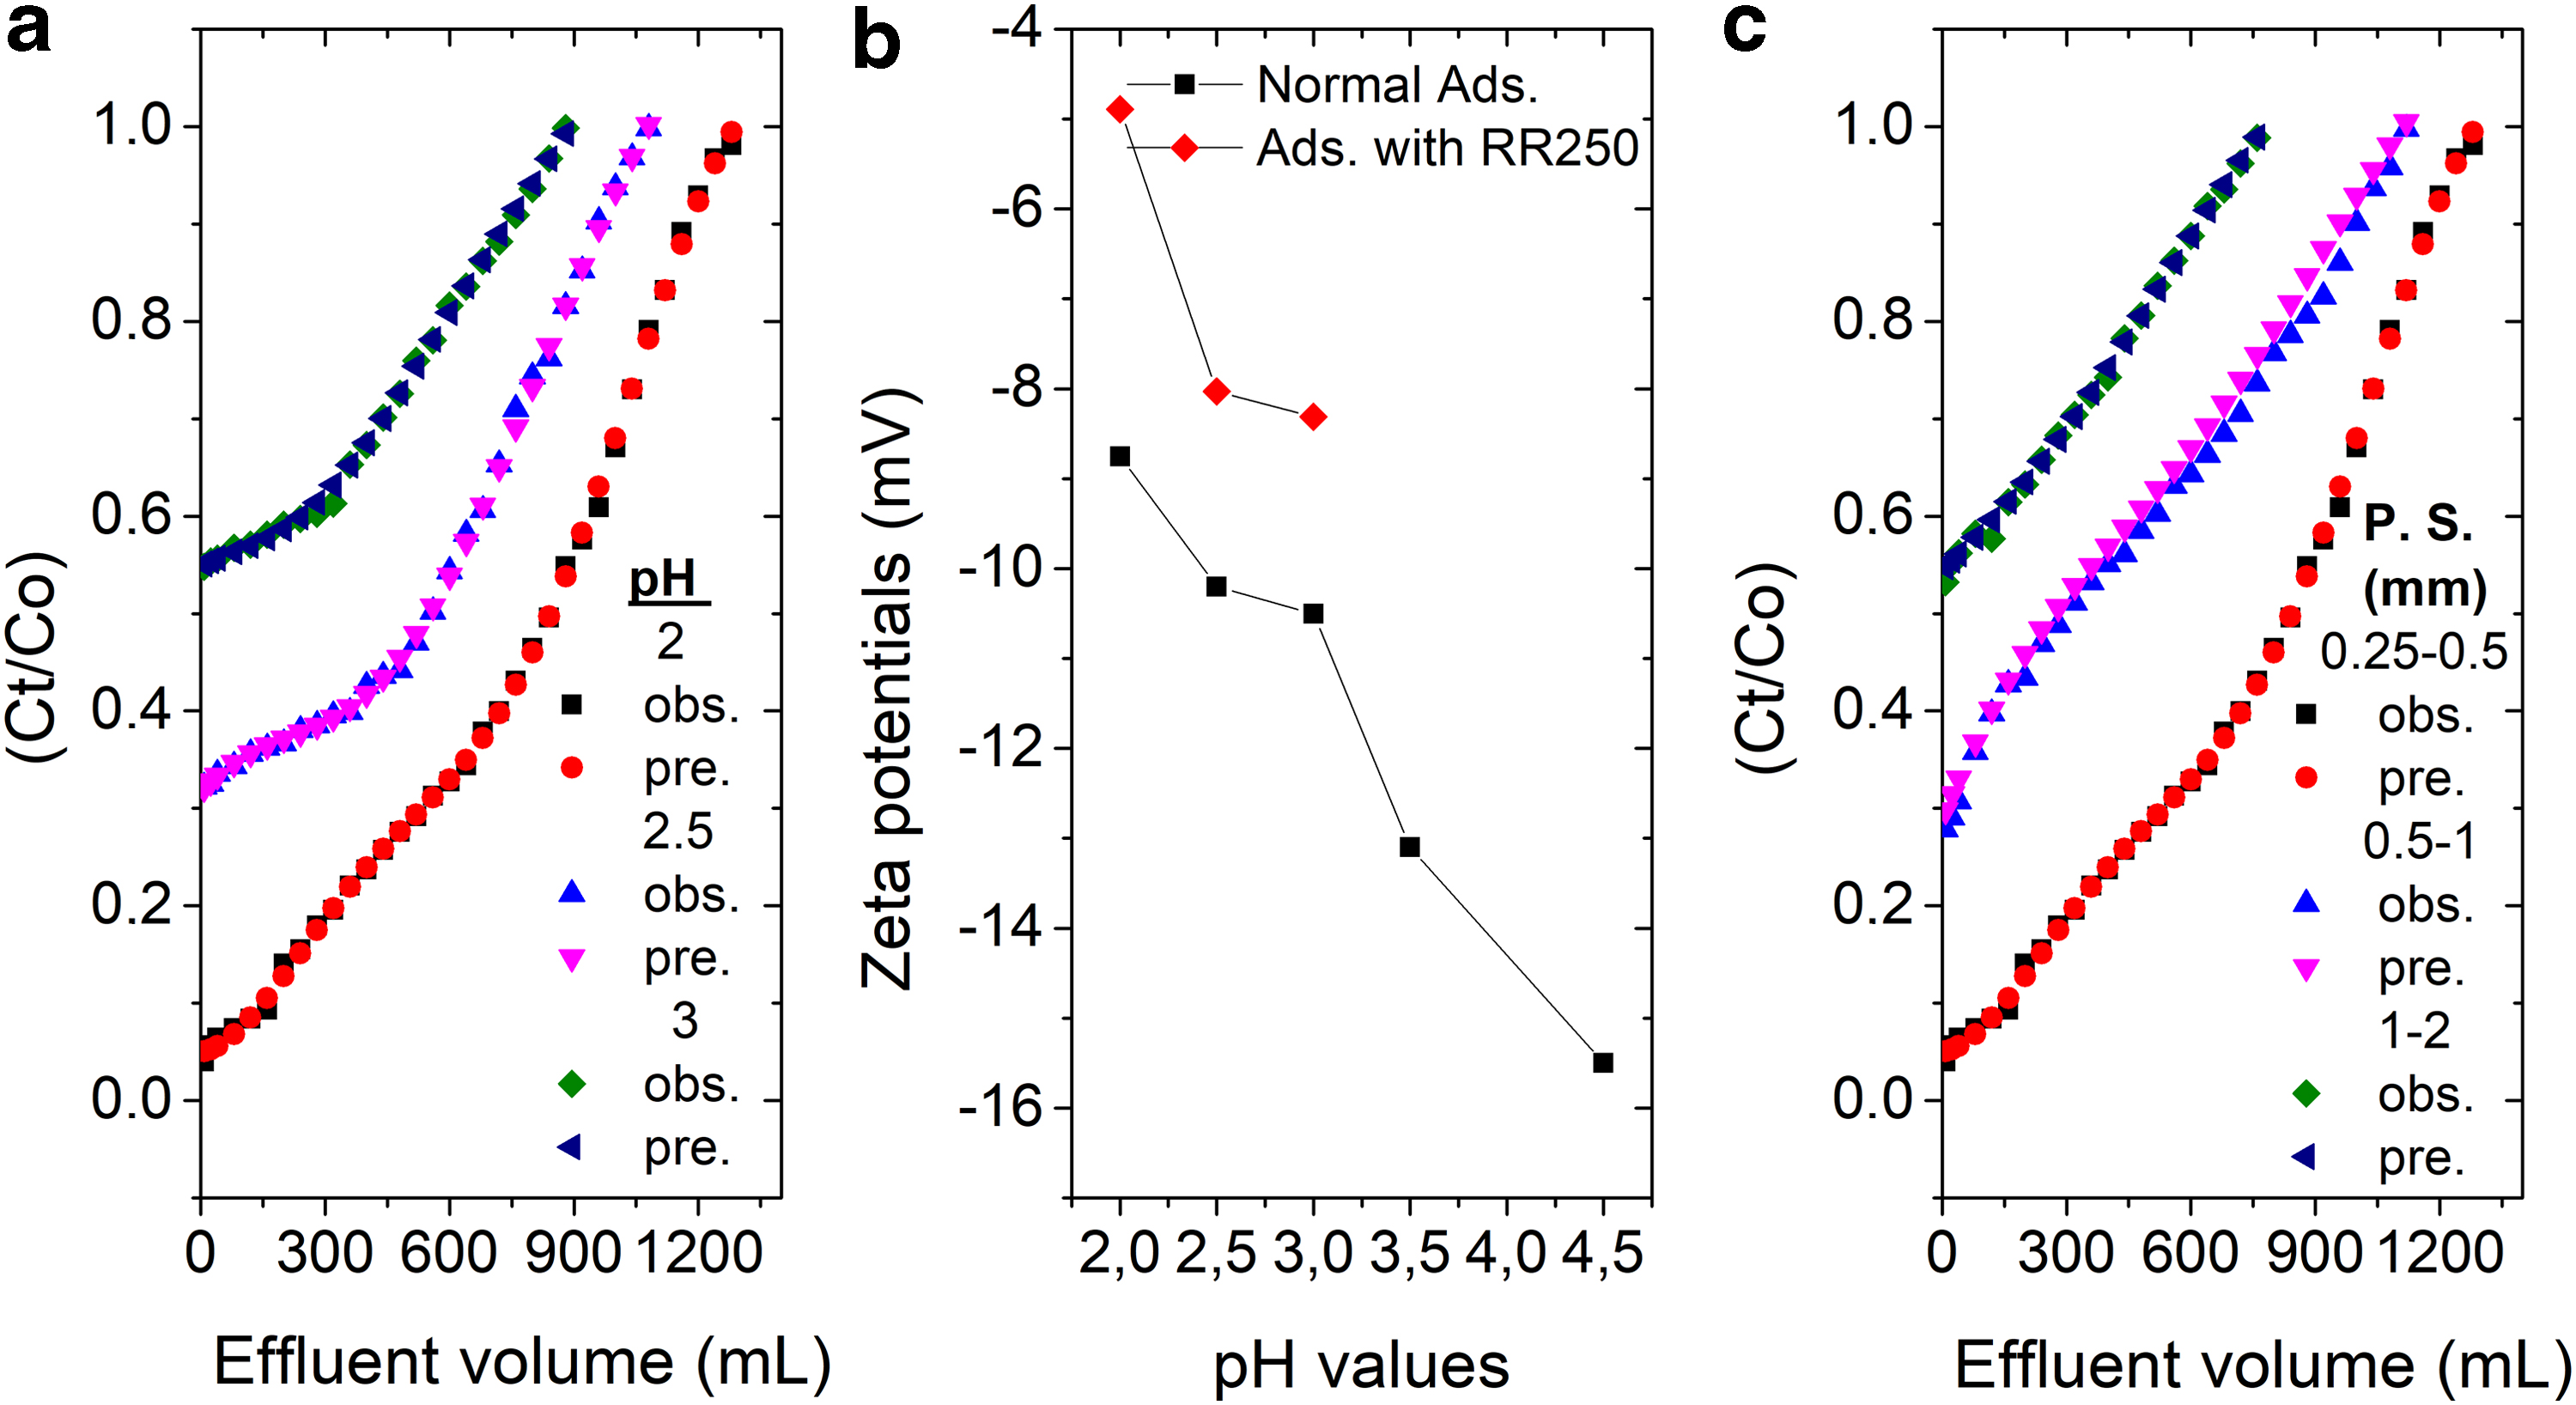
The observed and predicted breakthrough curves for Reactive Red 250 as a function of the pH
The change of Reactive Red 250 adsorption capacities in the pH range of 2–3 is given in Fig. 4(a). The adsorbed quantities of Reactive Red 250 decreased with the initial pH's augmentation, as given in Fig. 4(a). It is understood that the variation in the adsorption capacity with the solution pH is owing to the structural changes in the dyestuff structure and the surface characteristics of the adsorbent particles.
C. moschata biomass indicates that the adsorption capacities of the adsorbents depend on the pH values. It is thought that the surface charge on the particle influences the adsorption of the dyestuff. More H+ ions tend to react with the dyestuff and the adsorbent sites at a lower pH value. The electrostatic attraction between the negatively charged dyestuff and the positively charged particle sites causes augmentation at the adsorption capacities. Based on the data in Fig. 4(b), it is clear that the adsorbent particles are negatively charged. That is because the adsorbent (with Reactive Red 250) is more positive than normal adsorbent under the same pH. As the initial pH augments, the number of the negatively charged sites augments. A negatively charged surface of the particle does not favor adsorption because of electrostatic repulsion (Malik, 2004; Akkaya and Ozer, 2005).
As given in Fig. 4(b), at pH 2, 2.5, and 3, zeta potentials of natural adsorbent in the deionized water are different from those of the dyed adsorbent. The changes in the zeta potentials of the dyed particles indicate the removal of Reactive Red 250 from the aqueous solutions. It is understood that the charges on the adsorbent chemically and electrostatically attract the dyestuff. H+ ions in the solution provide a positive augmentation at the dyed particles' zeta potentials, as given in Fig. 4(b). The variations in the zeta potential are a sign of the adsorption of Reactive Red 250.
Effect of the particle size
The effect of particle sizes on the breakthrough curve was investigated in the range of 0.25–0.5 and 1–2 mm. The breakthrough profiles related to the particle sizes are given in Fig. 4(c).
Augmentation of the adsorbent size caused the sharpness of the breakthrough profile. For the larger particle size, the capacity of adsorption decreased with the increase of particle size. A significant shift in breakthrough profiles was determined when the particle size increased from 0.25–0.5 to 1–2 mm. It is thought that this is reasonable owing to the augmentation of the surface area of the particles. Therefore, the shorter distance between particles resulted in higher adsorption capacity.
At the (Ct/Co) value of 98%, as given in Fig. 4(c), the observed and the predicted adsorption capacities reached (5.945, 5.945), (2.676, 2.808), and (1.257, 1.248) mg/g when the adsorbent sizes were 0.25–0.5, 0.5–1, and 1–2 mm, respectively.
Pore characterization and FTIR spectra of C. moschata biomass
At 77 K, N2 adsorption/desorption isotherms of the adsorbent were demonstrated in Fig. 5(a). It is shown that the initial part of the adsorption isotherms includes a lower relative pressure (P/Po). The removal of nitrogen with the relative pressure increase verifies the micro, meso, and macropore structures.
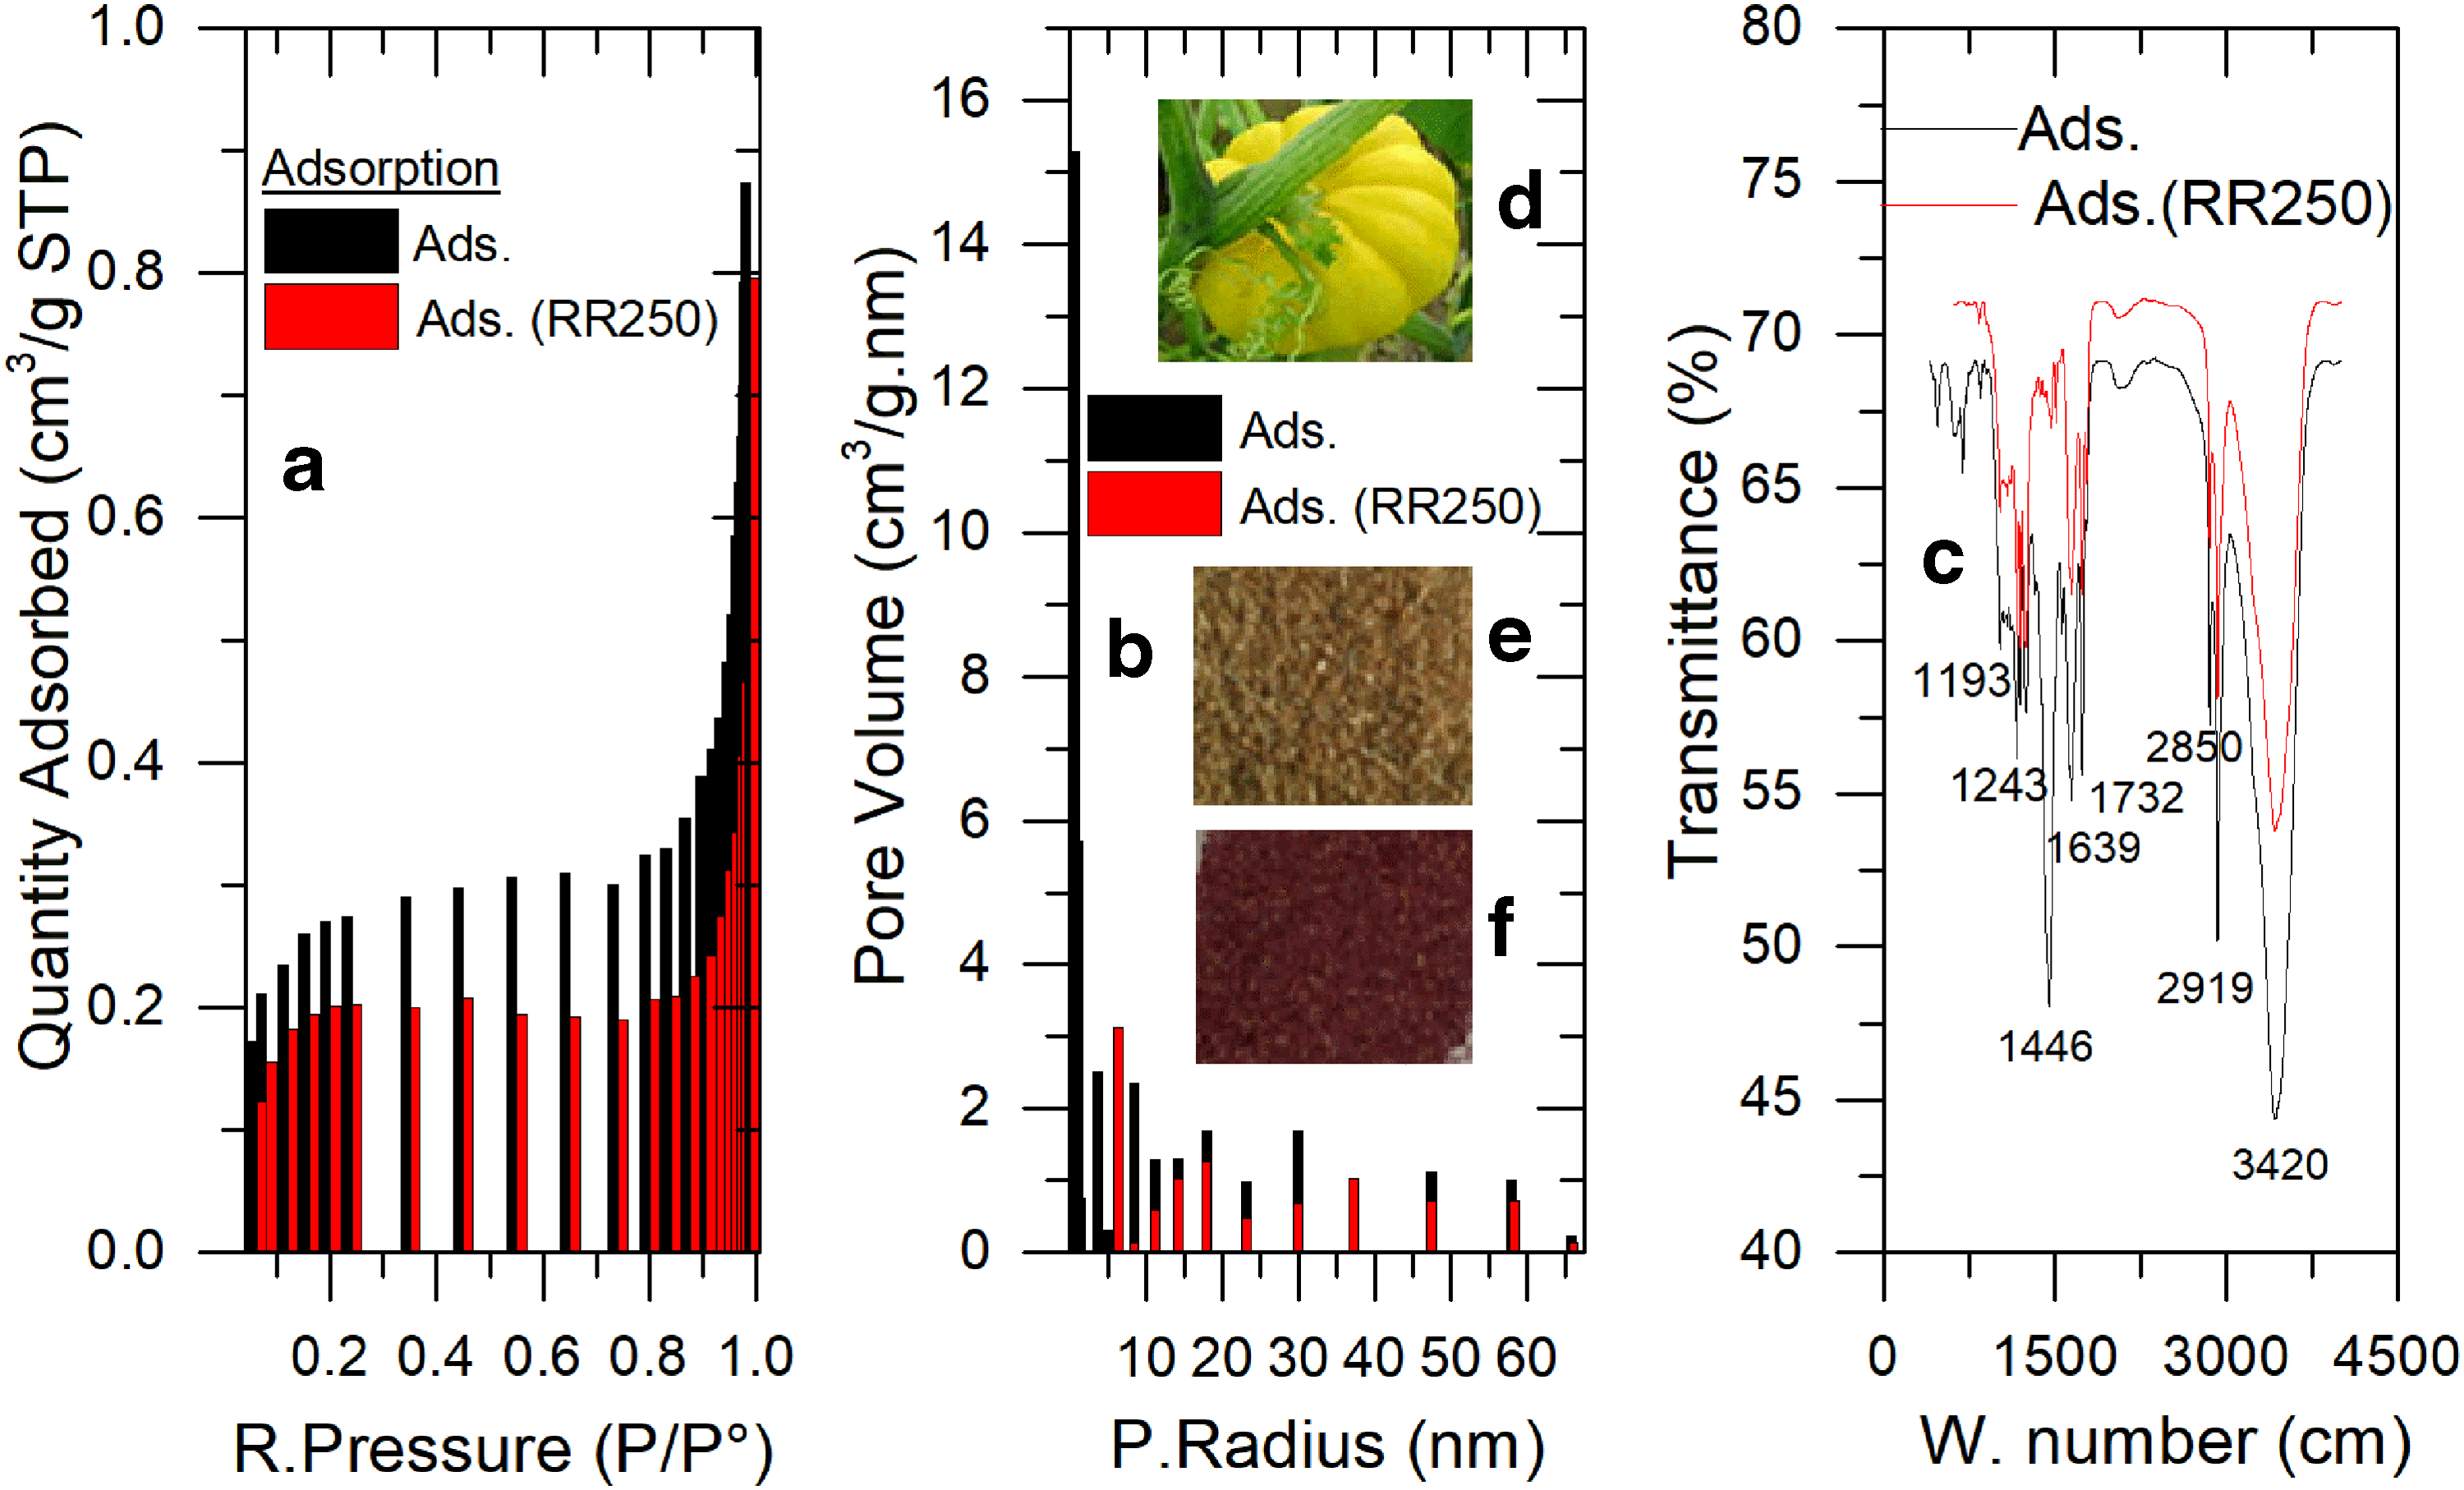
N2 adsorption isotherms
Figure 5(b) shows that the pure and dyed adsorbents' pore distributions in the fixed-bed column were calculated using Density Functional Theory. Figure 5(b) shows that the particles before adsorption contain micro, macro, and mesopores. However, the macropore structures predominantly transferred into mesopore structures after the adsorption. It should be noted that the microporous and mesoporous volumes of the particles decreased after the adsorption, as given in Fig. 5(b), and the microporous volumes of the dyed particles disappeared entirely after the adsorption. BET surface areas of the pure and the dyed adsorbent were determined as 1.06 and 0.73 m2/g.
Figure 5(c) shows the FTIR spectra of C. moschata biomass and the dyed particles having different active sites. At different wavenumbers, the functional groups of the pure particles have a specific absorbance value. As given in Fig. 5(c), considerable shifts were observed on the peaks after adsorption when the wavenumbers ranged from 500 to 1,000. With respect to FTIR spectra, it was thought that chemical and electrostatic attractions occur between the adsorbent and Reactive Red 250. These interactions between Reactive Red 250 and particles modified charges on the pure particles. Thus, the absorption spectra of the active sites on the surface of C. moschata biomass changed, as given in Fig. 5(c).
Figure 5 presents a picture of C. moschata (Fig. 5d), the particles before adsorption (Fig. 5e), and the particles after adsorption (Fig. 5f), respectively. It appears from Fig. 5(f) that the color of the particles had considerably changed after adsorption. Although the surface of the particles before adsorption is brindle, according to Fig. 5(e), its color turns into red after adsorption, as given in Fig. 5(f).
Architecture and Algorithm
ANFIS possesses a reliable knowledge about learning, constructing, and classifying. It has the superiority of the subtraction of fuzzy rules from numerical data. Furthermore, it can regulate the transformation of human intelligence into fuzzy systems. For the sake of simplicity, it is supposed that the fuzzy system has two inputs, x and y, and one output, z. For the first-order Sugeno fuzzy model (Takagi and Sugeno, 1985), in the typical rule set with two fuzzy, if–then rules are as follows:
where pi, qi, and ri are linear parameters in the consequent part of the first-order Sugeno fuzzy model. The architecture of ANFIS consists of five layers, and a brief introduction of the model is given in Fig. 6(a) (Chang and Chang, 2006).

ANFIS architecture for a two-input Sugeno fuzzy model with four rules (Chang and Chang, 2006) and relationship between observed and predicted data related to general modeling (R2 = 0.999 and MSE = 1.5 × 10⁻⁵). MSE, mean squared error.
Supervised learning is used to train the network. The purpose was to train adaptive systems to be able to approximate unknown functions. The model's performance related to mean squared error (MSE) and R2 can be defined by Equations (3) and (4).
where yprd,i, yobs,i, n, and ym parameters are predicted value, observed value, data number, and the average of the experimental values. Under the different experimental conditions, the observed and predicted adsorption capacities obtained from the ANFIS model are given in Table 1.
Observed and Predicted Adsorbent Capacities for Reactive Red 250 Under Different Experimental Conditions
ANFIS, Adaptive Neuro-Fuzzy Inference System; MSE, mean squared error.
The general model from the ANFIS containing all parameters (contact time, Reactive Red 250 concentration, pH, particle size, bed depth, and flow rate) is given in Fig. 6(b).
Conclusion
The particles contained micro, macro, and especially mesopores before the adsorption. However, the particles after the adsorption included predominantly mesoporous structures. The particles' microporous and mesoporous volume decreased after the adsorption, and the microporous volumes of the particles disappeared entirely owing to the adsorption. BET surface areas of pure and dyed adsorbents were determined as 1.06 and 0.73 m2/g, respectively.
At different wave numbers, available groups on the pure particles had a specific absorbance value. The considerable shifts from 500 to 4,000 cm on the peaks were observed after the adsorption process. The color of the particles considerably changed after the adsorption. The particle's surface turned into red after adsorption, whereas the particles' surface before adsorption was brindle.
The highest experimental and theoretical adsorbent capacities for Reactive Red 250 were determined as 8.319 and 8.322 mg/g at pH 2, inlet concentration of 20 mg/L, bed depth of 5 cm, particle size of 0.25–0.5 mm, and flow rate of 8 mL/min, respectively. The particles' zeta potentials at pH 2, 2.5, and 3 in the deionized water were distinct from ones of the dyed particles. The changes in the dyed particles' zeta potentials showed the removal of Reactive Red 250 from the synthetic aqueous solutions.
The model illustrated the breakthrough profiles under different experimental conditions. It correctly predicted the breakthrough profiles during the adsorption process. A correlation was constructed between the observed and the predicted data. From the ANFIS model, R2 and MSE values were determined as 0.999 and 1.5 × 10⁻⁵, respectively. The results summarized that the model predicted the adsorbent capacities with high accuracy.
Footnotes
Author Disclosure Statement
No competing financial interests exist.
Funding Information
No funds were used in this study.