
Abstract
This study presents a novel competitive growth model between Microcystis sp. (cyanobacteria) and Cyclotella meneghiniana (bacillariophyta) as a function of nitrogen and phosphorus concentrations, and dilution rate. The growth model was developed by combining the Droop and the Lotka–Volterra models to make it applicable to highly eutrophic conditions. Following the model development, cyanobacterial growth patterns in a monoxenic culture experiment were simulated, and the factors influencing the suppression of cyanobacterial blooms were discussed. Results from the monoxenic culture experiment simulation showed that a more accurate prediction of growth pattern was provided by the model developed in this study, when compared with our previous model. Specifically, the overestimation of cell densities under high nutrient conditions by the previous model was corrected. The simulation results also revealed that the initial nitrogen and phosphorus concentrations were decisive factors in determining which nutrient was critical to the cyanobacterial growth. It was also discovered that the crucial nutrient (nitrogen or phosphorus) for cyanobacterial growth switched at around an initial nitrogen and phosphorus mass ratio of 11. When the ratio was above 11, phosphorus was observed to be critical for cyanobacterial growth, while nitrogen was more critical when the ratio was below 11. These findings provide an ability to predict which nutrient is more important for cyanobacterial growth, and targeting its management or reduction in a water body can be promising toward the suppression of cyanobacterial blooms.
Introduction
Cyanobacterial blooms in eutrophic lakes can result in many water quality problems (Huang et al., 2012), ranging from cyanotoxin production (Cox et al., 2009) to the alternation of taste and odor of potable water. The blooms occur due to the excessive discharge of nitrogen and phosphorus in water bodies (Paul, 2008). As changes in precipitation patterns are predicted to increase riverine nitrogen loads in the future, eutrophication and cyanobacterial blooms may be further promoted on a global scale (O'neil et al., 2012; Sinha et al., 2017). This will necessitate effective countermeasures to control or suppress cyanobacterial bloom formation, and mitigate its consequences.
Many studies have been published on the suppression of cyanobacterial blooms. Much of these studies can be categorized into two groups. The first group includes studies that investigate the environmental factors influencing the growth of cyanobacteria. These factors include nutrient concentrations, flow rate, light intensity, and temperature, and they have been widely examined to control cyanobacterial growth (Fujimoto et al., 1997; O'neil et al., 2012; Mikawa et al., 2016). The second group includes studies that have developed simulation model for the growth of cyanobacterium and its competitors. To simulate the growth of individual algal species, various growth and nutrient uptake parameters, such as maximum growth rate (μmax) and maximum cell quota (Qmax) need to be determined through culture experiments. However, environmental factors, including nutrients (N and P), flow rate, light intensity, and temperature are usually provided as an arbitrary or a constant value to the model. If an accurate model can be developed using the parameters from culture experiments, the influences of the abovementioned environmental factors on cyanobacterial cell growth can be better studied, and countermeasures to suppress cyanobacterial blooms can be proposed.
The Droop model (Droop, 1973) is one of the empirical models describing algal growth. It relates growth rates to the cell quota of assimilated nutrients. In this model, low nutrient concentrations limit growth rates, and the prediction of algal growth tends to be more accurate only under nutrient-limited conditions. However, high nutrient concentrations maximizing the cell quota of assimilated nutrients cause an improbable increase in algal cells (Sugimoto et al., 2016). Under hypereutrophic conditions with NO3-N concentration of 3 mg-N L−1 and PO4-P concentration of 0.25 mg-P L−1 (Xu et al., 2001), the algal growth rate reaches the maximum at the beginning of cultivation, and keeps the maximum until all nutrients are exhausted.
In a previous study published by our research group, Mikawa et al. (2017) developed a competitive growth model between Microcystis aeruginosa (strain UTEX LB 2061) and Cyclotella sp. (strain CCAP 1070/4) as a function of nutrient (nitrogen and phosphorus) concentrations and daily renewal rate (d) based on the Droop model. Using the developed model, Mikawa et al. (2017) attempted to elucidate the mechanisms of cyanobacterial bloom suppression in Lake Tega, Japan, a shallow eutrophic lake with significant water quality issues. The chemical oxygen demand (COD), biochemical oxygen demand (BOD), total nitrogen (TN), and total phosphorus (TP) concentrations of the lake water were in the range of 18–25, 10–17, 4.0–5.3, and 0.33–0.21 mg/L, respectively, during 1995 to 1999 (Chiba Prefectural Government, 2019). However, since large volumes of water were conveyed from the Tone River to Lake Tega in the year 2000, the COD, BOD, TN, and TP concentrations decreased to 7.6–9.2 mg/L, 5.3–6.1 mg/L (2014 and 2015), 2.1–2.2 mg/L, and 0.13–0.16 mg/L, respectively, between 2014 and 2018. The model by Mikawa et al. (2017) could predict the growths of M. aeruginosa and Cyclotella sp. well, however, it overestimated cells under high nutrient concentrations, due to the shortcoming of the Droop model.
We hypothesized that this overestimation of algal cell density under high nutrient conditions could be corrected by introducing an additional term into the competitive growth model that limits the growth rate. The Lotka–Volterra model (Lotka, 1925; Volterra, 1928) is a widely known model used for the simulation of multispecies growth competition. In this model, algal growth is limited, while the coexistent species reach the maximum cell density (carrying capacity). Therefore, the incorporation of the Lotka–Volterra model into the Droop model could resolve the overestimation of cell density in highly eutrophic conditions.
To test the hypothesis, this study developed a competitive growth model by integrating the Lotka–Volterra model with the model developed by Mikawa et al. (2017) to predict algal cell density under hypereutrophic conditions. The accuracy of the new model prediction was compared with the previous model. Cyanobacterial growth patterns of the monoxenic culture experiment between Microcystis and Cyclotella were simulated using the integrated model, and the environmental factors affecting cyanobacterial blooms were discussed.
Experimental Methods
Test algae and culture conditions
The dominant algae, defined as the algal species with the largest cell density among a certain taxonomic group, in Lake Tega changed from M. aeruginosa to Cyclotella meneghiniana after the dilution of lake water (Amano et al., 2012; Chujo et al., 2019). We isolated both these algal species from Lake Tega using the capillary pipette method, and checked the contamination by other algal species every 2 or 3 days using a microscope. Consequently, we obtained the single-species culture of Microcystis sp. and C. meneghiniana and used them as test algae in this study. Because the cultures were not axenic, we inoculated both species into a fresh medium every 7–10 days to minimize the growth of bacteria. A clean bench was used to reduce any bacterial contamination when the inoculation and/or sampling was conducted.
For the two algal cultures, Wright's cryptophyte (WC) medium (Guillard and Lorenzen, 1974) at pH 8.0 was used as it can cultivate both diatoms and cyanobacteria (Andersen et al., 2005). The initial nitrate-nitrogen (N) and phosphate-phosphorus (P) concentrations in the medium were adjusted to 14 mg-N/L and 1.55 mg-P/L using sodium nitrate (NaNO3) and dipotassium hydrogen phosphate (K2HPO4), respectively. Sodium hydrogen carbonate (NaHCO3) was added as a carbon source. The silicate-silicon concentration (as sodium metasilicate [Na2SiO3]) in the media was altered to be the same as in the Tone River water (11 mg/L). Subcultures of Microcystis sp. and C. meneghiniana were grown in 100 mL WC medium in a 300-mL Erlenmeyer flask, and both cultured species were inoculated to fresh medium every 2 or 3 weeks. Cultivation was conducted at 25°C and 135 μmol photons/m2/s with cool-white fluorescent light, and a 14-h light/10-h dark cycle. All media used were sterilized by autoclaving at 121°C for 20 min.
Growth characteristics of Microcystis sp. and C. meneghiniana
Monoculture experiments were conducted to elucidate growth characteristics, and obtain nutrient uptake and growth parameters of Microcystis sp. and C. meneghiniana. Before the monoculture experiment, each species was precultured to deplete intracellular N or P, so they would not grow using intracellular nutrients under N- or P-limited conditions. Both species were separately inoculated in 100 mL of N- or P-free WC media in 300-mL Erlenmeyer flasks to give an initial cell density of 1.0 × 10⁴ cells/mL. The preculture experiment was conducted for 1 week, during which the duration did not affect the growth of Microcystis sp. and C. meneghiniana.
For the monoculture experiments, precultured Microcystis sp. and C. meneghiniana were separately inoculated in 100 mL of WC media, and the initial cell density was adjusted to 1.0 × 10³ or 1.0 × 10⁴ cells/mL. The N concentration of WC media was adjusted to 0.01, 0.05, 0.1, 0.5, 1.0, and 2.5 mg/L, while the P concentrations were 0.001, 0.01, 0.05, 0.1, 0.5, and 1.55 mg/L. Sodium hydroxide (NaOH) and potassium hydroxide (KOH) were added to the media to compensate for the deficient sodium and potassium amount caused by changing N and P concentrations in the original WC medium.
The cell density and N concentration in the N-varied media were measured at day 0, 2, 4, 6, and 8 for Microcystis sp., and at day 0, 1, 2, 3, and 4 (N = 0.01, 0.05, 0.1, and 0.5 mg/L) or day 0, 2, 3, and 6 (N = 1.0 and 2.5 mg/L) for C. meneghiniana. On the other hand, when the P concentration in the media was changed, the measurement of the cell density and P concentration was performed at day 0, 2, 7, 10, 13, and 16 (P = 0.01 mg/L) or day 0, 1, 2, 3, 5, 7, 8, 10, and 12 (P = 0.1, 0.5, and 1.55 mg/L) for Microcystis sp. As for C. meneghiniana, these measurements were conducted on day 0, 1, 2, 3, 4, and 5 (P = 0.001 and 0.01 mg/L) or day 0, 1, 2, 5, 7, and 8 (P = 0.05, 0.5, and 1.55 mg/L). The duration of the cultivation for both species was sufficient to achieve logarithmic growth.
To elucidate the carrying capacity (defined below), both species precultured in N- and P-free media were separately inoculated in the original WC medium with the initial cell density of 1.0 × 10⁴ cells/mL. The cell density was measured every 3–4 days, and the carrying capacity was determined by their maximum cell densities.
Growth characteristics and nutrient uptake parameters of Microcystis sp. and C. meneghiniana were obtained from the measured cell densities and nutrient concentrations using Equations (1)–(11). Growth rates (μ, day−1) were calculated from the change in cell densities (C, cells/mL) over time (t, day) as shown in Equation (1).
The Monod equation [Eq. (2)] was used to calculate the maximum specific growth rate (μmax, day−1) and the half-saturation constant (Kμ, mg/L).
where S (mg/L) is the nutrient concentration.
The cell quota of assimilated nutrients (Q, pg/cell) was determined by the quotient of change in nutrient concentrations and C.
where S0 (mg/L) is the initial nutrient concentration.
The minimum cell quota of assimilated nutrients (Qmin, pg/cell) and the value of μ when Q is assumed to be infinite (μ′max, day−1) were calculated using the Droop equation.
The maximum cell quota of assimilated nutrients (Qmax, pg/cell) was obtained by the following equation (Morel, 1987).
The nutrient uptake rate (ρ, pg/[cell·day]) can be estimated as ΔS divided by C·Δt.
The maximum nutrient uptake rate (ρmax, pg/[cell·day]) and the half-saturation constant for nutrient uptake (Kρ, mg/L) were calculated using the Michaelis–Menten equation.
Using Equation (7), ρmaxhi and Kρhi were calculated by the ρ and S values at the beginning of cultivation, while ρmaxlo and Kρlo were estimated from the data when the growth rate was maximum.
The interspecific competition rate (α) was calculated using the Lotka–Volterra competition equations.
where KA (cells/mL) and KB (cells/mL) are the carrying capacity of Microcystis sp. and C. meneghiniana, respectively, which indicates the maximum cell number of each species in a flask. These parameters were determined through monoculture experiments. CA′ (cells/mL) and CB′ (cells/mL) are the cell densities of Microcystis sp. and C. meneghiniana, respectively, when the cell density of Microcystis sp. reached saturation in competitive culture, and CA′′ (cells/mL) and CB′′ (cells/mL) are the same as CA′ and CB′ when the cell density of C. meneghiniana reached saturation. The interspecific competition rates (αAB, αBA) represent the effect of cell density of C. meneghiniana on Microcystis sp., and vice versa.
Growth competition between Microcystis sp. and C. meneghiniana
To examine the effects of the environmental factors on competitive growth patterns and to validate the competitive growth model, competitive culture experiments were performed under various N, P concentrations, and dilution rates (Table 1). Each experiment attempted to replicate the environmental conditions in Lake Tega. Both precultured species were inoculated together in the same medium, and the initial cell densities of Microcystis sp. and C. meneghiniana were adjusted to 1.0 × 10⁴ and 3.96 × 10² cells/mL, respectively. These cell densities were equivalent to the cell volume of 9.31 × 104 μm3/mL. To reproduce the inflow and outflow in Lake Tega, an aliquot of the medium was removed, as soon an equal volume of fresh medium was added once a day. Every 1–6 days, the cell density and nutrient concentrations were measured.
Culture Conditions for the Competitive Culture Experiments
To obtain the interspecific competition rate (α), both precultured species were added together into an original WC medium. The initial cell density was 1.0 × 10⁴ cells/mL each, and it was measured every 2–4 days.
Measurements and statistical analyses
For the measurement of cell density, an appropriately diluted sample was added into a plankton-counting plate (MPC-200; Matsunami Glass Industry, Japan), and the number of cells was directly counted using an optical microscope (ECLIPSE E100; Nikon, Japan).
N and P concentrations were measured using an ion chromatography (ICS-1100; Nippon Dionex, Japan) and the molybdenum blue method (Japanese Standard Association, 2016), respectively. The solution pH was monitored by a pH meter (D-51; Horiba, Japan).
Competitive growth model for high nutrient concentrations
A competitive growth model for high nutrient concentrations was developed using a previous model by Mikawa et al. (2017). The growth rate term of the previous model was based on the Droop equation. The accuracy of this model decreased under hypereutrophic or extremely hypereutrophic conditions, because the growth rate values were close to μmax for longer periods of time, resulting in excessive cell densities. To improve the accuracy of the model, the growth rate term was limited by introducing the carrying capacity term (Table 2). In the previous model, the relationship between the mass ratio of external N to P concentration (N:P ratio) and the mass ratio of the minimum cell quota of assimilated N to P (the optimal N:P ratio) was applied to determine the limiting nutrient for both species. However, the Droop model shows that μ does not depend on dissolved nutrients, but on the cell quota of assimilated nutrients. Therefore, the relationship between the mass ratio of cell quota of assimilated N to P and the optimal N:P ratio was used for the determination of the limiting nutrient in the present study.

Morel (1987) indicates that the maximum nutrient uptake rate depends on the intracellular nutrient contents. Therefore, the terms of ρmax and Kρ in the competitive growth model are expressed as below.
The model equations were calculated through a fourth-order form of the Runge–Kutta method with a time step of Δt = 0.01 day, using Microsoft Excel. Furthermore, to investigate the accuracy of the competitive growth pattern prediction, both species growth curves were simulated under the same conditions as shown in Table 1. After the model accuracy verification, the growth patterns of Microcystis sp. under various nutrient concentrations at d = 5% were simulated, and effective measures for the control of Microcystis sp. (cyanobacterial blooms) were discussed.
Results
Growth curves of Microcystis sp. and C. meneghiniana under various N and P concentrations
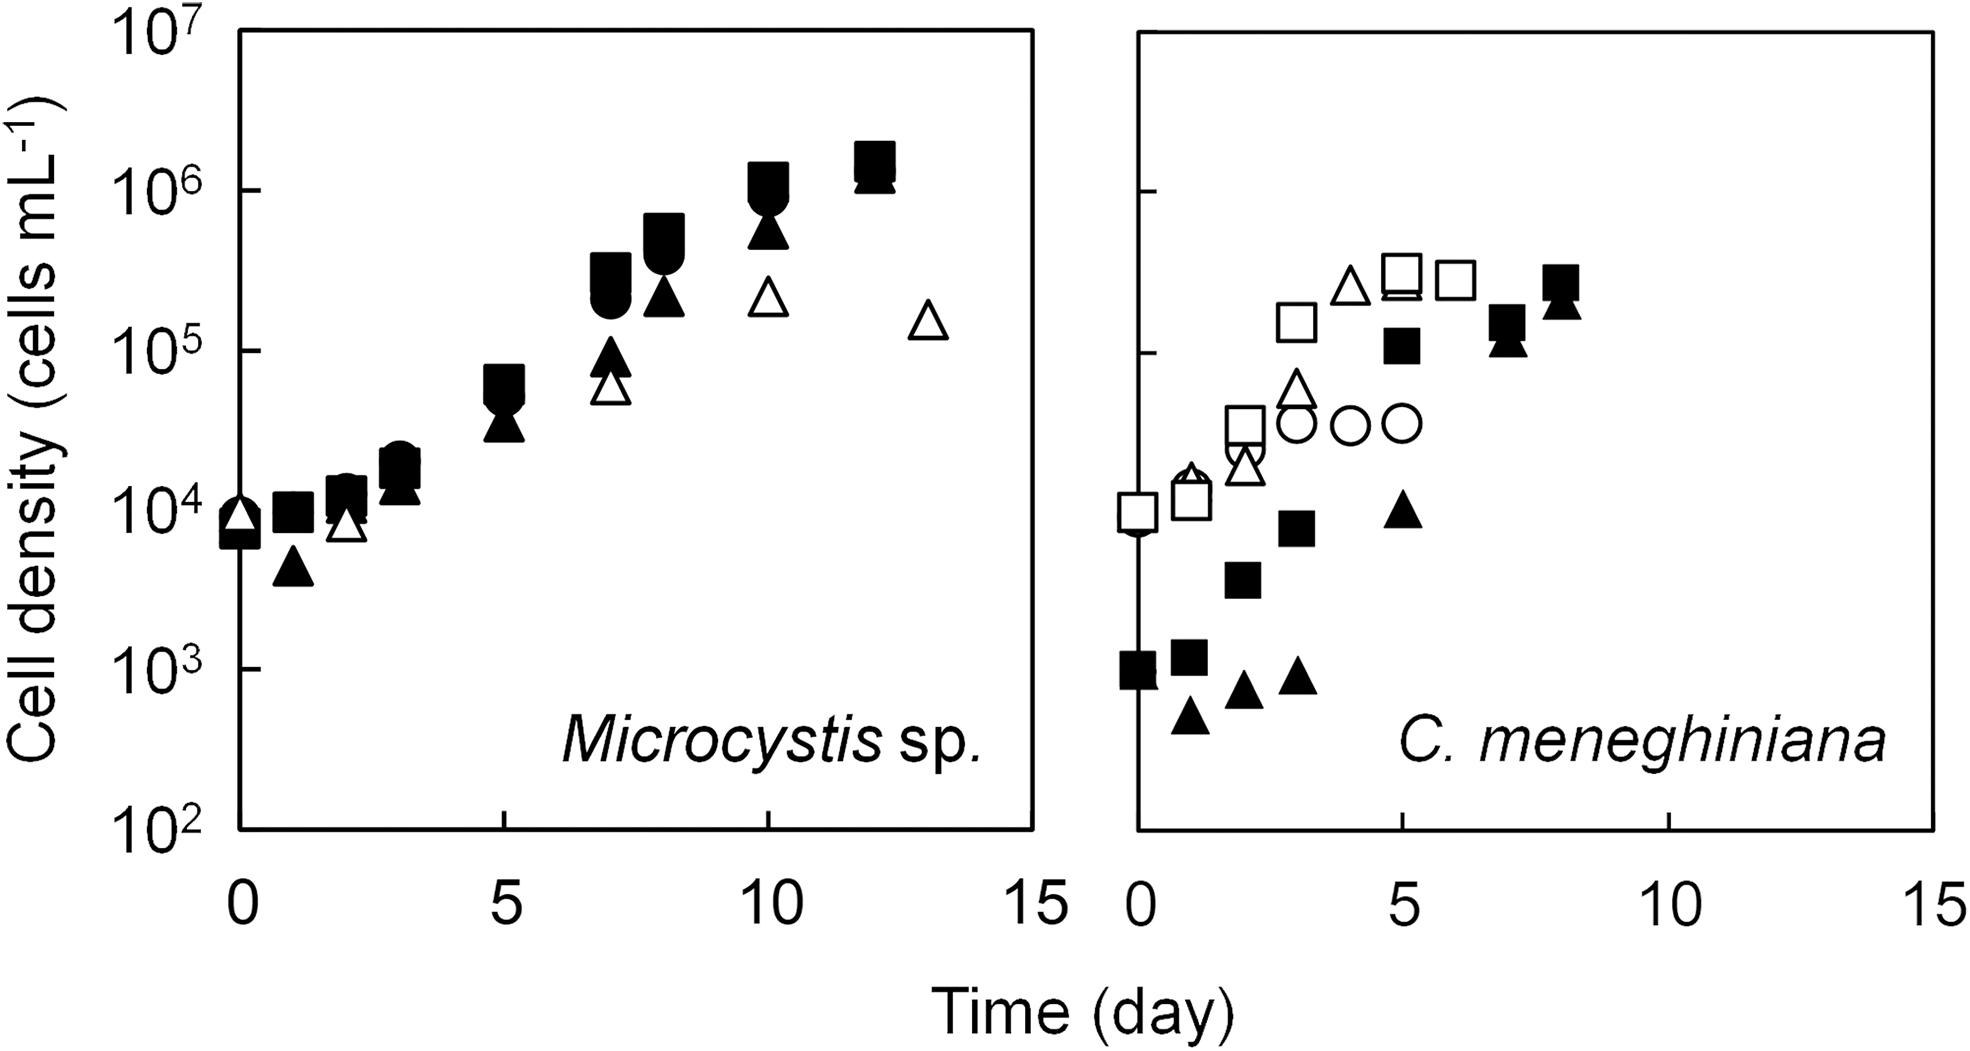
Growth curves of Microcystis sp. and C. meneghiniana under various N concentrations are shown in Fig. 1. Under all N concentrations, the exponential growth phase of Microcystis sp. and C. meneghiniana lasted from day 2 to 6 and from day 0 to 3, respectively. At the end of the exponential growth phase, the cell density of Microcystis sp. and C. meneghiniana ranged from 1.0 × 10⁵ to 3.3 × 10⁵ cells/mL and from 1.3 × 10⁵ to 2.7 × 10⁵ cells/mL, respectively. Using Equation (1), growth rates for both species were obtained. The highest and lowest growth rates of Microcystis sp. were 0.62/day at 0.5 mg-N/L and 0.38/day at 0.05 mg-N/L, while those for C. meneghiniana were calculated to be 1.15/day at 0.5 mg-N/L and 0.89/day at 0.01 mg-N/L.

Growth curves of Microcystis sp. and Cyclotella meneghiniana under various N concentrations. Symbols: ○, Initial N concentration (N0) = 0.01 mg-N/L; ▵ N0 = 0.05 mg-N/L; □ N0 = 0.1 mg-N/L; • N0 = 0.5 mg-N/L; ▴ N0 = 1.0 mg-N/L; ▪ N0 = 2.5 mg-N/L.
Growth curves for both species under various P concentrations are presented in Fig. 2. The population of Microcystis sp. and C. meneghiniana showed exponential growth phase from day 5 to 10 and from day 1 to 4, respectively, under all P concentrations. The cell density of Microcystis sp. and C. meneghiniana at the end of the exponential growth phase ranged from 2.2 × 10⁵ to 1.2 × 10⁶ cells/mL and from 3.6 × 10⁴ to 2.6 × 10⁵ cells/mL, respectively. The growth rate of Microcystis sp. reached the highest value of 0.70/day at 1.55 mg-P/L, and the lowest value of 0.40/day at 0.01 mg-P/L. On the other hand, C. meneghiniana exhibited the highest growth rate of 1.30/day at 0.01 mg-P/L, and the lowest as 0.46/day at 0.001 mg-P/L. After the exponential growth phase, the changes in cell density of both species almost coincided with the change observed under various N concentrations.
Growth curves of Microcystis sp. and Cyclotella meneghiniana under various P concentrations. Symbols: ○Initial P concentration (P0) = 0.001 mg-P/L; ▵ P0 = 0.01 mg-P/L; □ P0 = 0.05 mg-P/L; • P0 = 0.1 mg-P/L; ▴ P0 = 0.5 mg-P/L; ▪ P0 = 1.55 mg-P/L.
Growth and nutrient uptake parameters of Microcystis sp. and C. meneghiniana
Growth and uptake parameters of Microcystis sp. and C. meneghiniana for N were calculated in the same way as a previous study (Mikawa et al., 2016) and summarized in Table 3. The μmax value of C. meneghiniana was twice of Microcystis sp., but the Kμ value was one-twentieth of Microcystis sp. The values of μ′max and Qmin for C. meneghiniana were higher than those of Microcystis sp., especially the Qmax value was 21 times greater than Microcystis sp. Higher values of N uptake parameters were also obtained for C. meneghiniana, and the ρmaxhi, ρmaxlo, Kρhi, and Kρlo values were ca. 2–9 times as high as those for Microcystis sp.
Growth Characteristics of Microcystis sp. and Cyclotella meneghiniana for Nitrogen and Phosphorus
Growth and P uptake parameters of Microcystis sp. and C. meneghiniana under various P concentrations are also present in Table 3. Their trends for both species were similar to those observed under various N concentrations. The value of Kμ for C. meneghiniana (1.21 × 10⁻⁴ mg-P/L) was much smaller than Microcystis sp. (0.021 mg-P/L), while all P uptake parameter values for C. meneghiniana were 3–61 times higher than Microcystis sp.
Carrying capacities of both algae were obtained by the maximum cell density of the algae under nutrient-rich conditions. Cell densities of Microcystis sp. reached the peak at day 18, and the KA value was determined to be 9.13 × 10⁶ cells/mL. The peak of C. meneghiniana cell densities (KB) was 1.8 × 10⁶ cells/mL observed on day 21.
Competitive growth patterns and competitive growth prediction
Competitive growth patterns for Microcystis sp. and C. meneghiniana in the competitive culture experiment and simulated growth curves of both algae are shown in Figs. 3 and 4. After the cell volumes of both species reached saturation, the growth of C. meneghiniana was superior at d = 5% conditions. But under the conditions of d = 15%, the cell volumes of Microcystis sp. approached or surpassed those of C. meneghiniana. Although the experimental and simulated values were largely different in low P concentration conditions, they almost coincided in other conditions. Compared with the simulated value by the previous model (Mikawa et al., 2017), the improved model avoided the overestimations of Microcystis sp. growth in Exp. C, D, and H, and of C. meneghiniana growth in Exp. C and D.
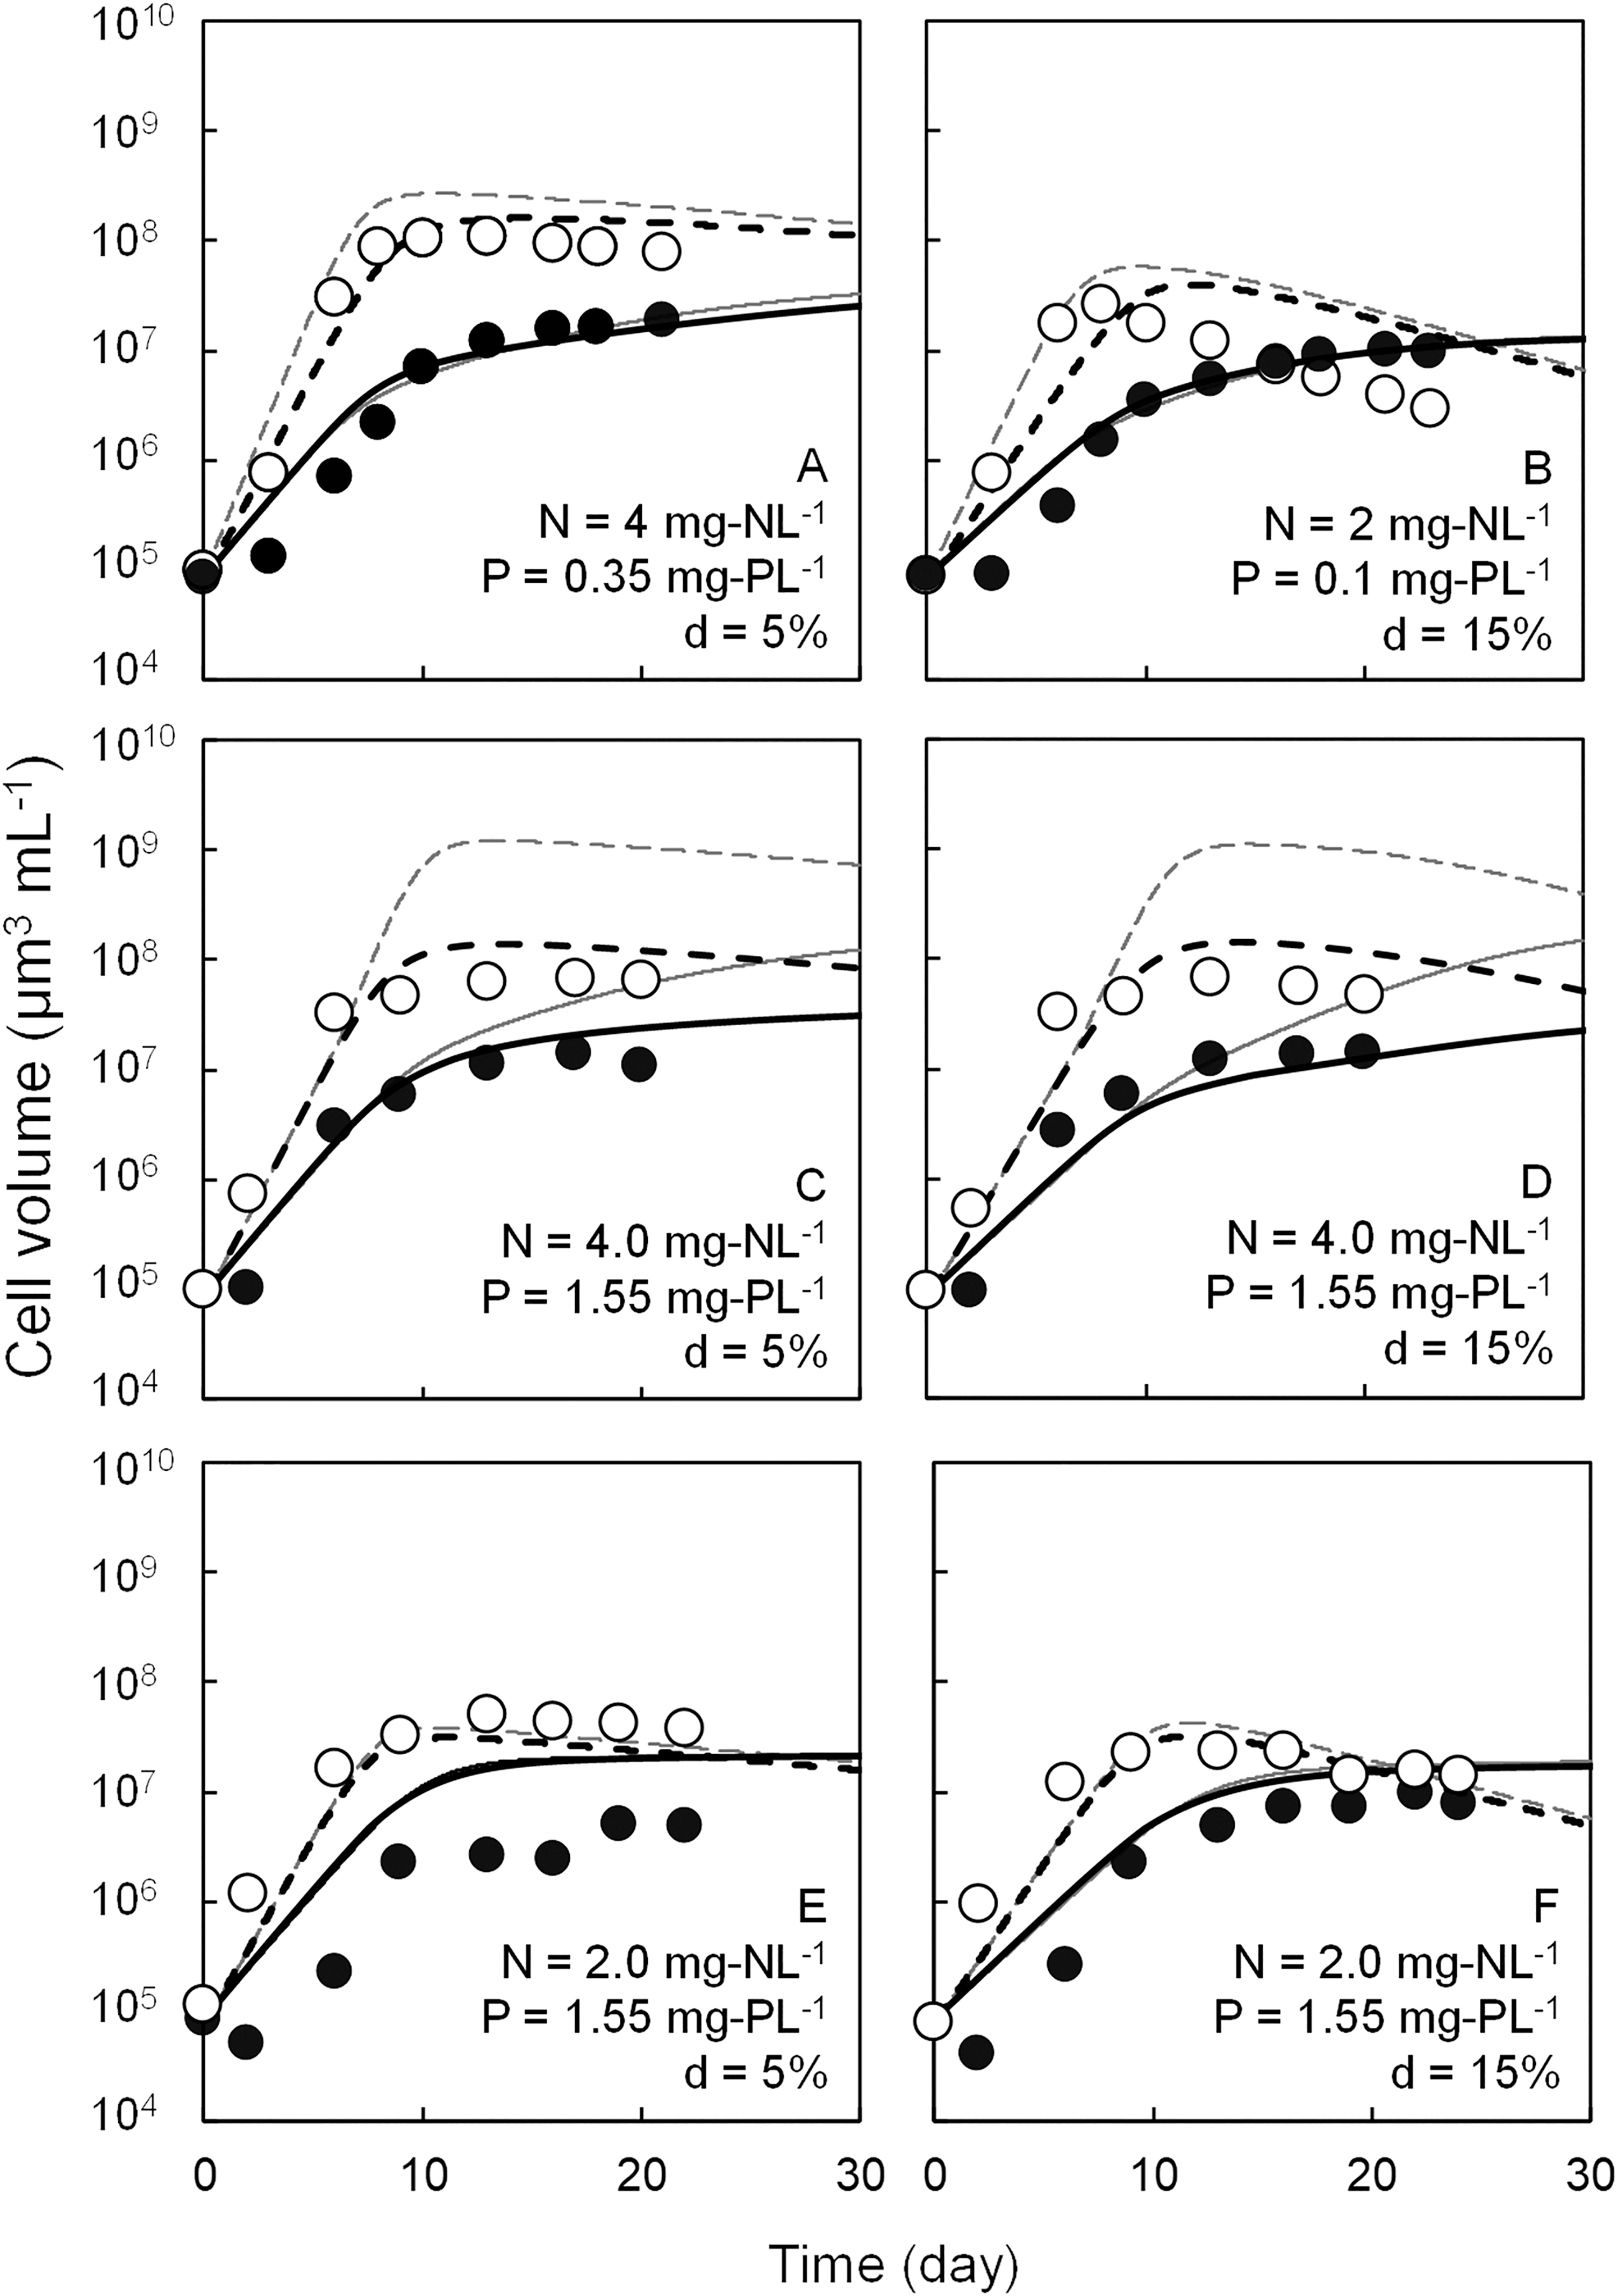
Simulated competitive growth patterns of Microcystis sp. and Cyclotella meneghiniana under various conditions and experimental cell volume of • Microcystis sp. and ○ C. meneghiniana. Gray solid and gray dashed lines indicate the simulated cell volume of Microcystis sp. and C. meneghiniana using the previous modeling. Black solid and black dashed lines indicate the simulated cell volume of Microcystis sp. and C. meneghiniana using the present modeling.
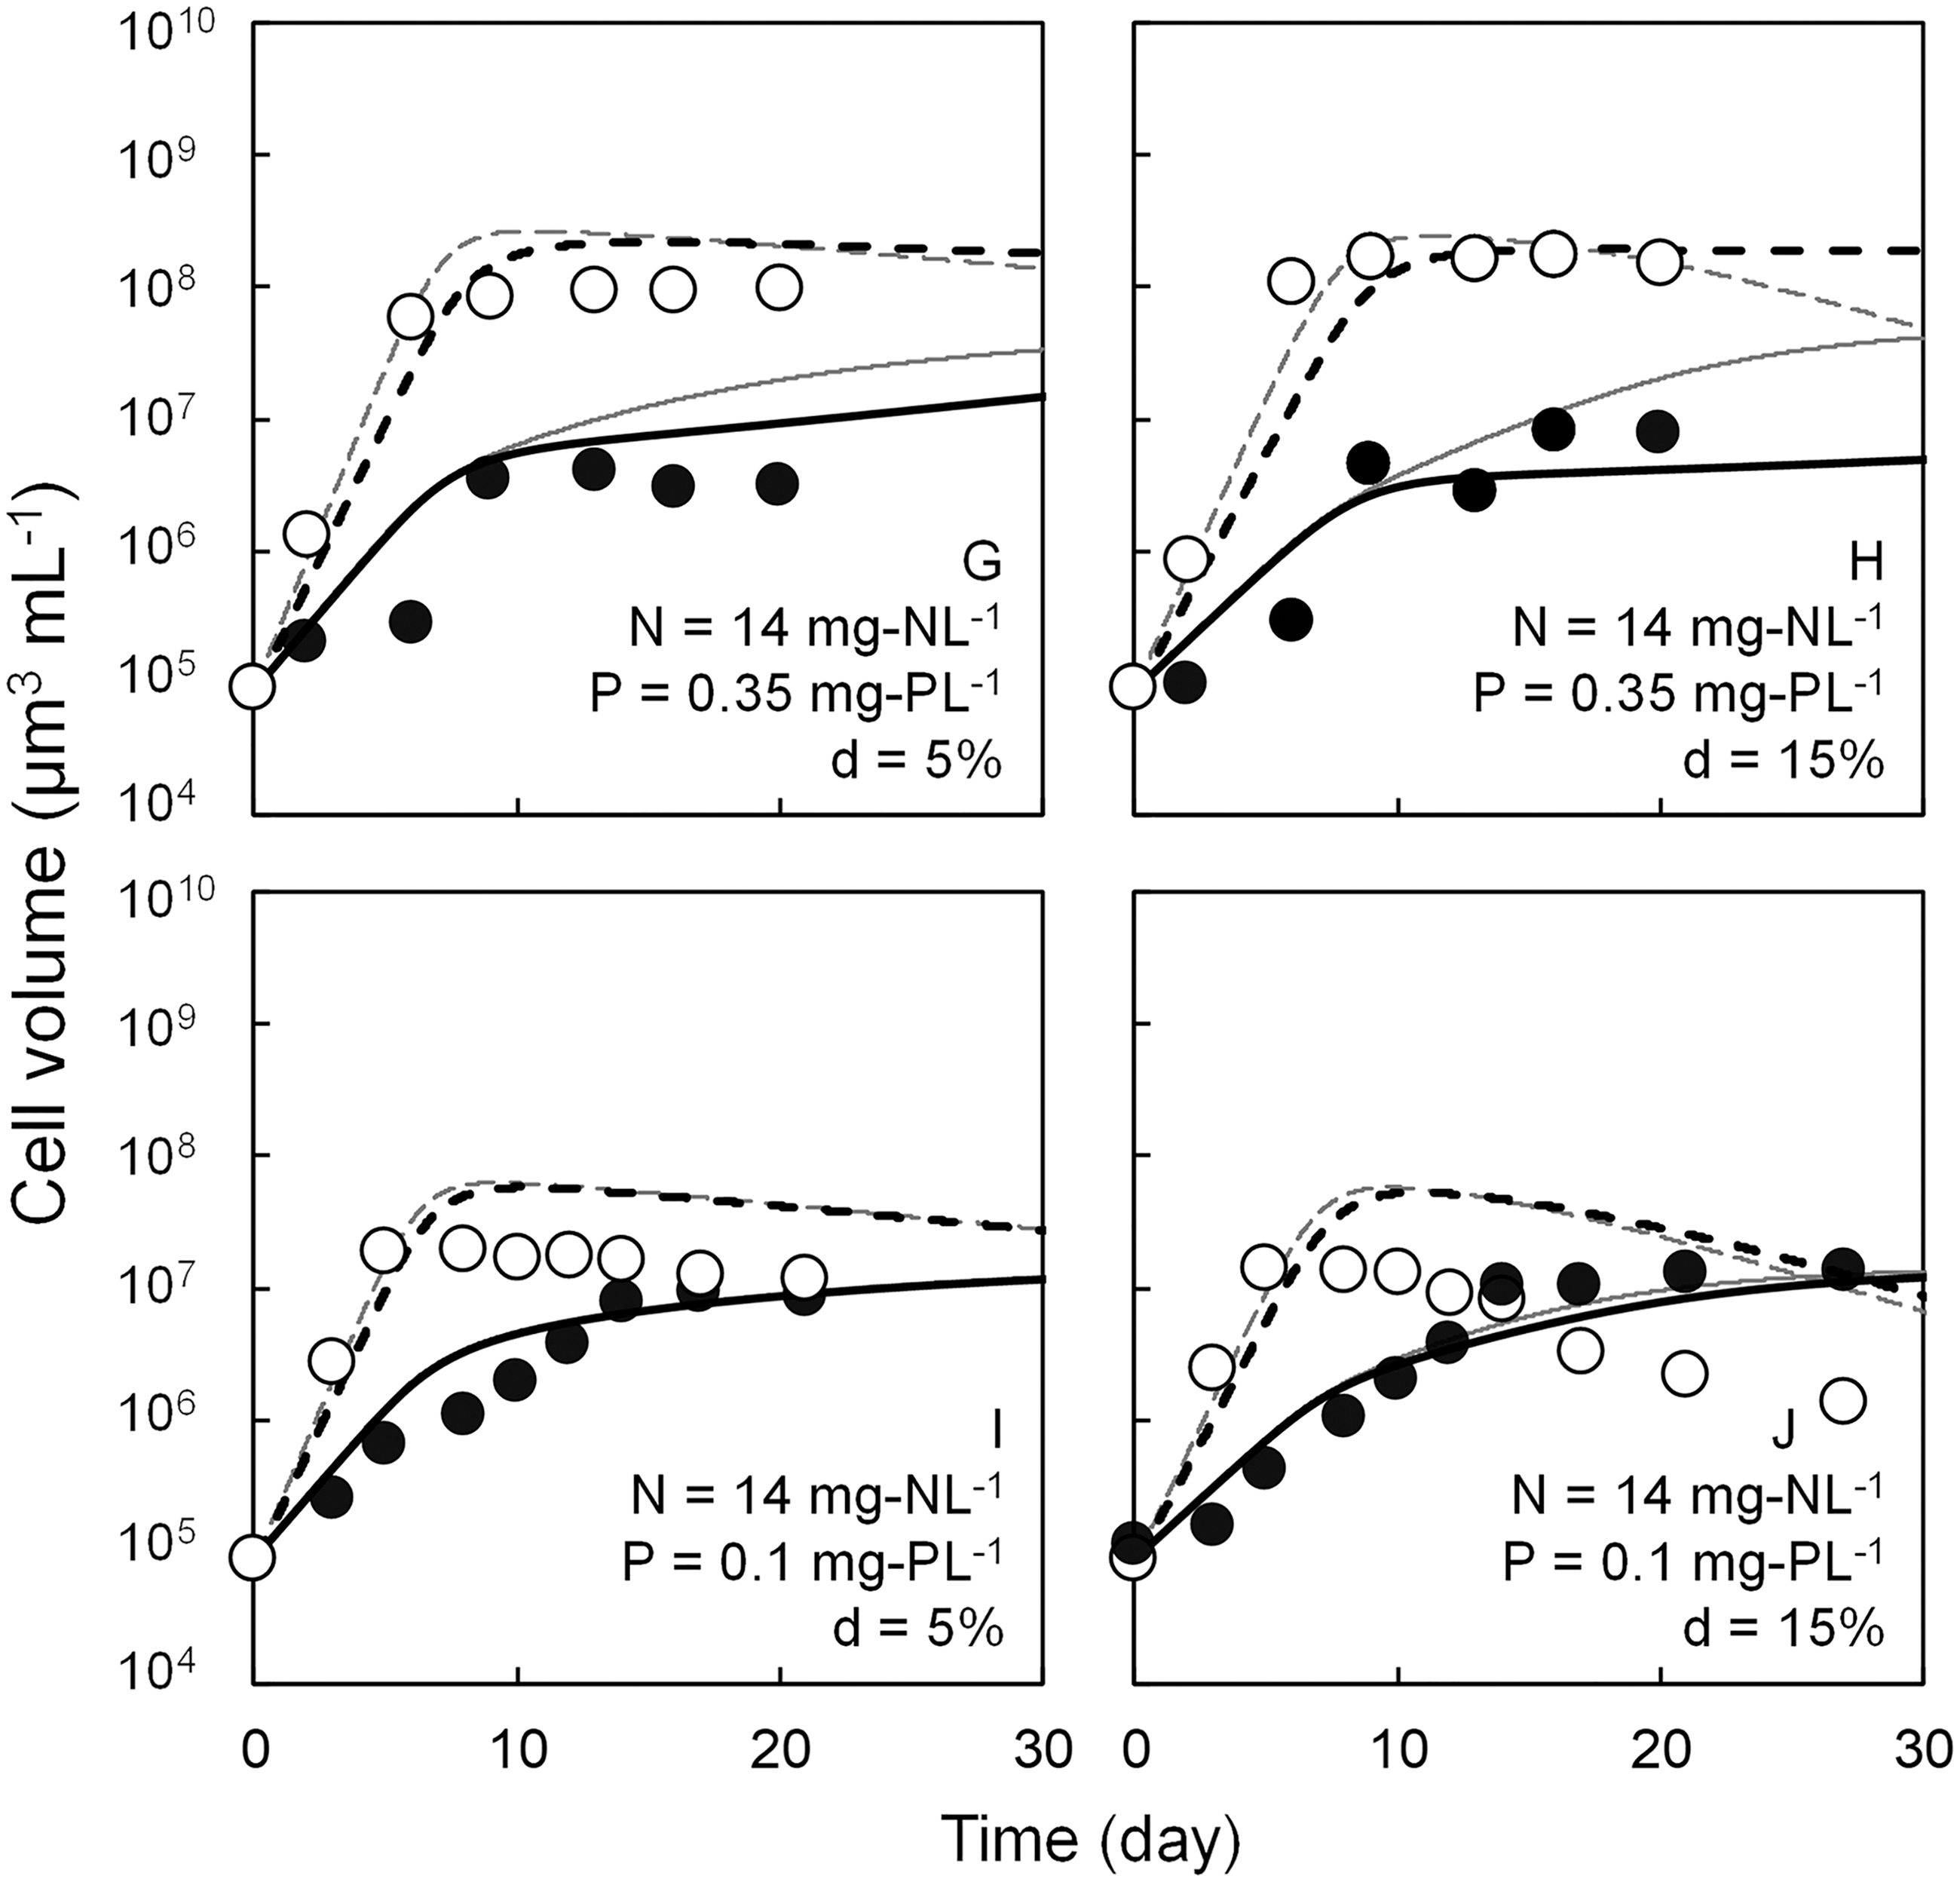
Simulated competitive growth patterns of Microcystis sp. and Cyclotella meneghiniana under various conditions and experimental cell volume of ● Microcystis sp. and ○ C. meneghiniana. Gray solid and gray dashed lines indicate the simulated cell volume of Microcystis sp. and C. meneghiniana using the previous modeling. Black solid and black dashed lines indicate the simulated cell volume of Microcystis sp. and C. meneghiniana using the present modeling.
Interspecific competition rates of both algae were obtained using the monoxenic culture and original WC media. The peak Microcystis sp. cell density was observed at day 21, and the cell densities of Microcystis sp. and C. meneghiniana were measured as 6.7 × 10⁶ and 4.1 × 10⁵ cells/mL, respectively. Therefore, the αAB value was found to be 6.35. On the other hand, the cell density of C. meneghiniana reached its maximum value of 6.2 × 10⁵ cells/mL at day 14, and the αBA value was calculated to be 0.38, because the cell density of Microcystis sp. was 3.1 × 10⁶ cells/mL at the same day.
Prediction of Microcystis sp. growth as functions of nutrient concentration
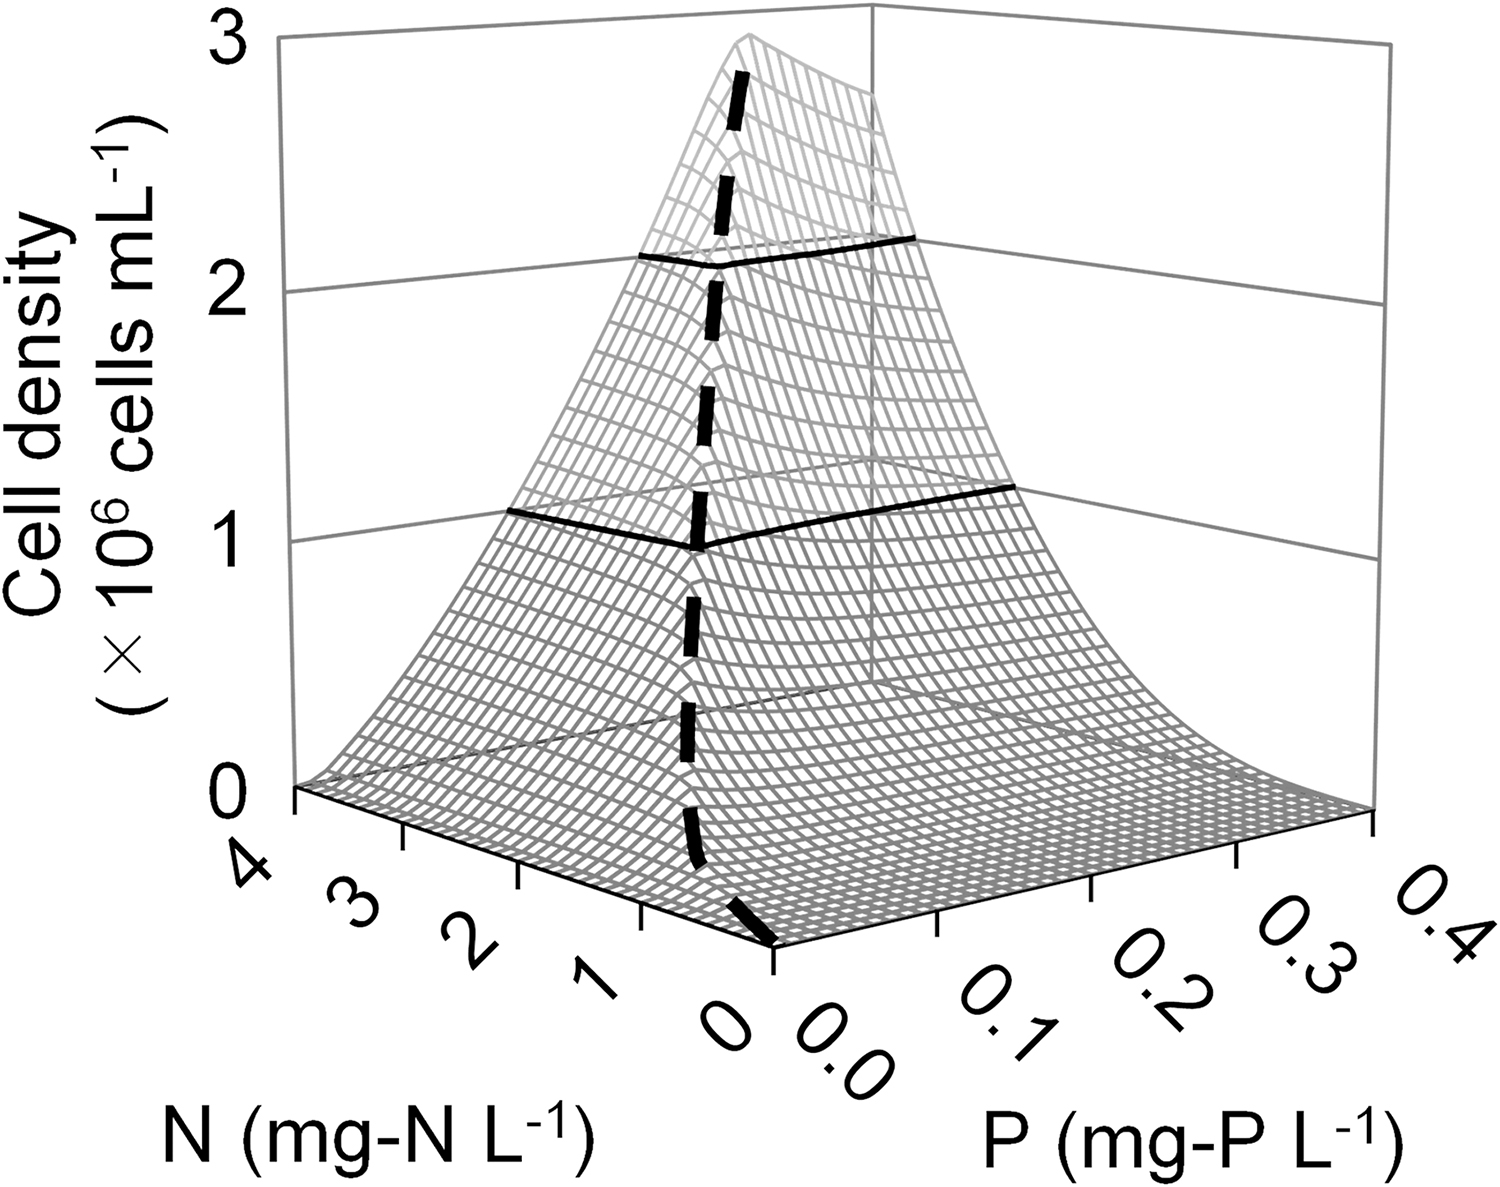
Using the competitive growth model developed in this study, the Microcystis sp. cell densities at day 30 under various N and P concentrations and 5% dilution rate were predicted, and the result is summarized in Fig. 5. It was observed that when the N:P mass ratio is smaller than around 11, the cell density of Microcystis sp. increased proportionally to N concentration. A similar proportional increase in cell densities to P concentration was also observed when the N:P ratio was larger than 11. Above 2.5 mg-N/L and 0.25 mg-P/L, the increase in Microcystis sp. cell density was moderate, and cell density did not increase despite the increase in N and P concentrations. Figure 6 presents the contour figure for C. meneghiniana cell density in the same way as Fig. 5, and the figure had a peak at the N:P ratio of 13.
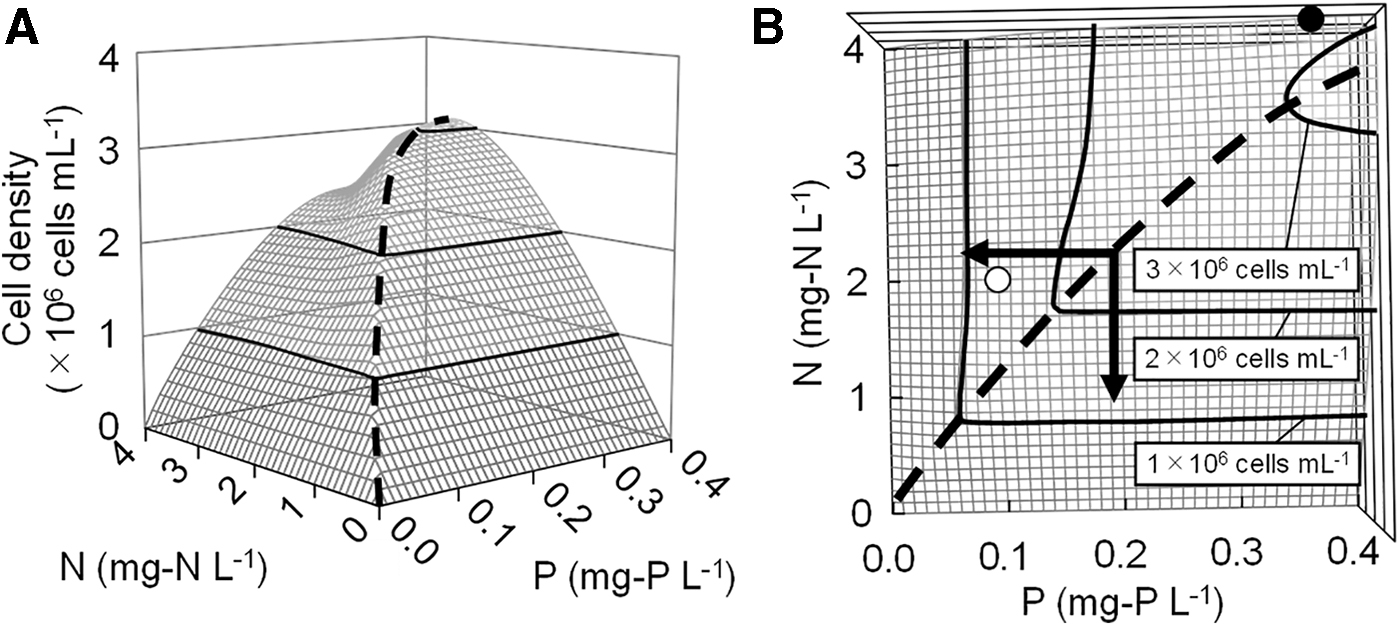
Contour figures of simulated Microcystis sp. cell density at day 30 under various N and P concentrations at
A contour figure of simulated Cyclotella meneghiniana cell density at day 30 under various N and P concentrations at bird's-eye view. A dashed line indicates the peak of cell density.
Discussion
As for the growth characteristics under limited N condition (Table 3), the μmax value of 0.587/day for Microcystis sp. was similar to that of 0.54/day for M. aeruginosa reported by Kim et al. (2007). However, a higher μmax value (1.13/day) for C. meneghiniana was obtained, compared with the value (0.86/day) reported by Shafik et al. (1997). The Kμ value for C. meneghiniana was three orders of magnitude lower in this study (Kμ = 4.48 × 10⁻⁴ mg-N/L) than Kμ = 0.0982 mg-N/L reported by Shafik et al. (1997). Table 3 also shows that μmax and Kμ for Microcystis sp. observed in the P experiment were comparable to those of M. aeruginosa (μmax = 0.46–0.67/day; Kμ = 0.024–0.031 mg-P/L) in other studies (Fujimoto et al., 1997; Baldia et al., 2007; Islam et al., 2012; Blottière et al., 2014). Baldia et al. (2007) provided the minimum P cell quota value of 0.060 pg/cell, which was close to 0.050 pg/cell obtained in this study. Moreover, other studies (Graham et al., 2012; Yang et al., 2016) investigating the carrying capacities of M. aeruginosa (K = 1.46 × 10⁷ cells/mL) and C. meneghiniana (K = 2.31 × 10⁶ cells/mL) found values comparable to those obtained in this study (KA = 9.13 × 10⁶ cells/mL; KB = 1.80 × 10⁶ cells/mL). The maximum growth rates (μmax) of C. meneghiniana for N and P were greater, whereas Kμ for both nutrients were smaller than those of Microcystis sp. This indicates that C. meneghiniana would grow more advantageously despite nutrient concentrations, if nutrient concentrations are the only factor influencing growth.
There were also large differences in ρmaxhi and Kρhi between C. meneghiniana and Microcystis sp. The values of C. meneghiniana were ∼18 and 61 times greater than those (3.12 pg/[cell·day] and 0.02 mg/L) of Microcystis sp. From these results, it is considered that the C. meneghiniana in Lake Tega would prefer water with high P concentrations. The difference in their growth potentials was reflected in the outcomes of the competition experiments, where C. meneghiniana growth reached the stationary phase earlier. This trend would be due to the greater ρmax, μmax, and Kρ, as well as the smaller carrying capacity.
The cell densities of both species at saturation were significantly lower (p < 0.05) in Exp. B (condition after the suppression of cyanobacterial blooms in Lake Tega) when compared with Exp. A (condition before the suppression of cyanobacterial blooms). For C. meneghiniana, a decrease in N and P concentrations under 15% dilution rate made its cell densities significantly decrease. However, the cell density of Microcystis sp. significantly decreased along with the decrease in N under 5% dilution rate. Within changes of nutrient and dilution rate in this study, it was indicated that N strongly affects Microcystis sp., while both N and P influence C. meneghiniana.
Several studies have determined that a decrease in N concentrations (Shatwell and Köhler, 2018), P concentrations (Hamilton et al., 2016), or both (Paerl et al., 2016) can influence the suppression of cyanobacterial blooms. However, in this study, as shown in Fig. 5, the critical nutrient for saturated Microcystis sp. cell density was found to depend on the initial nutrient concentration. Growth characteristics of the bloom-forming species and the nutrient concentrations can be simulated using our developed model, and results from the simulation can provide information on which nutrient to mitigate to suppress the bloom production. For example, the N and P concentrations before dilution of Lake Tega were ca. 4.0 mg-N/L and 0.35 mg-P/L (closed circle in Fig. 5B), respectively. To suppress cyanobacterial blooms effectively, our results show that P rather than N should be reduced because the N:P ratio (dashed line in Fig. 5B) was higher than around 11. As a consequence of dilution, the P concentration decreased more than that of N (ca. N = 2.0 and P = 0.10 mg/L (open circle in Fig. 5B), which led to the suppression of cyanobacterial blooms. Further control of the blooms could be expected by reducing the P concentration.The prediction of cyanobacterial blooms using the competitive growth model developed in this study can be widely applied to highly eutrophic lakes, and can serve as a powerful tool to determine which nutrients (N or P) should be reduced to suppress cyanobacterial blooms.
Summary
An overestimation of algal cell density under high nutrient conditions by a competitive growth model previously developed by our research group was modified by introducing the limiting term for growth rate into the model. The newly developed model presented more accurate predictions of growth patterns of cocultured Microcystis sp. and C. meneghiniana. The model also simulated the growth patterns of Microcystis sp. at various initial N and P concentrations, and found that the cell density tended to increase when the initial N:P mass ratio was around 11. These findings provide an ability to predict the nutrient important for cyanobacterial growth, and managing it can be promising toward the suppression of their blooms.
Footnotes
Acknowledgment
Authors are thankful to Prof. Dr. Fumio Imazeki, the head of Safety and Health Organization at Chiba University, for his encouragement and financial support.
Author Disclosure Statement
No competing financial interests exist.
Funding Information
This work was supported in part by JFE 21st Century Foundation and by the Japan Society for the Promotion of Science under Grants-in-aid for Scientific Research (Grant No. JP18K04404).