
Abstract
When analyzing alternatives to locate a new industry or modify a production process that generates gaseous emissions, it is necessary to evaluate and quantify its environmental impacts, thus anticipating future inconveniences in the natural and social environment, in which the activity takes place. Under this framework, the objective of this work was to carry out an Environmental Risk Assessment (ERA) as an instance before the establishment of a new industry, which was applied to the case study of a lead smelting plant in the province of Entre Ríos, Argentina. For this, the projected activity data for said smelting plant were used, using the emission factors suggested by the United States Environmental Protection Agency (EPA). Once the emissions were estimated, the dispersion of the pollutants was modeled using the Industrial Source Complex Short Term version (ISCST3) model, which allowed knowing the distribution of the concentration of atmospheric pollutants in the urban area of Villa Elisa (Entre Ríos) and with the results obtained, an ERA was carried out. As a result of this research, a baseline was generated that allows estimating the potential impact on the health of exposed people as a pre-establishment to an industry that generates gaseous emissions.
Introduction
The objective of this work is to carry out an Environmental Risk Assessment (ERA) as an instance before the establishment of an industry, thus achieving a methodological guide that can be applied to establishments that generate gaseous emissions. This guide is applied to a case study, represented by a secondary lead smelting industry, where the risk produced by the three pollutants identified by the compilation of emission factors (atmospheric pollutants [AP]-42) for the activity, is analyzed in the urban area from the city of Villa Elisa, Entre Ríos, Argentina.
The methodology of this work combines the application of different tools such as the estimation of emissions based on the emission factors developed by the United States Environmental Protection Agency (EPA), the simulation of the transport and dispersion of pollutants through the Industrial Source Complex Short Term version (ISCST3) model developed by the EPA, and the environmental health risk assessment procedure.
The tools used in this work are widely disseminated; in the case of emission factors, they represent a technique used for the preparation of inventories of gaseous emissions, in this sense, we can cite the work carried out by Santos (2017) who applies this tool to carry out an inventory of stationary sources in Cuba. Other works use atmospheric dispersion models in risk assessment such as that of Mokhtar et al. (2014), in which the AERMOD model developed by the EPA is used to predict the environmental pollutant concentrations from a coal power plant, within a radius of 10 km from the emission source; and that of Seangkiatiyuth et al. (2011), where, through an atmospheric dispersion model, it evaluates the impact of a cement plant, identifying the areas of greatest impact.
As a result, this work generates an applied guide on a case that allows a preventive study to be undertaken.
Methodology
In this research, different methodologies were implemented to carry out the ERA as an instance before the installation of an industry whose process involves the generation of gaseous emissions. For this purpose, emissions were estimated from the activity rate of the production process and the appropriate emission factors. Second, a computational modeling system was used to estimate the distribution of concentrations in the study area, using local meteorology as a main input. Finally, the risks of the exposed population were characterized. The methodologies applied to our case study are presented in detail below.
Estimation techniques
Emissions were estimated using an indirect method (Eq. [1]), based on specific process and equipment information (i.e., activity rate, emission reduction efficiency, etc.) and emission factors corresponding to similar processes (INECC-SEMARNAT, 2013).
E = emissions; A = activity rate (Mg/year); EF = emission factor (kg/Mg), and ER = emission reduction efficiency (%).
The values considered for the case study were obtained from Chapter 12 of the compilation of emission factors for AP, AP-42 (EPA, 1997), for the secondary smelting lead process by means of a reverberant furnace, in addition to the activity rate that corresponds to the amount of material processed per year (Mg/yr) according to the capacity of the smelting furnace and, finally, the emission reduction efficiency that corresponds to the efficiency of the emission reduction system. In this sense, the AP-42 establishes emission factors for three pollutants generated from the secondary lead smelter—they are (1) particles, (2) sulfur dioxide, and (3) lead.
Application of the atmospheric dispersion model
Once the industry emission was estimated, an atmospheric dispersion model was used to find the highest concentration of the evaluated pollutants that affects the urban area closest to the smelting plant location.
The model chosen for this purpose was the Industrial Source Complex (ISC3) model (EPA, 1995), a local scale Gaussian plume model, suitable for evaluating pollutant concentrations from a wide variety of sources associated with industrial complex. This model provides several options to model emissions from a wide range of sources that might be present in industrial locations. The basis of the model is the straight-line, steady-state Gaussian plume equation, with some modifications to model emissions from simple point sources due to downdraft effects from nearby buildings (EPA, 1995).
For this case of study, the ISCST3 was used, considering as point source emission type, based on the source location, the rural dispersion parameters are used. Regarding the activity data, information from an industry with similar production characteristics was used. They are the following:
Internal diameter of the stack of 1.08 m Chimney height: 10.80 m Gas output speed: 5.4 m/s Gas outlet temperature: 106.2°C Flow rate: 4.95 m3/s
It used a polar grid to model, with transects every 10° and a total coverage of 4,200 m (the urban area is between 3,900 and 4,200 m from the source).
On the other hand, the meteorological data used to run the model were obtained from the nearest meteorological station of the National Institute of Agricultural Technology (INTA), in hourly frequency. This institute periodically performs quality analysis procedures on the meteorological information generated. Due to the requirements of the ISCST3 model, meteorological pre-processor, hourly data of wind direction (degrees), wind speed (m/s), ambient temperature (K), stability class, and mixing height (m) were used. The stability class and the mixing layer were estimated from solar radiation. The dispersion simulations were carried out using data corresponding to the period between July 2017 and June 2018, counting 365 days in total, the data for the model were in frequency per hour, and therefore, a total of 8,760 were used lines.
Environmental risk assessment
Risk assessment is a scientific process used to estimate the probability of adverse health effects from human exposure to hazardous substances (NJDEP, 2009). In this work, the exposure of the population to lead, sulfur dioxide and particulate matter was evaluated. For this reason, the reference doses (RfDs) were obtained from the California Environmental Protection Agency (CalEPA), which developed an oral slope factor and an inhalation unit risk factor (URF) for lead, a pollutant that was classified as probably carcinogenic for humans by the International Agency for Research on Cancer (IARC). On the contrary, for sulfur dioxide and particulate matter, the reference concentrations established by the World Health Organization (WHO, 2006) were used.
The risk characterization was carried out integrating the toxicological information, exposure parameters, and the pollutants concentration, to which the population is exposed. In this sense, the quantitative evaluation of the noncarcinogenic risk of sulfur dioxide and particulate matter (Eq. [2]) was performed using the hazard index (HI), while for lead, a carcinogenic risk assessment was carried out (Eq. [3]). Although a RfD specifically for lead has not been generated, in this work, the Average Daily Dose for Life (LADD) (Eq. [4]) of the urban population was evaluated in all age groups established by the Risk Management Guidance for Stationary Sources of Air Toxics (2015).
C = concentration found (μg/m3) and RfC = reference concentration (μg/m3)
C = concentration found (μg/m3) and URF = unit risk factor (μg/m3)−1
LADD = average daily dose for life, Ca = concentration in air (mg/m3), InhR = inhalation rate (m3/h), ET = exposure time (h/day), EF = frequency of exposure (day/year), ED = duration of exposure (years), BW = body weight (kg), AT = average exposure time (days).
Results
From the application of Eq. (1), the emissions of the evaluated pollutants were estimated, and are represented in Table 1, the values were used as data:
Emission Estimation of the Pollutants Evaluated
A, activity rate; E, emissions; EF, emission factor; ER, emission reduction efficiency.
EF: Corresponding to the emission factor that the EPA establishes for secondary lead smelting, mean values considered in guide AP-42 for lead secondary smelting were considered for each one of the evaluated pollutants.
A: Activity rate, which corresponds to the amount of material processed per year, for this case study, we worked with the amount processed by an industry with similar characteristics that operates in the province of Entre Ríos.
ER: Corresponding to the removal rate of the chosen emission control system, in this case, the rate given by the provider of the fabric filter system is considered.
E: Estimated emission rate, as a result of the application of the equation.
Once the emission of the pollutants defined in AP-42 has been estimated for the secondary lead smelter, it is possible to apply the ISCST3 atmospheric dispersion model. For this, three simulations were performed considering the information of the industry to be installed, the meteorological data mentioned in Methodology section, and the emission rates found for each pollutant (g/s). From these simulations, the analysis of the concentrations found at different distances from the smelting plant was performed.
Figure 1 shows the polar grid established up to 4,800 m from the emitting source, the concentrations of interest for this work are those found at distances between 3,600 and 4,800 m (location of the urban radius). On the contrary, Figure 2 represents the wind rose generated for the study region.
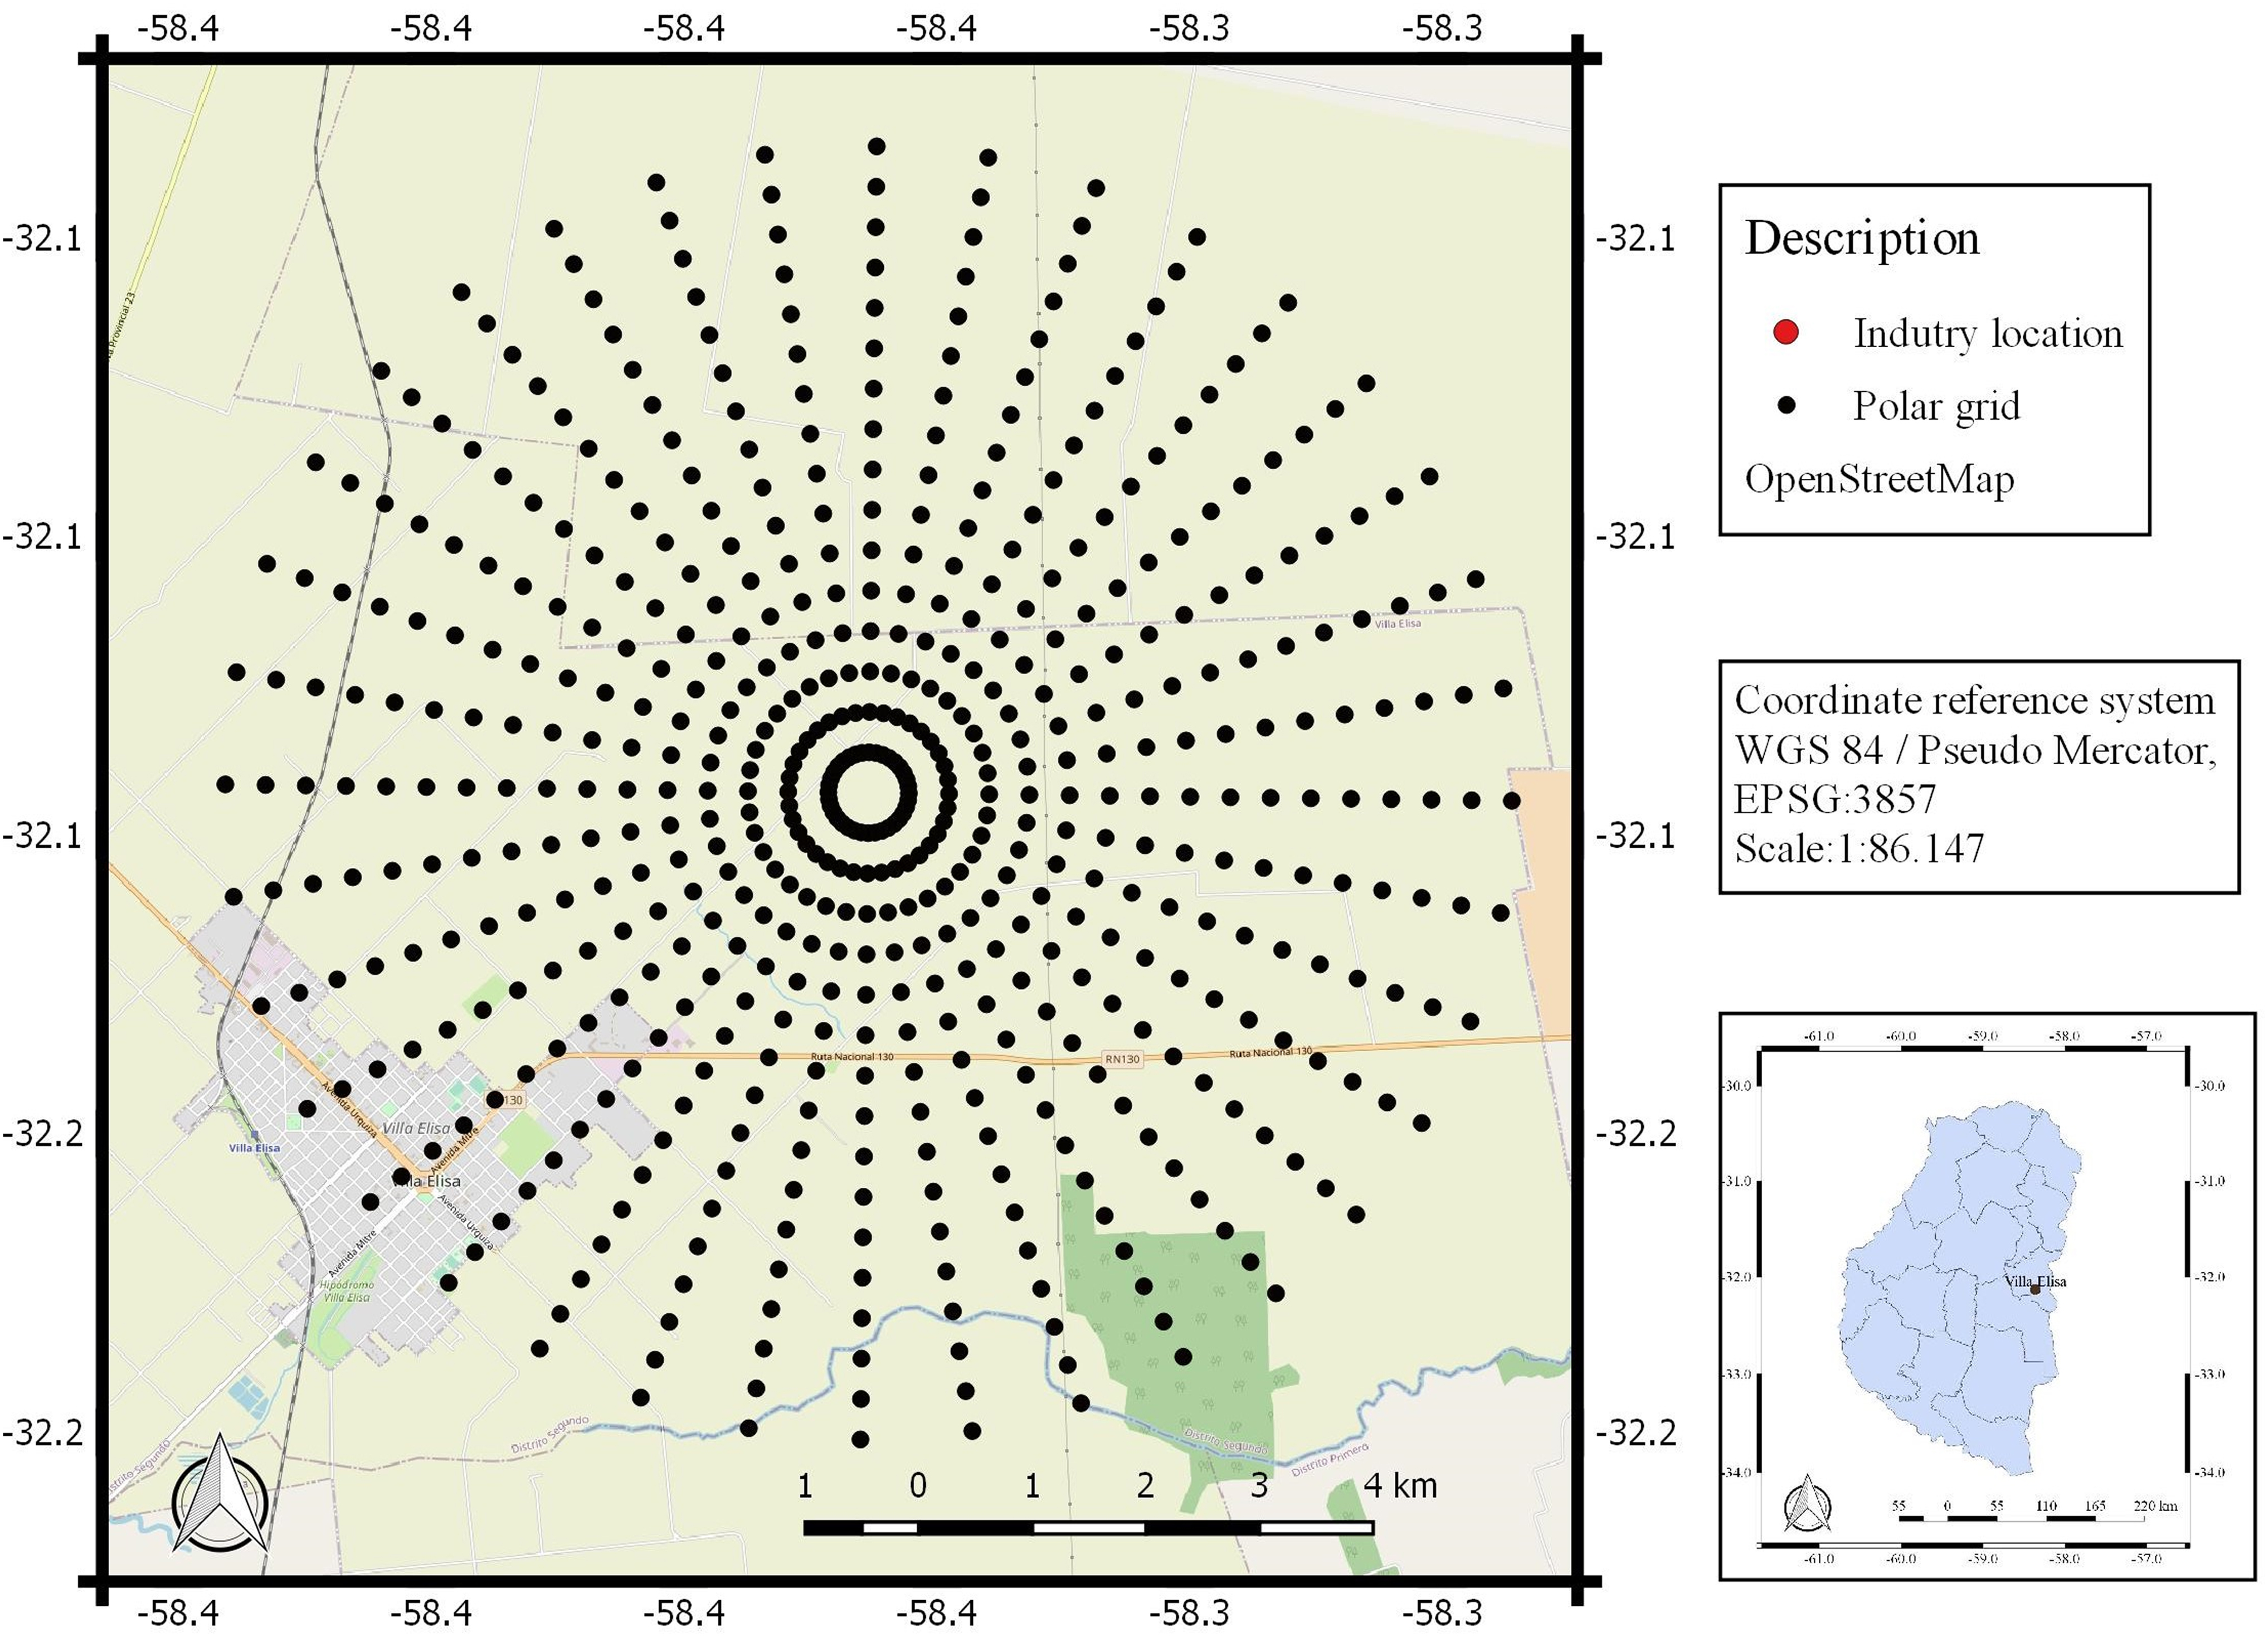
Receptor grid.
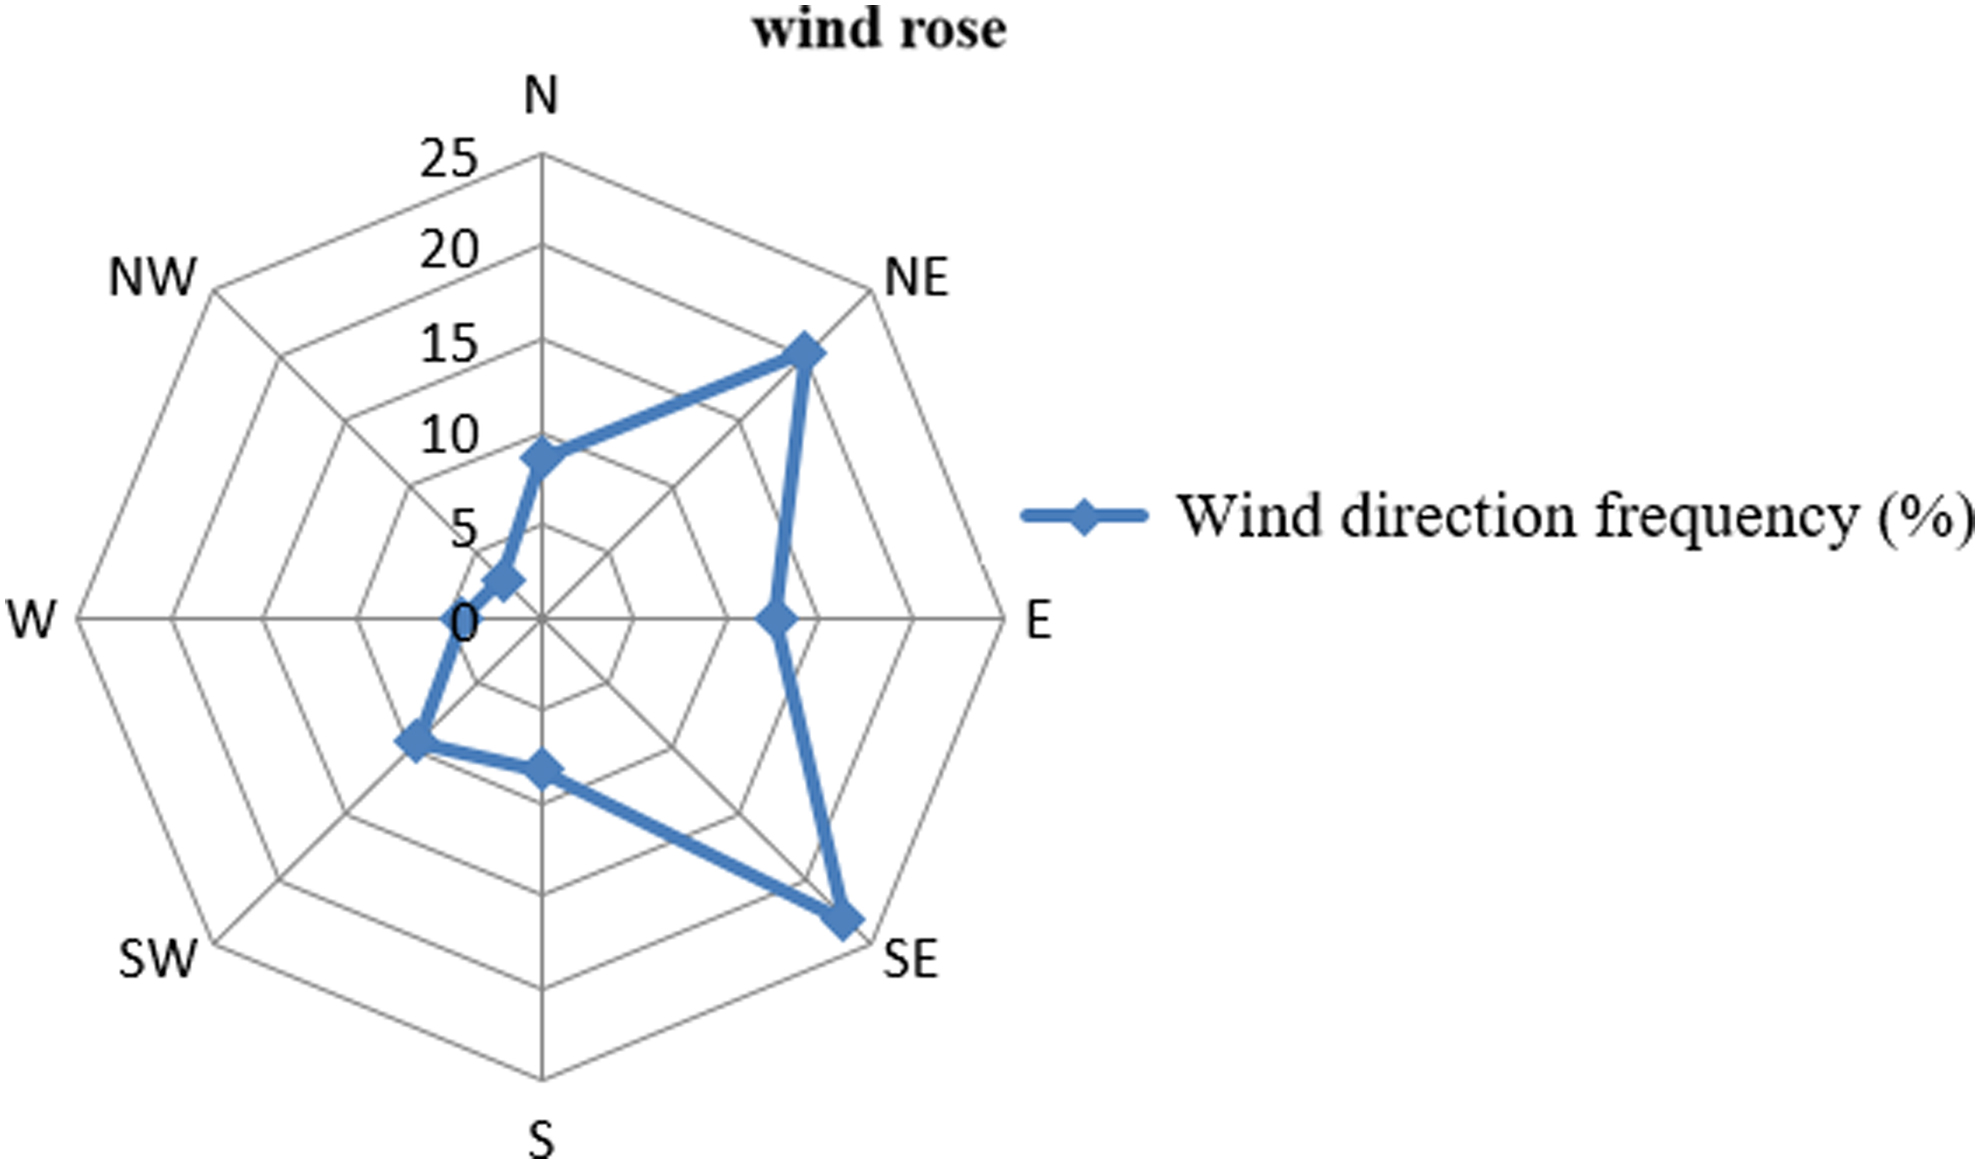
Wind rose for the study area.
On the contrary, Figures 3–5 present a graphic analysis of the concentrations found, of which the ones that affect the urban area of Villa Elisa are considered. In these graphs, it can be seen that as the distance to the emitting source increases, the concentration of the three pollutants decreases significantly. Table 2 shows the highest concentrations found in 24-h averages for each pollutant in the study area between 3,600 and 4,800 m. For these graphics, the OpenStreetMap layer was used as the base.

Particulate concentration (μg/m3).

Sulfur dioxide concentration (μg/m3).
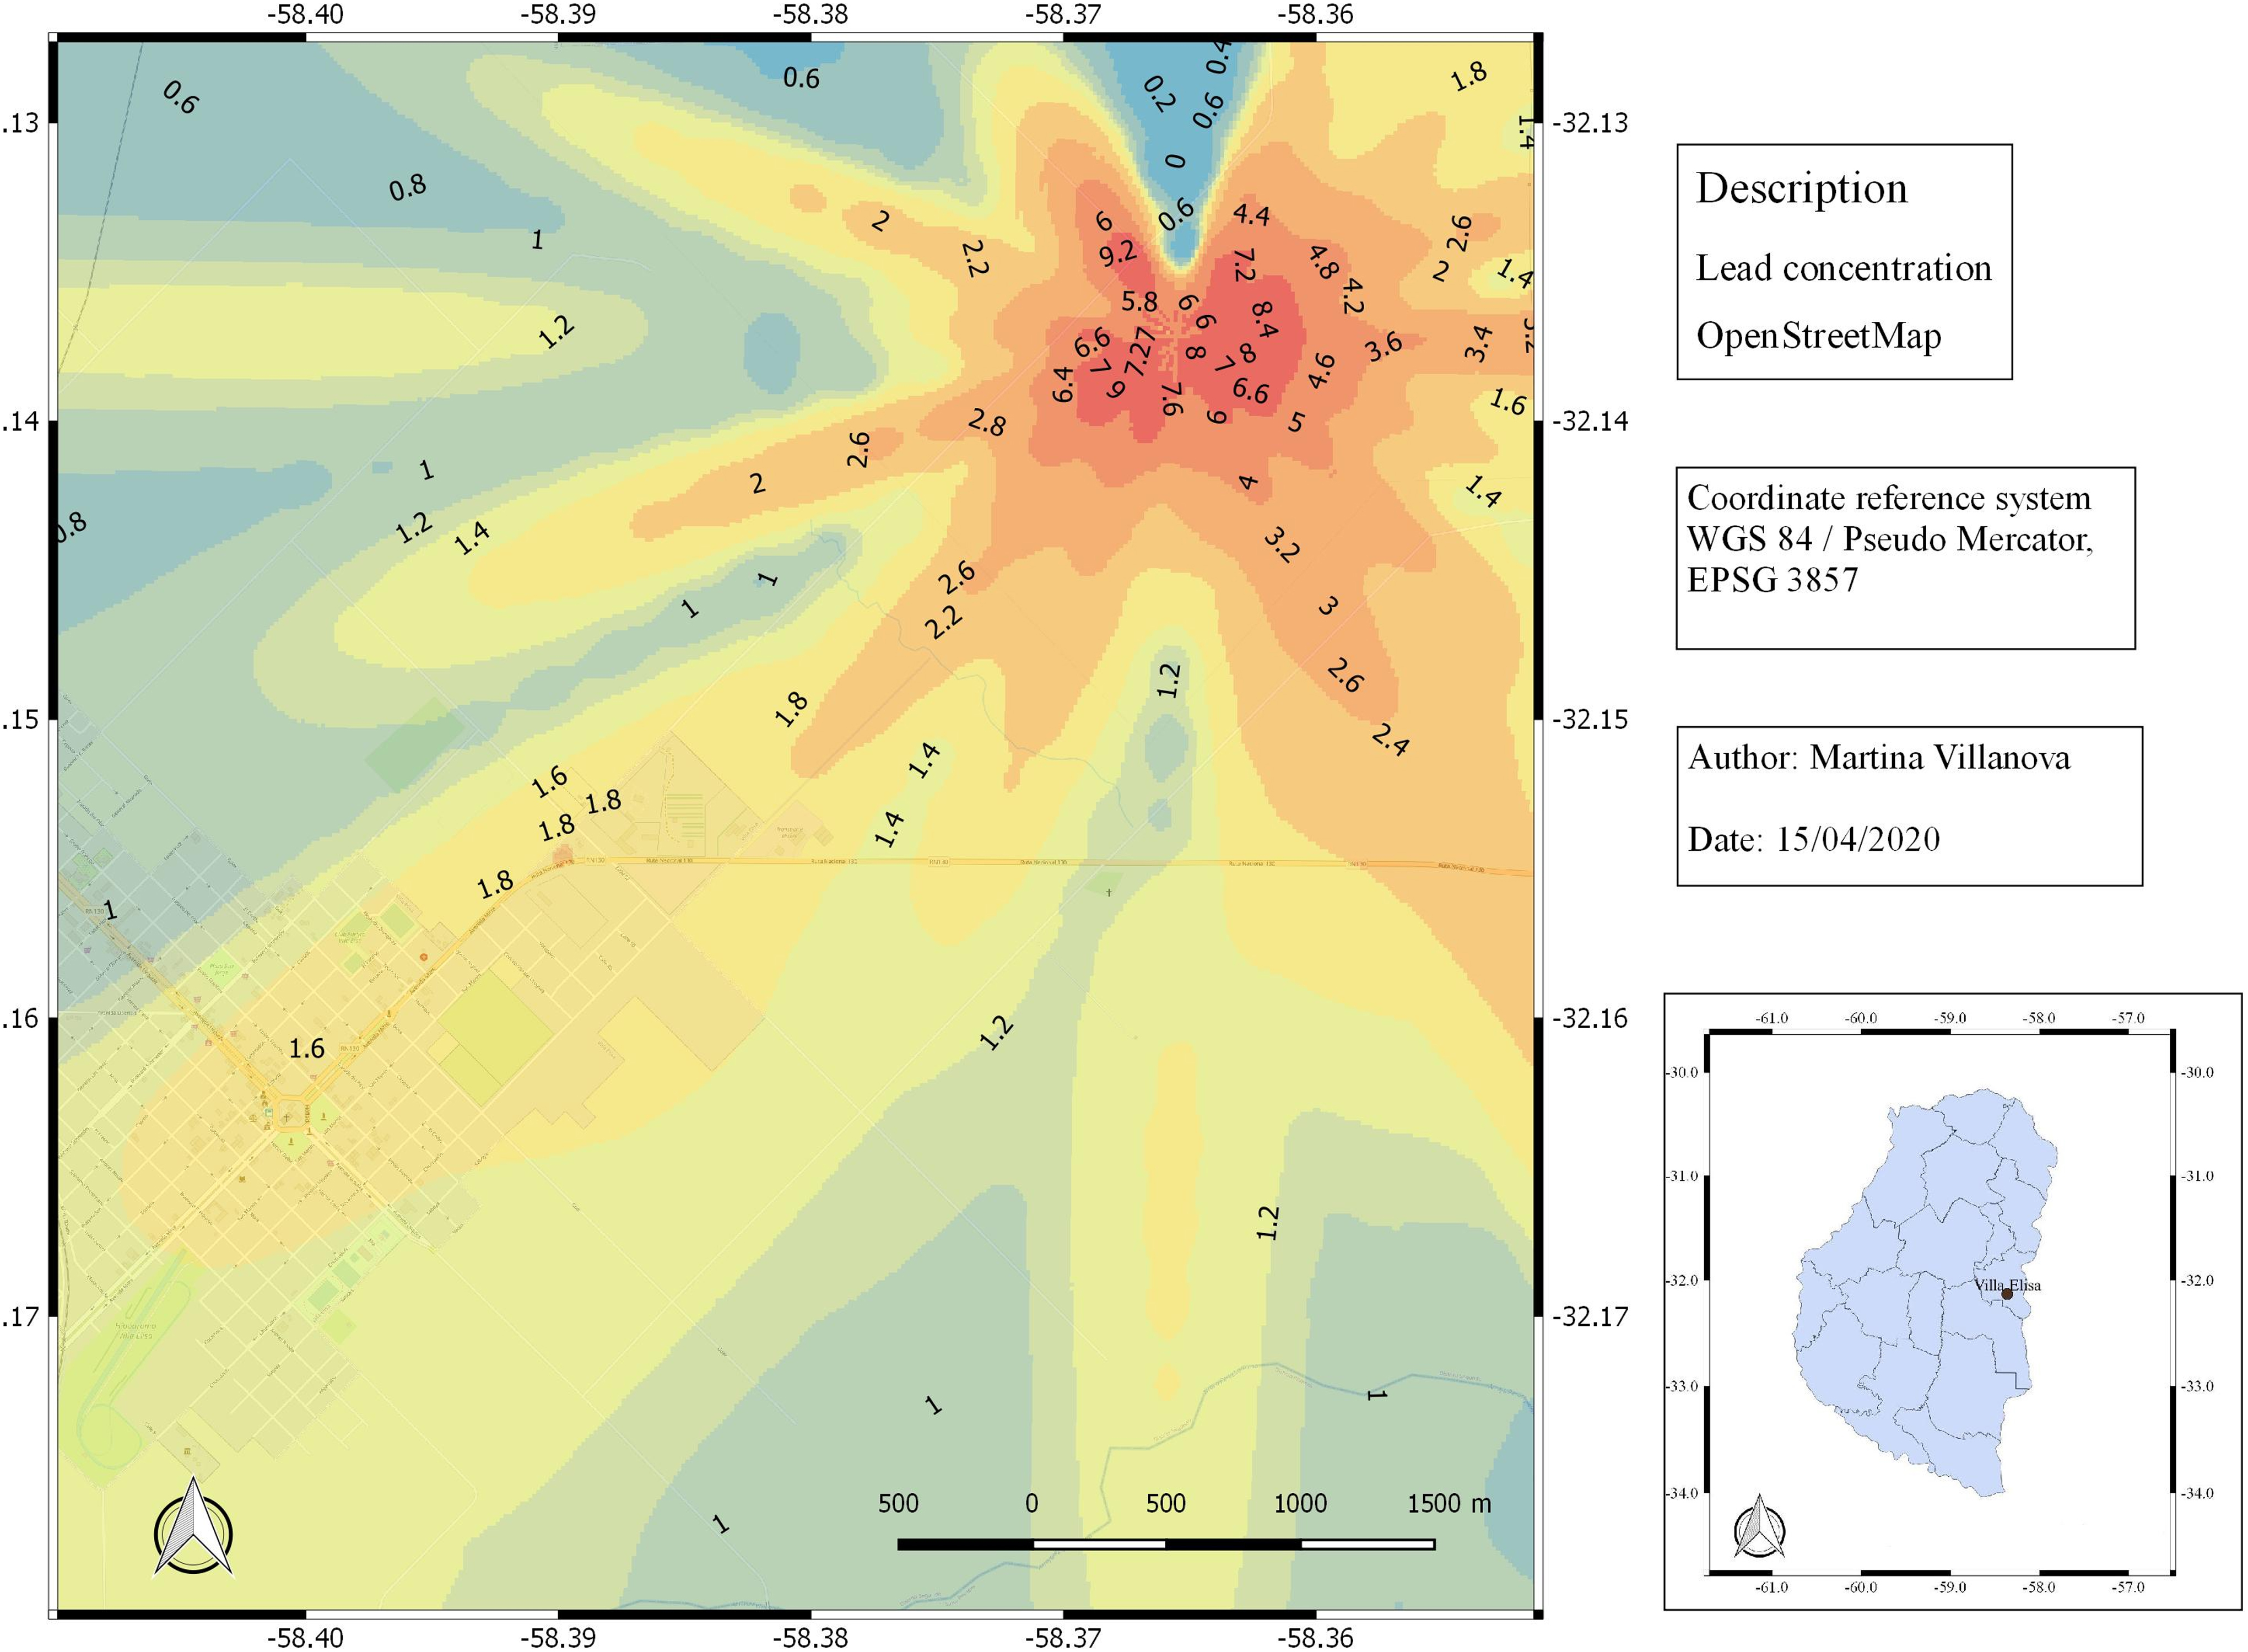
Lead concentration (μg/m3).
Ambient Concentrations Obtained Over Urban Area
Once the pollutant concentration in the urban area was known, the ERA was carried out, with the aim of evaluating the risk of exposure to the three pollutants evaluated. In this context, Eq. (2) was applied for the characterization of particles and sulfur dioxide (Table 3), while for the characterization of lead, the quantitative evaluation was carried out using Eq. (3), considering that the integrated risk information system classifies lead as B1 (probably carcinogenic), in this sense, CalEPA generated a unit inhalation risk value (URF) for lead. On the contrary, the inhalation exposure dose in the urban area was determined using Eq. (4).
Hazard Index
C, concentration found; HI, hazard index; RfC, reference concentration.
Once the characterization of the risk in particles and sulfur dioxide was carried out, the characterization of the carcinogenic risk for lead was carried out in Eq. (3) (Table 4), by means of quantitative evaluation applying Eq. (4) (Table 5).
Theoretical Cancer Risk
URF, unit risk factor.
Estimated Dose for Age Group
AT, average exposure time; BW, body weight; Ca, concentration in air; ED, duration of exposure; EF, exposure frequency; ET, exposure time; InhR, inhalation rate.
The individual cancer risk estimates are expressed as unitless probabilities (e.g., 2E-06 or 2 in 1,000,000) of an individual developing cancer. The unitless probability represents the incremental (or increased) lifetime cancer risk associated with the estimated exposure above the background risk of developing cancer (Conklin et al., 2010).
Table 5 presents the dose estimate for each age group from the application of Eq. (4), and the highest concentration of lead found in the study area and the reference factors of the InhR and BW varies according to the data taken from the Exposure Factors Manual (Edition 2011), which determines the different exposure doses.
As a conclusion of the case study, it was established that, for the urban area, the found concentration values of particles and sulfur dioxide do not exceed the WHO reference values, while in the case of ERA, due to exposure to lead, the increase in cancer risk can be established based on the pollutant concentrations in the urban area and the unit risk factor. On the contrary, the dose received by the inhabitants was estimated (Table 5) according to the different ages, although the EPA has not yet developed a RfD to be able to compare with the estimated doses, it can be seen from the table that as the age of people decreases, the dose received at the same pollutant concentrations is greater; this factor is considerable since according to the EPA, for carcinogens, it is assumed that there is a linear relationship between an increase in the dose and an increased risk of cancer (NJDEP, 2009).
Conclusions
On the basis of this work, a guideline could be established to carry out a preventive study that allows evaluating the feasibility of establishing an industry, as an instance before its location, that is, when there are still no direct measurements of the emissions generated during the production process.
This guideline is considered useful for public bodies involved in decision-making to argue the position adopted regarding the establishment of a company that could present a potential risk to the health of residents; on the contrary, it is necessary to consider that this technique implies typical uncertainties of the algorithms used to estimate the pollutant concentrations in the study area and the risk characterization, as well as the variability related to exposure.
In this sense, the EPA considers that the excess risk of cancer is acceptable between one in ten thousand (1 × 10⁻⁴) and one in a million (1 × 10⁻⁶) (or less), for this case study, where I evaluated the worst case scenario, the result obtained is 21.6 × 10⁻⁶, therefore, it is considered that there is an excessive risk of cancer from lead exposure; considering this situation, for the establishment of an industry with these characteristics, measures should be considered to reduce the risk of exposure. Regarding the application of the noncancer HI for the study of particulate matter and sulfur dioxide, HI >1 was obtained, therefore it is not exceeded in the concentrations found.
On the contrary, in this work, the characterization of the risk for exposure to the emissions generated in the evaluated industrial process was performed, without addressing exposure by other routes such as skin and ingestion, which suggests how to address all routes in the future to be incorporated into the guidelines generated.
Footnotes
Acknowledgments
This work is part of the activities carried out by the gabinete de investigación ambiental of the Facultad de Ciencias de la Salud, Universidad Nacional de Entre Ríos.
Author Disclosure Statement
No competing financial interests exist.
Funding Information
This work was not financed by any research body.