




Abstract
Powdered Saccharum arundinaceum leaves (PSAL) are an agricultural waste and are abundantly available for use as a versatile, low-cost biosorbent for removal of dyes from wastewater in manufacturing, printing, and textile industries. In this study, the equilibrium adsorption and kinetics of adsorption of methylene blue (MB) with PSAL were studied by performing batch experiments. The effects of MB dye concentration, contact time, temperature, pH, and adsorbent dose were investigated. The adsorption of MB dye was enhanced in alkaline media (pH 10). Langmuir isotherm formulations were applied to investigate the nature of sorption. Similarly, Freundlich adsorption isotherm was also investigated. The Langmuir isotherm has the highest value of R2 (0.99) compared to other sorption isotherm models. Moreover, PSAL showed favorable adsorption with the separation factor (RL < 1). Similarly, the rates of uptake were tested with models of pseudo first and second order kinetics. High coefficient of determination (R2) and the low sum of squared error values confirm that the adsorption process proceeds through pseudo second order kinetics. Thus, on the basis of kinetic analysis, PSAL are an effective biosorbent to remove MB dye from wastewater.
Introduction
The wastewater pollution has drawn growing attention due to release of dyes into the ecosystem from the manufacturing, printing, coloring, and textile industries. These dyes are often lethal to aquatic life (Han et al., 2015) and can present risks to human health. Owing to high costs and resulting pollution problems, chemical and physical processes are not being broadly applied for dye removal from effluents (Robinson et al., 2001). Biological processes, including bioaccumulation, biodegradation, and biosorption, are alternative methods for removing dyes from textile effluents. Unfortunately, bioaccumulation and biodegradation are sparingly slow processes for the reason that nearly almost all dye compounds resist biological treatment and microbial action alone. Furthermore, dye can produce byproducts, and sometimes, these are accompanied with other metabolites that are more toxic than the primary substrate (Ramsay and Nguyen, 2002).
Methylene blue (MB) is an important dye, which is extensively used for cotton, leather, paper, and wool dyeing. It has a variety of unsafe properties on living beings (Cengiz and Cavas, 2008) because when it is inhaled it can cause problems to human health such as vomiting, nausea, mental confusion, difficulties in breathing, and so on. In addition, industries involved in release of dye-containing wastewater introduce a potential hazard of bioaccumulation that can affect humans through food chains.
To resolve these problems an assorted technology must be developed in which one of the prominent processes responsible to remove environmentally unwanted and harmful chemicals is adsorption (Cengiz and Cavas, 2008). An activated carbon can be used as an adsorbent due to its high capacities for uptake of organic pollutants, but these materials have high cost and difficult process of regenerating (Waranusantigul et al., 2003).
Adsorption is widely used to remove pollutants from wastewaters having the advantages of higher management efficiency with no contaminated end product. Biosorption is an efficient technique for the treatment of wastewater because it does not require a constant supply of nutrients and can be regenerated and recycled (Wang et al., 2010). A large number of researchers have investigated low-cost adsorbents, as well as biosorbents, such as natural materials or industry and agriculture waste materials (Zhang et al., 2011). Materials used as adsorbents for elimination of dye from effluents include siliceous material such as silica beads, perlite, alunite, clay materials like kaolinite, bentonite, zeolites, and some agricultural wastes such as rice husk, maize cob, coconut shell, and bagasse pith (Namasivayam et al., 1996). Similarly, others have investigated the removal of textile dyes like Direct Red 89 and Reactive Green 12 using Lemna gibba biomass as a lignocellulosic sorbent material (Guendouz et al., 2013), Luffa cylindrica fibers for removal of anionic dye (alpacide blue) (Kesraoui et al., 2016), and Cedar bark (Cedrela fissilis), a waste from wood processing, for biosorption dyes, for example, Red 97 (Georgin et al., 2019). Saccharum arundinaceum is a perinal natural herb found in subcontinent India and Pakistan. It is easily available, rich in minerals, and widely used as fodder (Feng et al., 2015). Keeping in view the importance of S. arundinaceum, its leaves were explored for the first time, as biosorbent for the removal of MB from water.
The aim of the present study focused on adsorption of MB on leaves of S. arundinaceum, as a novel and cost-effective biosorbent. The effects of different parameters like concentration, contact time, pH, and adsorbent dose on MB adsorption were investigated. Similarly, Fourier-transform infrared (FT-IR) analysis was performed for determination of functional groups to determine possible mechanisms of MB adsorption on powdered Saccharum arundinaceum leaves (PSAL). In addition, mathematical models of adsorption isotherms and kinetic were also examined.
Materials and Methods
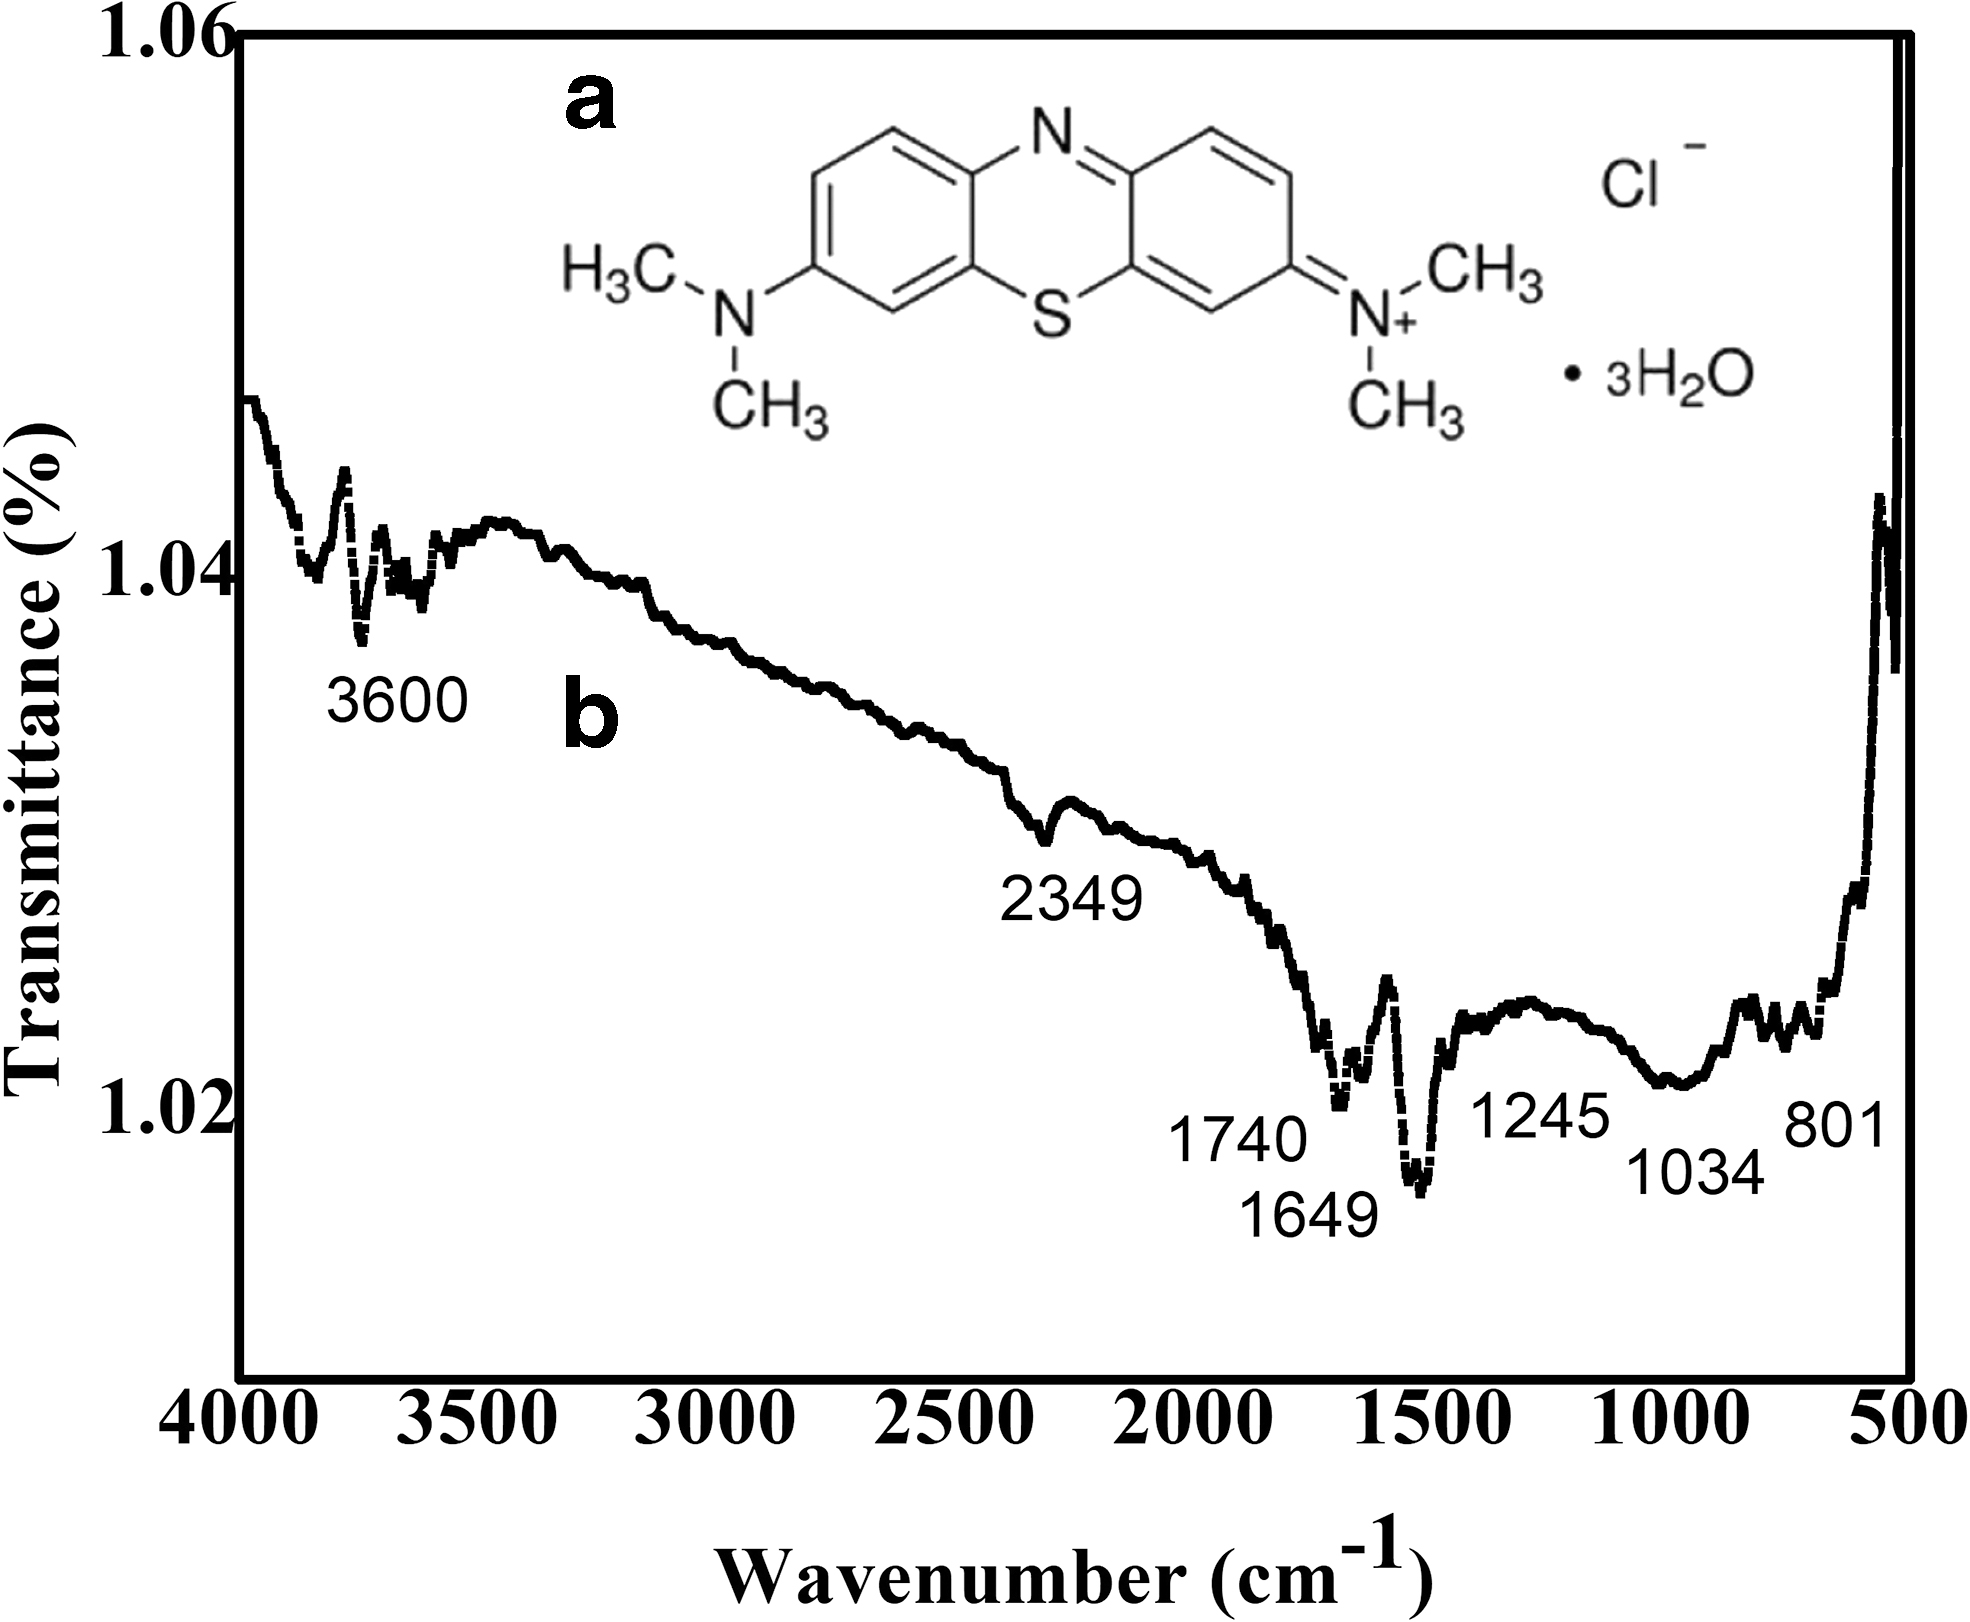
The S. arundinaceum leaves as raw materials were collected from a nearby area of Tehsil Domel, District Bannu, Khyber Pukhtunkhwa, Pakistan. Chemicals used were all of analytical grade procured from Sigma-Aldrich such as 3, 9-bis dimethyl-aminophenazo thionium chloride (MB) dye powder with chemical formula of C16H18N3SCl (Mw = 319.85 g/mol), Nitric acid (HNO3), and Sodium Hydroxide (NaOH). The chemical structure of the MB is also given in Fig. 1a.
Preparation of adsorbent
For this purpose, the raw leaves were first powdered, thoroughly rinsed using distilled water to remove dust and soluble impurities, and then sun dried. The dried leaves were ground into powder by means of a domestic mixer grinder Moulinex (model depose 02105 411, France). The resulted powders were sieved using BS410 standard sieve 355 mesh (Fisher; UK), to get a uniform particle size of about 45 μm, and then were preserved in bottle for further use as an adsorbent.
Preparation of stock solution (an aqueous solution of MB)
For preparation of 1.0 g/L stock solution, 0.5 g dye powder was dissolved in 500 mL distilled water. From stock solution, different diluted solutions were made for performing various experiments.
Adsorption experiments
Adsorption experiments performed using a water bath shaker at 160 rpm and 30°C in a 100 mL flask having 50 mL of different pH values and the initial dye solution concentrations. Previously, 0.1 M NaOH or HNO3 was used for adjustment of the initial pH values of the solutions. Different amounts of adsorbent were added to already marked flasks and then sealed to avoid volume changes of the solution during the adsorption process. After stirring the flasks for specific time intervals, the MB solutions were filtered using filter paper (Grade 42). The concentrations of dye in each of the filtrate solutions were measured from the maximum absorbance at 664 nm (λmax) using a UV-Visible spectrophotometer. Then, for calculation of the adsorbed amount of dye, a simple mathematical equation was followed such as

In this equation, qt (mg/g) is the adsorbed quantity of dye, while C0 and Ce are the initial and equilibrium liquid-phase concentrations of MB in mg/L, respectively. V is the initial volume of dye solution in liters, and W is the amount of PSAL in grams.
Experiments were carried out in triplicate, along with blank (i.e., with no adsorbent), for the certainty of adsorption that occurs only through PSAL without container's involvement.
Characterization
The FT-IR spectroscopy using an attenuated total reflectance fourier transform infrared spectrometer (Eco-ATR spectrometer; Alpha, Bruker Co., Germany) was performed to characterize the presence of functional groups in the PSAL. A pH meter (BMS, MA) was used for the pH measurements. A UV-Visible spectrophotometer (UV-1800, Japan) was also carried out to determine the MB concentrations left in the supernatant solutions.
The specific surface area (SSA) was measured using the following Eq. (2).

where Ng is the number of molecules of MB adsorbed at the monolayer of PSAL in m2/g (or Ng = Nm × M), Av is Avogadro's number, AMB is the occupied surface area of one molecule of MB = 162 Å2, and M is the molecular weight of MB, 319.85 g/mol (Hequet et al., 1998). Based on the equation given above the surface area calculated has been found to be 30.49 m2/g.
Results and Discussion
Proximate analysis of S. arundinaceum leaves
Proximate analysis of S. arundinaceum leaves (1 g) was performed based on reported methods (Shoaib and Al-Swaidan, 2015; Klasson, 2017), in which the process was successfully applied to determine the various parameter contents as percentages such as ash, moisture, fixed carbon, and volatile matter and is expressed in Table 1.
Masses of Components of Saccharum arundinaceum Leaves
FT-IR analysis of PSAL
The FT-IR is an essential tool for obtaining the information about the surface functional groups and the chemical and structural characteristics of the adsorbent. The FT-IR spectrum of PSAL is provided in Fig. 1b, in which the sharp bands at around 3,600–3,400 cm−1 indicate the asymmetric stretching vibrations of NH2 and hydroxyl groups relating to there being –OH groups on the surface of adsorbent and chemisorbed water (Bayramoğlu et al., 2006; Akar et al., 2009). The peak in the range from 3,000 to 2,800 cm−1 can be assigned to the stretching (both symmetric and unsymmetrical) modes of C–H, which may be due to the presence of lignin and cellulose based –CH and C–H groups. The strong band at 1,740 cm−1 can be ascribed to stretching vibrations of C = O. Another strong peak from 1,670 to 1,583 cm−1 is due to C = C and N–H deformation vibration. The peak at 1,512 cm−1 attributed to the presence of aromatic skeletal. The peak at 1,649 cm−1 is due to C–O vibrations and the peak at 1,245 cm−1 attributed to the C–O–C and C–N stretching vibration. The peak at 1,034 cm−1 could be assigned to C–O–C, C–O, and C–H stretching vibration of acyl oxygen in cellulose. The adsorption peaks in the wave numbers region of 1,300–900 cm−1 are mainly attributed to the presence of alcohols, carboxylic acid, esters, or ethers. Peak at wave number 801 cm−1 is assigned to the presence of β-glucosidic linkage of cellulose in the sample (Krishni et al., 2014). Thus, the presence of different nucleophilic groups in the sample indicates its effectiveness in adsorption of the dye ions (Khan et al., 2016).
Effect of MB dye concentration
The effect of MB dye initial concentration on adsorption is graphically shown in Fig. 2a. From figure it can be deduced that there is a decrease in MB dye % removal from 93% to 76%, when the MB concentration is increased from 5 to 100 mg/L, keeping the contact time interval as 60 min. Similarly for the same increase in concentration, when the contact time is decreased to half, that is, 30 min, a decrease of 83–76% in MB removal has been observed. The change in behavior can be accredited to the presence of higher quantity of adsorbate in comparison to the assessable active sites present in fixed amount on the surface of the adsorbent.

Effect of contact time
The plot for determination of the optimal contact time of MB biosorption is given in Fig. 2b. The Figure elaborates percentage sorption against agitation time for two different dosages of adsorbate at contact time durations from 30 to 420 min. It is evident from the graph that equilibrium is almost achieved in 30 min and then there is minimal increase in % sorption of the dye due to increased agitation time. From the figure it can be deduced that for both the initial dye concentrations used (10 and 20 mg/L), the percentage sorption is virtually independent of the initial concentration. The MB adsorption rate is primarily found to be faster due to enough surface area of the adsorbent. Similarly, after some time intervals, the rate of sorption decreases due to adsorption of more amount of MB with the decrease in accessible surface area for sorption. Therefore, about 80% of the adsorption takes place within 30 min. There was no more increase observed with increasing time up to 420 min.
Temperature effects on sorption of MB
The effect of temperature on MB sorption is expressed in Fig. 2c. All other optimized parameters were kept constant that is initial dye concentration (10 mg/L), biosorbent dose (0.1 g), and constant stirring of 160 rpm, while changing only the temperature. From figure it can be deduced that increase in temperature favors the dye removal through adsorption onto PSAL. Such type of behavior indicates an exothermic nature of the reaction (Sen and De, 1987; Aksu et al., 1992).
The sorption of dye by PSAL also shows that it may not only lead to physical adsorption but also chemical. This effect may be due to the enhancement in free volume rises due to the better movement of dye at elevated temperatures (Panday et al., 1984). This might be explained by the relative increase in the tendency of dye molecules escaping toward bulk phase from solid phase with increasing solution temperature (Knocke and Hemphill, 1981). Furthermore, it may be due to the dissolution of sorbed species, alteration in the size of pores, and an improved intraparticle diffusion rate of adsorbent (Kannan and Sundaram, 2001). Thus, there was increase in temperature from 20 to 50°C, and the removal of dye through PSAL increased from 77.9% to 88%. These outcomes demonstrate that the adsorption performance of PSAL for MB was considerably enhanced due to increase in temperature up to 50°C. As a result, it is obvious that the adsorption equilibrium depends upon temperature where the improved temperature provided enough energy for dye to capture onto the interior structure of PSAL.
Effect of pH on dye adsorption
The pH has a strong effect on the dye adsorption against any biomass material, which mainly affects the surface charges of adsorbent, species of adsorbate, and the extent of ionization of dye molecule as described earlier (Cengiz and Cavas, 2008). The adsorption results were determined in the pH range from 1 to 11 for initial MB concentration of 10 mg/L with adsorbent amount of 0.1 g and are provided graphically in Fig. 2d. The graph indicates that MB adsorption onto PSAL was enhanced with change in pH toward basic region. The optimal pH for the MB adsorption was found to be in the range of 7–10. This increase in adsorption can be explained by taking into account the electrostatic interaction, which exists between the adsorbents and negatively charge bearing surface of PSAL. In addition, at acid pH, the lower adsorption was observed due to the existence of greater number of H+ ions that compete with positively charged ions of dye for adsorption sites. When the number of cationic sites at alkaline pH decreases, then the capacity of anionic sites increase, which ultimately favors an elimination of cationic dye from solution as reported earlier (Kannan and Sundaram, 2001; Garg et al., 2004).
Effect of the adsorbent dosage on dye sorption
The results obtained for the effect of adsorbent dosage on dye sorption are shown in Fig. 2e, in which the initial concentration of MB was chosen to be 10 mg/L. This Fig. 2e shows the enhancement in removal efficiency of MB due to increase in the adsorbent dosage from 0.1 to 0.5 g, while further increase in adsorbent dosage up to 1 g caused the decrease in residual concentration of MB. The MB removal efficiency increased from 81.4% to 92.9% with the increase in adsorbent dosage from 0.1 to 0.5 g, which is also found similar to those results as described earlier for MB adsorption (Cengiz and Cavas, 2008; Liang et al., 2010; Sun et al., 2013; Saba et al., 2016).
Adsorption isotherms
Langmuir adsorption isotherm
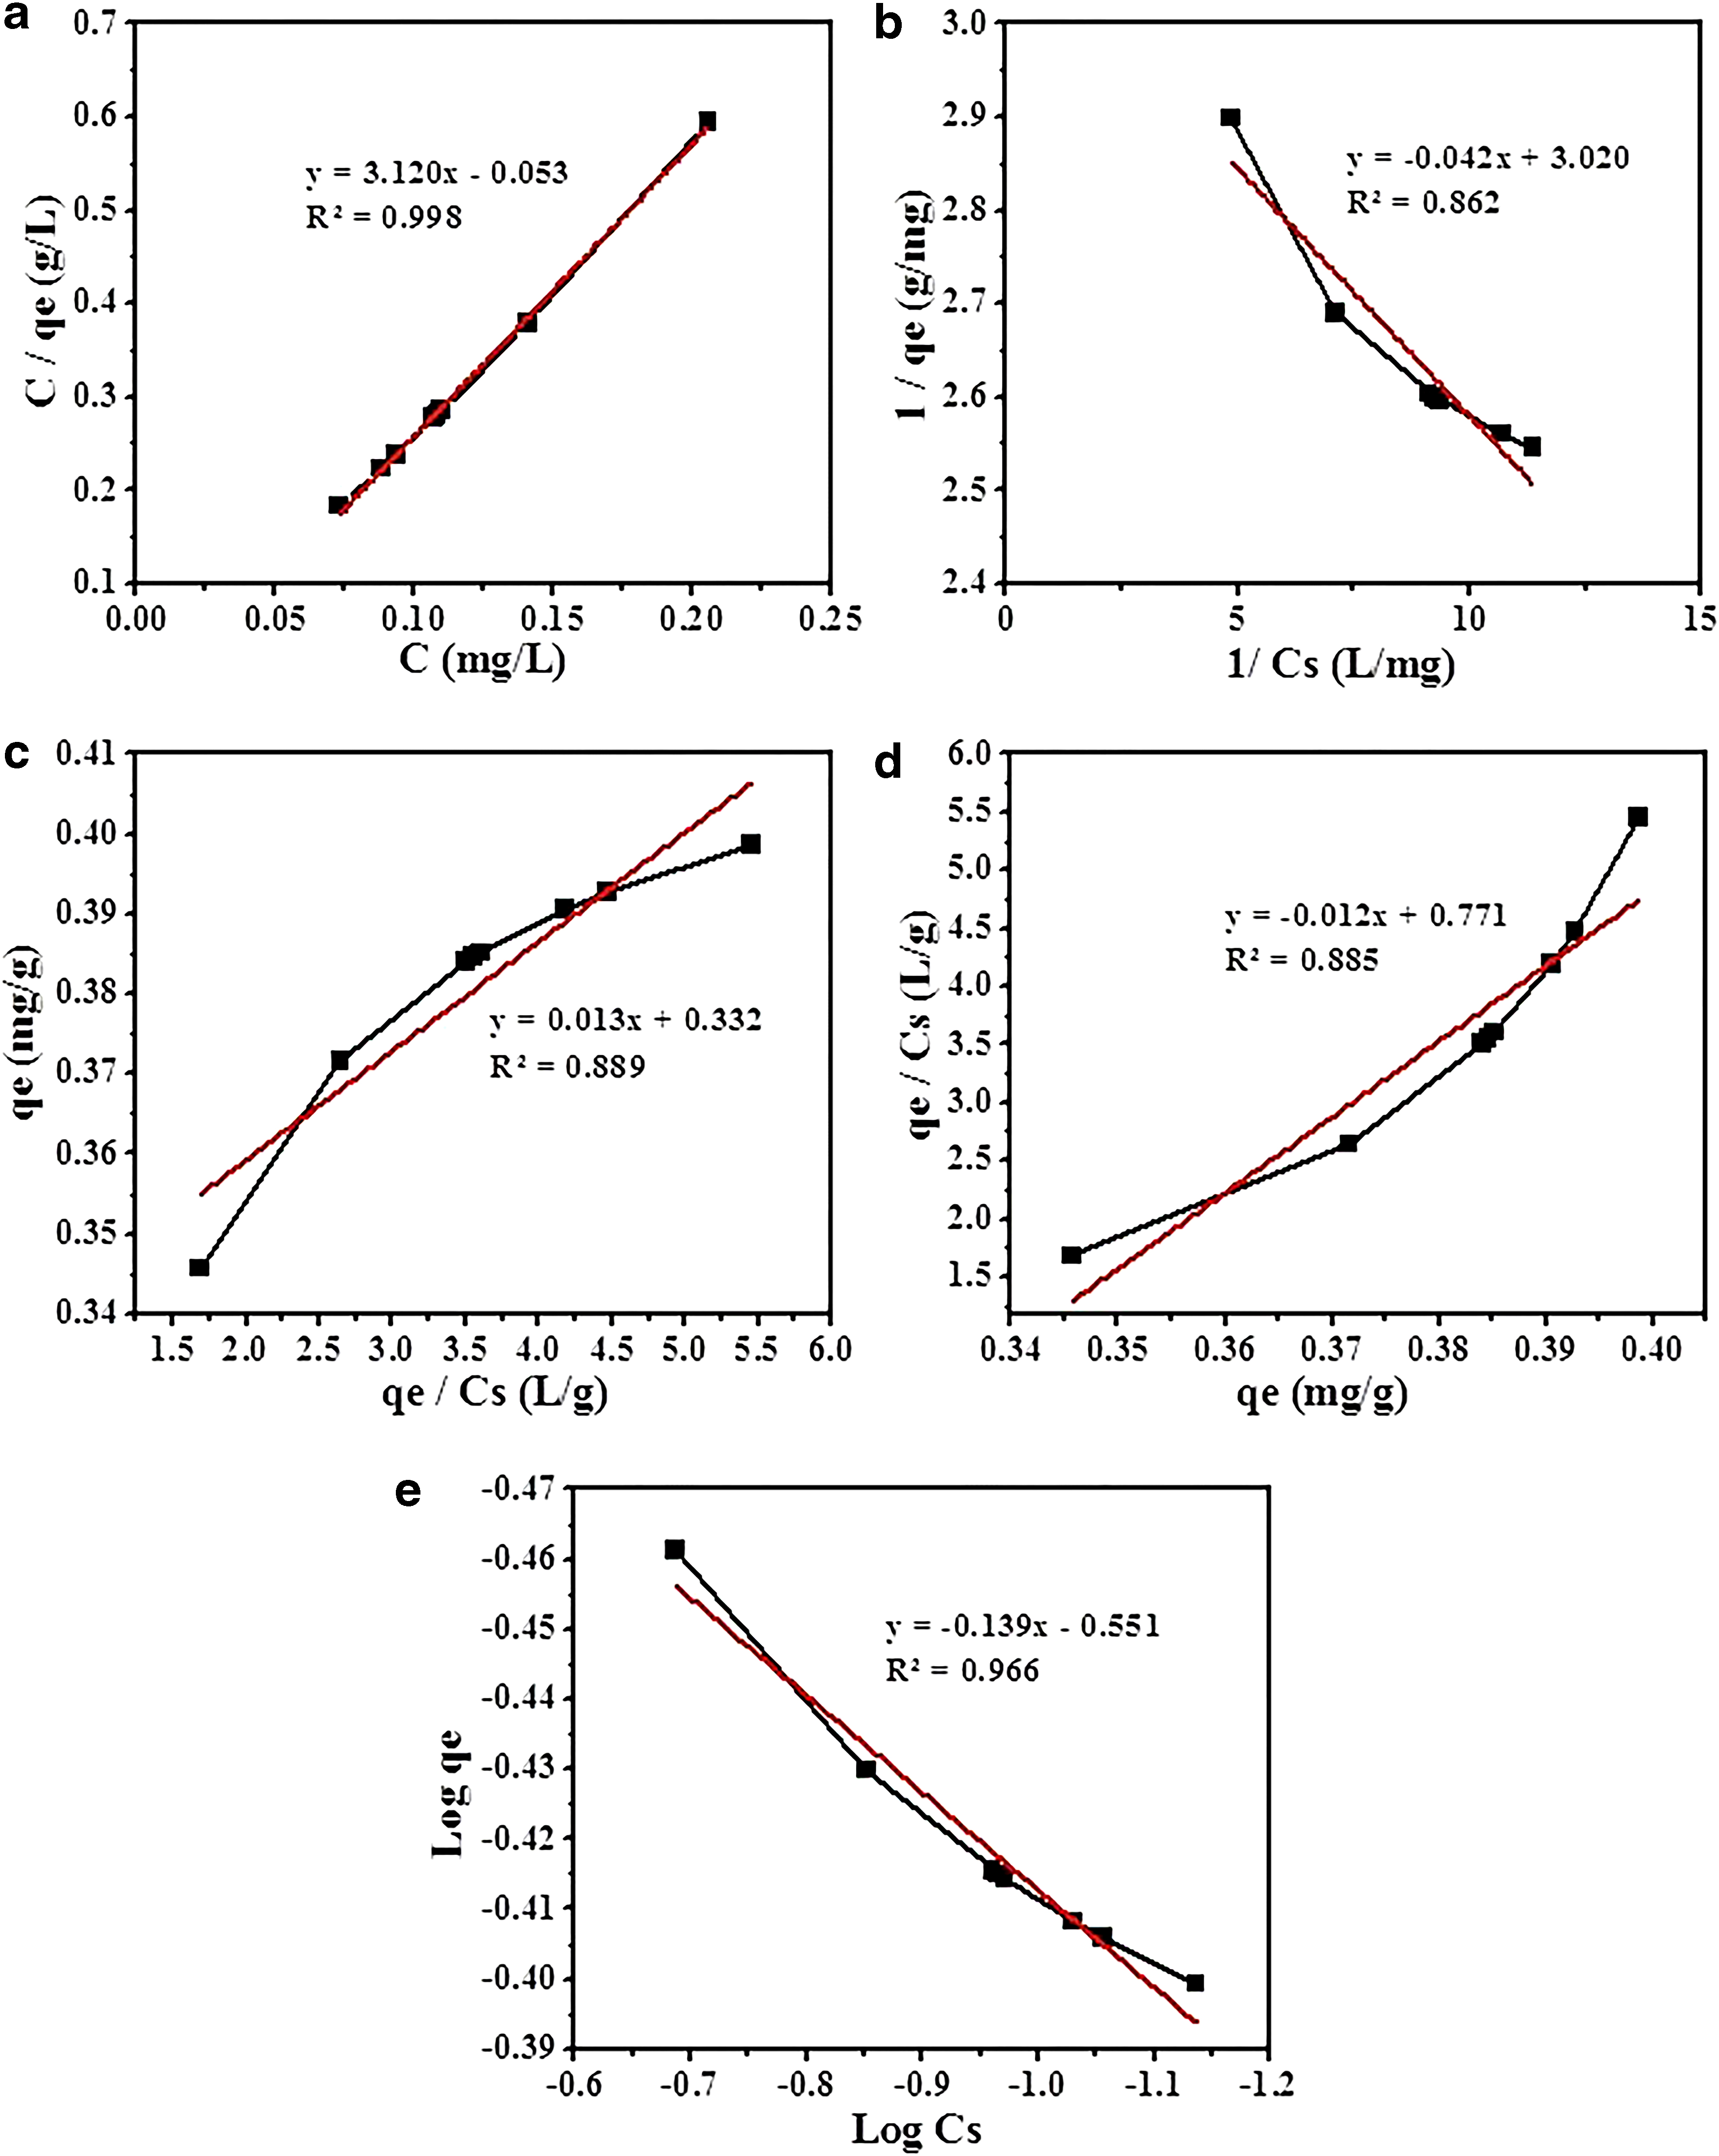
For evaluation of adsorption isotherms, the isotherms with linear forms are considered to be most suitable for experimental data, which are frequently used with different error functions. The Langmuir model was performed by analyzing the experimental data. For confirmation of the fitness of this model, all types of Langmuir isotherms were used for the assessment of equilibrium data, in which the linear expression of Langmuir-type (I) is often used to study the experimental data as reported earlier (Altundogan et al., 2007; Liang et al., 2010). Langmuir constants regarding all types of linear equilibrium sorption and the saturated monolayer sorption capacity “qe” of PSAL were found out from intercepts and slopes of plots of (Cs and Cs/qe,), (1/qe and 1/Cs), (qe and qe/Cs), and (qe/Cs and qe), respectively, which are summarized in Table 2.
Langmuir Adsorption Isotherm Values for Methylene Blue by Powdered Saccharum arundinaceum Leaves at 30°C
SSE, sum of squared error.
The Table 2 validates that the evaluated parameters for every one form of linear equations (Langmuir) are unlike having various values of coefficient of determination (R2), which are also shown graphically as in Fig. 3a–d. Comparatively, among all other linear isotherms of Langmuir, the resulted error functions, chi-square test (χ2), sum of squared errors (SSEs), and R2 values reveal that the Langmuir type-I isotherm is found to be the best fit. Therefore by considering the adsorption as monolayer, the adsorption of each adsorbate molecule onto surface of adsorbent has the same activation energy within significant interaction among sorbent and sorbate.
A separation factor (RL), which is a dimensionless constant and is also a characteristic of the Langmuir isotherm (Hameed et al., 2007; Abdel-Ghani et al., 2008), can be articulated by the equation given as:

The C0 (mg/L) is the maximum MB dye concentration, KL (L/mg) is the Langmuir constant, and values of RL represent the isotherm's shape, linear (RL = 1), favorable (0 < RL < 1), unfavorable (L > 1), or irreversible (RL = 0). The value of RL estimated from this Eq. (3) is also provided in Table 2, in which the RL value is less than unity (0.847), demonstrating that the process is favorable for MB dye adsorption against PSAL, and the data fit the Langmuir isotherm model, which indictes that PSAL is a good adsorbent for MB dye.
Freundlich adsorption isotherm
For heterogeneous surface adsorption characteristics, this type of isotherm is generally used as reported earlier (Hutson et al., 2000). The equation offered by Freundlich is given as

In this equation, Kf (mg/g) is a constant for Freundlich isotherm, n for the intensity of adsorption, Cs (mg/L) for an equilibrium adsorbate concentration, and qe (mg/g) for an equilibrium adsorbent concentration.
For measuring R2 (coefficient of determination), a linearized Eq. (5) is given to plot a graph between log qe and log Cs as

where Kf (Freundlich adsorption constant) and 1/n (Freundlich exponent) were calculated from the slope and intercept of the plot as shown in Table 3 and also graphically represented in Fig. 3e. The constant Kf is considered to be a rough indicator of adsorption capacity and 1/n as a function of adsorption strength (Voudrias et al., 2002). This means that when n is equivalent to 1, in that case the partition is thought out to be independent of the concentration between the two phases. When the 1/n value is <1, there will be normal adsorption, and when the 1/n has greater value than 1, then there will exist adsorption as cooperative (Mohan et al., 1997). Similarly 1/n is a heterogeneity parameter; when smaller is the 1/n, greater is the expected heterogeneity. When 1/n is equal to 1, the expression is reduced to a linear adsorption isotherm. The existence of n value in between 1 and 10 indicates that the sorption is favorable (Goldberg, 2005). “n” and “Kf” are characteristic parameters of the sorbent–sorbate system and can be determined by data fitting. Similarly the regression in linear form is also used to find out the parameters of isotherm models and their kinetics (Saba et al., 2016). In particular, linear transformed equations and linear least-squares method have been generally applied to correlate sorption data.
Freundlich Adsorption Isotherm Values for Methylene Blue by Powdered Saccharum arundinaceum Leaves at 30°C
In our experimental work, the values obtained for n = 7.194 and for 1/n = 0.139 (data provided in Table 3) indicate that the MB sorption onto PSAL is favorable having R2 value of 0.966. It is concluded from Tables 2 and 3 that Freundlich isotherm has higher values of error functions compared to Langmuir isotherms of type I and type III, although they have less value of error functions compared to Langmuir isotherms of type II and IV. So it is believed that linear Langmuir adsorption isotherms of type I and type III are more suitable concerning the experimental data in comparison to Freundlich linear isotherm of adsorption. However, on the contrary, the Freundlich isotherm having less error function compared with Langmuir isotherms of type II and IV is recognized to be more suitable in the narrative of the biosorption process. Therefore, in the matter of Langmuir type I and III, the monolayer coverage, according to the theoretical postulation of Langmuir, is more applicable for MB biosorption onto PSAL compared to other types of Langmuir linear isotherms of adsorption.
Lagergren Models of the pseudo-first and second-order kinetics
The pseudo-first and pseudo-second order rate equations were used to study the kinetics of MB adsorption onto PSAL. For examination of experimental data, the initial MB concentration of 20 mg/L was taken and followed the linearized-integral form of the pseudo first-order model as given in Eq. (6)

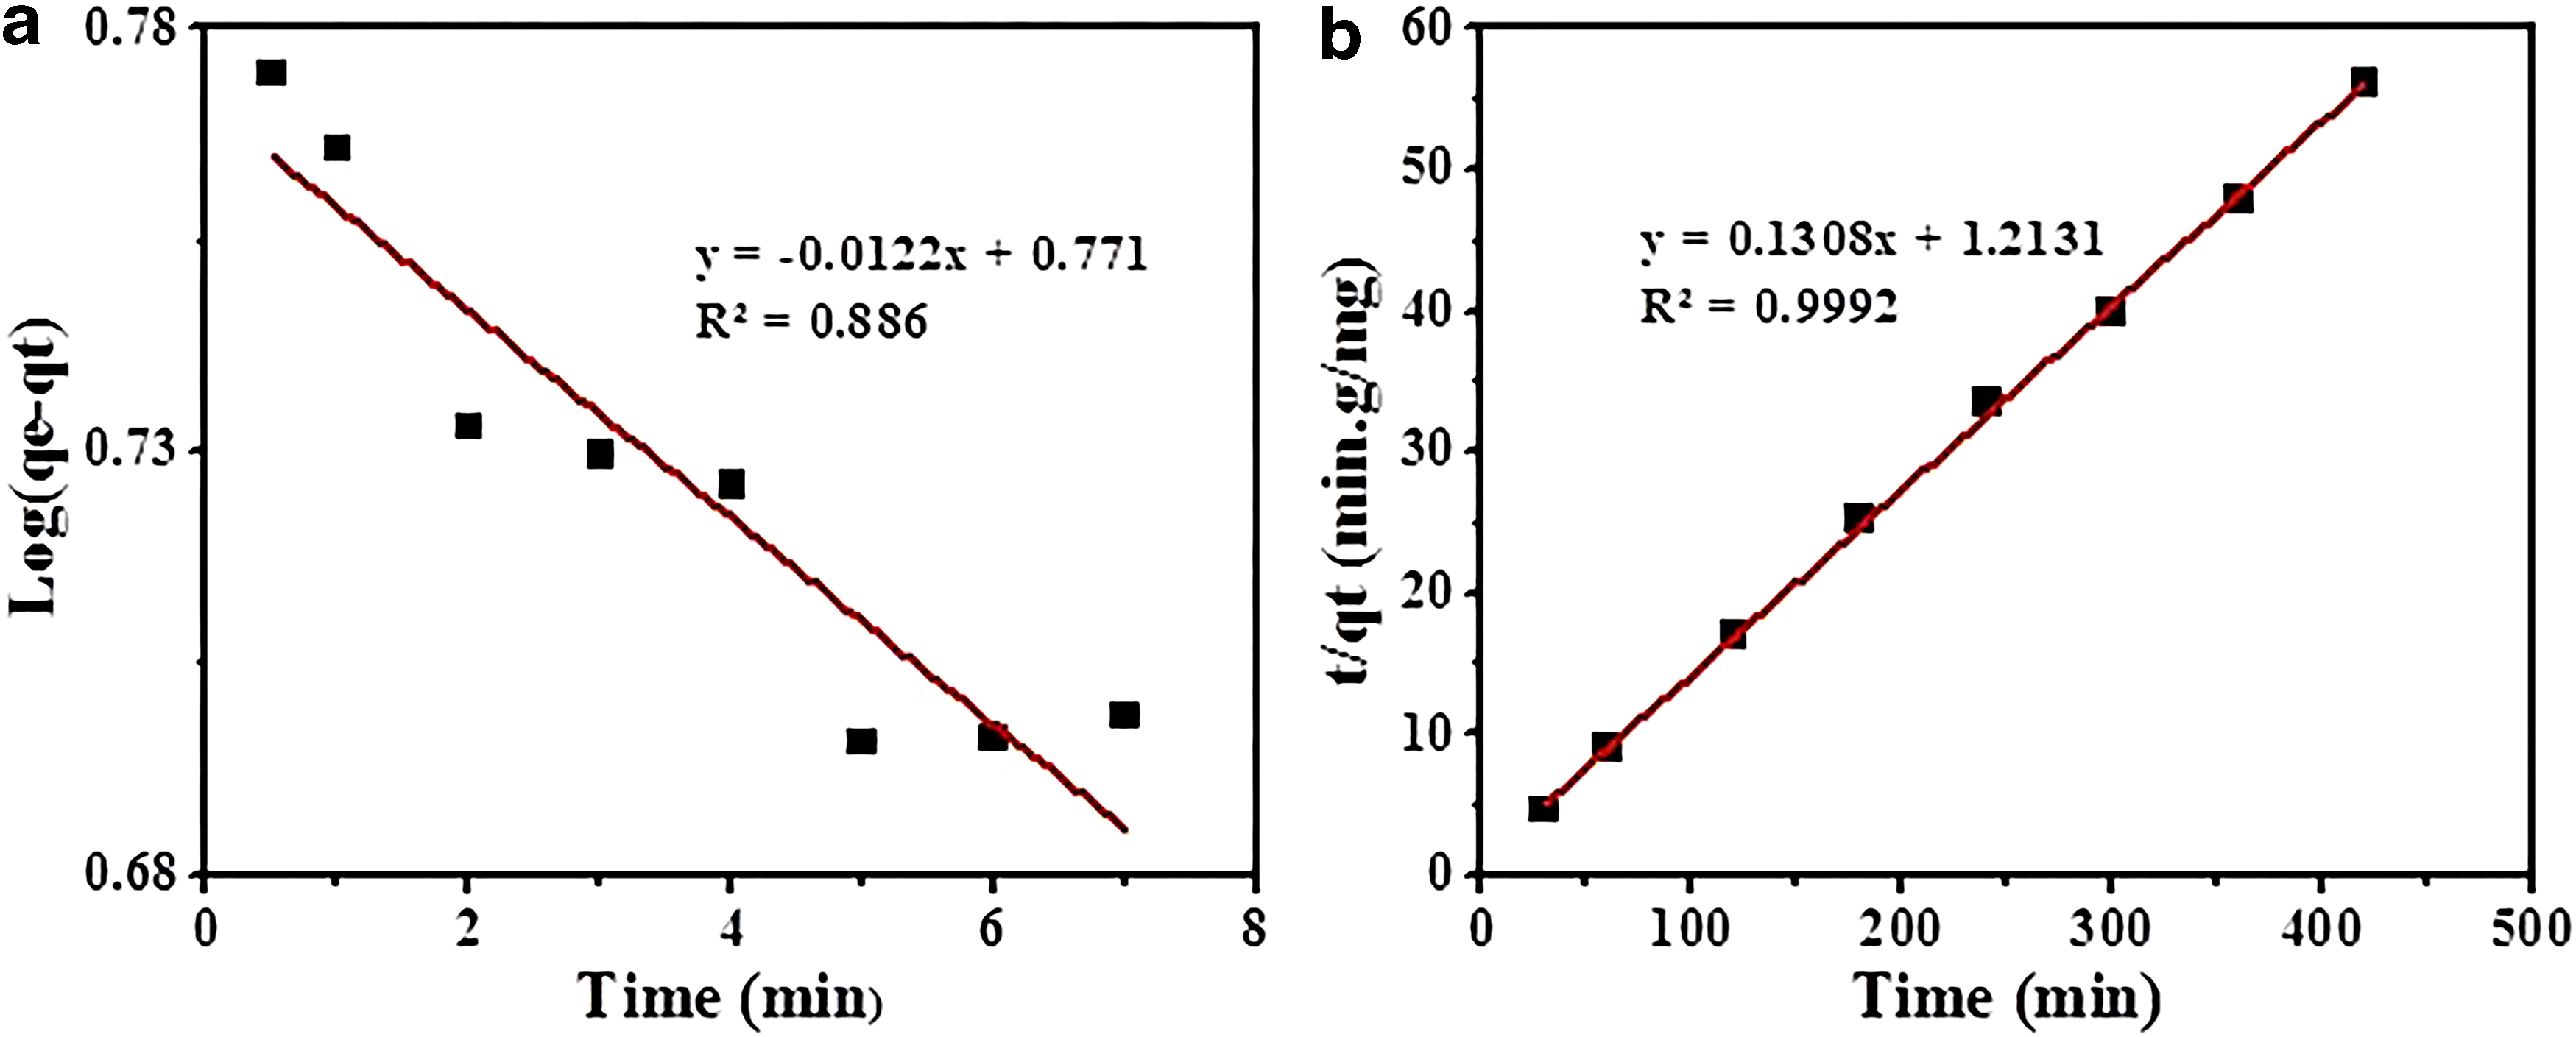
Where k1 (1/min) is the Lagergren adsorption rate constant; qe and are the dye-adsorbed quantities at equilibrium and at time t (min). The parameter k1 was inferred from the regression of log (qe − qt) with t as shown in Fig. 4a, and similarly, the values of kinetic parameters are shown in Table 4. (qe) and calculated (qe) values are with no agreement to each other along with low value of coefficient of determination (R2). It means that the MB adsorption onto PSAL does not follow the pseudo-first order kinetic model.
Comparison of the Pseudo-First and Pseudo-Second-Order Adsorption Rate Constants and the Calculated and Experimental qe Values for Methylene Blue Initial Dye Concentration by Powdered Saccharum arundinaceum Leaves
Similarly, the linearized-integral form of pseudo-second-order model was also performed, which is given in Eq. (7)

Where k2 (g/mg·min) is the pseudo-second-order rate constant that is determined from the intercept of plotting t/qt versus t, as given in Fig. 4b, and the kinetic values are tabulated in Table 4. The value of R2 (coefficient of determination) is equal to 0.99, showing that the adsorption of MB onto PSAL fits the pseudo-second-order model. The value of coefficient of determination for first order kinetics is <0.99. The obtained R2 value is greater or equal to 0.99, which indicates second order kinetics for the adsorption phenomena. Similarly smaller value for SSE also confirms that the adsorption is of second order (Hameed et al., 2007).
Intraparticle diffusion study
The diffusion mechanism cannot be identified by means of the pseudo-first and second-order kinetic models, but can be estimated through the model of intraparticle diffusion because the structure of solid and rate of transport control its interaction with diffusion. The transport procedure means that the movements of adsorbate species are associated with a solid phase (adsorbent) from the bulk solution. The intraparticle diffusion model is often used as a limiting step to explain the adsorption mechanism occurring on a porous adsorbent during well-stirred batch adsorption process. So, intraparticle diffusion mechanism for MB dye adsorption onto PSAL was also studied, and it is anticipated from the results that the MB dye sorption by PSAL is directly proportional to the square root of the contact time (). The intraparticle diffusion equation proposed by Weber and Morris (Weber et al., 1963; Crini, 2006) is given as in Eq. (8):

where qt means the mass of dye adsorbed per unit mass of biosorbent (mg/g) at time t, as well as means the rate constant (mg/g·min−1/2) of intraparticle diffusion, which is obtained from the slope of straight line by plotting qt against , as shown in Fig. 5. The R2-values represent the application of this model as R2 = 0.979 approaches unity (Banerjee et al., 1997). The intercept of the plot gives a reflection of boundary layer thickness, that is, when intercept is larger, larger will be the effect of boundary layer (Kannan and Sundaram, 2001). Thus, the rate determining step is exhibited by the applicability of intraparticle diffusion model.
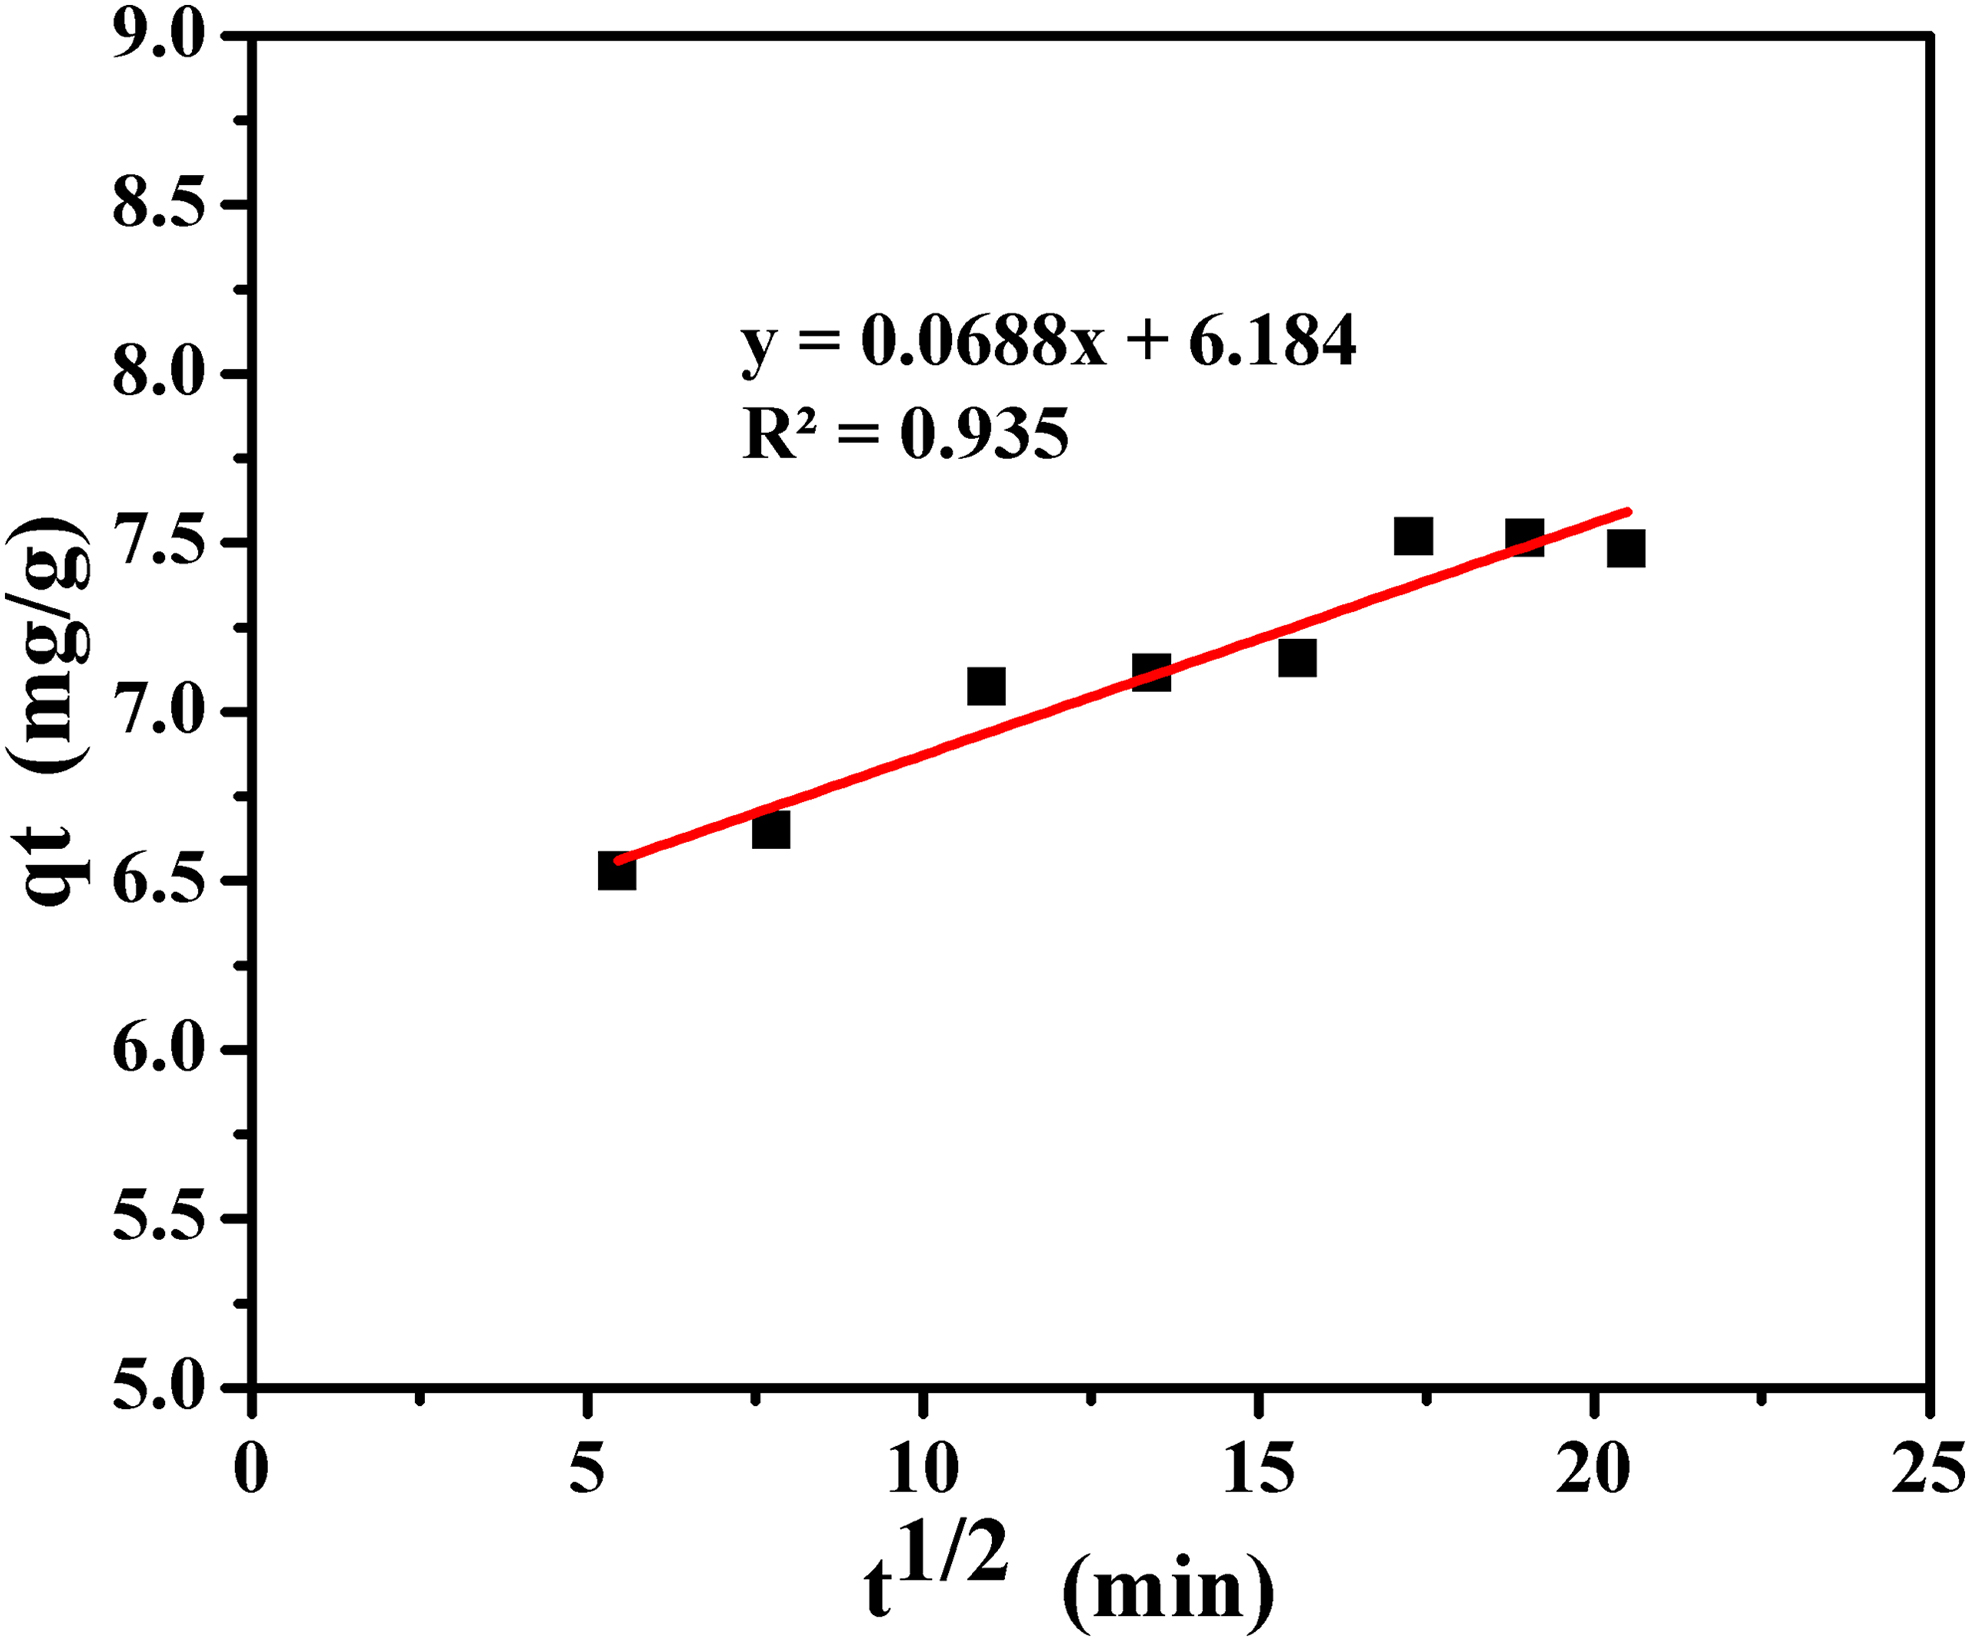
Intraparticle diffusion plots for adsorption of MB on PSAL.
Dye adsorption mechanism
Understanding of MB dye adsorption mechanisms on adsorbent is a very important task. The structural composition of adsorbent and its surface functionalities are very essential to know. For this purpose, FT-IR spectroscopic (which is a helpful instrument for learning the interaction between an adsorbate and adsorbent (Ahmad et al., 2012) analysis given in Fig. 1b indicates that the selected biosorbent sample having various ketonic, carboxyl, hydroxyl, and amino groups is apparent to interact chemically in between the adsorbent and cationic dye in which, due to mechanical interaction, the dye penetrates to the microstructure of the adsorbent.
The mechanism of dye adsorption onto adsorbent involves migration of dye molecules:
Where, at first stage, the dye ions from the bulk of the solution start migration toward the surface of the adsorbent. While, in the second stage, the dye ions present on the surface of the adsorbent can make their diffusion through the boundary layer. Finally, in the last stage, the dye ions may develop surface hydrogen bonding with hydroxyl groups present in the biomass sample. Therefore, the proposed mechanism can be represented as follows

Where the sample biomass means PSAL. The intraparticle diffusion of dye ions occurs in the final stage, and as a result, dye ions move toward the inside of the apertures of adsorbent.
Conclusion
In this work, S. arundinaceum as a native grass of district Bannu, Khyber Pukhtunkhwa, Pakistan and abundantly available was successfully used for MB dye adsorption purposes. The physicochemical parameters were investigated at equilibrium sorption under neutral pH and at 30°C. The obtained sorption data were subjected to fit into isotherms of Freundlich and Langmuir. The equilibrium data were best characterized by the Langmuir isotherm (R2 = 0.998). The separation factor, RL, derived from the Langmuir isotherm and the adsorption intensity “n” from the Freundlich isotherm confirmed sorption favorability. The sample shows a high efficiency for the adsorption of MB, with a maximum adsorption capacity of 25.4 mg/g. Therefore, PSAL is found to be a potent and effective adsorbent for removing dyes from industrial effluents. The work is novel, and the sorbent can be utilized in composite packed filteration assembly for removing dyes from industrial waste.
Footnotes
Author Disclosure Statement
No competing financial interests exist.
Funding Information
The present work is supported by Higher Education Commission Pakistan for the promotion of Science and Technology under the National Research Program for Universities (NRPU) project no. (20-1878/R&D/11/1001).