
Abstract
Soil is inevitably affected by highway construction, resulting in a large volume of bare soil exposed to degradation. As an increasingly important and demanding area, identifying and assessing soil quality and stability on highway slopes are important for ecological management. In this study, principal component analysis, clustering analysis, and integrated matter-element model were used to evaluate the effects of highway slopes (embankment slopes [ES] and cutting slopes [CS]) on soil nutrients in the Qinghai-Tibet Plateau using grassland soil (GS) and natural slopes (NS) as controls. Our results show that, compared to NS, soil pH was significantly higher under GS, while ES and CS had no significant effect. Compared with NS, soil total nitrogen (TN) results for ES and CS recorded declines of 26.58% and 40.77%, respectively; TN increased by 263.04% in GS. Compared with NS, soil total phosphorus results declined by 25.44%, 34.37%, and 11.45% in GS, ES, and CS, respectively. Our results suggest that bare soil on highway slopes can be prone to degradation over time, and they have a negative effect on the accumulation of nitrogen and phosphorus in the soil nutrient status of slopes in the Qinghai-Tibet Plateau. Findings from this study will increase current understanding of soil nutrient responses to slope disturbance for high-cold highway slopes.
Introduction
An increase in urban development in China has resulted in the expansion of major infrastructure construction projects, with highway construction recording a significant increase (Fu et al., 2018; Li et al., 2018a).
The total length of highways in the Tibet autonomous region has increased from 15,852 km in 1978 to 89,343 km in 2018 (Lu, 2018). Large-scale highway construction with cut and fill operations has created a number of bare slopes, resulting in the occurrence of slope failures and a loss of slope vegetation biodiversity (Al-Homoud and Al-Masri, 1999; Chen et al., 2014b; Zhang et al., 2018). Ecosystem damage due to the construction of highway slopes in temperate subtropical regions has been recorded to take at least 20 years for natural grass to shrub succession to resume (Guo, 2007; Tan, 2014). This is especially true for the Qinghai-Tibetan Plateau, where extreme ecological conditions pose an additional constraint (Zhong et al., 2003). The majority of previous studies have focused on the design of embankment slopes (ES) and cutting slopes (CS) (Al-Homoud and Al-Masri, 1999; Hernando and Romana, 2015), with few studies examining the late ecological recovery of highway slopes. Previous studies in the permafrost regions of the Qinghai-Tibetan Plateau have predominantly focused on soil stability (Ma et al., 2006; Wang et al., 2014; Niu et al., 2016a; Zhang et al., 2016; Luo et al., 2018) and humidity characteristics (Niu et al., 2005; Cao et al., 2017). Studies examining differences in soil nutrient characters of highway slopes at high-altitude areas are sparse (Zheng et al., 2018). Therefore, understanding the evolution of soil nutrients in highway slopes after construction is important to evaluate feedback between soil nutrient cycles and local natural ecosystem restoration.
A number of methods are available to identify common soil nutrient characteristics, and they can be roughly categorized into two categories: linear dimensional reduction methods (principal component analysis and clustering analysis) (Sun et al., 2003; Tang et al., 2005; Zhang et al., 2013; Zhao et al., 2013; Chen et al., 2014a) and integrated matter-element model (Tang et al., 2008, 2009; Wang et al., 2009; Zhao et al., 2014). Linear dimensional reduction methods not only simplify original variables but also eliminate the mutual influence among multiple indices, for example, pH, soil organic matter (SOM), total nitrogen (TN), alkali-hydrolysable nitrogen (AN), total phosphorus (TP), available phosphorus (AP), total potassium (TK), and available potassium (AK). Integrated matter-element model has strong objectivity and pertinence, and they can be used to solve some fuzzy problems that are difficult to judge. Although all of the methods have been used to evaluate soil nutrients, limitations exist: (1) the workload of principal component analysis is heavy; (2) cluster analysis results ignore the practical importance of indicators; and (3) the evaluation standard of the integrated matter-element model is not easy to determine (Tang et al., 2009; Zhang et al., 2013; Chen et al., 2014a). To overcome these limitations, we have used three methods to assess soil nutrients in highway slopes at high altitudes.
Due to the particularity of the ecological environment of the Qinghai-Tibetan Plateau, studies on the status and influencing factors of nutrient contents in different highway slopes in this region have provided a scientific basis for promoting alpine ecosystem restoration. The aim of this study, therefore, is to identify and assess the nutrient status of unrepaired cutting and ES soils to improve soil quality and slope stability. Findings from our study will provide theoretical and practical reference for the restoration of slopes in the Qinghai-Tibetan Plateau. The specific objectives of this study are as follows: (1) to identify factors limiting soil nutrients in highway slopes and (2) to identify key indicators, such as TN and TP, to improve the technology of slope restoration in the Qinghai-Tibetan Plateau. Soil erosion induced by low-temperature freeze-thaw circulation in areas of high altitude often indirectly result in nitrogen deficiency (Wang et al., 2017). As SOM also predominantly depends on soil decomposition degree and turnover rate (Guan et al., 2018), we hypothesize that highway slopes will induce less SOM and nitrogen accumulation.
Methods
Study area, experimental design, and soil sampling
This study was undertaken on the S202 roadway in Lhünzhub county, located in Lhasa city in the Tibet Autonomous Region, China (29°53′4″ N, 91°6′9″ E). The study site has an average elevation of 3,860 m and has a plateau temperate semiarid monsoon climate. It is located in the middle reaches of the Brahmaputra river valley, having a flat and broad terrain. The study site is the major grain production base in Lhasa city. Average, maximum, and minimum air temperatures for this area are 5.8°C, 35.0°C, and -13.2°C, respectively. The freezing period extends from December to March. Annual average precipitation is 421.1 mm, with the highest rainfall recorded between June and September. Annual average evaporation is 2,172.0 mm, annual sunshine duration is around 3,000 h, and the annual frost-free period is around 120 days.
The S202 roadway was renovated in March 2013. The highway reconstruction project belonged to the reconstruction project of the old gravel roadbed, and the land use type along the project was mainly grassland. Soil type was dominated by sandy loam (Lian et al., 2019), with the parent material being sand shale. Ecological restoration of selected slopes was not carried out due to funding problems. Dominant vegetation included Sabina pingii (Cheng ex Ferre) Cheng et W.T. Wang., Salix cupularis L., and Spiraea mollifolia Rehd. Three slope types (three slopes per type were examined) were selected for investigation: natural slopes (NS), ES, and CS. Since land use on the study area was grazing, grassland soil (GS) was selected as the comparison; GS was randomly collected within a 2 km range from the S202 roadway (Fig. 1):
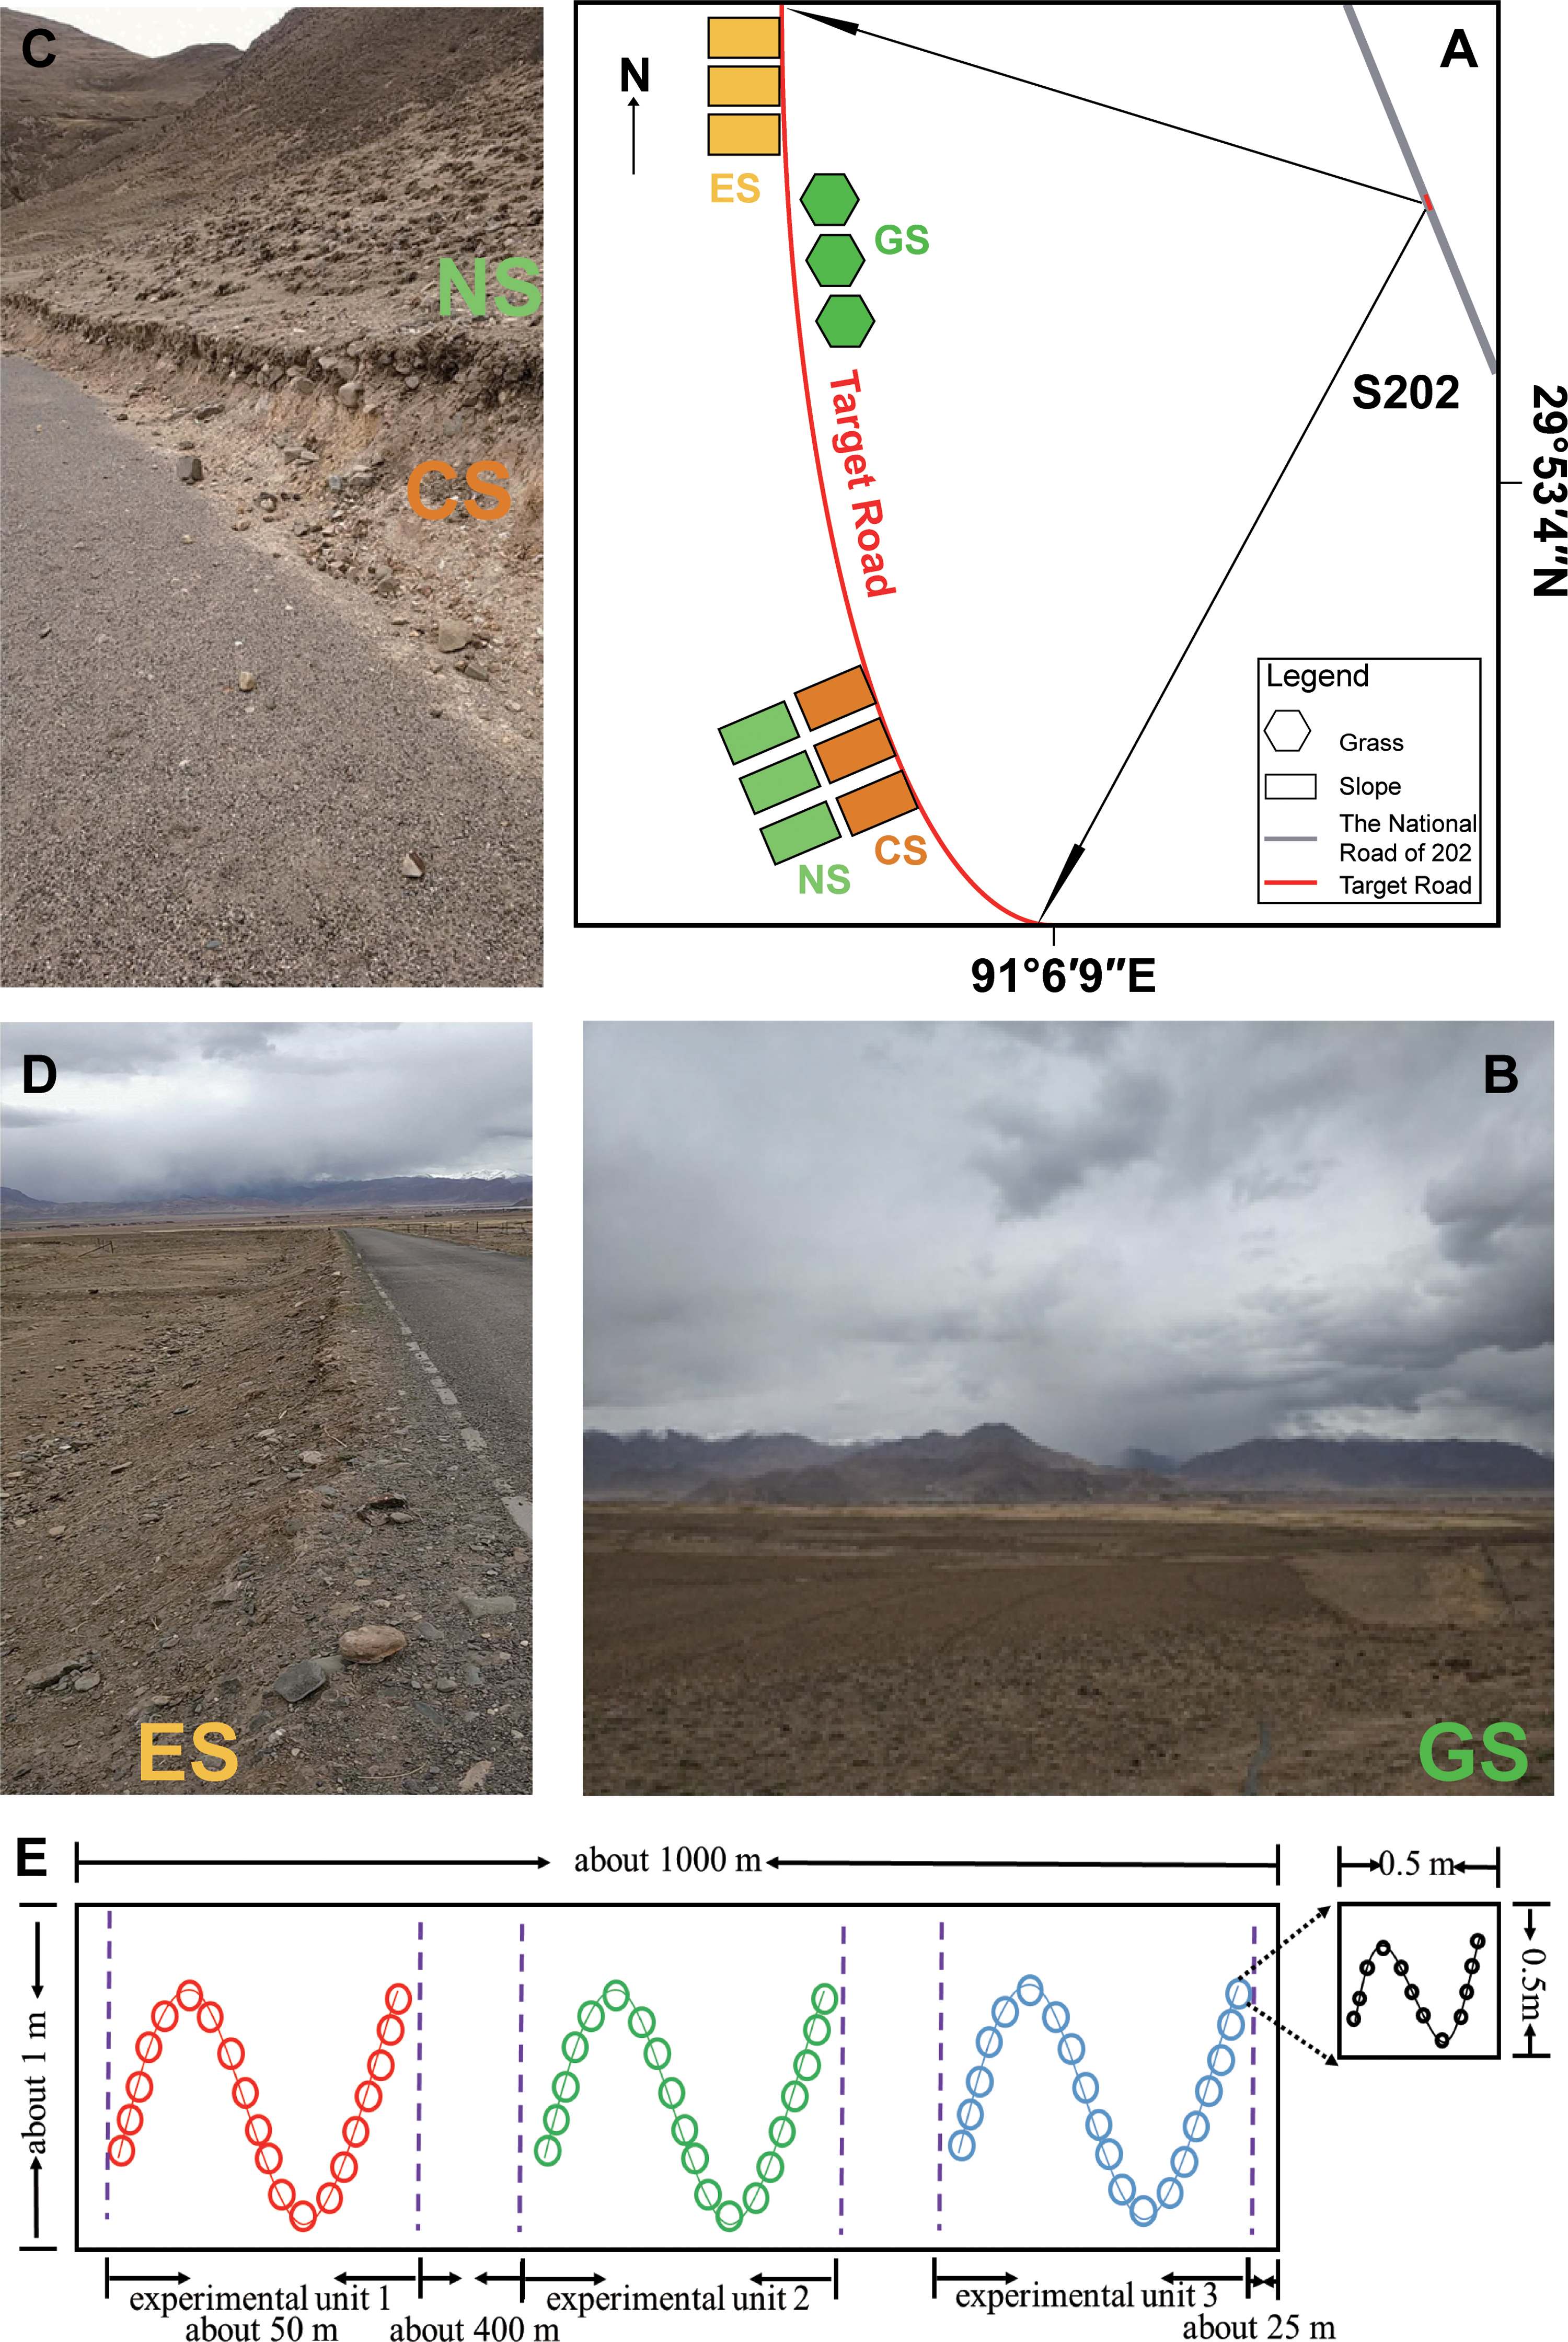
Detailed locations of the study areas and distribution of the sample sites.
GS (n = 3), used for grazing.
NS (n = 3), the original slopes.
ES (n = 3), the ES were naturally restored.
CS (n = 3), the slopes were cut and excavated for natural recovery.
A simple experimental design with four soil types was used for this study. All samples were collected using an S-shaped sampling strategy along the S202 highway in May 2017 (Fig. 1). Each slope included three replicates (∼2 kg, 0–8 cm depth), and the interval between each replicate was about 400 m. Each replicate sample (50 × 1 m) was collected from 20 points, with each point (0.5 × 0.5 m) consisting of 12 mixed soil samples (Fig. 1E). In addition, soil bulk density (BD) was estimated using three randomly collected soil core samples (stainless steel cylinders with a volume of 100 cm3 and a depth of 5 cm) on each slope type and on the grassland. The vertical height of the selected slopes was ∼1 m, inclined by ∼40°. The length of the sampled slopes was ∼1,000 m. To prevent water evaporation, soil samples were bagged in polyethylene valve bags immediately after collection. After the samples were transferred to the laboratory, gravel, animal, and plant debris were removed from the samples before they were air-dried and manually screened through sieves. Sieves used for determining different nutrient parameters differed: 0.149 mm sieves were used for SOM, TN, TP, and TK, and 1 mm sieves were used for AN, AP, and AK.
Soil analysis
All soil analyses were undertaken using standard methods. BD was estimated by calculating sample mass and volume using an oven drying technique (Li et al., 2018a). SOM was analyzed using the rapid dichromate oxidation method (Wallace and Terry, 1998). Soil pH was determined using a pH meter with a soil:water ratio of 1:2.5 (Lane and Kawahara, 2015). TN was estimated using the micro-Kjeldahl method (Jackson, 1958). AN was measured using diffusion and alkaline hydrolysis (Qi et al., 2018). TP was determined using concentrated sulfuric acid and perchloric acid as extractant liquids (Parkinson and Allen, 1975). AP was analyzed using the Olsen method (Emteryd, 1989). TK was measured by flame photometry (Ren et al., 2019) and AK was extracted using an ammonium acetate solution (1 mol/L) adjusted to pH 7.0 (Simard, 1993).
Data analysis
All statistical tests were analyzed and plotted using SPSS 16.0 (SPSS, Inc., Chicago, IL), R version 3.2.5, and SigmaPlot 12.0 (Systat Software, Inc.), respectively. Differences among mean values for the soil types were determined using one-way analysis of variance with a least significant difference test. Significant levels were set at p < 0.05. See the detailed method of integrated matter-element model in Table 1, Table 2, Supplementary Table S1, and Supplementary Table S2.
The Soil Nutrient Classification Standard of the Second National Soil Survey of China
AK, available potassium; AN, alkali-hydrolyzable nitrogen; AP, available phosphorus; SOM, soil organic matter; TK, total potassium; TN, total nitrogen; TP, total phosphorus.
Source: Liu (2012).
Weight of Soil Nutrient Evaluation Factors
Source: Ouyang and Yu (2002).
Results
Changes in soil BD and pH
Results from our study indicate that the construction of highway slopes resulted in a change in soil BD and pH (Fig. 2A, B). Compared with NS, soil BD decreased on CS (30.10%; p < 0.05) and increased on GS and ES (4.79% and 12.35%, respectively; p > 0.05) (Fig. 2A). In addition, soil pH in NS, ES, and CS (6.83, 6.84, and 6.90, respectively) was significantly lower than that in GS (7.37, p < 0.05) (Fig. 2B).
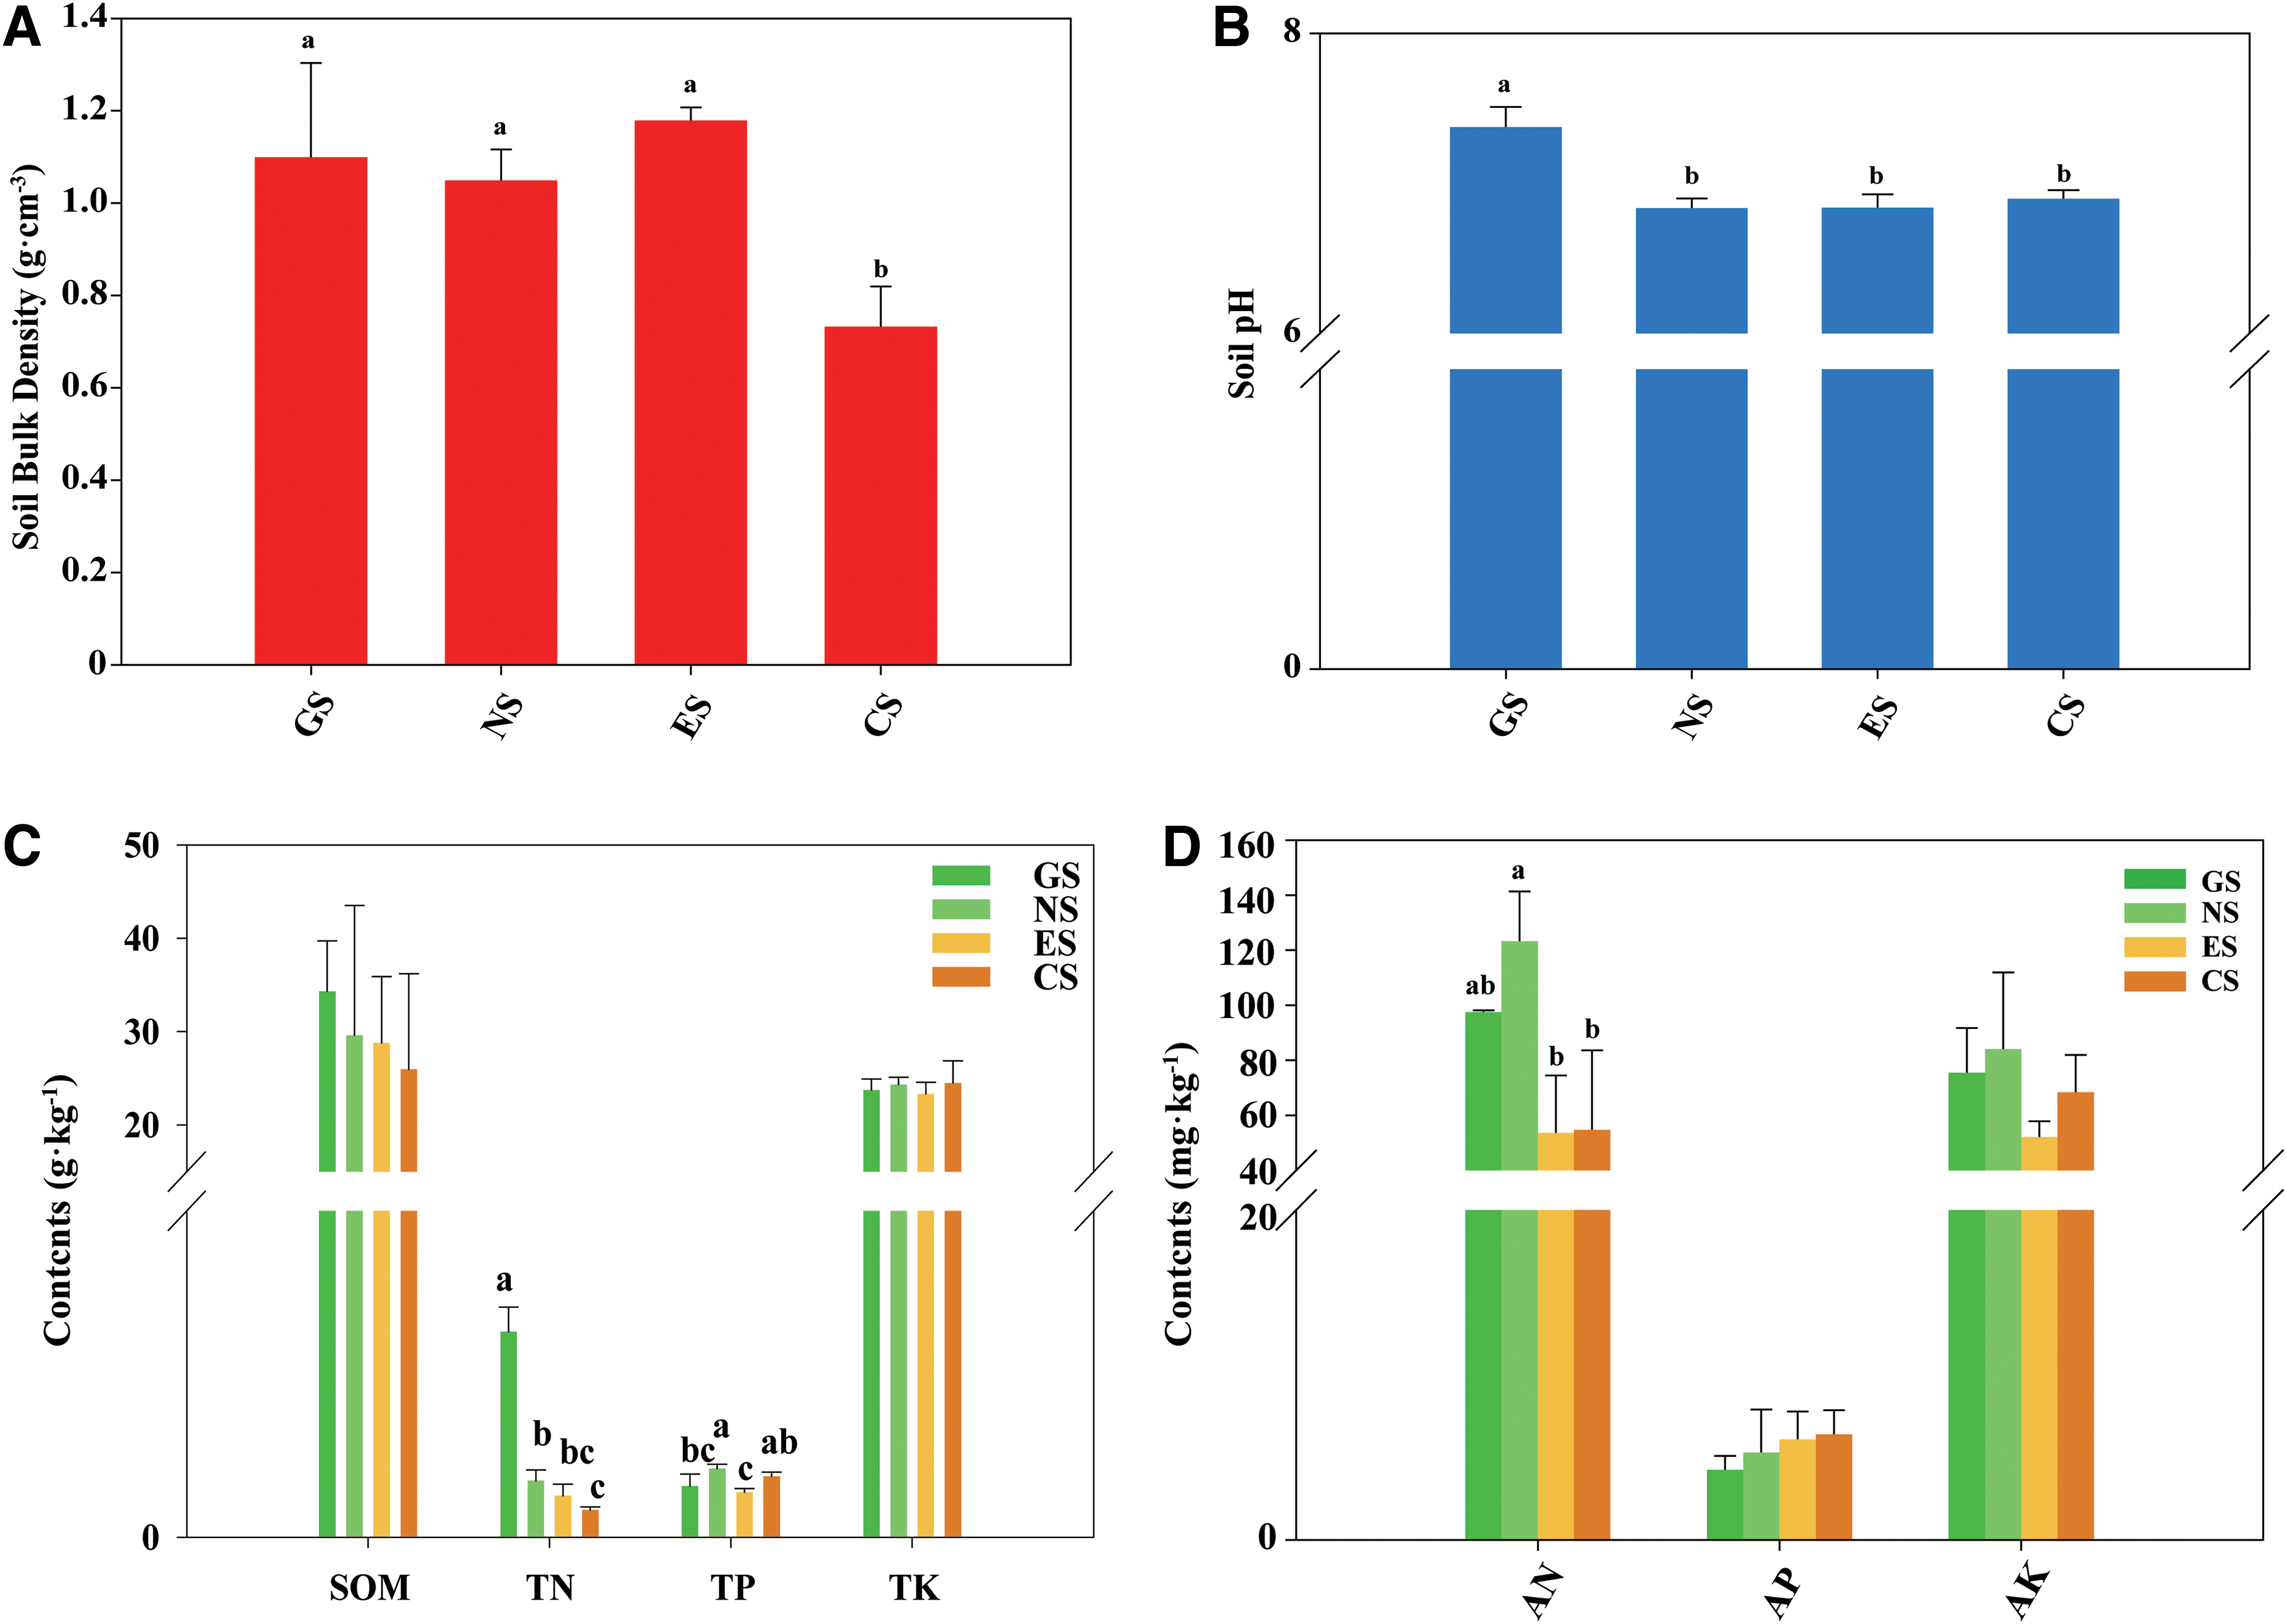
Changes of soil bulk density, soil pH, and soil nutrients under different treatments. Different treatments include GS, NS, ES, and CS. Vertical bars represent standard deviation of the mean (n = 3). Different letters indicate significant differences among treatments (p < 0.05, one-way ANOVA, post hoc LSD test).
Changes in soil nutrients
Our results indicate that GS, ES, and CS had no significant effect (p > 0.05) on SOM, AP, TK, and AK content compared with NS (Fig. 2C, D). Compared with NS, soil TN results for ES and CS recorded declines of 26.58% (p > 0.05) and 40.77% (p < 0.05), respectively; GS recorded an increase of 263.04% (p < 0.05) (Fig. 2C). In contrast, soil AN recorded declines of 20.90% (p > 0.05), 56.51% (p < 0.05), and 55.61% (p < 0.05) in GS, ES, and CS, respectively, compared to NS (Fig. 2D). Soil TP results recorded a decrease of 25.44% (p < 0.05), 34.37% (p < 0.05), and 11.45% (p > 0.05) in GS, ES, and CS, respectively, compared with NS (Fig. 2C).
Principal component analysis and cluster analysis
Three principal components were extracted (having eigenvalues of 3.398, 2.416, and 1.012), according to the principle that the eigenvalue was >1 (Table 3). The cumulative variance contribution rate of the three principal components reached 85.34%, thereby integrating the majority of the soil nutrient information. The contribution rate of primary principal components to total variance was 42.48%, and the donation rates of soil SOM, pH, TN, and AP were the highest (Supplementary Table S3). The contribution rate of the secondary principal component to total variance was 30.20%, and the contribution rate of AN, TP, and AK was the greatest. The contribution rate of the third principal component to total variance was 12.66%, and the contribution rate of TK was the greatest. According to the formula of principal component calculation, the linear combination of the two principal components and the original eight indicators was obtained. The function expression was therefore as follows:
Eigenvalues and Variance Contribution Rates of the Principal Component Analysis
By substituting standardized data into the above formula, the scores of three principal components with different treatments were obtained. The comprehensive score of principal components is the sum of the product of each principal component score and its corresponding contribution rate, that is, F = 0.425 × F1 + 0.302 × F2 + 0.127 × F3. Result for the sort order of the composite scores was GS > NS > CS > ES (Table 4). Compared with GS, the overall principal component score was the highest (0.802) and the integrated principal component ES soil score was the lowest (−0.863).
Composite Scores and Ranking of Various Principal Components
CS, cutting slopes; ES, embankment slopes; GS, grassland soil; NS, natural slopes.
The tree graph (Fig. 3) was truncated according to the distance between the four classes, and the four types of processes were divided into two levels: the first level (GS) was the highest of the principal component composite scores. The second level (NS, ES, and CS) contained the lowest or even a negative principal component comprehensive score.

Cluster figure under different treatments. Different treatments include GS, NS, ES, and CS.
The integrated matter-element model
As highlighted by Tang et al. (2009), material elements can objectively determine each nutrient component of a soil sample and determine the level of each nutrient factor. After calculating the comprehensive correlation of soil nutrients, the soil nutrient grade was judged according to the integrated correlations of the comprehensive soil nutrients (Supplementary Tables S4–S7). Correlation analysis on soil type and soil nutrient levels indicated that there was no nutrition level I in the soil samples (Fig. 4). The soil nutrient rating was GS > NS = CS > ES (Fig. 4).

Soil sample comprehensive correlation calculation results and classification. Different colored circles represented different soil grades. The red circle represented soil trophic grade I. The yellow circle represented soil trophic grade II. The green circle represented soil trophic grade III. The blue circle represented soil trophic grade IV. The purple circle represented soil trophic grade V. The black circle represented soil trophic grade VI.
Results in Figs. 4 and 5 indicate that an imbalance in nutritional content from GS to CS exists. GS (nutrient trophic grade II) was rich in SOM, AN, and TK, lacking TP and AP, indicating that soil nutrient conditions were moderate. The NS (nutrient trophic grade V) was rich in AN and TK, and deficient in TN and TP, indicating that phosphorus was a limiting factor for soil nutrients on NS. The ES (nutrient trophic grade VI) was rich in TK, and lacked TN, AN, AK, and TP. The CS (nutrient trophic grade V) was rich in TK and deficient in TN, AN, and TP. In general, soils with a nutrient trophic grade of V and VI lacked TN and TP. In our study, all soil types were rich in TK. For highway slopes in the ecologically fragile areas of the Qinghai-Tibet Plateau, the soil nutrient status was poor. Except for GS, the other soil nutrient levels were poor and extremely poor, indicating that the soil has been seriously eroded.

Nutrient abundance and deficiency under different treatments. Squares of different colors represent different nutritional conditions. The red square represented soil trophic grade I and II, indicating the soil nutrient is adequate. The pink square represented soil trophic grade III and IV, indicating the soil nutrient is medium. The white square represented soil trophic grade V and VI, indicating the soil nutrient is bereft. All results are inferred from Supplementary Tables S4 to S7.
Discussion
In accordance with previous findings, our results indicate that highway slopes affect soil BD, resulting in a decrease in pH. Although Zheng et al. (2018) suggested SOM to be the main factor for nutrient deficiency in soils in the Qinghai-Tibet Plateau, our findings provide contrary results. Our findings, therefore, did not fully support our hypothesis that SOM will be significantly decreased in the Qinghai-Tibet Plateau due to the construction of highway slopes.
Effects of highway slopes on soil BD and pH
Findings from our study show that highway slopes have a significant impact on soil BD. As soil BD reflects water holding capacity and permeability (Li et al., 2012), it decreases with an increase in the degree of soil maturation and a looser soil structure (Guo et al., 2012). The most obvious differences in all soil types were recorded between the ES (1.18 g/cm3) and the CS (0.73 g/cm3). Although engineering interference might induce soil compaction or decomposition by destroying the original vegetation, altering soil porosity, and destroying soil agglomeration, different construction techniques between ES (compaction) and CS (excavation) may account for these differences (Li et al., 2012; Chen et al., 2016; Huang et al., 2017). This finding requires further investigation.
Our results indicated that soil pH was sensitive to engineering interference, possibly associated to soil parent material (Arbestain et al., 2004; Tan et al., 2007). Firstly, soil or stone slag used in the ES was predominantly sourced from waste slag after excavation of the CS. The process of highway construction resulted in soil in the embankment and CS being sourced from deeper soil layers, resulting in exposure of the sandy shale parent material. As the sandy shale parent material has undergone relatively complete weathering and soil-forming processes, resulting in the majority of salt bases being removed due to desiliconization and aluminization processes, this material resulted in a decrease in soil pH (He et al., 2006). Second, engineering interference destroys native vegetation, affecting soil pH and nitrogen levels in plant materials, thus having an impact on soil pH (Hong et al., 2018). In addition, an increase in soil acidification could result in an increase in cation nutrients being leached from the soil, thereby intensifying the scarcity of some nutrient elements essential for plant growth, ultimately leading to a reduction in plant productivity (Bowman et al., 2008). Due to the addition of a large number of plant residues in later stages, the activity of nitrification bacteria in GS will be suppressed and mineralized nitrogen tends to be ammonified, resulting in an increase in soil pH (Hong et al., 2018).
Effects of highway slopes on soil nutrients
Compared with GS, our results indicated that highway slopes had no significant impact on the contents of SOM, AP, TK, and AK. Pan et al. (2012) recorded highway slopes to have no effect on SOM content. Reasons for our findings may be attributed to low temperatures alleviating the decomposition of SOM and the acidic soil environment being favorable for SOM storage (Tavakkoli et al., 2015; Guan et al., 2018). Ma et al. (2013) recorded Beijing-Chengde third-phase freeway slopes to have a relatively rich level of AP (90.82%). As soil-soluble AP was fixed as insoluble phosphorus, becoming AP in an alkaline soil, highway slopes significantly decreased soil AP content (Pan et al., 2012; Zheng et al., 2018). Soil AK was the key nutrient factor for slope plant growth (Ma et al., 2013). Soil TK was abundant in Tibetan soil, mainly due to an abundance of potassium in the parent material, and the abundance of soil AK was related to SOM content (Guo et al., 2004).
Soil TP significantly decreased under ES, suggesting it is sensitive to engineering construction. First, this result may be due to vegetation restoration being affected by highway construction (Fu et al., 2018; Li et al., 2018a, 2018b). Restoration time and restoration type of vegetation had some influence on the soil TP content (Zhou et al., 2001; Guo et al., 2011), possibly resulting in TP to be a more important nutrient for plant growth in the Qinghai-Tibet Plateau (Niu et al., 2016b, 2016c). Although soil material of the ES was the same as that in natural and CS, the input quantity of plant remnants on ES was reduced due to their increased distance from natural and GS, resulting in low soil TP content. Second, it has been previously highlighted that soil pH affects seed germination rates (Piovan et al., 2014; Fu et al., 2018). In our study, as highway construction decreased soil pH, this affected vegetation restoration, resulting in a decrease of soil TP content. Vegetation restoration may also be another factor affecting soil pH in the study area, thereby being the most important factor controlling the chemical form and content of phosphorus in soil (Hinsinger, 2001). Moreover, a soil pH of 6.5–6.8 can reduce fixed phosphorus concentrations and improve the effectiveness of soil phosphorus (Knoepp and Swank, 1998). Chen et al. (2016) identified soil TP to be significantly higher in NS sites compared with CS. According to the national soil survey data, two-thirds of soil in China has a deficiency of phosphorus (Lai et al., 2003). Results for soil TP in the alpine meadow in the Qinghai-Tibet Plateau recorded the highest values in the first gradient (3,840 m), a result that was contrary to the findings of Liu et al. (2005) and Wang et al. (2005). In our study, results from the integrated matter-element model showed that NS, ES, and CS were all deficient in TP, suggesting that phosphorus may act as a sensitive indicator for future engineering activities.
Soil TN contents in our study recorded a significant decrease with an increase of engineering disturbance. Results from the integrated matter-element method showed that nitrogen might be a key factor limiting soil nutrient levels on highway slopes. Liu (2012) identified that nitrogen was a limiting factor for nutrients in agricultural soils in the Qinghai-Tibet Plateau. Soil nitrogen was derived from nitrogen deposition and soil nitrogen source SOM decomposition (Huang et al., 2017). However, when the research area was relatively small, basic atmospheric nitrogen deposition was consistent; thus, its impact on soil nitrogen was mainly related to SOM content and the microbial decomposition rate (Yin et al., 2010; Noe et al., 2013; Mao, 2014). In our study, the difference in SOM was not significant, while soil BD affected the air liquidity, affecting soil microbes and reducing soil nitrogen content.
Our results showed that soil nutrient status was almost consistent under the three methods, indicating that three methods may be applicable to evaluate the nutrient status of highway slopes in this region. In addition, the integrated matter-element model also analyzed the influence of each factor on soil nutrients in highway slopes, providing a more reasonable soil nutrient classification (Tang et al., 2008, 2009; Wang et al., 2009; Zhao et al., 2014). For example, although soil AK content was not significantly different among all the soil types, integrated matter-element model analysis showed that the ES lacked AK, suggesting that more attention should be paid to balancing potassium by incorporating appropriate ecological restoration measures in the ES. Although the main aim of this study was to evaluate the soil nutrient status of highway slopes, the mechanism of soil property change is not clear. Further investigations on mechanisms affecting soil property change of highway slopes in the Qinghai-Tibet Plateau are therefore required.
Conclusions
In this study, an effective integrated matter-element model is proposed to evaluate the effects of highway ES and CS on soil nutrients in the Qinghai-Tibet Plateau using GS and NS as controls. Our results suggest that highway slopes do not affect soil SOM and potassium contents, but they do affect soil BD and negatively impact soil nitrogen and phosphorus contents. These variables might act as sensitive indicators of highway slopes in the Qinghai-Tibet Plateau, which in turn affect slope ecosystem soil nutrient fluxes and result in a negative feedback to further highway engineering activities. In addition, the integrated matter-element model can successfully assess soil nutrient types and availably, objectively and scientifically evaluating soil nutrient levels.
Given that negative effects caused by highway slopes could not be partly offset by short natural restoration, the Qinghai-Tibet Plateau ecosystem is threatened by soil degradation caused by engineering construction. As key limiting factors for any terrestrial ecosystem, nitrogen and phosphorus should be protected and maintained through appropriate ecological restoration measures. Further analysis is required to evaluate soil nutrients of highway slopes in the Qinghai-Tibet Plateau under ecological recovery of roadways.
Footnotes
References
Supplementary Material
Please find the following supplemental material available below.
For Open Access articles published under a Creative Commons License, all supplemental material carries the same license as the article it is associated with.
For non-Open Access articles published, all supplemental material carries a non-exclusive license, and permission requests for re-use of supplemental material or any part of supplemental material shall be sent directly to the copyright owner as specified in the copyright notice associated with the article.