
Abstract
This study presents the detailed contrastive potential of Bacillus licheniformis gram positive and Bacillus mucilaginosus Krassilnikov gram negative for Cr (VI) remediation from water. The results revealed optimum biomass dosage of 1.5 g at pH 2.0 and pH 6.0 for B. mucilaginosus and B. licheniformis, respectively. B. mucilaginosus was an efficient biosorbent with a maximum removal efficiency of 94.8% compared with B. licheniformis, which recorded 48.8% removal of Cr (VI). The dimensionless separation factor TL analysis for the lowest and highest Cr (VI) concentrations was between 0 and 1 for both biosorbents, which was an indication of a favorable biosorption process. The intraparticle diffusion analysis showed multilinearity plots indicative of a possible combination of external and internal diffusion during the Cr (VI) biosorption process. Further analysis by Fourier transform infrared and scanning electron microscope suggested that the presence of amide I and II in rod-shaped cells (typical bacilli cell structure) played vital roles in the Cr (VI) biosorption. The experimental data were evaluated using Langmuir, Temkin, and Freundlich isotherm models. The Temkin model fitted fairly well compared to Langmuir and Freundlich models for Cr (VI) biosorption. The suitability of the pseudo-second-order kinetic model was further demonstrated by the slight variation between the experimental (Ex qe) of 0.23 and 0.74 mg/g and theoretical (Cal qe) 0.23 and 0.62 mg/g B. licheniformis and B. mucilaginosus, respectively. The corresponding regression coefficients (R2) for B. licheniformis and B. mucilaginosus were 0.9921 and 0.9965, respectively. In contrast with commercial biosorbents, B. mucilaginosus also provides alternatively cheap biosorbent and is eco-friendly.
Introduction
Water contamination by heavy metals has become a great concern globally due to its nonbiodegradable and accumulative properties in both fauna and flora, thus causing catastrophic consequences environmentally and socioeconomically. Chromium and typical pollutants have varied sources of occurrence such as natural and anthropogenic activities (Zhitkovich, 2011). Wastewater generated by tannery, leather, chrome plating, and paint manufacturing industries are sources of chromium contamination (Bhatti et al., 2017). In the natural ecosystem, chromium exists mainly in two forms as follows: trivalent chromium Cr (III) and Cr (VI). Cr (III) is less in toxicity compared to Cr (VI). Various health hazards and risks are associated with chronic and acute exposure to chromium (VI) by humans and other living organisms such as shortening breath and respiratory tract infection due to excess inhalation; pneumonia has been reported (Vieira et al., 2008). Industrial effluents and municipal sewage disposal into water, freshwater bodies, or directly into the environment cause serious environmental problems (UN-Water, 2017). The permissible levels of Cr (VI) concentration according to U.S. Environmental Protection Agency (EPA) are 0.05 mg/L for surface water quality, 0.1 mg/L for primary drinking water, 1.0 mg/L for livestock water quality, and 5.0 mg/L for hazardous waste (EPA, 1992). World Health Organization (WHO) sets 0.05 mg/L as the maximum limit of Cr (VI) in its drinking water guidelines (WHO, 2003a). Effluents from tannery companies are one of the major sources of chromium pollution. For instance, it is established that about 90% of the tannery companies in Ethiopia discharge their effluents without treatment. The chromium concentration in these tannery effluents is in the range of 5,001 to 5,023 mg/L. The remaining 10% of tannery companies only treat the wastewater partially before discharge (Minas et al., 2017).
Different techniques are used for the toxicity remediation of chromium. These methods range from conventional treatment technologies, such as electrocoagulation and electrooxidation (Maher et al., 2020); electrochemical oxidation (Li et al., 2019); and electrolysis (Alaoui et al., 2015), to more advanced strategies, such as membrane filtration, photocatalysis, and biosorption (Barakat, 2011). For these aforementioned techniques apart from the high cost which may be associated with their applications, the incidence of secondary waste generation may be of concern (Gupta et al., 2011).
Microorganisms perform an important role in the remediation of Cr (VI) through a biotransformation process to Cr (III) which is relatively less toxic compared to Cr (VI). The breakdown could occur under different environmental regimes such as aerobic or anaerobic conditions. The breakdown may occur directly due to enzymatic process or indirectly due to hydrogen sulfide (gas), which is produced by microorganisms during the breakdown of organic materials in anaerobic conditions. Microorganisms isolated from chromium polluted environments have proven to be tolerant of high Cr (VI) toxicity due to their adaptive capabilities (Nezha et al., 2015). The ability of microbial species to reduce toxic Cr (VI) to Cr (III) provides an eco-friendly and economical choice for the treatment of tannery effluents.
Biosorption is a promising alternative to conventional sewage and industrial wastewater treatment technologies (Fomina and Gadd, 2013). Biosorption has been considered as a suitable alternative technique due to its environmental friendliness, efficiency, flexibility, cost-effectiveness, and more importantly could be used to treat different types of effluents, as well as possibly remove pollutants entirely in low amounts without introducing any secondary contaminant in the process (Farooq et al., 2010).
Many biological materials such as plants and microorganisms have been so far developed for the biosorption of heavy metals in water (Ahluwalia and Goyal, 2007; Zhu et al., 2019). Of these, microbial-based biosorbents are deemed to have numerous merits such as the abundance of raw materials in nature, the possibility of regeneration and reuse after sorption, and significant removal efficiency and capacity, as a result of diverse functional groups on the cell wall surface (Gupta et al., 2015). It is also important to note that bacteria are the second dominant species of life form after plants on the earth (Bar-On et al., 2018). Given this, there have been ongoing efforts by scientists to identify by way of screening bacterial strains for the efficient remediation of heavy metals. Some researchers are focusing on the use of living bacterial strains for the bioaccumulation of chromium. Since this process involves the use of living cells, the metabolic activities of the microbes could be negatively affected by the high toxicity of pollutants leading to mortality of the bacteria and adversely affecting the removal process efficiency (Chojnacka, 2010). Biosorption, on the other hand, is a passive process which involves the use of immobilized bacteria biomass. Some Bacillus species belonging to phylum Firmicutes have been used to investigate the removal of Cr (VI) such as Bacillus coagulans (Quintelas et al., 2008), Bacillus circulans (Srinath, et al., 2002), Bacillus cereus (Lu et al., 2013), and Bacillus subtilis (Chug et al., 2016).
Even though some reports on Cr (VI) removal with bacterial biomass exist, it appears that the focus has been on the biosorption capacity of different biosorbents. The selected bacteria species for this study have diverse habitats. They can survive in both aquatic and terrestrial ecosystems, which make these species suitable for the remediation of wastewater effluents and contaminated soils, unlike mono-habitat species. This investigation delved into aspects that underpinned the mechanisms involved in the biosorption process such as equilibrium, isotherms, and the behavior of the biosorbents in the solid–liquid interaction. The objectives of this study were to (i) examine the physical properties and fine structures, (ii) isotherms and kinetics modeling, (iii) investigate the dynamics and mechanisms, and (iv) elucidate the optimum conditions involved in biosorption of Cr (VI) by immobilized cells of Bacillus licheniformis (Gram positive) and Bacillus mucilaginosus Krassilnikov (Gram negative). To identify the various functional groups present in B. licheniformis and B. mucilaginosus that are responsible for the biosorption of Cr (VI), Fourier transform infrared (FT-IR) spectroscopy was conducted. Finally, the optimized conditions were applied for the treatment of Cr (VI).
Materials and Methods
Origin and characteristics of biosorbents
B. licheniformis (BNCCID 221854) and B. mucilaginosus Krassilnikov (BNCC337990) strains each containing 1.0 × 10⁸ (cfu) live cells per gram dry weight were obtained from Suzhou Bei Na Chuanglian Biotechnology Co., Ltd. (Jiangsu, China). B. licheniformis is a kind of mesophilic bacteria that grow under saprophytic, facultatively anaerobic, and moderate temperature conditions in the range of 21°C to 50°C. Therefore, it is capable of switching to fermentation in the absence of oxygen. The physical and morphological features of B. mucilaginosus include the following: thick and long rod-shaped thallus, thick capsule, elliptic and middle-growing large spore, and thick cyst wall. Both bacterial strains have diverse habitats, thus existing in both soil and aquatic environments. To ensure the uniformity of the particle size distribution of the biosorbents, >60 mesh was used for both strains. The strains were stored in a cool dry place for subsequent biosorption studies. The B. licheniformis and B. mucilaginosus were characterized using Nicolet 6700, and the FT-IR spectral outputs were obtained.
Preparation of Cr (VI) stock solution and reagents
The working solutions of Cr (VI) with the following concentrations 20, 50, 100, and 150 mg/L were obtained through appropriate dilution from the stock solution at 1,000 mg/L. The stock solution of Cr (VI) was prepared using potassium dichromate (K2Cr2O7) in 1 L ultrapure water (H2O). A measure of 0.5 g 1,5 diphenylcarbazide was dissolved in 100 mL of acetone and sealed in a brown bottle at 4°C for use. 1,5 Diphenylcarbazide, acetone, and sulfuric acid were purchased from Sinopharm Chemical Reagent (SCR) Co. Ltd. (China). All reagents and chemicals were of analytical grades.
Chemicals and reagents
The chemicals and reagents used during the investigation were supplied by Sinopharm Chemical Reagent (SCR) Co., Ltd. Potassium dichromate (K2Cr2O7, ≥99.8%), sodium hydroxide (NaOH, ≥96%), sulfuric acid (H2SO4, ≥98%), hydrochloric acid (HCl, ≥37%), methanol (CH3OH, ≥99.5%), potassium bromide (KBr, ≥99%), acetone (C3H6O, ≥99.5%), 1,5 diphenylcarbazide (C13H14N4O, ≥3.8 × 10⁴), and potassium permanganate (KMnO4, ≥99%) were all obtained from SCR, China. All chemicals and reagents were of analytical grades.
Biosorption experiments
Biosorption experiments were carried out with B. licheniformis or B. mucilaginosus as the biosorbent under different Cr (VI) concentrations in 250 mL conical flasks. The biosorbents were examined to determine the suitable dosage for each bacterium in the range of 0.5 to 2.0 g. To determine the effect of concentration on the biosorption process, a series of Cr (VI) working solutions, including 20, 50, 100, and 150 mg/L, were applied for each experiment. To ascertain the effect of solutions pH on the biosorption of Cr (VI), the pHs were adjusted from 2 to 12 using 1.0 M NaOH and 1.0 M HCl before the introduction of the biosorbents into the flasks. To every 25 mL of Cr (VI) solution, 1.5 g of the required biosorbent was added.
The flasks were wrapped to avoid possible spills and contamination at an air bath oscillator. Experiments were conducted in triplicates for each parameter investigated. All parameters were investigated under room temperature (25°C) with a contact time of 2 h and a rotation speed of 150 rpm. The mixtures were transferred into 25 mL tubes and centrifugated for 6 min at relative centrifugal force 4,000 g at room temperature. To determine Cr (VI) concentration, the reagents such as sulfuric acid, 10% (v/v), and 1,5 diphenylcarbazide solution which was prepared by dissolving 0.5 g in 100 mL acetone were added to the supernatants. The samples were then kept in 10 mL cuvettes and analyzed at 540 nm using visible Spectrophotometer V-1100D Mapada. Reagent water was used as control during the investigation. The removal efficiency of Cr (VI) was calculated using the following equations:
where Ci is the initial Cr (VI) concentration (mg/L). Cf is the final Cr (VI) concentration after biosorption (mg/L). Biosorption capacities of B. licheniformis and B. mucilaginosus at equilibrium were calculated using Equation (2) as shown below:
where Co is initial Cr (VI) solution concentration (mg/L), Ct is Cr (VI) concentration (mg/L) at a given time t (min), V is the solution volume (L), and M is the biosorbent mass (g).
Statistical analysis
The variability and consistency of experimental data obtained from the photospectrometric investigations were evaluated using a statistical analytical tool by Hogg and Ledolter (1987). Standard deviations were measured using Equation (3) as shown below:
where Di is the computed Cr (VI) concentration value, Dave represents the average concentration value (mg/L), n is about the number of analyzed samples, and Sd represents the standard deviation.
The standard deviation concerning the averages was normalized and measured using the coefficient of variation (CV). The larger the value for CV, the wider the variation in the results, which is an indication of compromised precision in terms of the analysis. CV was determined using Equation (4) as shown
The effect of contact time on the removal of Cr (VI) ions was examined with fixed time schedules t = 10, 20, 30, 40, 60, 80, and 120 min. The required biosorbent was added into the 25 mL solution of Cr (VI) in a 250 mL conical flask after pH adjustments. For both biosorbents, 1.5 g dosage was optimum, and subsequent experimental investigations were conducted using 1.5 g biosorbent dosage.
Biosorption kinetics
Lagergren equation popularly referred to as pseudo-first-order (PFO) dynamics was adopted, which can be expressed mathematically as Equation (5) as indicated below.
Linearized forms of pseudo-second-order (PSO) kinetics in Equations (6) and (7) were used to examine the kinetic data to ascertain which model best fitted the experimental results.
Over the years, these equations received frequent adoption in examining biosorption variables which got modified (Ho et al., 2000) where k1, min−1, and k2, g/mg min denote the Lagergren coefficient rates for PFO and PSO, respectively. These parameters are determined from the plotted graphs, while q and qe denote the amounts of Cr (VI) uptake at time t (min) and its corresponding equilibrium (qe) value (mg/g), respectively. The equations are indicated as follows:
Intraparticle diffusion
The linear plots were as follows: log
Biosorption isotherms
Langmuir biosorption isotherm model Equations (9) and (10) (Langmuir, 1917), Freundlich isotherm model Equation (11) (Freundlich and Henry, 1926), and Temkin isotherm model Equation (12) (Temkin and Pyzhev, 1940) were used to evaluate the results. The appropriate linearized equations and their plots are indicated as well, where Ce is the equilibrium concentration of Cr (VI) in mg/L, and qe and qm are equilibrium biosorption capacity amount and maximum biosorption capacity of Cr (VI) all in mg/g correspondingly. While b, KF, n, KT, qs, and T represent Langmuir constant relating biosorption capacity (mg/g), Freundlich constant relating to biosorption capacity [mg/g·(mg/L)n], Freundlich isotherm constant relating to the intensity of the biosorption process, binding constant relating to Temkin isotherm model regarding equilibrium (L/mg), and Temkin constant in relation to heat of biosorption (kJ/mol), T is related to absolute temperature (K), respectively. The equations are as follows:
The solid diffusion kinetics of the biosorption was further examined following the principle of dimensionless separation factor by Hall et al. (1966) using Equation (13) as shown. This aided in the evaluation of Langmuir isotherm models with predefined rules where TL > 1 means unfavorable, TL = 1 means linear, TL = 0 means irreversible, and 0 < TL < 1 means favorable biosorption. This is expressed in the equation below:
where d represents Langmuir constant (mg/g), and Co is the initial solution concentration (mg/L) of Cr (VI).
Biomass characterization
FT-IR spectra for both biosorbents were obtained using Nicolet 6700 manufactured by Thermo Scientific (China). The corresponding spectra were subsequently analyzed within the wavelength range of 4,000 to 500 cm−1. The investigation identified the various functional groups present in the specimens. The morphological structure and characteristics for B. licheniformis and B. mucilaginosus were examined using the JSM-IT300 (Jeol) scanning electron microscope (SEM).
Porosimetry analysis was further conducted using Micromeritics ASAP 2460 specific surface and pore analyzer. The principles of Brunauer-Emmett-Teller (BET) nitrogen adsorption techniques were adopted at −196.1°C (equivalent to 77 K) to investigate the surface area, pore volume distribution (Sing, 2001). Therefore, nitrogen porosimetry (gas adsorption) was considered, and the key parameters such as specific surface area (SSA; m2/g), pore diameter, and the BET constants (C) were determined. Specific surface area analysis is aided by BET adsorption isotherm (Brunauer et al., 1938) theory general equation [Eq. (14)] as follows:
where P is adsorbate gas partial vapor pressure in equilibrium at 77.4K (Pa), P0 is the saturated adsorbate gas pressure (Pa), Qa is the quantity of adsorbed gas at STP [273.15 K and ATP 1.013 × 10⁵ Pa] in milliliter, and C is a dimensionless constant relating to the adsorption heat energy of adsorbate gas on powder sample. The BET plot of P/[Qa(P0 − P)] versus P/P0 is shown in Fig. 4, and the slopes of the linear plots were used to determine (C − 1)/QmC, while the intercept was used to determine 1/QmC. From these relationships, Qm could be determined as 1/[slope + intercept], while C could be determined as [slope/intercept] + 1. Once Qm value is determined, the SSA (m2/g) could also be obtained. The Barrett, Joyner, and Halenda (BJH) technique was used for the determination of the pore size distributions of the experimental isotherms using the Kelvin pore filling model.

Analysis of adsorption and desorption isotherms:
Results and Discussion
Effect of solution pH on biosorption
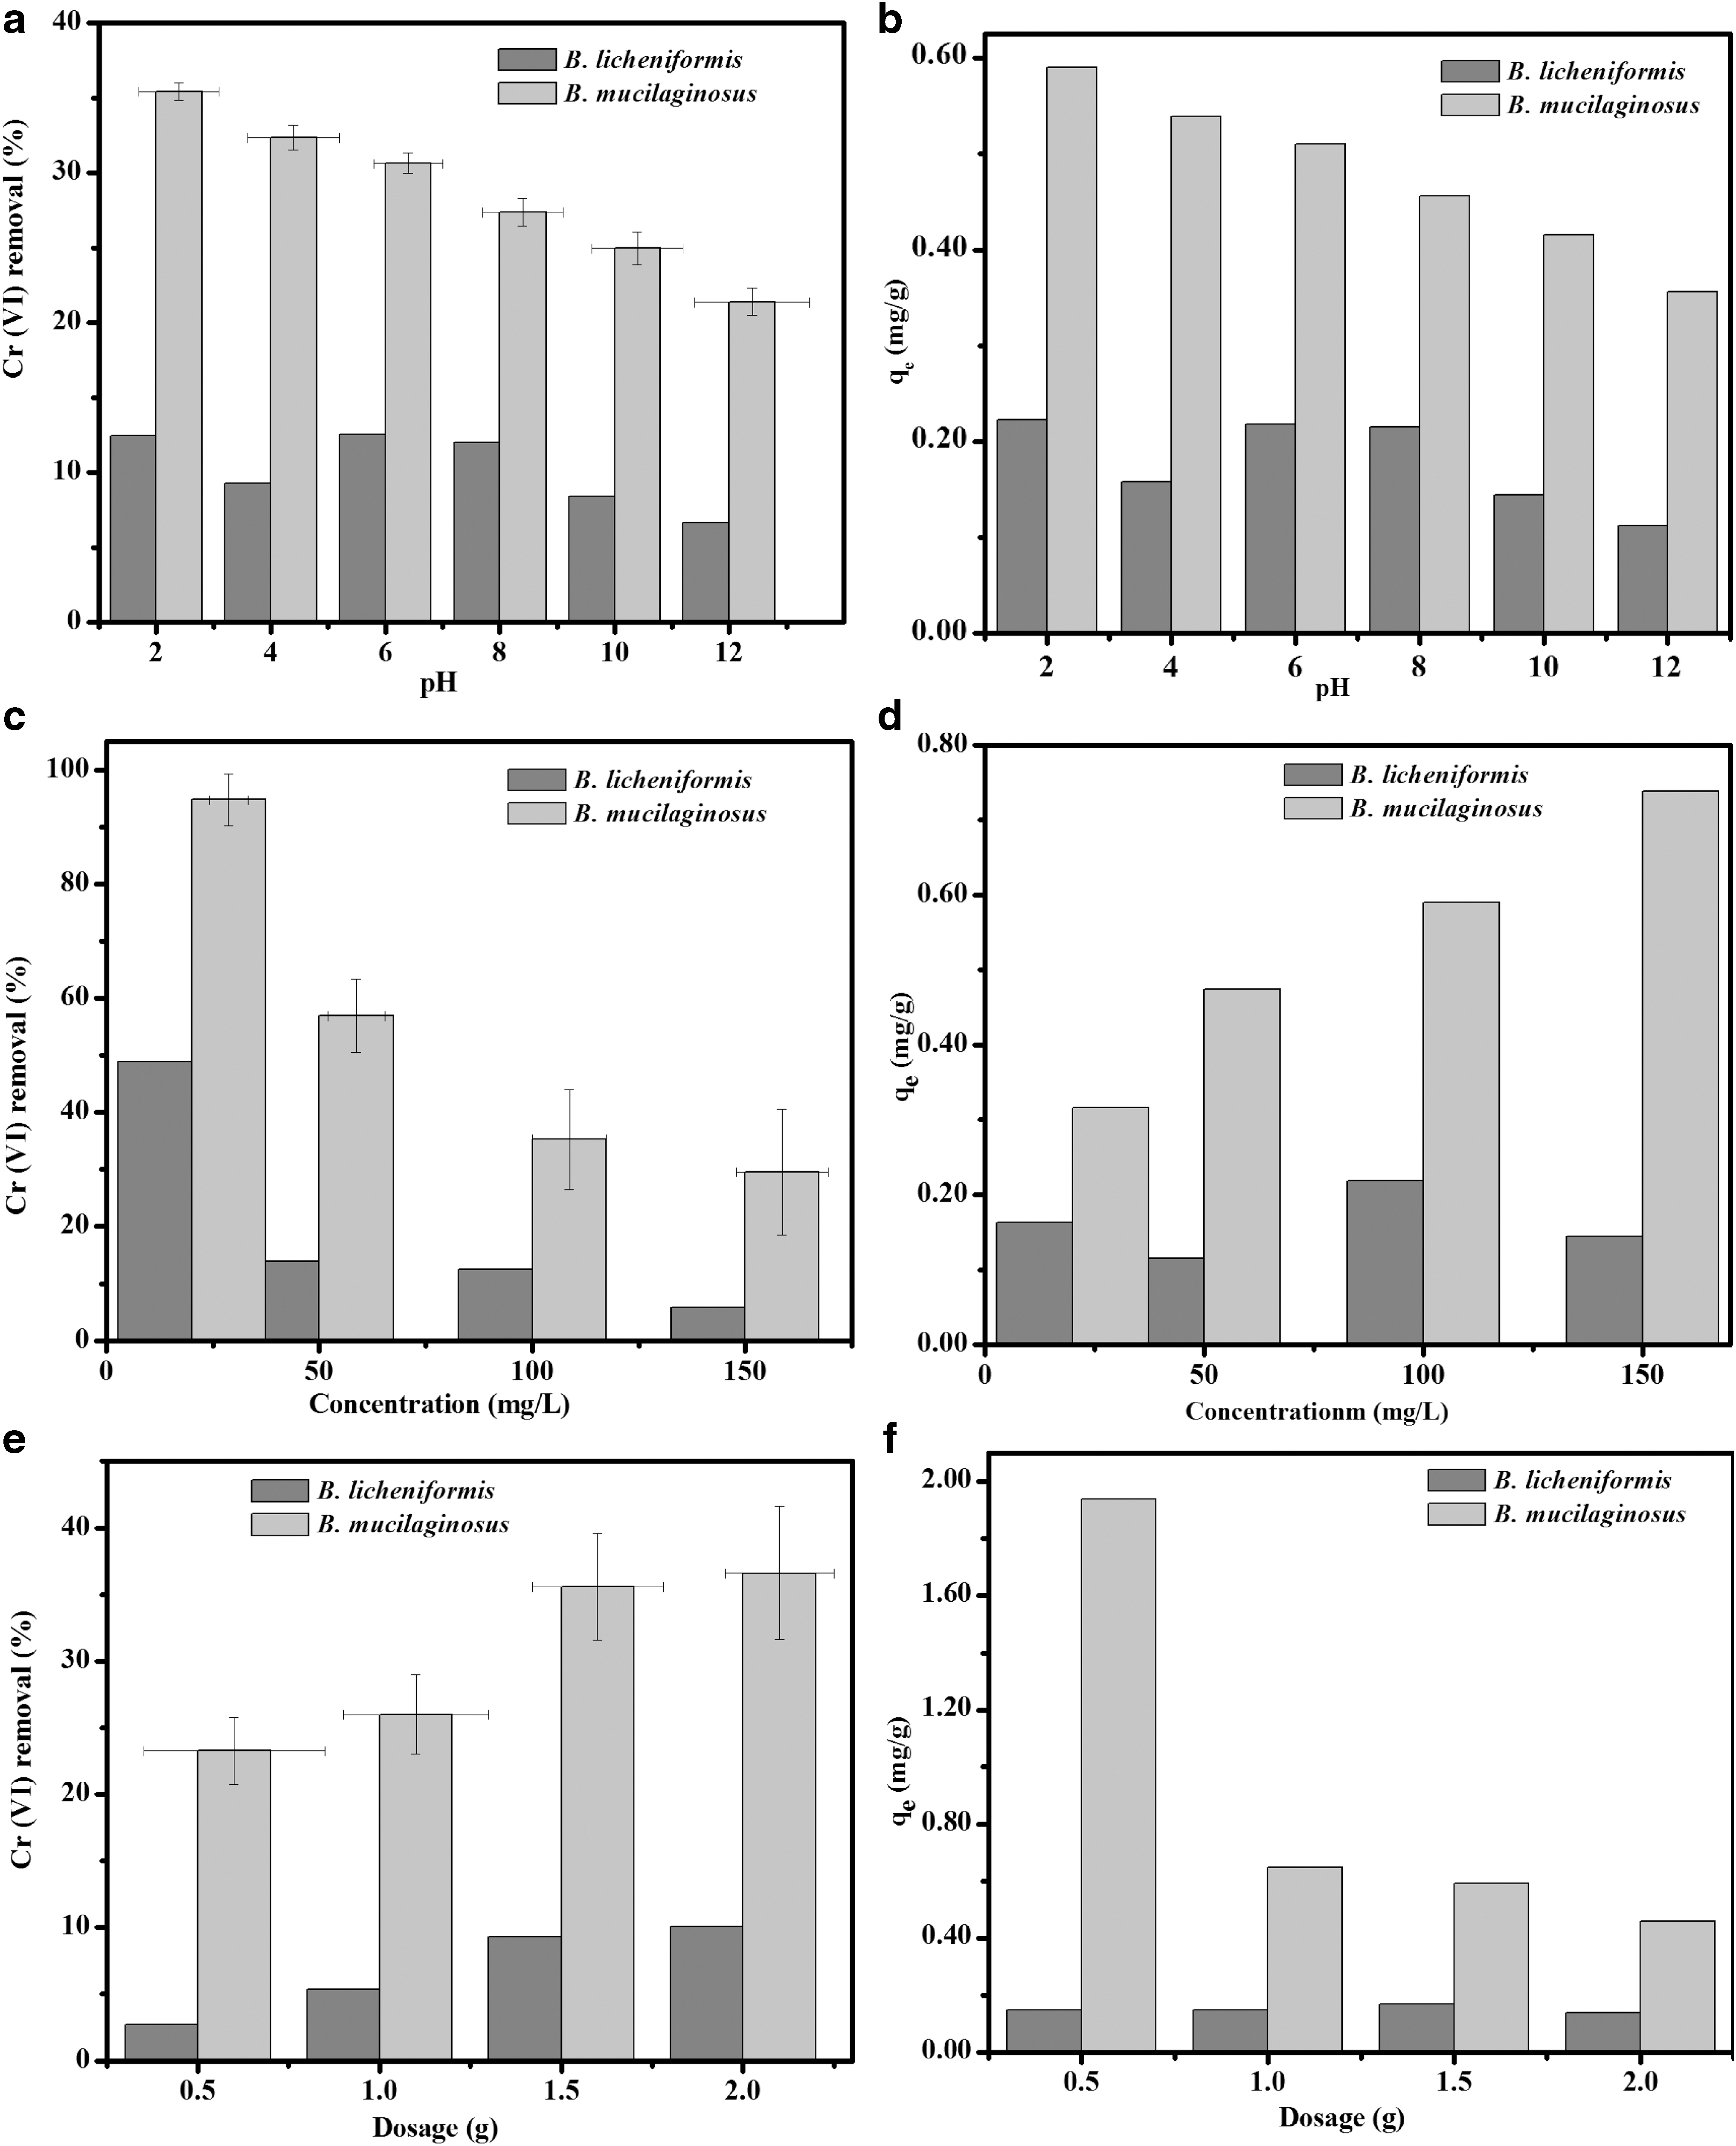
The effect of solution pH on the removal of Cr (VI) metal ions was investigated using both biosorbents under similar conditions. Solution pH is an important parameter since it affects the surface reaction of the biosorbent. Removal of efficiency of Cr (VI) by B. licheniformis metal ions increased maintained nearly constant marginally from 12.45% to 12.55% when the initial pH was varied with pH increasing from 2 to 6, followed by a decreasing trend until 6.65%; thereafter, removal efficacy showed downward trend when initial pH was further increased to 12 with a corresponding removal of 6.65% at pH 12. Concerning B. mucilaginosus, a gradual decrease in Cr (VI) removal from 35.42% to 21.37% was observed in Fig. 1a when pH was increased from 2 to 12. The biosorption capacity witnessed a similar decreasing trend for B. licheniformis (0.11–0.22 mg/g) and B. mucilaginosus (0.36–0.59 mg/g) with pH ranging from 2 to 12 as indicated in Fig. 1b. Therefore, the optimum pH for B. licheniformis biomass was observed at pH 6, while that of B. mucilaginosus was observed at pH 2, respectively. This probably could be attributed to the notion that hexavalent Chromium in aqueous solution exists mainly in the form of hydrogen chromate (HCrO4−) (WHO, 2003b). In a pH range of 1 to 6, it is only hydrogen chromate (HCrO4−) which exits. It is independent of chromium concentration, while only chromate (CrO42−) exists in pH above 7 (Gheju, 2018). When pH is very low, the biosorption effect is high due to predominant Cr+6 species, which largely exists in HCrO4−. This phenomenon facilitates the interaction between Cr (VI) and the matrix of B. mucilaginosus due to electrostatic interaction. Similarly, it is established that the thick peptidoglycan layers present in B. licheniformis (Gram positive) contain teichoic acids (Caudill et al., 2020). This makes the cells of B. licheniformis deprotonated due to the loss of H+ ions, thus negatively charged. The effect of this phenomenon is that the biosorption of Cr (VI) ions with B. licheniformis at pH becomes favorable due to the electrostatic force of attraction. The results tallied with the findings made by Emmanuel et al. (2017) and Rangabhashiyam and Selvaraju (2017). The high removal of the Cr (VI) ions occurs when the net charge on the biosorbent surface is negative. In that case, the positively charged Cr (VI) ions are easily attracted due to electrostatic forces. However, as pH increases, it is slowly converted to CrO42− and dichromate (Cr2O72−). The biosorption free energy for CrO42− and Cr2O72− is greater than HCrO4−, as a result HCrO4− is easily adsorbed at the same concentration (Liu et al., 2018).
Influence of the various parameters on Cr (VI) biosorption:
Effect of initial Cr (VI) concentration on biosorption
When the initial concentration of Cr (VI) was increased from 20 to 150 mg/L, the removal efficiency of the metal ions decreased from 48.8% to 9.2% when B. licheniformis was introduced into the solution as shown in Fig. 1c. Similarly, when B. mucilaginosus was applied to the same concentration range, the removal efficiency of Cr (VI) ions declined from 94.8% to 29.5%. This phenomenon could be explained by the fact that when Cr (VI) concentration is low, fewer metal ions in the solution will be reacting with all the available binding sites of the biosorbent leading to high uptake. On the contrary, when concentration is high with fixed biosorbent dosage, thus 1.5 g per 25 mL solution of Cr (VI), the removal efficiency declined. This is a result of the saturation of the available binding sites while more ions are left freely (Erbaş et al., 2018). Biosorption capacity as shown in Fig. 1d increased slightly from 0.16 to 0.23 mg/g with B. licheniformis and from 0.32 to 0.74 mg/g with B. mucilaginosus when initial concentration was varied from 20 to 150 mg/L. Both biosorbents recorded no significant changes when the dosage was further varied to 2.0 g. This pattern is similar to some other research findings, which perhaps is attributed to a reduction in active binding units in the adsorbate (Kumar et al., 2017).
Effect of the biosorbent dosage
Determination of appropriate B. licheniformis and B. mucilaginosus biosorbent dosages was carried in the following sequence 0.5, 1.0, 1.5, and 2.0 g using constant 100 mg/L solution of Cr (VI) at room temperature 25°C. Biosorbent dosage is an important parameter in biosorption studies because it influences the removal efficiency of Cr (VI) metal ions. The optimum dosage for both biosorbents was established to be 1.5 g as indicated in Fig. 1e. When B. licheniformis was applied to 25 mL of Cr (VI), the removal of metal ions increased from an initial 2.74% to 9.26% when the dosage was varied from 0.5 to 1.5 g. The B. mucilaginosus equally witnesses increment in the removal efficacy from initial 23.26% to 35.58% when biosorbent dosage was increased from an initial 0.5 to 1.5 g. The biosorption capacity for both biosorbents decreased from 1.94 to 0.46 mg/g and 0.15 to 0.13 mg/g when the dosage was varied from 0.5 to 2.0 g for B. mucilaginosus and B. licheniformis, respectively, as shown in Fig. 1f. Both biosorbents recorded no significant changes when the dosage was further varied to 2.0 g. This trend has been reported in the existing literature, which may be attributed to a reduction in active binding units in the adsorbate (Kumar et al., 2017). The optimum biosorbent dosage was found to be 1.5 g, and it was used for subsequent investigations into other parameters during this study. The effect of contact time on biosorption was examined with both biosorbents using 100 mg/L initial Cr (VI) solution with time range 10 to 120 min as shown in Supplementary Figure S1(c). With regards to B. licheniformis, the first 10 min recorded slightly abrupt uptake of metal ions, which represented 8.79% removal compared to 24.28% within the same time with B. mucilaginosus. With B. licheniformis, equilibrium was attained at 80 min with the maximum removal of 13.39%. In the case of B. mucilaginosus, the biosorption system reached equilibrium at 60 min of contact time with maximum removal of 35.25%. This phenomenon could be explained by the fact that when the biosorption system reached equilibrium, desorption is most likely to set in due saturation of available binding sites on the biosorbent. It is reported that the rate of metal ion uptake will be proportional to the desorption rate at equilibrium (Rangabhashiyam and Balasubramanian, 2018). The biomass of both B.licheniformis and B. mucilaginosus is nontoxic and biodegradable based on the Technical Data Sheet from BeNa Culture Collection (BNCC). Besides, the application of both biosorbents for the removal of Cr (VI) produced minimal spent (residue).
Biosorption kinetics and diffusion mechanisms
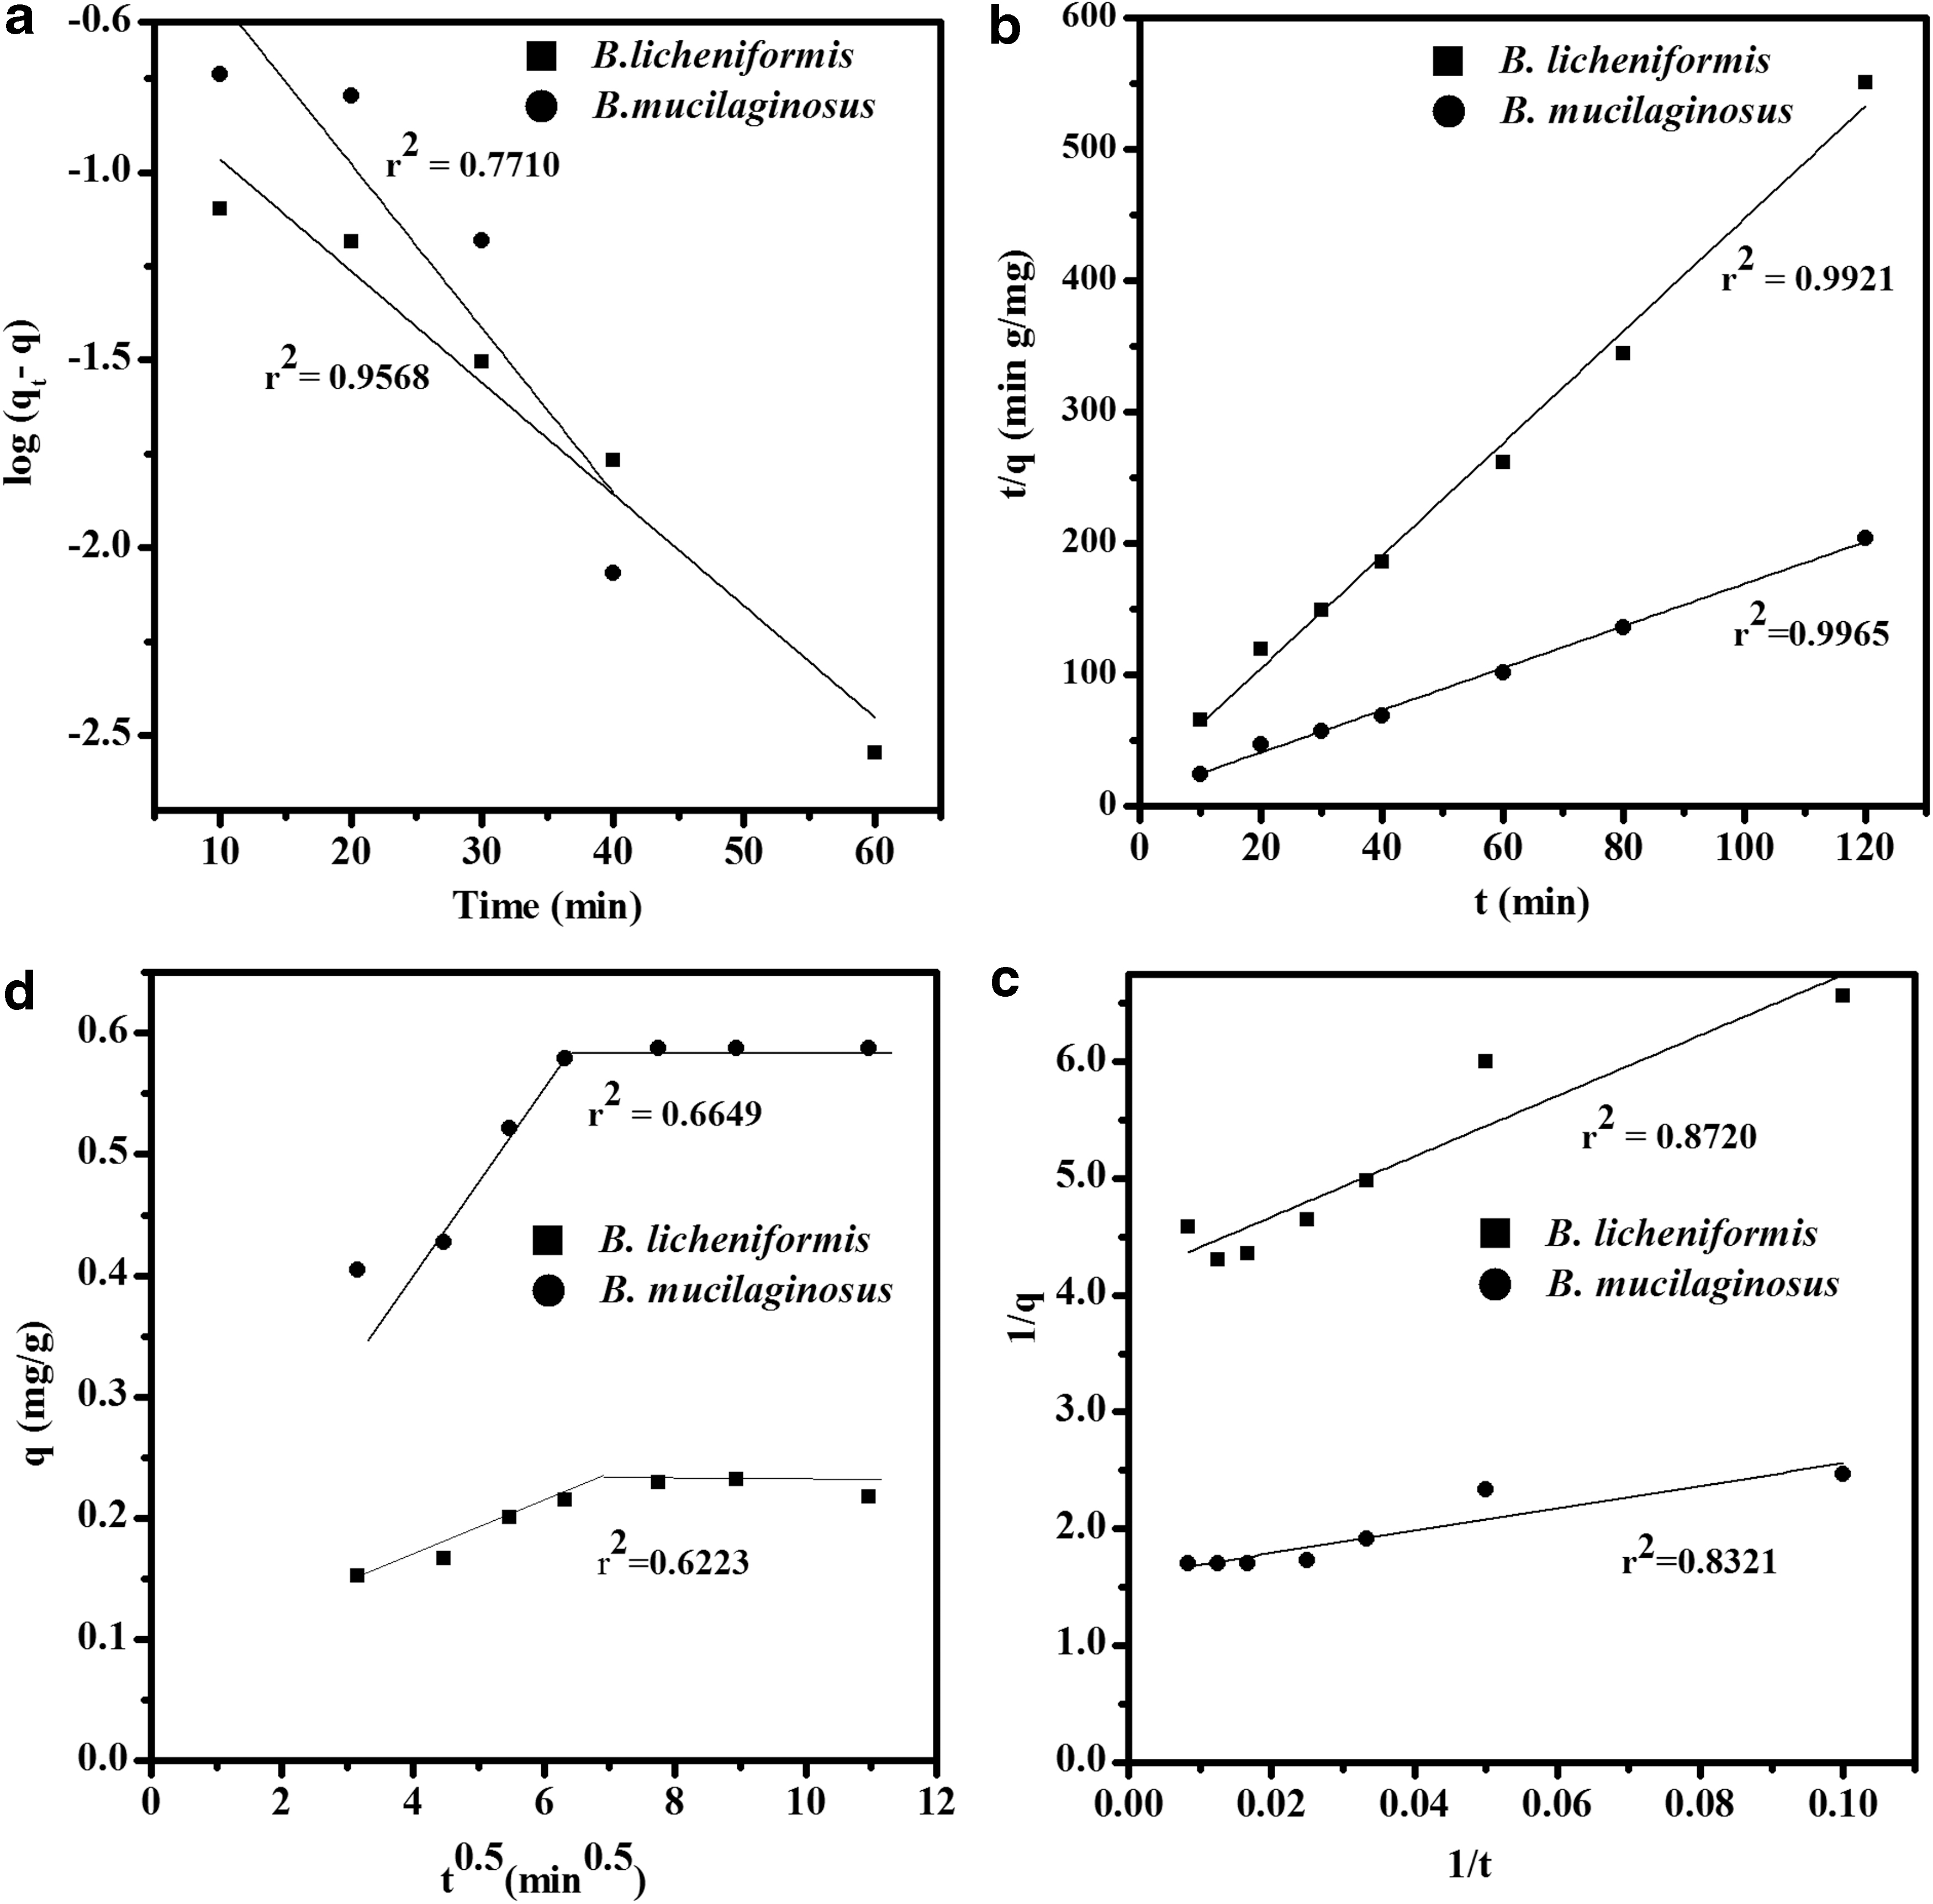
To further elucidate Cr (VI) biosorption process onto B. licheniformis and B. mucilaginosus, the kinetics data were tested with Lagergren PFO kinetics model, PSO kinetics model, and intraparticle diffusion model, respectively (Fig. 2a–d). The kinetic constants and the corresponding parameters are listed in Table 1. The kinetic analysis showed that the PFO kinetic model was not suitable for the description of the experimental data obtained. A similar finding involving the removal of Cr (VI) with Biocomposite has been reported (Akram et al., 2016). It was observed that the experimental data fitted well with the PSO kinetic model for B. licheniformis (R2 = 0.9921) and B. mucilaginosus (R2 = 0.9965), respectively. The biosorption kinetic data were further examined using Weber and Morris kinetic model (Weber and Morris, 1963) to evaluate the intraparticle diffusion involved in the biosorption process with the following Equation (8), where ks represents the rate constant of intraparticle diffusion (mg/g min0.5), and h is the boundary layer thickness (mg/g). Based on the principle of Weber and Morris's model, a linear fit is expressed when the biosorption process is influenced by intraparticle diffusion. However, the kinetic data in this study were demonstrated as multilinear plots as shown in Fig. 2d, which suggests that biosorption of Cr (VI) onto B. licheniformis and B. mucilaginosus might not be influenced by intraparticle diffusion solely, but could be film diffusion also (Doke and Khan, 2017).
Biosorption kinetics on Cr (VI) using Bacillus licheniformis and Bacillus mucilaginosus using 25 mL of 100 mg/L solution, temperature 25°C, agitation speed 150 rpm, and 1.5 g biosorbent dosage
Pseudo-First-Order and Pseudo-Second-Order Rate Constants in Linearized Forms Used for Analyzing the Biosorption of Cr (VI) Using Bacillus licheniformis and Bacillus mucilaginosus
PFO, pseudo-first-order; PSO, pseudo-second-order.
Biosorption isotherms
Freundlich equation constant (1/n) was used to examine the isotherms. If the value for n is in the range of 0.7 to 1, it is indicative that increment in adsorbate concentration or the investigated pollutant would normally lead to a reduction in biosorption due to saturation of available sorption sites accessible to the pollutant. In a case where the values for n are less than 0.7, it is indicative that the isotherms are extremely curved. At lower concentrations, biosorption of pollutants onto the surface of the biosorbent is enhanced drastically and the data reproducibility which is used to determine the biosorption coefficient of Freundlich isotherm could be assessed based on R2 values (coefficient of determination) (ECETOC, 2013). However, at higher Cr (VI) concentration, the increment in biosorption capacity becomes insignificant. B. mucilaginosus compared with the KF value 2.0092 showed higher biosorption capacity than B. licheniformis with KF 3.1546, as indicated in Table 2. This was consistent with the batch experimental results. The values for n which denote the nature of the distribution of the biosorbed Cr (VI) ions onto the surface of B. licheniformis and B. mucilaginosus both showed negative which is less than 0.7, thus indicative of highly curved isotherms as shown in Fig. 4. From the linearized regression scrutiny, Temkin R2 > Langmuir R2 > Freundlich R2, thus order of best-fitted isotherm. The vital features of the Langmuir isotherm model could be expressed using the separation factor (TL) parameter. The values for the dimensionless separation factor (TL) for PSO rates were 0.4237 for B. licheniformis and 0.3096 for B. mucilaginosus, respectively. The graphs for the Langmuir isotherms type (iii) and (iv) are presented in Supplementary Figure S1(a,b). From the analysis, it was observed that the biosorption experimental data were within the scope of 0 to 1 in line with the prediction by Hall et al. (1966) indicating that both biosorbents were capable of biosorption of Cr (VI) ions. For the lowest and highest investigated initial Cr (VI) concentrations for 20 and 150 mg/L, the TL values were 0.7862 and 0.3289 with B. licheniformis, while 0.6897 and 0.2963 were with regards to B. mucilaginosus, respectively. These findings correlate with Ntuli and Pakade (2019).
Langmuir, Freundlich, and Temkin Isotherm Model Parameters and Constants
Biosorption mechanisms
The mechanisms that underpin biosorption are very complexed given the structural complexities of microorganisms. Based on cell metabolism, the biosorption mechanisms could be classified as either metabolism or nonmetabolism dependent. Metabolism dependent biosorption involved the removal of pollutants using live microbial cells. In this instance, nutrients are to be supplied to ensure the continued sustenance of the live microbial cells and to aid the metabolism processes. With nonmetabolic dependent biosorption, the microbial cells (biomass) are dead and therefore do not require metabolic activity during the sequestration process of the pollutant. Similarly, biosorption mechanisms could either be intra- or extracellular accumulation or cell surface biosorption depending on the location of where the sequestrated metal ions are found (Shamim, 2018). The distinctions between B. licheniformis and B. mucilaginosus in terms of chemistry are that while B. mucilaginosus cells contain compounds such as lipopolysaccharides and porins (pores of proteins), the cells of B. licheniformis do not contain these compounds. Similarly, B. licheniformis produces both teichoic acids (anionic glycopolymers) and exotoxins, while B. mucilaginosus cells on the other hand produce endotoxins. In addition, the lipid content in B. licheniformis is low, while that of B. mucilaginosus is high. These distinctive chemical constituents present in both biosorbents may have played different roles in the biosorption process of Cr (VI) (Kanamarlapudi et al., 2018). The interaction that exists between Cr (VI) ions and the functional groups present on the cells' surface of the biosorbents could be physisorption, chemisorption, or ion exchange, thus nonmetabolism dependent biosorption. In contrast, intracellular accumulation requires viable cells to enable metal ion transportation across the cell membrane (Lin et al., 2017). By the complex nature of microbial cells, the presence of proteins, lipids, and polysaccharides serves as binding sites. Solution pH also influences the kind of interaction that exists between the adsorbate and exopolysaccharides. The pH modifies the chemical properties of the Cr (VI) thus affecting the activities of the biopolymers (Calderón et al., 2020). The reduction process of Cr (VI) to Cr (III) involved two reaction stages. The first stage involved the acceptance of one molecule of nicotinamide adenine dinucleotide plus hydrogen, and Cr (V) is formed as an intermediate. The last stage involved the acceptance of two electrons by Cr (V) to form the Cr (III) species (Singh et al., 2011) as follows:
It is established that Gram-negative bacteria have chromate reduction gene sequences that are capable of reducing Cr (VI) to Cr (III) rapidly (Patra et al., 2010). The high removal of Cr (VI) ions at pH 2 with B. mucilaginosus could largely, therefore, be attributed to a reduction reaction (Fang et al., 2007).
FT-IR spectroscopy analysis characterizing biosorbents
The FT-IR spectra for B. licheniformis and B. mucilaginosus before and after biosorption of Cr (VI) are indicated in Fig. 3. For B. licheniformis biosorbent, apart from the changes in peaks that occurred after its interaction with Cr (VI) ions, three peaks namely 522, 612, and 779 cm−1 also disappeared. Similar disappearance of peaks was recorded in respect of B. mucilaginosus after biosorption studies had completed such as 517, 544, 580 cm−1. The intensities of the various peaks and their corresponding brand alignments are presented in Supplementary Table S1. The peaks at 3,728–3,853 cm−1 pertained to O-H stretching vibration probably coupled with Si-O deformation of feldspar in B. mucilaginosus. Peaks between 3,628 and 3,698 cm−1 in Fig. 3 are attributable to O-H of the unbonded hydroxyl group with medium intensity, while peaks in the region of 3,421–3,437 are assigned to H2O due to solvation (Max and Chapados, 2004). The peaks at 2,982 and 2,983 cm−1 might be assigned to alkyl CH3, while the peak at 3,019 cm−1 might be assigned to alkene sp2 C-H functional groups. The peak at 2,876 cm−1 could be attributed to CH3 symmetric stretching vibration due to the covalent bonding effect in the existence of proteins or lipids. For the carbohydrates, the peaks within the range of 2,917–2,926 cm−1 are assigned CH2 asymmetric stretching of aliphatic functional groups (Naumann, 2000).

FT-IR spectral graphs for Bacillus licheniformis and Bacillus mucilaginosus at different infrared regions in a range of 4,000 to 500 cm−1. FT-IR, Fourier transform infrared.
The peaks at 2,520 and 2,521 cm−1 present in B. licheniformis in Fig. 3 (B.L3) are attributed to S-H stretching of thiol, heteroatoms (Dénès et al., 2013). In addition, the peaks within 1,718–1,798, 1,646–1,685, 1,504–1,560, 1,433–1,456, and 1,383–1,385 cm−1 might be assigned to >C = O stretching vibration of esters, C = O stretching vibration of amide I, the C-N, N-H bending vibration in-plane of amide II, CH3 antisymmetric bending vibration, and CH3 symmetric bending of alkyl functional groups, respectively (Beekes et al., 2007). The amide I of peptide functional group at 1,646–1,685 cm−1 observed in B. mucilaginosus was reported as the highest adsorption peaks in proteins (Baldassarre et al., 2015). Again, peaks at 1,338 cm−1 which represented COO− symmetric stretching vibration of C-H deformation of >CH− could be due to poly glycerine I. The peaks within the range of 1,239–1,252 cm−1 may be assigned to P = O asymmetric stretching vibration of >PO2−, which are indicative of the presence of phosphodiesters or phospholipids (Garip, 2005). The bands within 1,239 to 1,385 cm−1 were observed in B. mucilaginosus biomass in Fig. 3 (B.M 3).
The following bands at 1,042, 1,079, 1,100, 1,106, and 1,155–1,165 cm−1 could be assigned to P = O symmetric stretching of phosphonate, C-O stretching of a primary alcohol, C-O or C-C stretching of CH3COOH (Sivaguru et al., 2019), Nitrile (N-C) alpha stretching pertaining to proteins and amino acids, and alpha-carbon β-carbon stretching (Narain, 2010). The peaks at 1,025–1,033, 876–877, 779–840, 704–772, and 505–696 cm−1 could be attributed to the C-N stretch of primary amine, P-O-C stretch of aromatic phosphate (Wiegand et al., 2013), the C-H bending relative to aromatic species, NH bend of poly glycerine I, and C-H bending vibration, respectively (El-Sheshtawy et al., 2016).
SEM and BET analysis characterizing biosorbents
The surface topographical characteristics of B. licheniformis and B. mucilaginosus biosorbents were studied using techniques of SEM. SEM micrographs were taken using JSM-IT300 electron microscope (JEOL) at 20 kV at the magnifications 10,000 × , 5,000 × , 2,000 × , and 1,000 × , respectively, for both biosorbents.
Rod-shaped structures (cells) were observed in both B. licheniformis and B. mucilaginosus. The SEM micrographs for both biosorbents are presented in Supplementary Figure S2.
B. mucilaginosus (Gram-negative) cells' surfaces are quite complex in terms of the structures and chemical composition compared to B. licheniformis (Gram-positive) cells. This is due to the presence of a thicker peptidoglycan layer in the cell wall of B. licheniformis in contrast with B. mucilaginosus cells. The single peptidoglycan layers in B. mucilaginosus consist of enzymes, lipoproteins, lipopolysaccharides, and phospholipids. In contrast, B. licheniformis cell walls are composed of thick homogeneous peptidoglycan layers that lie outside its plasma membrane. It contains a considerable amount of teichoic acid and glycerol. The presence of dense elastic and porous peptidoglycan sacs in B. mucilaginosus cell walls facilitates the passage of molecules (Steward, 2019).
The BET analysis results for B. licheniformis and B. mucilaginosus are indicated in Table 2. The graphs from BET and BJH plots are shown in Fig. 4(a,b) and (e,f) respectively. The BET and BJH constants are summarized in Supplementary Table S2. Based on IUPAC recommendation, when the BET constant (C) value is very low (C < 20), it is an indicator of overlap between considerable monolayer and multilayer adsorption overlap. Even though the C value could be used to characterize the BET isotherm range, it is unable to give a quantitative measure of the heat of adsorption. It could only give the magnitude of the sorbate-biosorbent interaction (IUPAC, 1985). The surface area for B. licheniformis and B. mucilaginosus was 0.9743 and 0.1767 m2/g, respectively. Although the surface area values for both biosorbents are small, compared to literature, Ntuli and Pakade (2019) reported a BET surface area of 0.065 m2/g for Macadamia nutshell pretreated with acid for Cr (VI) removal. These are indicative of mesopores and macropore saturation, in the range of 20–600 Å and 20–500 Å as shown in Fig. 4e and f (Sotomayor et al., 2018). However, the average pore diameter and BJH adsorption average pore diameter for B. licheniformis (211.499 Å and 205.369 Å) were slightly lower than those values for B. mucilaginosus (215.604 Å and 227.158 Å). It was reported that both B. licheniformis and B. mucilaginosus produce exopolymers or biopolymers (exopolysaccharides). These could probably be responsible for the types of adsorption isotherms observed (Xiong et al., 2010).
Cost analysis of biosorbents
The selection of a suitable biosorbent for the remediation of environmental pollutants is dependent on several factors, including the cost of the biosorbent. The application cost of a biosorbent on a large scale would be influenced by different factors such as the biosorbent consumption per unit volume of the treated effluent. The rest include electricity/energy cost, labor, regeneration cost, and spent disposal cost. The overall application cost of a biosorbent on a wide scale therefore must take into account the factors mentioned earlier (Kyzas and Kostoglou, 2014). The cost of 1 kg of B. licheniformis and B. mucilaginosus was U.S.$71.42 and U.S.$71.40, respectively. The cost of commercial activated carbon (Pure; Merck) was U.S.$111.37 per kilogram. Similarly, the cost of activated charcoal (Sigma-Aldrich) was U.S.$164.86 per kilogram (Reza et al., 2014). The cost of biosorbent has consequential implications on the total cost of the wastewater treatment process. In a scenario where the regeneration and reuse of the spent biomass are feasible, the overall application cost of the biosorbent would reduce considerably. The practical application cost of a biosorbent on a wide scale could be determined once the aforementioned parameters are established. Due to the high cost of commercial adsorbents, their application on the industrial scale comes with a huge financial burden on the industries; hence, the need to identify and develop alternative low-cost biosorbents capable of industrial application.
Conclusion
Biosorption studies were conducted on Cr (VI) removal in an aqueous-based medium using B. licheniformis and B. mucilaginosus. The optimum solution pH for B. mucilaginosus was 2, while pH 6 was for B. licheniformis. B. licheniformis recorded 48.8% removal, while B. mucilaginosus biosorbent recorded 94.8% removal of Cr (VI) ions. The FT-IR spectra analysis showed that peptide functional group especially amide I and II could enhance biosorption of Cr (VI) ions. BET surface areas for B. licheniformis and B. mucilaginosus were 0.9743 and 0.1767 m2/g, indicating that both biosorbents had slight porosity. The study showed that B. mucilaginosus was much efficient in the removal of Cr (VI) ions compared with B. licheniformis. The Temkin, Langmuir, and Freundlich models were used to evaluate the biosorption data. The results showed that the Temkin model fitted slightly well compared to Langmuir and Freundlich models regarding the biosorption of Cr (VI) in this investigation. The biosorption equilibrium data fitted well with the PSO kinetics model for both biosorbents. The corresponding regression coefficients (R2) were 0.9921 for B. licheniformis and 0.9965 for B. mucilaginosus. Given the results obtained from this study, B. mucilaginosus has proven to be efficient for the bioremediation of aqueous Cr (VI) and other similar heavy metals. Hence, it could serve as an alternative to the commercial biosorbents for the removal of heavy metals due to its cost-effectiveness and eco-friendly nature. Further investigation with regards to the regeneration and pretreatment of the biosorbents for the removal of raw industrial effluents could be useful.
Footnotes
Author Disclosure Statement
No competing financial interests exist.
Funding Information
This work was supported by Guangdong Regional joint fund (Grant No. 2019A1515110350), the 2019 ESI Discipline Environmental Science/Ecology Project (Grant No. 35401006), and the National Natural Science Foundation of China (51908436).
References
Supplementary Material
Please find the following supplemental material available below.
For Open Access articles published under a Creative Commons License, all supplemental material carries the same license as the article it is associated with.
For non-Open Access articles published, all supplemental material carries a non-exclusive license, and permission requests for re-use of supplemental material or any part of supplemental material shall be sent directly to the copyright owner as specified in the copyright notice associated with the article.