
Abstract
Non-road machinery is very important, but non-road machinery has problems such as working under complex operating conditions. Agricultural machinery is an important type of non-road machinery, which mainly relies on diesel engines due to their high fuel efficiencies. The exhaust temperature of agricultural machinery changes drastically under different working conditions. This article aims to research on pollution control of non-road machinery. Among the exhaust after treatment technologies, selective catalytic reduction (SCR) technology is a very important method to reduce NOx. In this study, a series of tests was conducted to investigate the effects of temperature and exhaust gas mass flow on the NOx conversion and dynamic ammonia storage space distribution characteristics in simulation models. The genetic algorithm, a kind of global optimization algorithm that can avoid local optimization, was used in the parameter identification process. The simulation results showed that the ammonia storage capacity of SCR catalyst decreases as the temperature of SCR increases. With the decrease in temperature, the NH3 desorption rate gradually decreased. An uneven distribution of ammonia storage similar to the shape of ɛ was observed in the simulation and this kind of uneven distribution is obvious at low temperature. The effective area of the catalyst is near the inlet of the catalyst. This work presents an approach to help figure out the details in the ammonia storage process. This work provides information about the dynamic ammonia storage characteristics and guide for better SCR design.
Introduction
Diesel engines have attracted significant attention in recent years mainly due to their higher fuel efficiencies and lower CO2 emissions compared to gasoline engines. However, one of the drawbacks of diesel engines is the higher NOx emissions. These NOx emissions have health effects, such as causing respiratory tract infections and asthma, and cause environmental problems, like acid rain and photochemical smoke (Knecht, 2008). Various methods have been adopted to reduce NOx emissions in diesel engines, mainly including in-engine purification technologies and exhaust aftertreatment technologies (Raptotasios et al., 2015; Hosseini et al., 2017; Liu et al., 2019). In-engine purification technologies include the optimization of the fuel injection system, the optimization of the combustion chamber, intercooling technology, and exhaust gas recirculation (Park and Yoon, 2015; Yoo, 2015). Exhaust aftertreatment technologies mainly include selective catalytic reduction (SCR) technology, lean NOx trap technology, NH3 oxidation catalytic technology, and lean NOx catalyst technology (Aswani et al., 2004; Zhao et al., 2011; Qian et al., 2017).
With future emission legislation becoming more stringent, SCR technology with a 32.5% aqueous urea solution (AdBlue) introduced to the diesel exhaust to provide reductant for NOx reduction reactions is currently used to meet the emission standards. The injected urea is converted to ammonia by three different processes: AdBlue evaporation, urea decomposition, and isocyanic acid (HNCO) hydrolyzation. The ammonia will be adsorbed onto the SCR catalyst to react with NOx. SCR has expanded into worldwide use. Furthermore, SCR technology will be required for many applications. However, too much urea will lead to tailpipe ammonia slip. The amount of tailpipe ammonia slip must be minimized, while trying to raise the NOx conversion efficiency. There are a series of factors affecting the SCR performance.
Xu et al. (2018) investigated the impact of a series of urea injection and mixing modules on NOx conversion through several tests. In engine dynamometer tests, the NH3 distribution was examined (Xu et al., 2018). It is widely recognized that the achievable NOx conversion can be sensitive to the spatial distribution of NH3-to-NOx ratio (ANR) at the converter inlet (McKinley et al., 2010). Oesterle et al. (2008) concluded that the maldistribution of NH3 can affect the SCR performance and the service life of the catalyst. In the automotive industry, the ammonia distribution on the catalyst surface has an important impact on the NOx conversion of SCR. The maximum conversion was found to be dependent on the distribution of NOx and NH3 on the surface in a vanadium-based SCR catalytic converter (Johansson et al., 2008). Maldistribution results in a decrease in the NOx conversion efficiency and increase in the ammonia slip (Vikas et al., 2012). Karlsson et al. (2006) illustrated that it is important to ensure that the ammonia profiles match the NOx profile for good NOx conversion, while evaluating the ammonia distribution of different mixer solutions. A mismatch will definitely have significant adverse effects on the SCR NOx reduction performance or lead to ammonia slip (Karlsson et al. 2006).
Hsieh et al. (2011) argued that unexpected ammonia slip can occur if the ammonia adsorption capability is not well estimated in SCR modeling. Tang et al. (2015) conducted experiments and found that the reaction rate will be higher when the concentration of ammonia on the surface of the catalyst increases. Many SCR models have been established for both Cu-zeolite and Fe-zeolite catalysts. A single ammonia storage site was used in most of the published models (Markatou et al., 2011; Watling et al., 2011; Colombo et al., 2012). Colombo et al. (2012) developed a new dual-site approach to establish a new model for obtaining an accurate description of the NH3 adsorption/desorption over the entire 50–550°C temperature window. Song et al. (2014) investigated the effects of maldistribution of NH3 on SCR performance using a one-dimensional (1D) model for a Cu-zeolite SCR and concluded that the SCR inlet NH3 maldistribution had an adverse effect on NOx reduction efficiency over a surrogate Heavy-duty federal test procedure cycle.
Several studies have suggested that the catalyst ammonia adsorption capability can change with temperature, and the ammonia adsorption/desorption reactions are highly related to the SCR storage capacity (Ciardelli et al., 2004; Willems et al., 2007; Joo et al., 2008). Olsson et al. (2015) have developed a kinetic model for ammonia-SCR over a Cu/SSZ-13 catalyst and propose a three-site model. The model using these three storage sites could well describe the ammonia Temperature Programmed Desorption experiments, with storage at 50°C and 150°C. When using the full model, including the N2O mechanism, the model was capable of describing all experimental features for NO, NH3, and N2O across the entire temperature interval (100–600°C) (Olsson et al. 2015). Gong et al. (2016) propose a heterogeneous single-site model considering the heterogeneity of ammonia storage sites. This model more accurately predicts ammonia storage in the temperature window of 150–400°C.
Song et al. (2013) pointed out that the stored NH3 participates in all SCR reactions, so the ammonia storage capability of the catalyst has a significant impact on the reaction rates of SCR reactions. The ammonia storage at different axial locations of the SCR system can be predicted using their proposed model, which is of great value for control applications (Song et al., 2013). Kalyankar et al. (2015) developed two predictive modeling approaches to assess the effect of ANR nonuniformity on the SCR + ammonia slip catalyst performance. They found that the ANR uniformity is of great significance for NOx conversion. The transient de-NOx efficiency increased with increase in the weighted uniformity index, which was proposed in this work as being more representative of a transient cycle (Kalyankar et al., 2015). Lin and Chen (2019) established a new SCR platform and conducted simulations with it to investigate the impact of ammonia storage nonuniformity on SCR performance. To estimate the ammonia storage coverage ratio uniformity, a novel diagnostic methodology was introduced and verified under the US06 cycle (Lin and Chen, 2019).
Many studies have been conducted on SCR technology. Most of these studies focused on the NOx conversion efficiency, control strategies, and ammonia tailpipe slip of the SCR. Studies on the temporal and spatial distribution of NH3 in the SCR would be useful for studying the chemical reaction process inside the SCR in detail. Ammonia storage nonuniformity has an adverse effect on the SCR performance. For urea-based SCR systems, the ammonia concentrations in the radial and axial directions are difficult to detect because no exhaust sensor can directly measure the ammonia storage on the catalyst surface. The effect of NOx and ammonia uniformity at the SCR catalyst entry on the NOx conversion and ammonia slip is of interest. In this article, the influence of the SCR inlet temperature and the influence of the initial ANR on the dynamic characteristics of the spatial distribution of ammonia storage and the NOx conversion efficiency in the SCR are studied in simulations. A diesel engine, a supporting SCR system, and the professional engine Computational Fluid Dynamics simulation software AVL FIRE and AVL BOOST were used to study the spatial distribution characteristics of NH3 inside the SCR over time, the results of which can be used to optimize the SCR system. The kinetics parameters are adjusted by an automatic parameter optimization procedure in AVL Boost software. The genetic algorithm, a kind of global optimization algorithm that can avoid local optimization, was used in the parameter identification process to optimize the parameters. The numerical model, based on SCR kinetics, is validated with experiment data.
In this work, a non-road steady cycle (NRSC) test was conducted to verify the accuracy of the SCR 1D model and the effects of the inlet temperature of SCR on the dynamic characteristics of the ammonia storage space distribution at different times were studied. There are not many studies focused on the dynamic characteristics of the ammonia storage space distribution. The simulation can be used to support design decisions and shorten the overall development process of SCR systems.
Experiment and Methods
Experimental equipment
This study was conducted in accordance with the declaration of China, and the protocal for this original articles was approved by the Institutional Review Board. The study focused on a vanadium-based SCR catalyst from an exhaust system equipped with an agricultural supercharged intercooled diesel engine (Fig. 1).
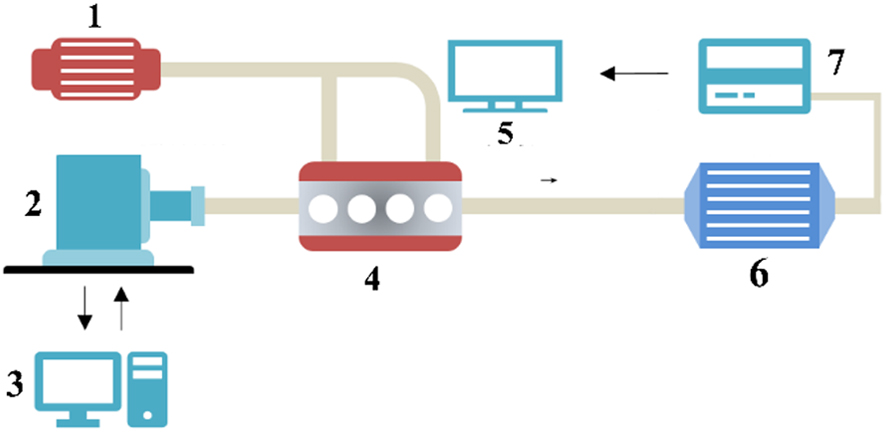
Schematic diagram of the experimental system.
The parameters of the SCR that is used in the experiment are shown in Table 1. The specification of the engine that is used in the experiment is described in Table 2. The test equipment is listed in Table 3.
Specifications of the Selective Catalytic Reduction System
Engine Specifications
Detailed Information of Test Equipment
Experiment data
In the NRSC, the engine speed, engine torque, and NOx concentration at the SCR outlet from 0 to 4,800 s are shown in Fig. 2. The NOx concentration at the SCR outlet changes as the torque and speed of the engine change from 0 to 4,800 s in the NRSC test.
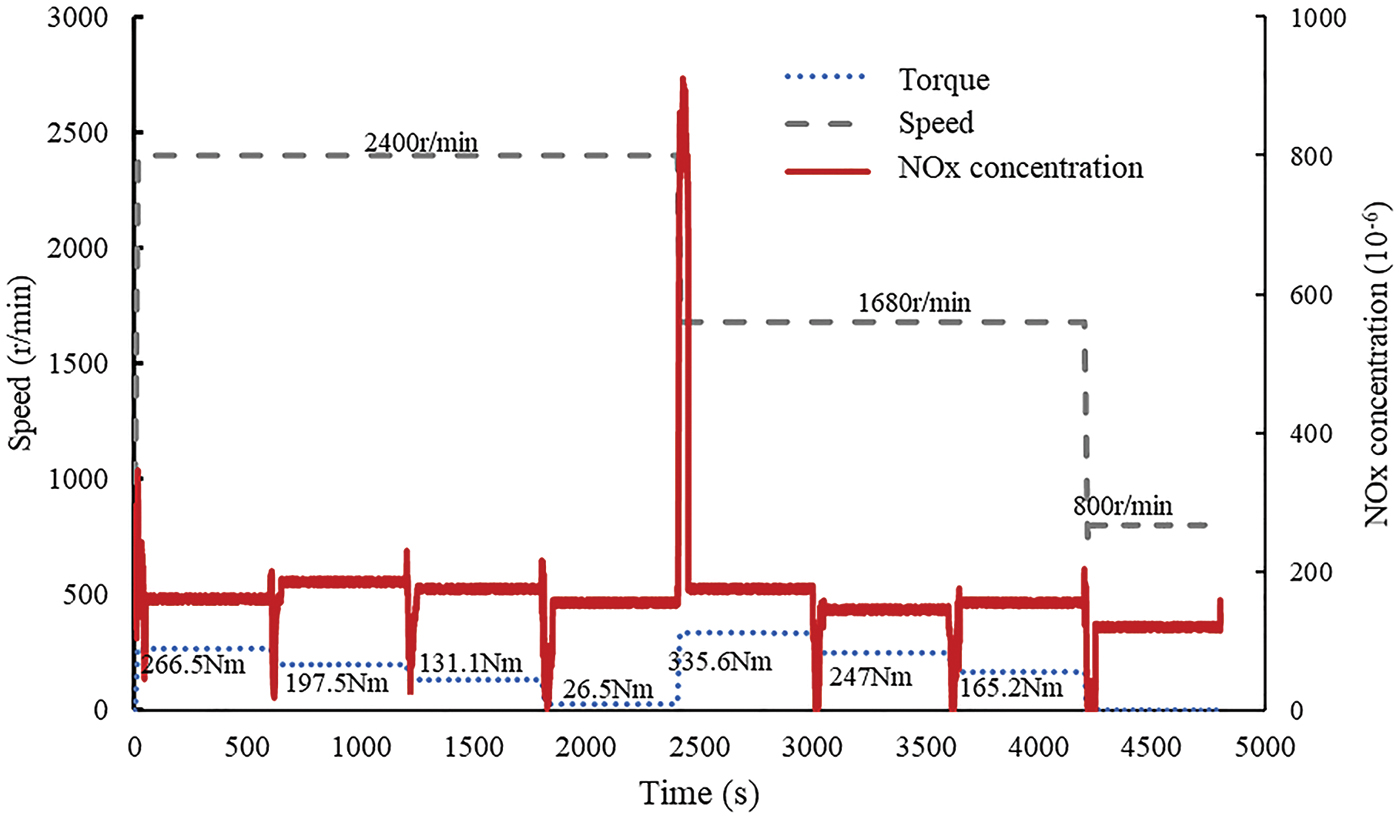
The engine speed, engine torque, and NOx concentration at the SCR outlet in NRSC. NRSC, non-road steady cycle.
Figure 2 shows that the NOx concentration at the SCR outlet was high when the engine load was high. There was a relationship between the NOx concentration at the SCR outlet and the torque of the diesel engine. Around 2,500 s, the NOx concentration at the SCR outlet increased heavily. That was because the torque of the engine increased suddenly, leading to an increase in fuel injection and an increase in temperature. The high temperature of the diesel engine can easily cause NOx.
AVL AMA i60 gas analyzer was used to measure the NOx concentration in the experiment test. The NOx concentration at the inlet and outlet of the SCR is measured by the AVL AMA i60 gas analyzer; the NOx conversion efficiency is defined as
(the NOx concentration at the inlet of the SCR − the NOx concentration at the outlet of the SCR)/the NOx concentration at the inlet of the SCR.
Figure 3 shows the NOx conversion efficiency and the exhaust temperature in NRSC. It can be concluded that the NOx conversion efficiency has a relationship with the exhaust temperature, which was mainly due to the fact that the activity of the SCR catalyst increased with the temperature in the temperature range in the experiments.

Exhaust temperature and NOx conversion efficiency in NRSC.
Figure 4 shows the NO concentration and NO2 concentration in NRSC. The NO2 concentration was far less than the NO concentration. This result was in line with the fact that the NO concentration accounted for almost 90% of the diesel engine exhaust and NO2 concentration accounted for almost 10% of the diesel engine exhaust in most situation.
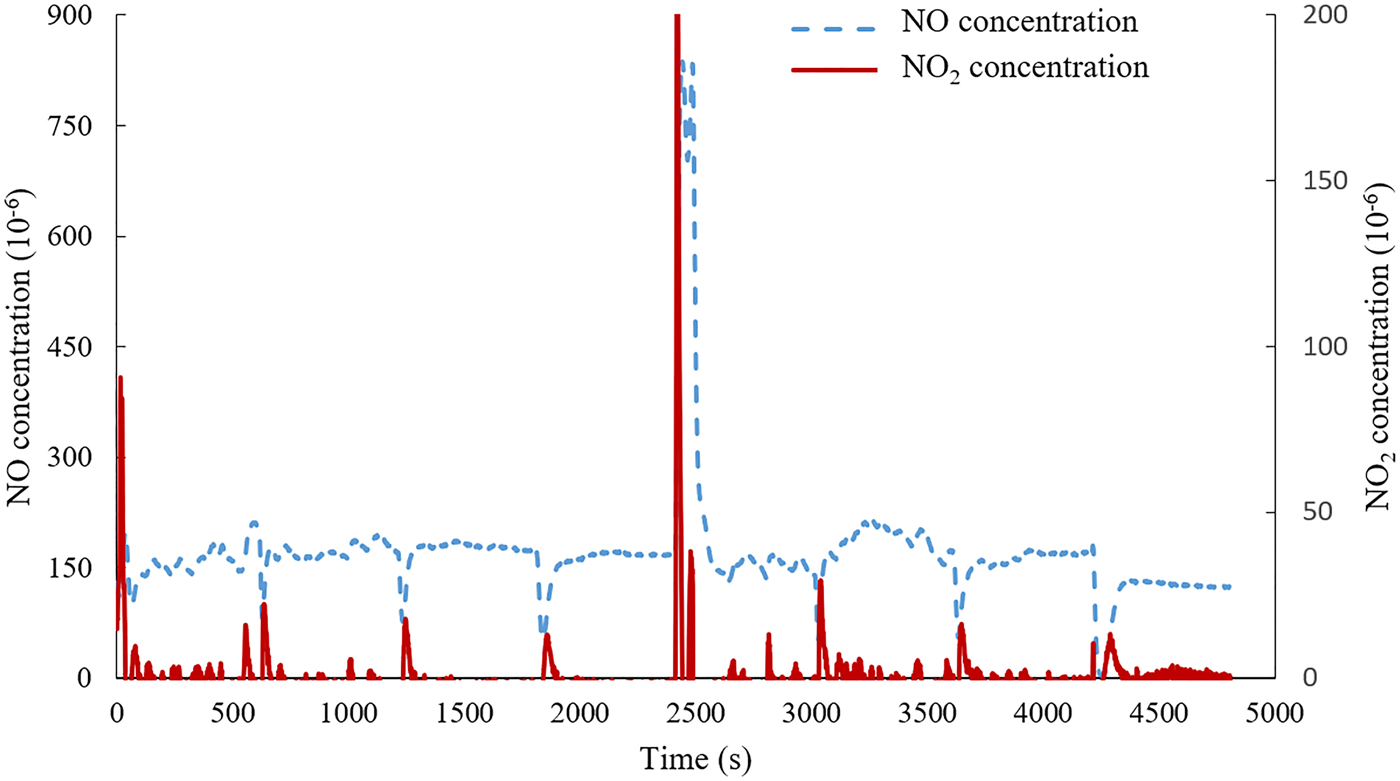
NO concentration and NO2 concentration in NRSC.
Around 2,500 s, the NO2 and NO concentration increased rapidly, which was because the engine torque increased and the engine speed decreased, leading to rapid increase in exhaust temperature. At high temperature, engines generate nitrogen oxides easily, which was why the NO2 and NO concentration increased rapidly around 2,500 s.
Model description
To calculate the NOx concentration at the SCR outlet in the simulation, many equations such as the solid energy balance equation, the species conservation equation, the energy balance equation of the gas phase, the solid phase energy balance equation, and the SCR reaction equations were included in the model.
The main assumptions in this study are as follows:
Ignore the effect of H2O on the SCR reaction; In the SCR, the oxidation of NO is ignored and the reaction of NH3 and O2 is considered; The SCR conforms to the Eley-Rideal reaction mechanism, that is, the gas phase NO reacts with strongly adsorbed NH3, and the process of NH3 adsorption and desorption is considered; Suppose that the urea aqueous solution is completely evaporated and decomposed into NH3; Assuming that the fluid flow in the channel is 1D steady flow, and the gas phase components are evenly distributed at the inlet cross-section of the catalyst model channel; Assuming that the conditions of each single channel of the catalyst model are exactly the same, there is no radial fluid velocity gradient and material concentration gradient in the normal section perpendicular to the fluid flow direction; Ignore the heat transfer between the catalyst carrier and the external environment, assuming that the model is insulated from the outside.
Based on these assumptions, a 1D high-fidelity model and a three-dimensional (3D) model were built up for simulating species transport from the bulk fluid stream to the solid surface and chemical reactions that occur inside the porous catalyst, considering both the physical transport and chemical kinetic steps.
Due to chemical reactions, the number of moles in the SCR changes, but their overall mass remains constant. Therefore, mass balances are often preferred.
The models describe a system consisting of two different phases (gas and solid substrate) with two different volumes. The volume of the gas phase in this system is given by means of an overall volume fraction. This volume fraction of gas phase in the entire system is defined as follows:
where ɛg is the volume fraction of the phase g(as) in the entire volume V.
The volume of the solid phase Vs is evaluated by
If one phase comprises several different species, the density of the entire phase ρg is the sum of the densities of all different species k in it; k is the species index.
The mass fraction wk,g of one species in a system is defined as follows:
where ρk,g is the density of the species and ρg is the total density.
In the models, the ideal gas law is applied:
where ρg is the mass density, pg is the pressure, MGg is the total molar mass, which is a function of the composition of the different species k in the considered phase, Tg is the temperature, R is the ideal gas constant, and MGk,g represents the molar mass of species k in the gas phase.
Solid energy balance equation:
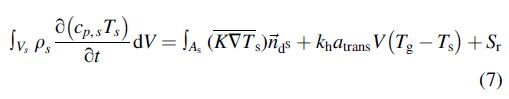
where Vs is the solid volume part of the cell, ρs is solid density, cp,s is the specific heat of the solid phase, Tg and Ts are the gas and solid temperature, t is the time, V is the volume of a computational cell, As is the surface of the solid part in a computation cell, K is the anisotropic heat conduction matrix, n is the normal vector to the surface cell, S is the surface of the solid part of a computational cell, kh is the gas-solid heat transfer coefficient, atrans is the geometric surface area per unit volume, and Sr is the chemical reaction source.
The chemical reaction source is given by
where
The sources in the species conservation equations are given by
The entire converter can be represented by one single channel under the assumption that radial transport effects are small compared to the heat transport in axial direction.
The continuity equation of the gas phase is as follows:
where ρg the density of the gas phase, t is the time,
The momentum conservation equation is given by the steady-state Darcy equation:
where pg is the pressure of the system. The Darcy constant AD can be described by:
dhyd represents the hydraulic channel diameter and
The species conservation equation is as follows:
where
The energy balance of the gas phase is as follows:

where hk is the total enthalpy of the component k, λg is the thermal conductivity, kh is the gas–solid heat transfer coefficient, and Δhi is heat of reaction I; this heat is released in the solid phase and converted into the gas phase.
The solid phase energy balance equation is as follows:
where λs is the thermal conductivity of the catalyst wall and
Under the assumption of quasi steady-state conditions, the rates of the catalytic surface reactions balance the diffusive transport from the bulk gas to the surface. Thus, the molar surface concentration
where
The amount of a certain species stored on the surface is represented by a surface fraction θ. The conservation of this species on the surface is accounted for by the following equation:
where the product
The models calculate the transfer coefficients for mass and heat inside the catalytic monoliths based on empirical relationships for Nusselt and Sherwood numbers. One researcher (Perry, 1942) suggests the following equations should be applied:
where Re is the Reynolds number, Pr is the Prandtl number, Sc is the Schmidt number, l is the channel length, and d is the channel diameter.
A 1D high-fidelity model with mass transfer, heat transfer, and a global reaction mechanism was developed for the vanadium-zeolite SCR. The model was calibrated and validated for both the reactor and engine experimental data.
The following reactions are considered (Wurzenberger and Wanker, 2005):
The ammonia storage reaction includes the following reactions and the rates of the reactions are described. The model considers the adsorption and desorption of ammonia at the solid surface and is dedicated to resolve transient operating conditions. The dynamic ammonia storage is important for NOx conversion and we take it into consideration in the model. The stored amount of ammonia influences different SCR reactions.
The rate expressions for NH3 adsorption and desorption are described as follows:
ka is adsorption rate constant,
All simulations began with no NH3 storage in the SCR catalyst. The experiment was carried out on a small agricultural machinery diesel engine in NRSC. The test operation points are shown in Table 4.
Non-Road Diesel Steady Cycle Operation Points
Ei, activation energy of the reaction I, and K, the frequency factor, are selected as the parameters to be identified. To improve the accuracy of the models, the AVL Design Explorer tool was applied to optimize the parameters. After the model parameters were identified by the AVL Design Explorer tool, the NOx conversion of the SCR was compared in the tests and the simulation.
Genetic algorithm is an algorithm that simulates biological evolution mechanism. It has strong global optimization capabilities. It is a simple and easy method that is suitable for multiobjective optimization. The number of parameters to be identified in the SCR model is large, meaning a multiobjective optimization. Based on this, the genetic algorithm in the AVL Design Explorer tool is selected as the optimization algorithm. The genetic algorithm is suitable for multiobjective optimization and can avoid local optimization, while being used in the parameter identification process.
The genetic algorithm is needed to optimize parameters that include Ei and K. These factors directly affect the DeNOx capability of the SCR catalyst under different conditions and have an influence on the internal reaction rate of SCR.
The parameters of the genetic algorithm used in the parameter identification process are shown in Table 5. With the aid of the AVL Design Explorer platform, genetic algorithm is selected to optimize the simulation model. Genetic algorithm is a global optimization method based on natural biological evolution theory. The values of the genetic algorithm parameters in Table 5 are set in the AVL Design Explorer platform, while applying genetic algorithm. The NOx concentration at the outlet of the SCR can reflect the performance of the SCR. The NOx concentration is selected as the target curve in the AVL Design Explorer platform, and the average value of the variance of the NOx concentration at the outlet of the SCR in the simulation and the experiment is selected as the objective function.
Genetic Algorithm Parameters
The GA is used to optimize parameters Ei and K in the 1D model. The parameters listed in Table 5 are the internal results of the GA. Based on these results in the 1D model, the 3D SCR catalyst model was established in the AVL FIRE software. The simulation of the storage was obtained in the 3D SCR catalyst model.
The SCR NOx conversion comparison between the model and experiments is shown in Fig. 5.

The SCR NOx conversion comparison between the model and experiments after the parameters were identified.
The simulated values of the SCR NOx conversion efficiencies of the model after the model parameters were identified were similar to the experimental values overall. The average difference between the two was about 5%. Thus, the SCR 1D model was deemed sufficiently accurate.
The influence of the SCR inlet temperature and the exhaust gas mass flow at the SCR inlet on the NOx conversion of SCR and tailpipe ammonia slip was studied in the model.
Results and Discussion
Effect of the inlet temperature of SCR catalyst on conversion efficiency
In the model, the exhaust gas mass flow was set as 480 kg/h, the ANR at the inlet of the SCR system was set as 1:1, and the volume fractions of NH3 and NOx were 750 × 10−6.
To illustrate how the conversion efficiency of NOx changes when temperature varied, simulations were conducted. The relationship between the NOx conversion and the SCR inlet temperature is shown in Fig. 6.
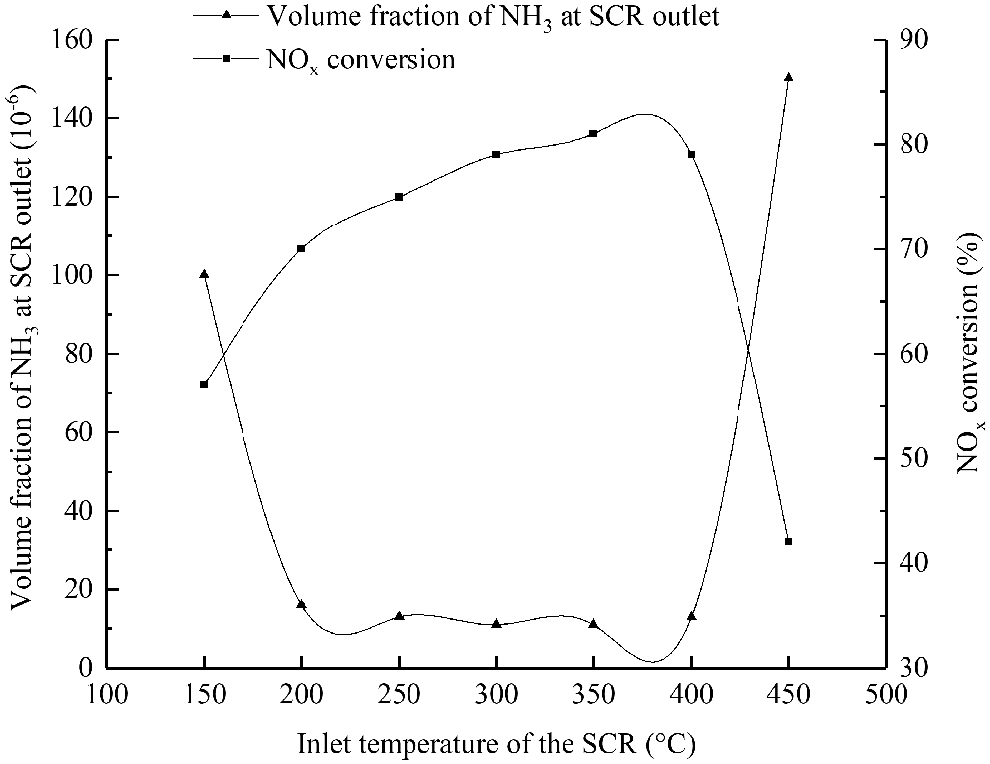
Relationship between the NOx conversion of the SCR, volume fraction of NH3 at the SCR outlet, and the SCR inlet temperature.
The NOx conversion efficiency first increased and then decreased when the temperature increased within the range of 100°C and 550°C. The catalyst basically lost its catalytic reaction ability when the temperature exceeded 550°C.
Because the NOx conversion was low when the temperature was lower than 100°C or higher than 450°C, the simulation to examine the relationship between the volume fraction of NH3 at the outlet of the SCR system and temperature was conducted within a temperature range of 100°C and 450°C. The relationship between the volume fraction of NH3 at the SCR outlet and the SCR inlet temperature is shown in Fig. 6.
As shown in Fig. 6, the volume fraction of NH3 at the outlet of the SCR system decreased first and then increased with an increase in temperature. When the inlet temperature was 150°C, the volume fraction of NH3 at the outlet of the SCR system was 100 × 10−6. Within the temperature range of 200–400°C, the tailpipe ammonia slip was very low because the reaction in the SCR catalyst proceeded thoroughly. The minimum of the tailpipe ammonia slip was ∼10 × 10−6 at 350°C. When the temperature was 450°C, the volume fraction of NH3 at the outlet of the SCR system was as high as 150 × 10−6. When the temperature further increased, the activity of the reaction catalyst decreased rapidly, resulting in high tailpipe ammonia slip.
Effect of exhaust gas mass flow on conversion efficiency
In the model, the ANR at the SCR inlet was set to 1:1, meaning that the volume fractions of NH3 and NOx were 750 × 10−6.
Simulations were conducted to study the relationship between the NOx conversion, as well as the tailpipe ammonia slip and the exhaust gas mass flow when the SCR outlet temperature was 150°C. The NOx conversion has a strong relationship with the SCR inlet temperature. However, the SCR inlet temperature was set as 150°C all the time when exhaust gas mass flow increases, resulting that NOx conversion does not change a lot.
As shown in Fig. 7, when the exhaust gas mass flow was in the range of 200–1,500 kg/h, the NOx conversion gradually decreased a little as the exhaust gas mass flow increased. As the exhaust gas mass flow continued to increase, its effect on the NOx conversion efficiency gradually weakened. When the exhaust gas mass flow was between 200 and 800 kg/h, the NOx conversion efficiency decreased from 57.98% to 55.62%. In the range of 800–1,500 kg/h, the NOx conversion efficiency decreased from 55.62% to 55.06%, and thus, it was almost unaffected by the exhaust gas mass flow. Figure 7 shows that the volume fraction of NH3 at the outlet of the SCR system increased with an increase in the exhaust gas mass flow.

Relationship between the NOx conversion, the NH3 concentration at the SCR outlet, and the exhaust gas mass flow when the SCR outlet temperature was 150°C.
SCR 3D simulation based on ammonia storage dynamics
In the previous sections, the parameters of the SCR 1D catalyst model were identified, and the experimental results were compared with the simulation results to prove the accuracy of the 1D model. Based on these results, a 3D SCR catalyst model was established in the AVL FIRE software. The SCR parameters in the 3D SCR catalyst model were consistent with the 1D model. The 3D model is used to analyze the ammonia storage characteristics inside the SCR catalyst. The SCR 3D model and grid established by the AVL FIRE software are shown in Fig. 8.

The material transport and aftertreatment modules were included in the 3D model. Based on the 1D simulation model parameters, the inlet boundary conditions of the 3D model were set, including the diesel exhaust gas temperature, exhaust gas mass flow, and gas component concentrations. The SCR outlet pressure was set as standard atmospheric pressure. To simplify the model, the temperatures of the tube wall surface and catalyst were set to 300 K. The initial temperature of the fluid was also set to 300 K. The initial values of the parameters in the 3D model are shown in Table 6. In the analysis below, the influence of temperature of the inlet of SCR on the dynamic characteristics of the spatial distribution of ammonia storage and its effect on the NOx conversion efficiency are examined by changing the temperature of the inlet of the SCR system at different times.
Initial Values of Parameters in the Three-Dimensional Model
Effect of inlet temperature of SCR on dynamic characteristics of ammonia storage along axial direction
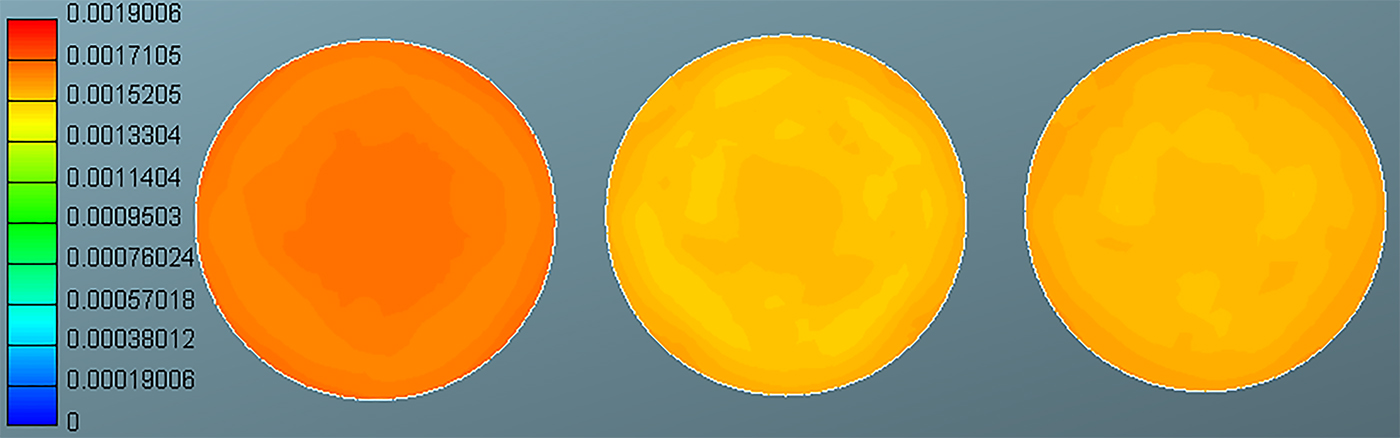
Due to the nonuniformity of fluid flow and heat exchange, the temperature of the SCR catalyst is not uniform. The rate of reaction has a relationship with the temperature of the SCR, resulting in an uneven ammonia distribution in the SCR catalyst. The distribution of ammonia storage in the SCR is critical to the NOx conversion efficiency. In the models, the exhaust gas mass flow was set to 480 kg/h, the ANR at the inlet of the SCR was set to 1:1, and the volume fractions of NH3 and NOx were 750 × 10−6. The influence of temperature on the performance of the catalyst is analyzed; 150°C, 350°C, and 500°C were selected as the low, medium, and high temperature, respectively. The distribution maps of the ammonia storage mass fraction along the axial direction are shown in Fig. 9. Figure 9 shows the ammonia storage in the SCR catalyst along the axial direction at different temperatures and different time. The scale on the left represents the amount of the NH3 adsorbed, the unit is kg/m3.

Axial distributions of ammonia storage at different inlet temperatures of the SCR.
It can be observed that large numbers of NH3 is adsorbed on the front end of the SCR first and the adsorption in the central area is larger. As the NH3 continues to flow in, the NH3 gradually expands and reaches a saturated state at a certain time. The adsorption amount of NH3 is higher in the center area and the area near the wall surface than other areas when the carrier reaches the adsorption saturation state, forming an uneven distribution similar to the shape of ɛ. This phenomenon is mainly due to the uneven distribution of flow velocity and temperature inside the SCR. The flow velocity in the center area of the SCR is high, providing enough NH3 supply. In addition, the heat exchange between the wall of the carrier and the external environment makes the wall temperature relatively low, which results in higher adsorption near the wall area. The distribution similar to the shape of ɛ is obvious at low temperature and middle temperature, but it is not obvious at high temperature. The major reason is that the effect of the flow velocity on the adsorption amount is relatively weak because of the high temperature and high rate of adsorption.
As the temperature increases, the amount of saturated adsorption on the carrier decreases, meaning that the ammonia storage capacity of the catalyst decreases with temperature.
The effective length of the SCR is over 95% of the total length at low temperatures. At high temperatures, the effective length of the SCR is about 1/3 of the total length.
At different temperatures, the time it takes to reach the saturated adsorption state is different. It takes about 25 s at 150°C, about 20 s at 350°C, and about 15 s at 500°C for the SCR to reach the saturated adsorption state in the models. The time consumed to reach the saturation state does not depend on the temperature of the SCR, but depends on the storage capacity of the SCR and the rate of adsorption at different temperatures.
At low temperatures, the storage capacity of the SCR is high and the rate of adsorption is high. At high temperatures, the storage capacity of the SCR is low and the rate of adsorption is low.
The rate of adsorption can be described as follows:
where r is the rate of the total adsorption, ra is the rate of the adsorption of NH3, rd is the rate of the desorption, and rreact is the rate of the NH3 consumed in reactions.
At high temperatures, the storage capacity of the SCR is low and the catalyst is active. ra, rd, and rreact are high at high temperatures. And r, the rate of the total adsorption, is low at high temperatures.
Effect of inlet temperature of SCR on dynamic characteristics of ammonia storage along radial direction
An initial temperature of 350°C was selected to study the radial ammonia storage dynamic characteristics using the 3D simulation. Three cross-sections were selected to study the radial ammonia storage dynamic characteristics in the 3D model, as shown in Fig. 8. Select three positions α, β, and γ, along the axial direction of SCR to study the dynamic characteristics of ammonia storage of SCR at 350°C.
Figure 10 shows the distribution of the dynamic ammonia storage mass fraction along the radial direction of SCR model at 350°C over time at the selected three cross-sections. At the beginning, the temperature at section α is higher than section β and γ because section α is near the SCR inlet. The ammonia storage at section α is more than section β and γ because exhaust gas flows along the axial direction of the SCR and ammonia first adsorbs at section α.

Radial distribution of ammonia storage mass fraction with time at 350°C in the selected three cross-sections.
At the different axial positions, the radial ammonia storage dynamic characteristics were basically the same, and the adsorption of NH3 diffused radially from the center to the edges. After reaching the saturated ammonia storage state, the desorption of NH3 also began from the center.
Figure 11 shows that ammonia storage began to show an uneven distribution at 35 s. This was mainly due to the uneven distribution of the temperature and space velocity at this stage.
Radial distribution of ammonia storage mass fraction in the selected three cross-sections at 35 s.
As shown in Fig. 12, the ammonia storage in all three regions reached a steady state at 130 s. The ammonia storage amount at this time gradually decreased along the axial direction from the first to the third region. This showed that the storage of ammonia was high in the center, low in the surrounding areas, and high at the edges. These phenomena were caused by the uneven distribution of temperature and space velocity.

Distribution of NH3 at 130 s when the storage state was stable.
At 350°C, the adsorption started at 5 s. At this time, the amount of NH3 adsorbed at the center of section α is 0.017–0.018 kg/m3, and the amount of the NH3 adsorbed at the center of sections β and γ is almost 0 kg/m3. Section α reaches the adsorption saturation state at about 10 s. Section β reaches the adsorption saturation state at about 15 s. Section γ reaches the adsorption saturation state at about 20 s. It can be seen that the time consumed to reach adsorption saturation state increases with the deepening of the axial position. The adsorption amount in the central area and near the edge is the largest, which is due to the uneven distribution of ammonia storage caused by different temperatures and space velocities in different positions of the SCR. The flow velocity is high in the center area of the SCR and low near the edge area. The temperature near the center of the SCR is high and the temperature near the edge of the SCR is low.
Summary and Conclusions
In this study, a diesel engine and a vanadium-based SCR catalytic converter were studied in the NRSC. The effects of the temperature and exhaust gas mass flow on the SCR performance were studied in the SCR 1D model. A 3D model of SCR catalyst was established to study the ammonia storage characteristics of SCR. The following conclusions were obtained:
When the inlet temperature of the SCR was in the range of 100–550°C, the NOx conversion efficiency increased first and then decreased as the temperature increased. The rate of reaction increased with increasing temperature. The effect of the exhaust gas mass flow on the NOx conversion efficiency was evident at low temperature conditions.
The ammonia storage capacity of the SCR catalyst decreased as the temperature of the SCR increased.
The effective length of the SCR decreased as the temperature of the SCR increased, and the effective area of the catalyst was near the inlet of the catalyst.
An uneven distribution of ammonia storage similar to the shape of ɛ was observed in the simulation and this kind of uneven distribution was obvious at low temperature.
Footnotes
Acknowledgments
This work was supported by the National Key R&D Program of China (grant number 2017YFC0211205). The authors would like to thank the editors and anonymous reviewers for their suggestions to improve this article.
Author Disclosure Statement
No competing financial interests exist.
Funding Information
This work was supported by the National Key R&D Program of China [grant number 2017YFC0211205]. The authors would like to thank the editors and anonymous reviewers for their suggestions to improve this paper.