




Abstract
In this study, partially graphitic biochar was synthesized using peanut shell biomass and potassium ferrate (K2FeO4) with a simple strategy and applied for the removal of two commonly used nonsteroid anti-inflammatory drugs (ibuprofen [IBU] and diclofenac [DCF]) from water. K2FeO4 0.1 M was found to be the suitable concentration for the conversion from pristine biochar to partially graphitic biochar. After modification, the scanning electron microscopy image revealed an extremely rough and heterogeneous surface of the modified biochar (PK01), while the HRTEM, X-ray diffraction, and Raman spectra analyses indicated the presence of graphitic component in PK01 structure. Characterization results indicated that the synthesized nanomaterial simultaneously possessed the properties of graphitic carbon and porous biochar with relatively large specific surface area (374.0 m2/g), as well as micro/mesopore structure. The effect of ambient conditions (contact time, temperature, and solution pH) on the adsorption processes of two contaminants was investigated. The experimental results suggested that the pseudo-second-order, Langmuir, and Freundlich models could well describe the attached behavior of IBU and DCF onto the adsorbent (PK01). In all experiments (single, binary, and real water sample systems), DCF exhibited higher adsorption capacity compared to that of IBU, due to the more H-bond acceptor of the DCF molecule compared with IBU. The H-bonding interactions could be the major driving force for the attachment of two adsorbates onto the adsorbent surface, followed by electrostatic attractions, and π-π EDA interactions. Based on the experimental results, PK01 can be suggested as a potential adsorbent for the removal of nonsteroidal anti-inflammatory drugs from water bodies.
Introduction
In line with tremendous growth in the development and application of pharmaceuticals to treat human or veterinary diseases, pharmaceuticals as emerging contaminants (ECs) have received a great concern in recent years (Wang et al., 2018). After being used, these pharmaceuticals are released into the receiving environments through wastewater treatment plants (WWTPs) or direct disposal. On the one hand, many studies have been conducted for monitoring the presence of various pharmaceutical residues in sewage treatment plant effluents, as well as surface water, groundwater, and sediments worldwide (Zhang et al., 2009; Chander et al., 2016). On the other hand, concerns about the development of efficient methods for the removal of such ECs are increasing.
Diclofenac (DCF) and ibuprofen (IBU) are the most widely used nonsteroidal anti-inflammatory drugs (NSAIDs) in the world due to their extensive treatment range (e.g., pain killers, inflammation in different arthritic and postoperative situations) (Mlunguza et al., 2019). They are commonly nonbiodegradable and not easy to be eliminated completely from conventional WWTPs (Bhadra et al., 2017).
Various methodologies have been developed to remove DCF and IBU from water bodies such as electrochemical degradation (Pourzamani et al., 2018), chlorination (Simazaki et al., 2008), advanced oxidation processes (Perisic et al., 2016; Saeid et al., 2018), ozonation (García-Araya et al., 2010; Quero-Pastor et al., 2013), photodegradation (Chianese et al., 2016; Tanveer et al., 2019), membrane filtration (Shojaee Nasirabadi et al., 2016), ultrasonic irradiation (Nie et al., 2014), and adsorption (Ghemit et al., 2019; Phasuphan et al., 2019; Tam et al., 2020). Among those mentioned techniques, adsorption has gained much attention from environmentalists and researchers because of its simplicity, less time consuming, reliability, and low cost (Yin et al., 2018).
Different materials have been fabricated and used as adsorbents for DCF and IBU removal from aqueous systems (Álvarez et al., 2015; Hu and Cheng, 2015; Czech, 2016; Ghemit et al., 2019; Liang et al., 2019; Mlunguza et al., 2019; Wu et al., 2019). Despite the availability of various commercial adsorbents, their widespread use is often restrained because of high cost and limited accessibility. Thus, scientists have been attempting to develop adsorbents that are low cost, but high efficiency. In recent years, biochar has appeared as an emerging carbonaceous material that may address the current demands on alternative adsorbents due to its own advantages such as rich carbon content, large surface area, more oxygen-containing functional groups, and good porous structure, which are beneficial for contaminant adsorption process (Tan et al., 2015).
However, the adsorption performance of biochar is usually limited by its own surface and structural properties. In addition, the difficulty in eliminating the powered biochar from the water matrices may lead to secondary pollution and hinder the large-scale application of biochar as an adsorbent (Yin et al., 2018). Hence, it is essential to enhance the adsorption properties of biochar in terms of water pollution treatment. For this purpose, many studies have been conducted using different chemical reagents to modify biochar, such as KMnO4 (Qiu et al., 2019), ZnCl2 (Abo El Naga et al., 2019), MnOx (Liu et al., 2019), K2CO3 (Xia et al., 2018), and potassium ferrate (K2FeO4) (Thi Minh Tam et al., 2019).
K2FeO4 is a strong oxidant that has been widely applied in wastewater treatment. The compound was directly used for oxidizing different organic compounds such as aldehyde (Bartzatt and Carr, 1986), aliphatic sulfur (Johnson and Read, 1996), and alcohol (Delaude and Laszlo, 1996). In addition, it was also used for the removal of toxic metal ions from polluted water (Bartzatt, 2016). However, the application of K2FeO4 for ECs has not been widely discovered. Some previous studies utilized K2FeO4 as activated agent to modify biochar. For example, Gong et al. (2017) prepared a three-dimensional porous graphitic carbon material for super capacitor, Zhou et al. (2017a) studied about the fabrication of K2FeO4-impregnated biochar and its application for the removal of elemental mercury from flue gas, and Liu et al. (2020) proposed a new adsorbent for 17β-estradiol removal derived from lotus seedpod biomass.
From those studies, K2FeO4 has been proven as a promising reagent in improving the pore structure and producing new active site such as FeO42−, Fe2O3. In addition, it could be used as both activating agent (KOH) and catalyst (Fe) to convert biomass into graphitic carbon with a good porous structure and high graphitization degrees. Moreover, the introduction of iron oxide by K2FeO4 would pave the way for the magnetic separation technology, which overcomes the disadvantage of collecting biochar after adsorption and enables the reuse of biochar. Thus, the outstanding properties of K2FeO4 have inspired the author to explore the question that when the activator concentration varies, how it will affect the conversion material structure from amorphous to partially graphitic carbon.
In the present work, modified biochar was synthesized after the twice-pyrolysis process, which can be divided into three stages. In the first stage, pristine biochar was prepared at high temperature (900°C) to enhance its graphitization. Biochar was then activated by K2FeO4 solution at room temperature in the second stage, and the post-treated biochar was pyrolyzed under N2 atmospheric condition in the third stage. Peanut shell biomass (PB) with high lignin content was chosen as precursor material for the fabrication process. It was reported that lignin has aromatic molecule structure with a high degree of cross linking between the β-O-4 and phenylpropane (Chatterjee et al., 2014). Thus, the higher the lignin content, the more beneficial for graphite production. For understanding the physicochemical properties of as-prepared sample, a series of characterization technologies were carried out. To investigate its adsorption performance, DCF and IBU were used in batch experiment at laboratory conditions. In addition, the K2FeO4-modified peanut shell biochar was applied for the removal of these drugs from Hunan University's pond (untreated water sample) and tap water sample. Ultimately, the possible adsorption mechanism was discussed.
Experimental
Reagents
DCF sodium (C14H10Cl2NNaO2) was supplied by Shanghai Yien Chemical Technique Co., Ltd. IBU (C13H18O2, purity 99%) was purchased from Shanghai Macklin Biochemical Co., Ltd. The chemical structure and physicochemical characteristics of two compounds are displayed in Supplementary Data. K2FeO4, sodium hydroxide (NaOH), and hydrochloric acid (HCl) were provided by Shanghai Macklin Biochemical Co., Ltd. Radical scavengers (methanol [MeOH, CH3OH], acetonitrile [CH3CN]) and formic acid (CH2O2) were purchased from Shanghai Chemical Corp. The ultrapure water used in all experiments was obtained from a Millipore Milli-Q water purification system. All the reagents used were of the analytical grade or higher.
Preparation of modified biochar adsorbents
The raw material of biochar was PB, which was collected from a local market in Changsha, Hunan province, China. The chemical component of peanut shell is given in Supplementary Table S2. The preparation of postpyrolysis-treated biochar can be divided into three stages as follows:
First, PB was cut into small pieces and oven-dried (60°C) after being washed with deionized water. The dried and clean PB was then grounded and passed through a mesh sieve (0.147 mm) before being converted to biochar using a tubular reactor. The PB was transferred into a tubular reactor and heated at 900°C for 2 h with a heating rate of 5°C/min in N2 atmosphere. After the pyrolysis process, the biochar was naturally cooled down and stored for later use.
Second, peanut shell biochar was added into 0.1 M K2FeO4 solution at a ratio of 1% w/v and stirred continuously for 8 h at room temperature. The mixture was then separated from the suspension and oven-dried (100°C).
Eventually, the obtained sample was then used for later carbonization process. The specific carbonization conditions were referred to as the first stage. After carbonizing, the produced modified biochar was collected and washed with ultrapure water, followed by drying at 80°C. The as-prepared sample was denoted as PK01. The preparation process is briefly illustrated in Fig. 1.
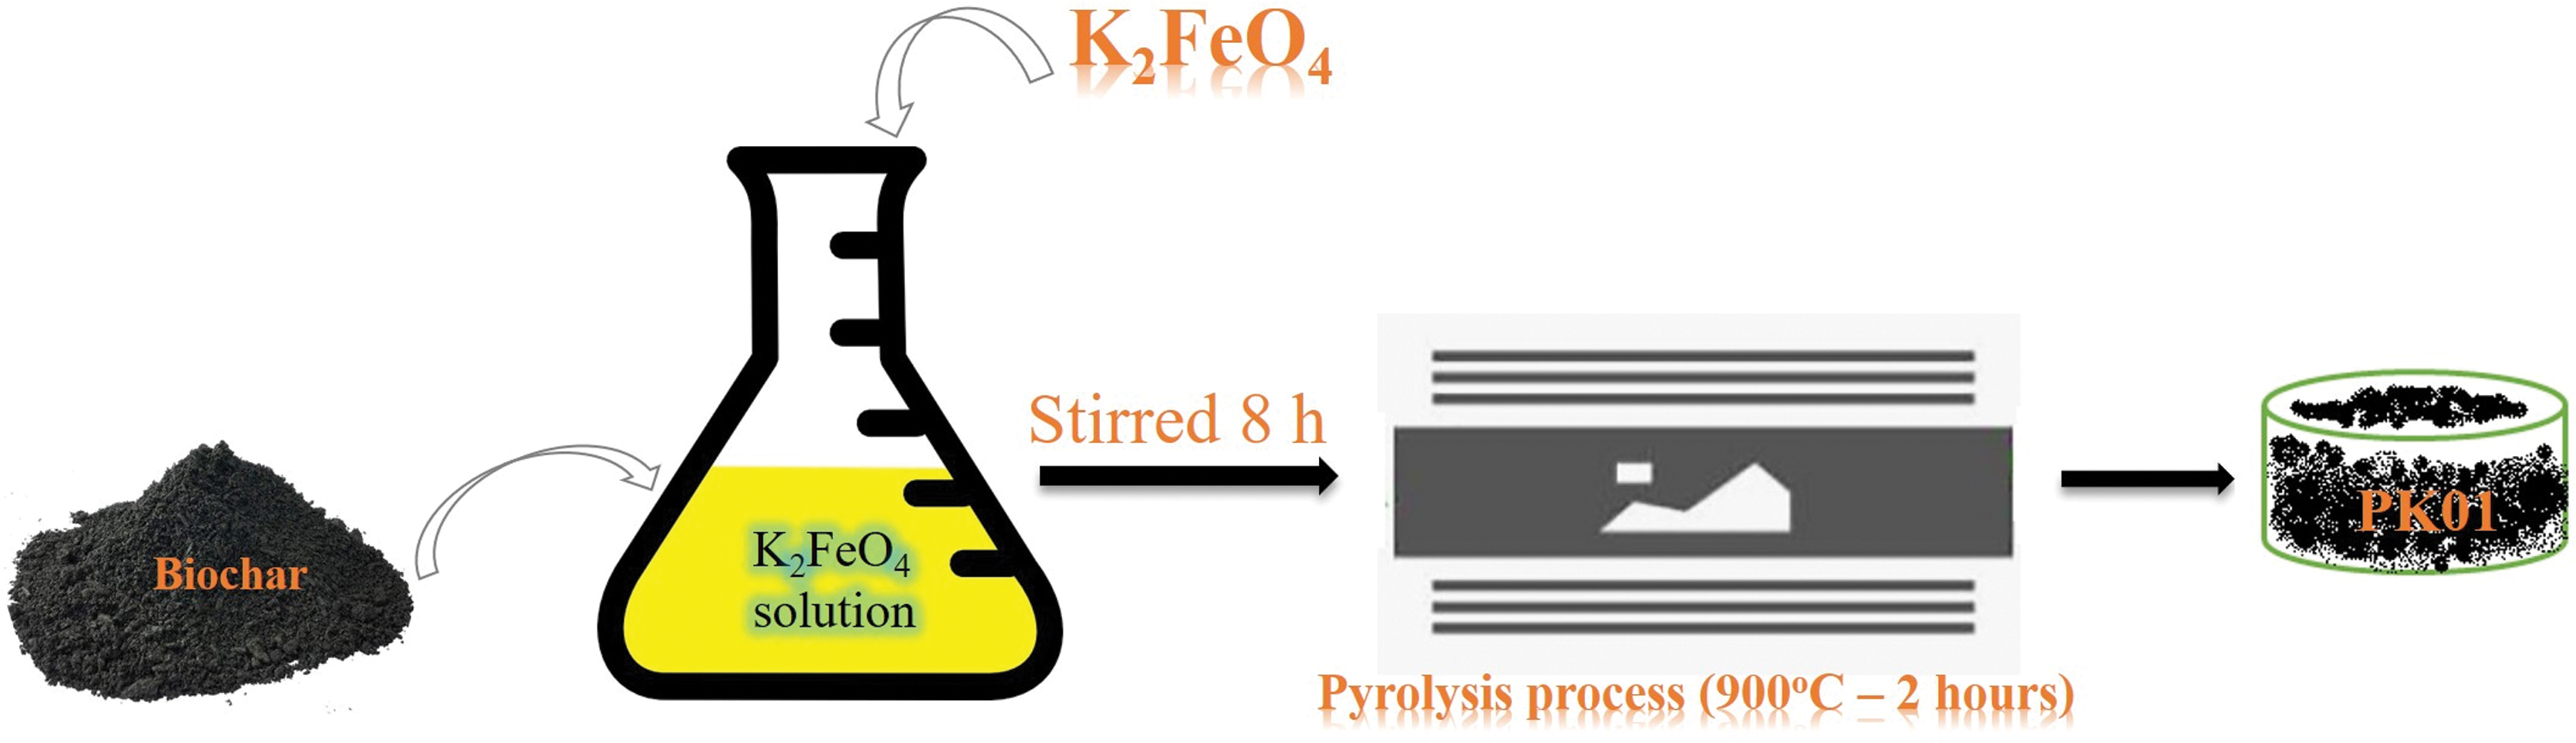
Illustration of the modified biochar preparation process.
For comparison, two other samples were prepared with a small change in the synthesis process. 0.1 M K2FeO4 solution was replaced by 0.2 M K2FeO4 solution in the second stage, and the obtained sample was labeled as PK02. Besides, no-treated sample was prepared by pyrolyzing PB under N2 atmosphere at 900°C; the sample was denoted as RB. All samples were stored in an airtight desiccator for later experiments.
Characterization methods
The morphology of PK01, PK02, and RB was obtained with scanning electron microscopy (SEM; Hitachi, S4800, Japan). The elementary analyses were probed by energy-dispersive X-ray spectroscopy (EDS; Hitachi, S4800, Japan). Transmission electron microscopy (TEM, Tecnai G2 F30; FEI Company) was used to examine the structure of the PK01 and RB sample. The Brunauer-Emmett-Teller (BET) specific surface area and pore structure of the two modified samples were measured using N2 adsorption and desorption measurements (Quadrasorb EVO; Quantachrome Instruments). The surface states of PK01 (before and after adsorption) and PK02 samples were investigated by X-ray photoelectron spectroscopy (XPS; Thermo ESCALAB 250 Xi). The powder X-ray diffraction (XRD) patterns were recorded by Rigaku D/Max 2500 diffractometer using CuKα radiation in a scanning range of 20–80° at a scanning rate of 1°/min. The Raman spectrum was performed with a Raman microscope (LabRam-HR800, HJY, FRA). Magnetic properties were conducted on a vibrating sample magnetometer (VSM, MPMS XL-7; Quantum Design). The zeta potential of the PK01 sample was explored by a zeta potential instrument (Zetasizer, nano ZS90; Malvern, United Kingdom).
Batch adsorption experiments
All adsorption experiments were conducted in Erlenmeyer flasks (volume 50 mL) with 25 mL solution of targeted drugs (DCF and IBU) in triplicates. Then, 5.0 mg of adsorbents were added into solutions containing different drug concentrations and placed in a rotary thermostatic water bath oscillator for the reaction. The rotating speed was 160 rpm. The solutions after adsorption were filtered through a 0.45 μm membrane filter. In each trial, the remaining concentration of adsorbates was analyzed by ultraviolet-visible (UV-Vis) spectrophotometer. The absorption wavelengths of 222 and 276 nm were used to determine IBU and DCF concentrations, respectively. Removal percentages were calculated using Equation (1):
where R is removal efficiency (%), i is the type of drug (i = IBU or DCF), and Co and Ce are the initial and equilibrium concentrations (mg/L), respectively, of the drug being absorbed.
Adsorption kinetic studies were carried out as follows: 5.0 mg of each adsorbent (PK01 and PK02) was added into 25 mL adsorbate solutions with initial concentrations of 20 and 50 mg/L for IBU and DCF, respectively. Contact time was in a range of 0.25–20 h under temperature 298 K, with pH solution at the value of 4.6 and 6.5 corresponding to IBU and DCF, respectively.
For adsorption isotherm studies, a series of 25 mL solutions were prepared in which each solution contained the same amount of PK01 adsorbent (5.0 mg) and different initial concentrations of each NSAID (varying in the range of 10–25 and 20–60 mg/L corresponding to IBU and DCF initial concentration, respectively) at different temperature (298, 308, and 318 K). The mixtures were shaken for the appropriate time, filtered, and analyzed for residual drug concentrations.
The effect of pH on drug adsorption was investigated using a negligible volume of acid (0.1 M HCl) or alkali (0.1 M NaOH) to adjust solution pH from 3.0 to 9.0 at 298 K.
The quantities of adsorbed drugs or adsorption capacity of adsorbents were calculated by the following equation:
where Co and Ce (mg/L) are the liquid-phase concentrations of adsorbates at initial and equilibrium stage, respectively. V (L) and W (g) are the volume of the solution and the weight (g) of the adsorbents, respectively.
Application for the real water samples
The real water samples were collected from two locations, including the pond on the campus of Hunan University and tap water from Changsha city. The characteristics of the water samples are given in Supplementary Table S3. These samples were spiked with the contaminants and then treated with the modified biochar adsorbent (PK01). Adsorption experiments were performed in two systems, including single-solute system (single drug IBU or DCF adsorption) and binary-solute system (simultaneous IBU and DCF adsorption). Reverse phase chromatographic analyses were performed using a high-performance liquid chromatography (HPLC; Agilent 1200 series), and the conditions were adapted from the literature (Ali, 2012) using a ZORBAX Eclipse XDB-C18 column (4.6 × 150 mm i.d., 5 μm) and UV detection. The mobile phase for stepwise gradient elution was a mixture of 0.1% formic acid in water (H2O) and 0.1% formic acid in acetonitrile (ACN), which was set with a flow rate of 1.0 mL/min. The H2O/ACN volume ratio was 50:50 at the beginning of the chromatographic run and shifted to 15:85 over 7 min, then stayed constant for the remaining 3 min before the chromatographic process finished. The HPLC detection wavelength was 227 nm for both IBU and DCF.
Results and Discussion
Characterization of adsorbents
The morphology of pristine biochar and modified biochar was characterized by SEM images, as shown in Fig. 2a, d, and g. It was clearly seen that PK01 and PK02 both had extremely rough and heterogeneous surfaces with numerous tufts of different sizes, while the RB exhibited a less rough surface with several wrinkles. Figure 2b, e, and h shows the SEM images of two samples under 5 μm magnification for further observation. The modified samples possessed an uneven surface morphology with some solid particles attached on their surfaces, which were presumably iron particles. The corresponding EDS of three samples is also exhibited in Fig. 2c, f, and i. The EDS results indicated that the main compositions included carbon, nitrogen, oxygen, potassium, and iron, which confirmed that the PKs were successfully activated by K2FeO4. However, the ratios of K and Fe element on PK02 were higher than those of PK01 sample, which resulted from using different concentrations of activated agent.
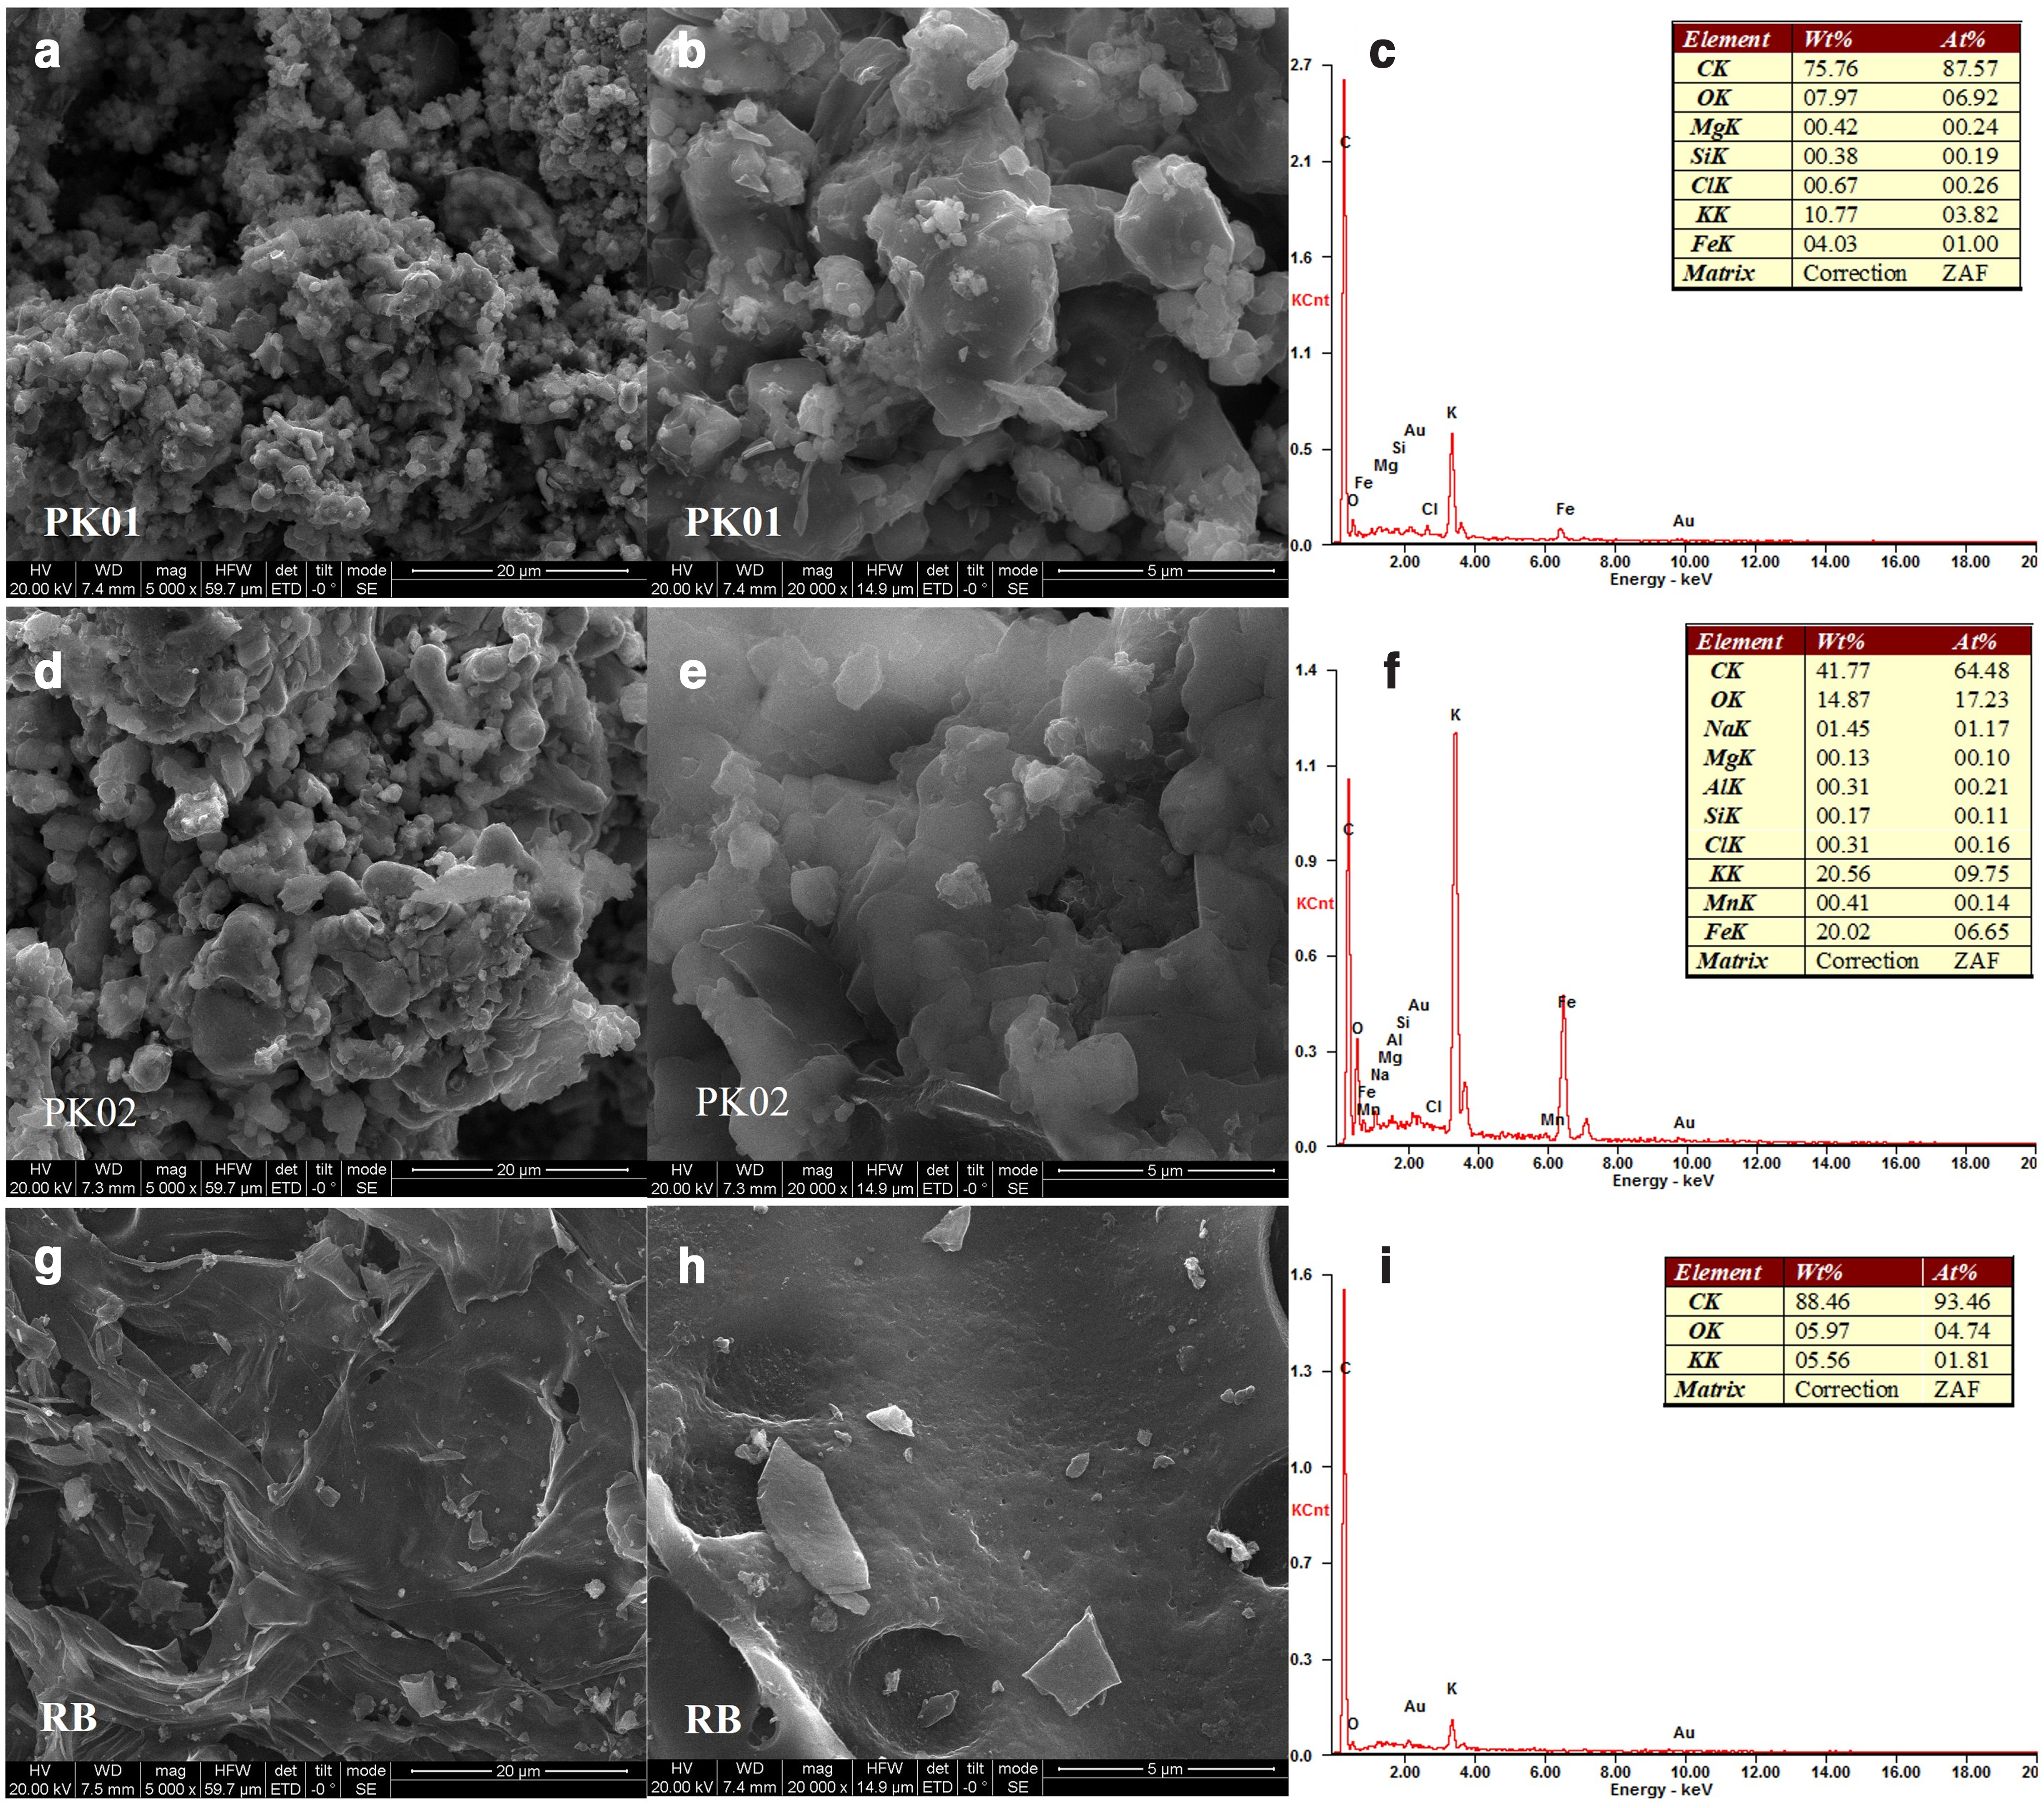
Scanning electron microscopy images of
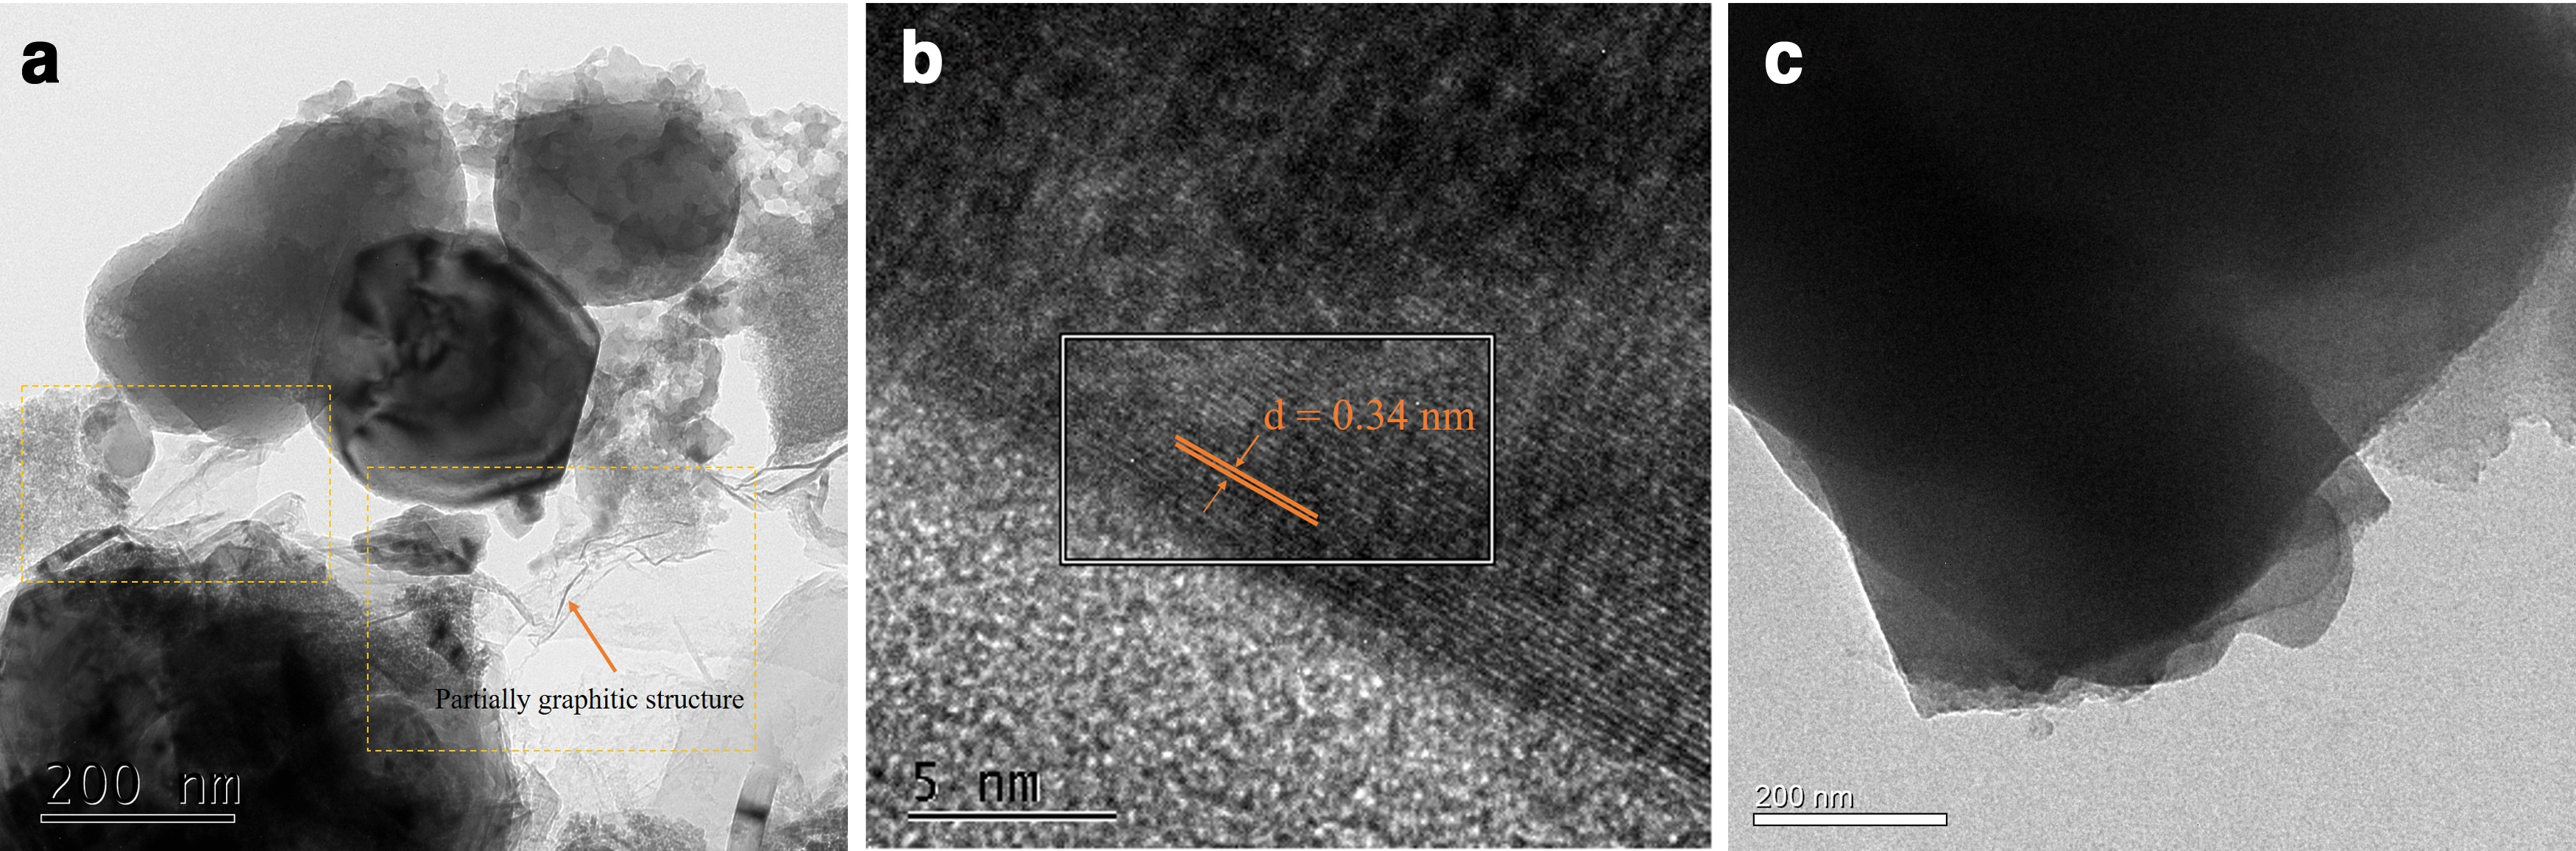
Following the aims of this article, the structure of PK01 and RB samples was examined through TEM characterization. TEM and HR-TEM images of PK01 are presented in Fig. 3a and b, and TEM image of RB is displayed in Fig. 3c. From Fig. 3a, it could be seen that PK01 was not entirely amorphous carbon structure. Instead, the presence of some semitransparent substances with sheet-like wrinkled fringes (dashed frames) suggested that the sample was changed into a partially graphitic structure. The lattice fringes and the number of layers could be observed in Fig. 3b. The distance between two lattice fringes was found to be ∼0.34 nm, corresponding to the graphite (002) plane (Gong et al., 2017). From Fig. 3c, it could be seen that the structure of RB sample is amorphous carbon. The TEM and HR-TEM results initially confirmed that the structure of pristine biochar has changed to partially graphitic with the strong oxidizing property of K2FeO4 that enhanced the development of the graphitic structure. Besides, the graphitization degree of materials was examined by XRD and Raman test (Fig. 4).

It could be seen from Fig. 4a that the XRD pattern of PK01 presented stronger and sharper peaks than the XRD of PK02 indicating its good crystallinity in structure. The result analyses are focused on the PK01 sample. Several characteristic peaks were detected at 30.15°, 35.5°, 57.0°, and 62.6° (2θ degree), which could be indexed to (220), (311), (422), and (440) of Fe3O4 (JCPDS 19-0629) (Hu et al., 2016; Li et al., 2018). Besides, two diffraction peaks were observed at 2θ value of 26.6° and 44.7°, which were attributed to typical (002) and (001) reflections of graphite carbon, respectively (JCPDS 41-1487) (Gong et al., 2017; Liu et al., 2020). Some peaks of Fe and two peaks of graphite carbon could also be seen in the XRD spectra of PK02 with very low intensity and did not appear in the XRD of the RB sample. The XRD results suggested that iron oxide and graphite carbon were the primary compositions of the PK01 composite. The Raman spectra of the samples are presented in Fig. 4b. There were three dominant peaks at 1,350 cm−1 (D band), 1,588 cm−1 (G band), and 2,710 cm−1 (2D band), which were referred to the defect sites and disordered carbon structure, graphitic structure/whiskers like carbon, and stacking order of graphene layers, respectively (Ferrari et al., 2006). It could be seen that the most intense feature was the peak at G band, followed by the peak at 2D band, and finally was the peak at D band. In addition, the ratio of intensity ID/IG is a measure of the defects present on carbon nanomaterial structures, which relates to sp3/sp2 carbon atom ratio. The ID/IG value of PK01 was lower (0.71) compared with that of RB (1.05). The higher ID/IG ratio of RB compared to that of PK01 indicated the defective nature of RB due to its porous structure (Palaniselvam et al., 2012). Generally, these evidences showed that PK01 possessed a partially graphitic structure, and this structure conversion was attributed to the presence of Fe species, which played an important role in the transformation from amorphous carbon to partially graphitic carbon (Sevilla and Fuertes, 2006).
The N2 sorption isotherms and the porosity distribution of two modified samples and no-treated sample are shown in Fig. 4c and d and Supplementary Fig. S1, respectively. According to the International Union of Pure and Applied Chemistry (IUPAC) classification, the sorption isotherm of PK01 and PK02 is classified as type IV with a H2(b)-type hysteresis loop in the relative pressure region of 0.5–0.9 p/po, which can be attributed to the presence of mesopores along with the pore blocking in a narrow range of pore necks (Thommes et al., 2015). Moreover, there was a steep increase of N2 adsorbed at a low relative pressure suggesting the formation of micropores on the adsorbent surfaces. The inset graphs of Fig. 4c and d also confirmed that the porous structure of two samples was composed of micro and mesopore (pore diameter in a range of 1.43 nm and 136.6 nm). In general, the shape of N2 sorption isotherm curves, as well as the pore distribution and pore diameter of two samples, was relatively similar. However, their BET surface areas and pore volumes were totally different, which could affect the quantity adsorbed of the adsorbate. The BET surface area of PK01 was found to be 374.0 m2/g with corresponding pore volume of 0.227 cm3/g, while those index values of PK02 and RB were 99.3 m2/g, 0.063 cm3/g, 222.7 m2/g, and 0.013 cm3/g, respectively. For this result, the reason may be because of the differences in concentrations of activated agent leading to the differences in the structures of the material after modification. Biochar is considered as a surfactant material, so its efficiency is greatly affected by the surface structure. As mentioned above, the iron atom of K2FeO4 had a significant effect on the formation of graphitic structure in carbonaceous materials, but in some cases, it could block the pores on the material surface. The BET surface area and pore volume therefore decreased leading to the reduction of the adsorption capacity of the material. This assumption may be further clarified through adsorption experiments in the next part, by that, whether PK01 or PK02 is the more superior adsorbent will be explored.
The magnetization hysteresis curves of PK01 and PK02 were obtained using VSM at room temperature, and the results are displayed in Fig. 4f. Specific pertinent data showed ferromagnetic properties with saturation magnetization values of 57.058 and 56.541 emu/g for PK01 and PK02, respectively, which indicated that the magnetization of materials was enough to recognize the solid/liquid system using a permanent magnet. This property makes the as-prepared composites easier to separate from the treatment solution and convenient for recovery and reuse of materials.
To get an insight into the surface properties, the surface elemental composition of modified samples was further characterized using XPS analysis. Figure 4e shows the XPS survey spectra of two samples. Based on the results, PK01 and PK02 contained carbon, oxygen, potassium, and iron elements. The XPS peak deconvolution for C 1s, K 2p, O 1s, and Fe 2p of the samples is displayed in Fig. 5. Specifically, the peaks of 284.8 and 289.4 eV were both seen on the C 1s spectra of two samples with different proportions (Table 1), which can be ascribed to sp2 C-C and COOH bonds, respectively (Yin et al., 2018). The peak of 286.1 eV was only seen on PK01, which was contributed to C-O bonds. Two strong peaks appeared at higher binding energy (293.2 and 295.9 eV) in the XPS spectra of two samples, which can be assigned to K 2p3/2 and K 2p1/2 (Wu et al., 2016). For O 1s spectra, it could be seen that three peaks were detected on the PK01 sample, including 530.9, 531.6, and 532.7 eV, which can be assigned to Fe-O, O = C, and O-C bonds, respectively. Similarly, the O 1s spectra of PK 02 contained three peaks at 531.7, 532.9, and 530.9 eV, which were attributed to O = C, O-C, and Fe-O bonds, respectively (Rojas et al., 2016; Lai et al., 2018).
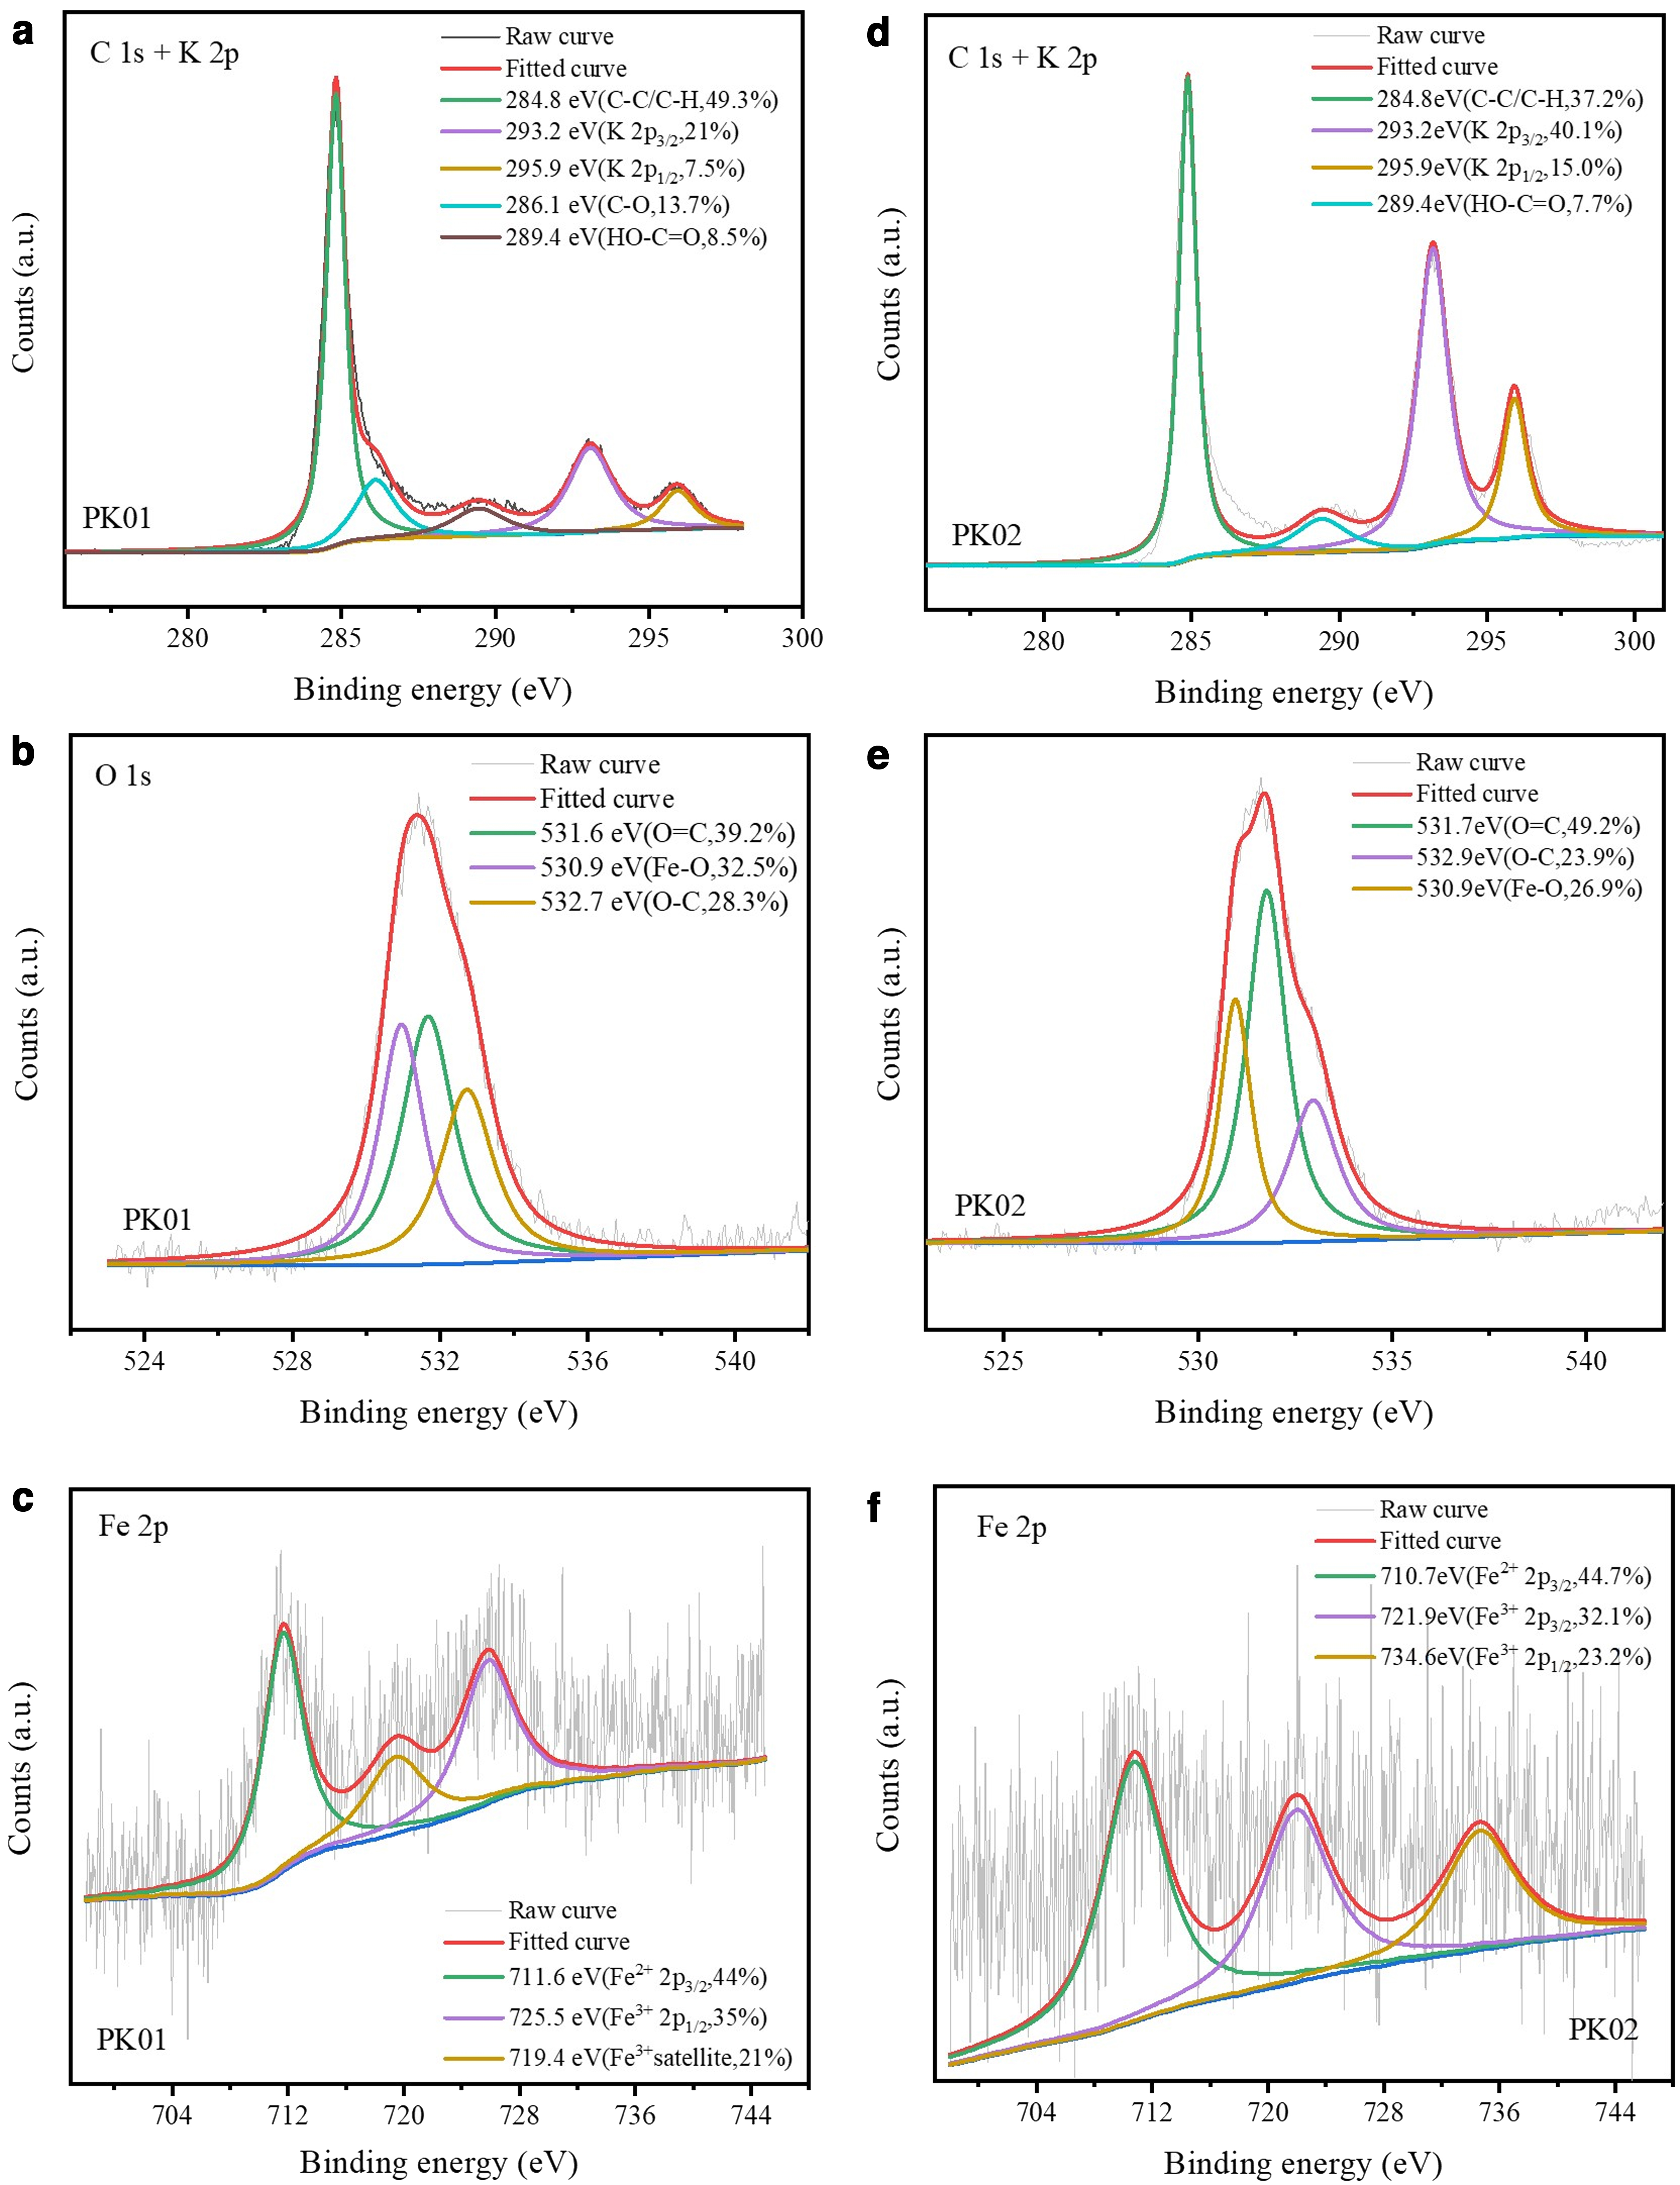
H-R XPS spectra of
The Peak Area Ratio of Functional Groups on the C 1s Spectra of Two Modified Samples
As could be seen in Fig. 5a–d, the surface area contained oxygen functional groups of PK01 that was higher compared with PK02, and this was reflected by comparing the C 1s peak deconvolution between two samples. The amount of C-C and -COOH components of PK01 was higher compared with PK02, which confirmed that PK01 had a more superior structure than PK02. The increase of oxygen-containing functional groups on the adsorbent surface may increase its adsorption capacity toward organic contaminants.
Figure 5e and f displays the deconvoluted XPS spectra of different Fe species on the surface of modified biochar samples. The PK01 sample exhibited two peaks at 711.6 eV, 725.5 eV in the Fe 2p spectrum, corresponding to the Fe3+ 2p3/2, Fe3+ 2p1/2 and a satellite peak at 719.4 eV (Wonoputri et al., 2016; Wang et al., 2017). The Fe 2p spectrum of PK02 also can be deconvolved into three components. Two peaks at 710.7 and 721.9 eV could be attributed to Fe2+ 2p3/2 and Fe3+ 2p3/2, respectively, whereas the peak at 734.6 eV could be assigned to Fe3+ 2p1/2 (Geng et al., 2018). The XPS Fe 2p spectrum of PK01 and PK02 confirmed the divalent and trivalent states of Fe ions in two samples (Karamat et al., 2014).
According to the characterization results, it could be concluded that PK01 sample was successfully synthesized. The nanomaterial was used for the removal of two NSAIDs (IBU and DCF sodium) in the aqueous phase. The FT-IR characterization before/after adsorption, as well as the influence of contact time, temperature, solution pH on adsorption processes will be conducted to find out the reaction mechanism in the solid–liquid systems.
Relative adsorption capacities of the adsorbents and kinetic studies
To investigate the adsorptive performance of PK01 and PK02, adsorption of IBU (20 mg/L) and DCF (50 mg/L) was performed at room temperature, and the results are displayed in Fig. 7. As could be observed from Fig. 7, the adsorption of NSAIDs on PK01 was remarkable compared with PK02. The qe value of PK01 for DCF was significantly higher than that for IBU (Fig. 7a), and the same result was reported in some previous studies (Baccar et al., 2012; Ghemit et al., 2019; Phasuphan et al., 2019).
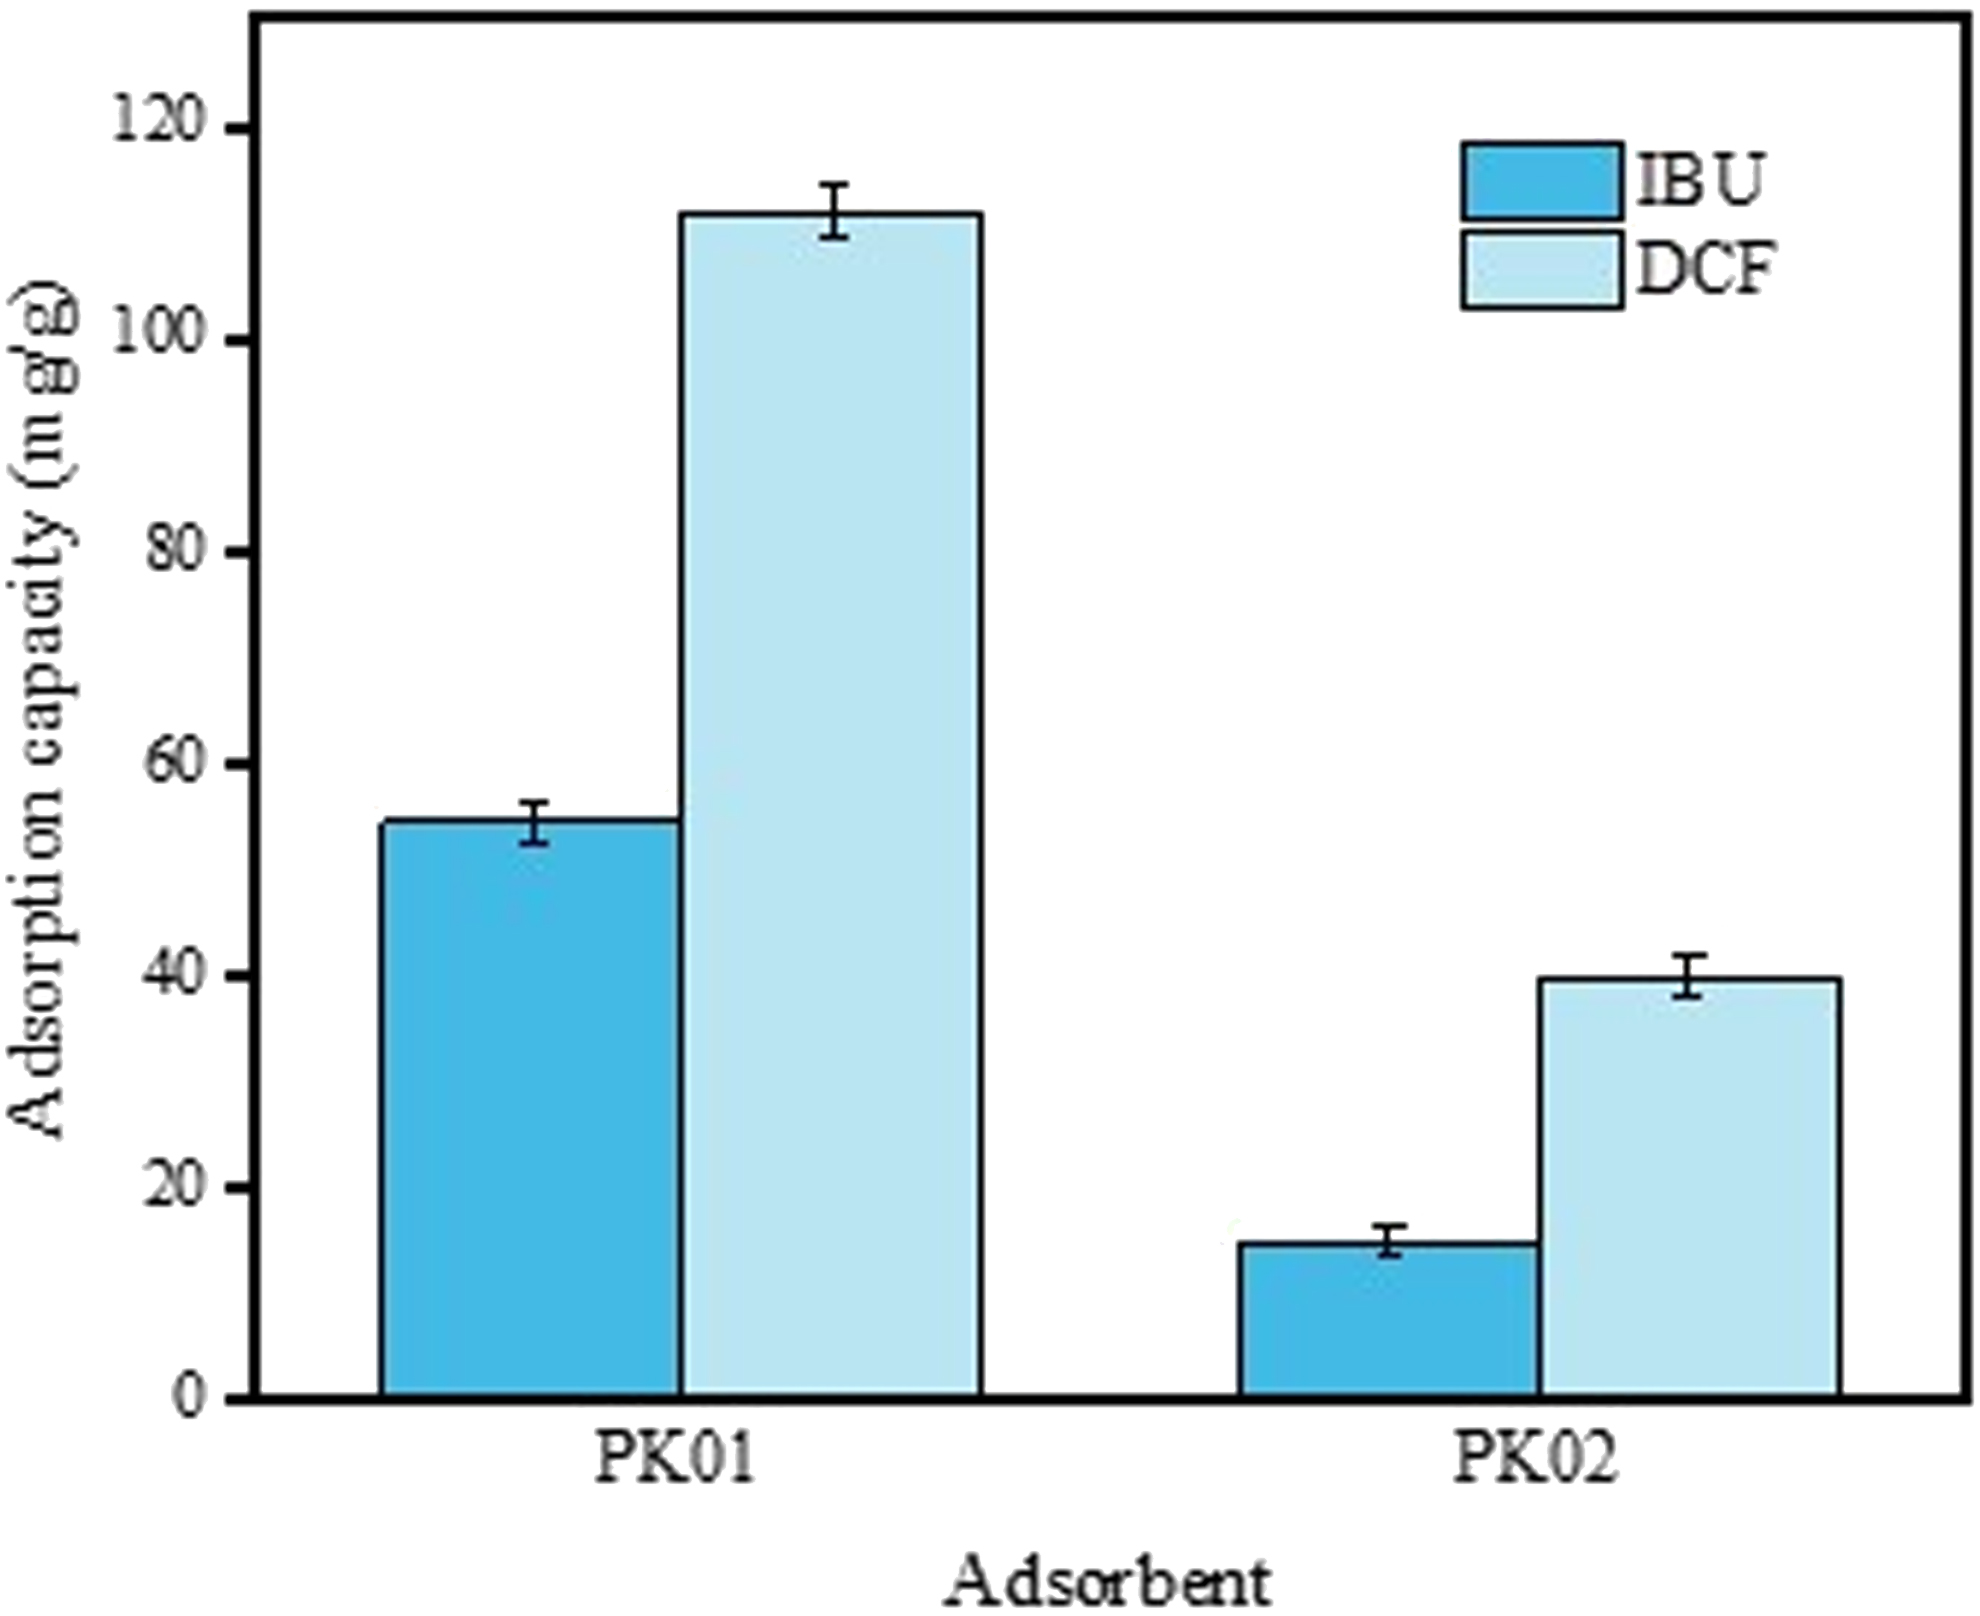
Adsorption capacity of PK01 and PK02 toward IBU and DCF, respectively.
To understand the efficiency of an adsorbent, it is essential to elucidate the effect of contact time on adsorption. The quantities adsorbed of IBU and DCF were evaluated over PK01 and PK02 in the time range of 0–20 and 0–12 h, respectively. Two conventional kinetic models namely Pseudo-first-order and Pseudo-second-order were applied to simulate the experimental data. The model equations are given in Supplementary Data.
The experimental results and model parameters are presented in Fig. 8 and Table 2, respectively. The high correlation coefficients (R2) confirmed that the experimental results can be well fitted with the pseudo-second-order model. Thus, it can be assumed that the rate-limiting step may be chemical sorption or chemisorption involving valence forces through the sharing or exchange of electron between adsorbent and adsorbate (Ho and McKay, 1999). The adsorption kinetics for IBU and DCF also showed that PK01 had a higher adsorption performance than PK02 (Fig. 8 and Table 2). Therefore, further adsorption experiments were carried out with PK01 as a superior adsorbent for the removal of IBU and DCF from aqueous solution.
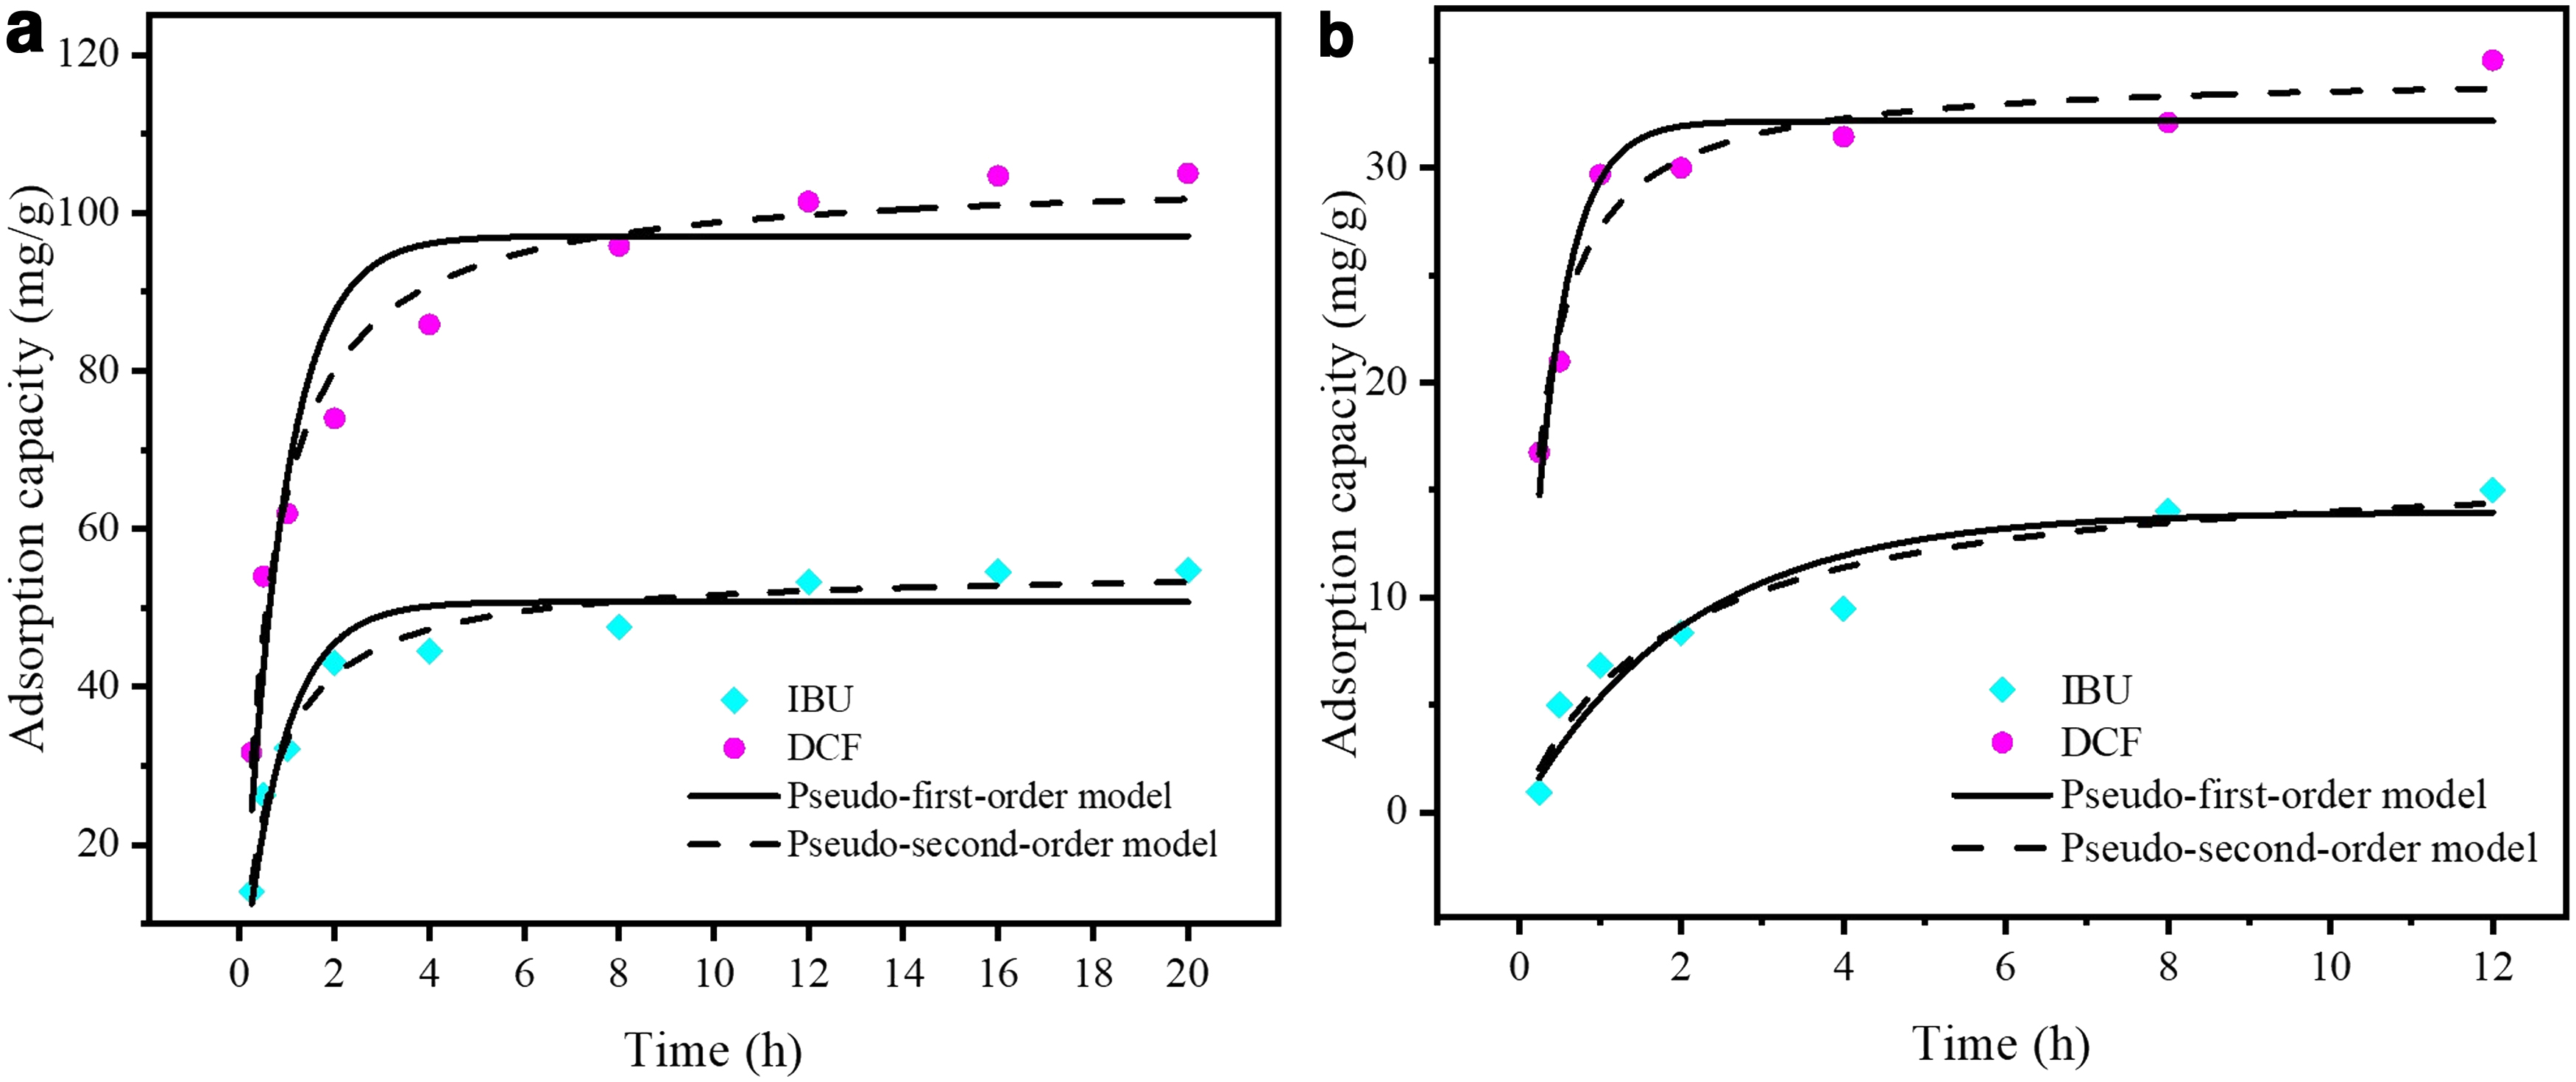
Kinetics of IBU and DCF adsorption onto
Kinetic Parameters for Adsorption of Ibuprofen and Diclofenac Uptake on to Two Samples
Experimental conditions: m/V = 0.2 mg/mL, CDCF = 50 mg/L, CIBU = 20 mg/L, T = 298 K, agitation speed = 160 rpm.
DCF, diclofenac; IBU, ibuprofen.
Isotherm studies
To investigate the interaction mechanism between adsorbent and adsorbates, isotherm studies were carried out at a constant temperature and a specific concentration range of adsorbates (IBU: 10–25 mg/L; DCF: 20–60 mg/L). The experimental curves shown in Fig. 9 indicated that the adsorbed amount of IBU and DCF increased when the initial concentrations rose until the equilibrium state was reached. The experimental data were analyzed by nonlinear curve fit, using Origin Pro 2018 software. Langmuir, Freundlich, and Sips isotherm models were applied to simulate the experimental data. The model equations are given in Supplementary Data.
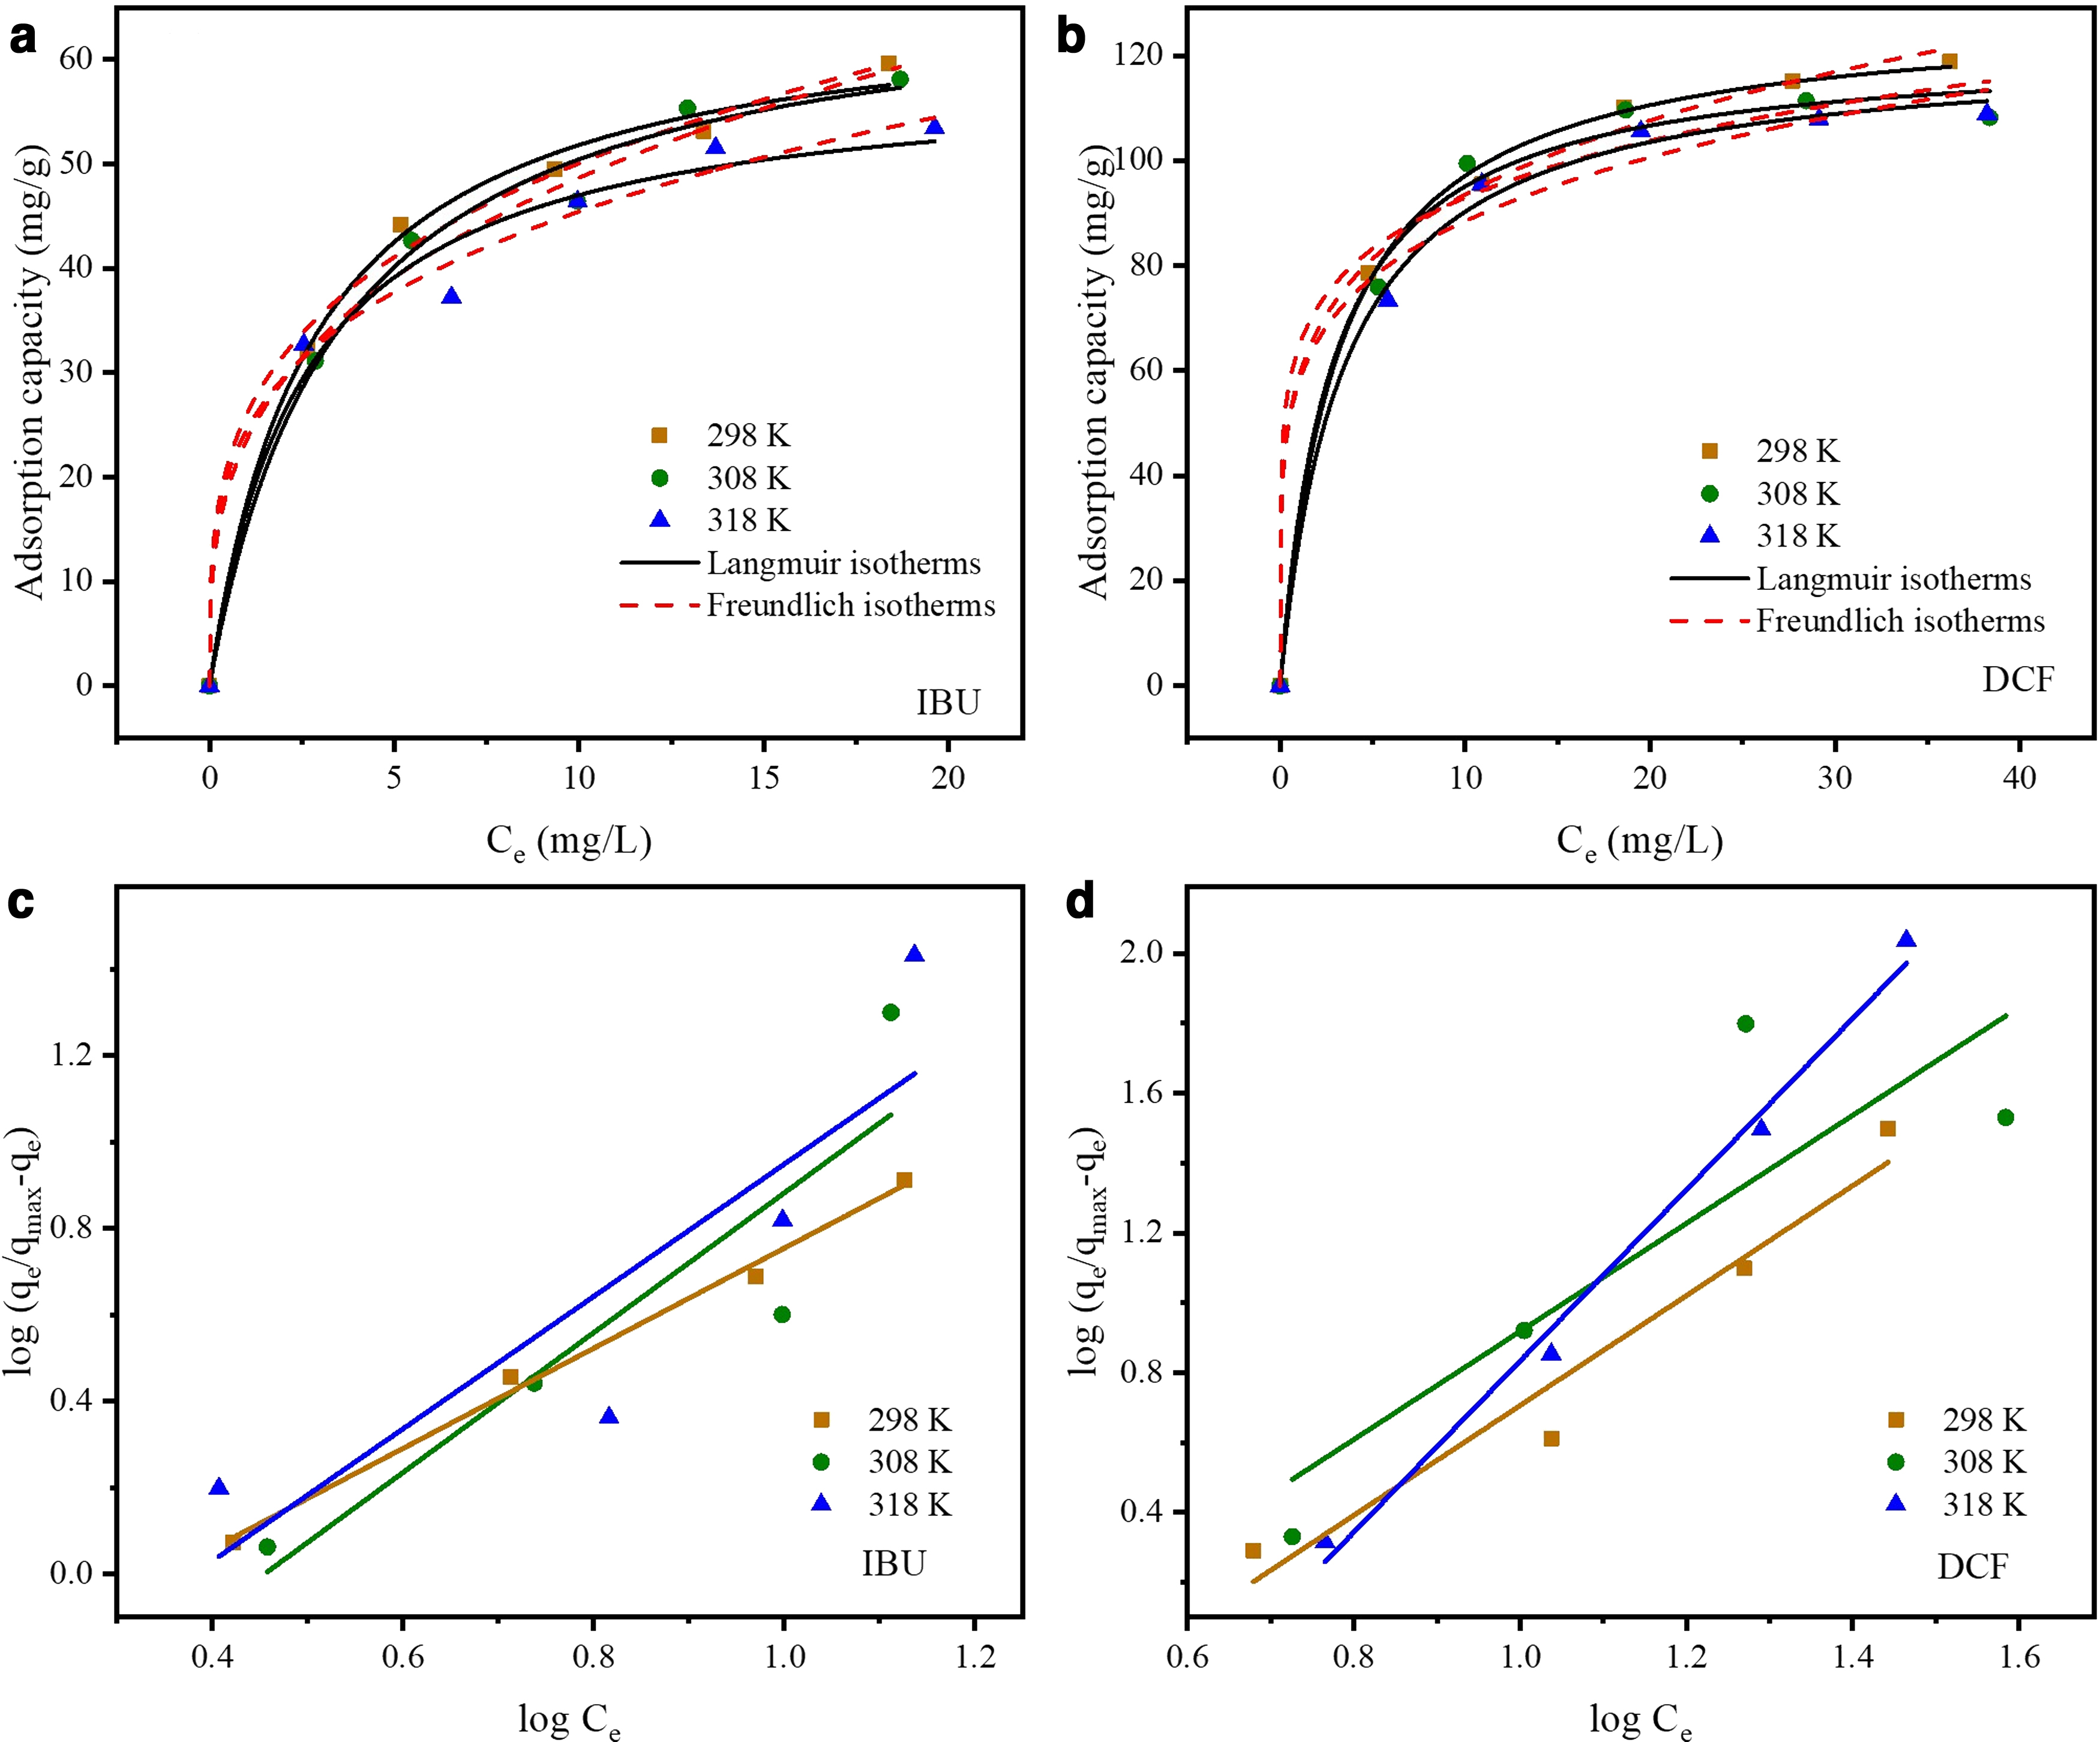
Langmuir and Freundlich isotherm curves of
The estimated constants R2 values and isotherm model parameters are given in Table 3. The value of the constant n was calculated to be less than 1 for two drugs, indicating favorable adsorption (Freundlich, 1906). Both Freundlich and Langmuir model fitted the experimental data well (R2≈0.98–0.99 at three temperatures 298, 308, and 318 K), while the Sips isotherm model did not fit in with the experimental data and thus was not considered. As could be seen in Table 3, the maximum adsorption capacities were 66.3 and 128.3 mg/g for IBU and DCF, respectively. This is a considerable value in terms of ECs' adsorption capacity.
Isotherm Parameters for Adsorption of Ibuprofen and Diclofenac Uptake onto PK01
Experimental conditions: m/V = 0.2 mg/mL, CDCF ranged 20–60 mg/L, CIBU ranged 10–25 mg/L, t = 20 h, agitation speed = 160 rpm, T = 298, 308, and 318 K.
Effect of solution pH
The solution pH plays an important role in the adsorption process of organic contaminants by biochar-derived adsorbents because it may simultaneously affect the surface charge of the adsorbent, the ionization degree of the adsorbate, and the adsorption mechanism. The effect of solution pH on the removal of two NSAIDs was investigated over the pH range of 3.0–9.0. The initial concentrations of IBU and DCF were constant at 20 and 50 mg/L, respectively. As seen in Fig. 10a, the adsorption capacities for both IBU and DCF were highest at the pH value of 3.0 indicating that the adsorption process was favorable under strongly acidic conditions. After that, the DCF adsorbed quantity decreased with the increase of solution pH, while that of IBU insignificantly changed at the pH range of 4.0 to 9.0. Thus, the uptake of DCF was considerably affected by the pH value. Zeta potential values were measured as a function of solution pH against biochar-derived adsorbents. To further understand the adsorbent characteristics, zeta potential characterization was carried out and the results are displayed in Fig. 10b. Through zeta potential results, the pHzpc value of PK01 was found to be 3.6, which matched the results of pH experiment. When solution pH was lower than 3.6, the PK01 carried positive charges on its surface due to the protonation reaction. In contrast, at pH >3.6, the surface charge of PK01 is negative because of the adsorption of OH ions through hydrogen bonds at high pH (Zhou et al., 2017b). Ionic microcontaminants can interact with adsorbents through electrostatic attraction or repulsion, and this interaction can be determined by the pKa value of the compounds (Huerta-Fontela et al., 2011).
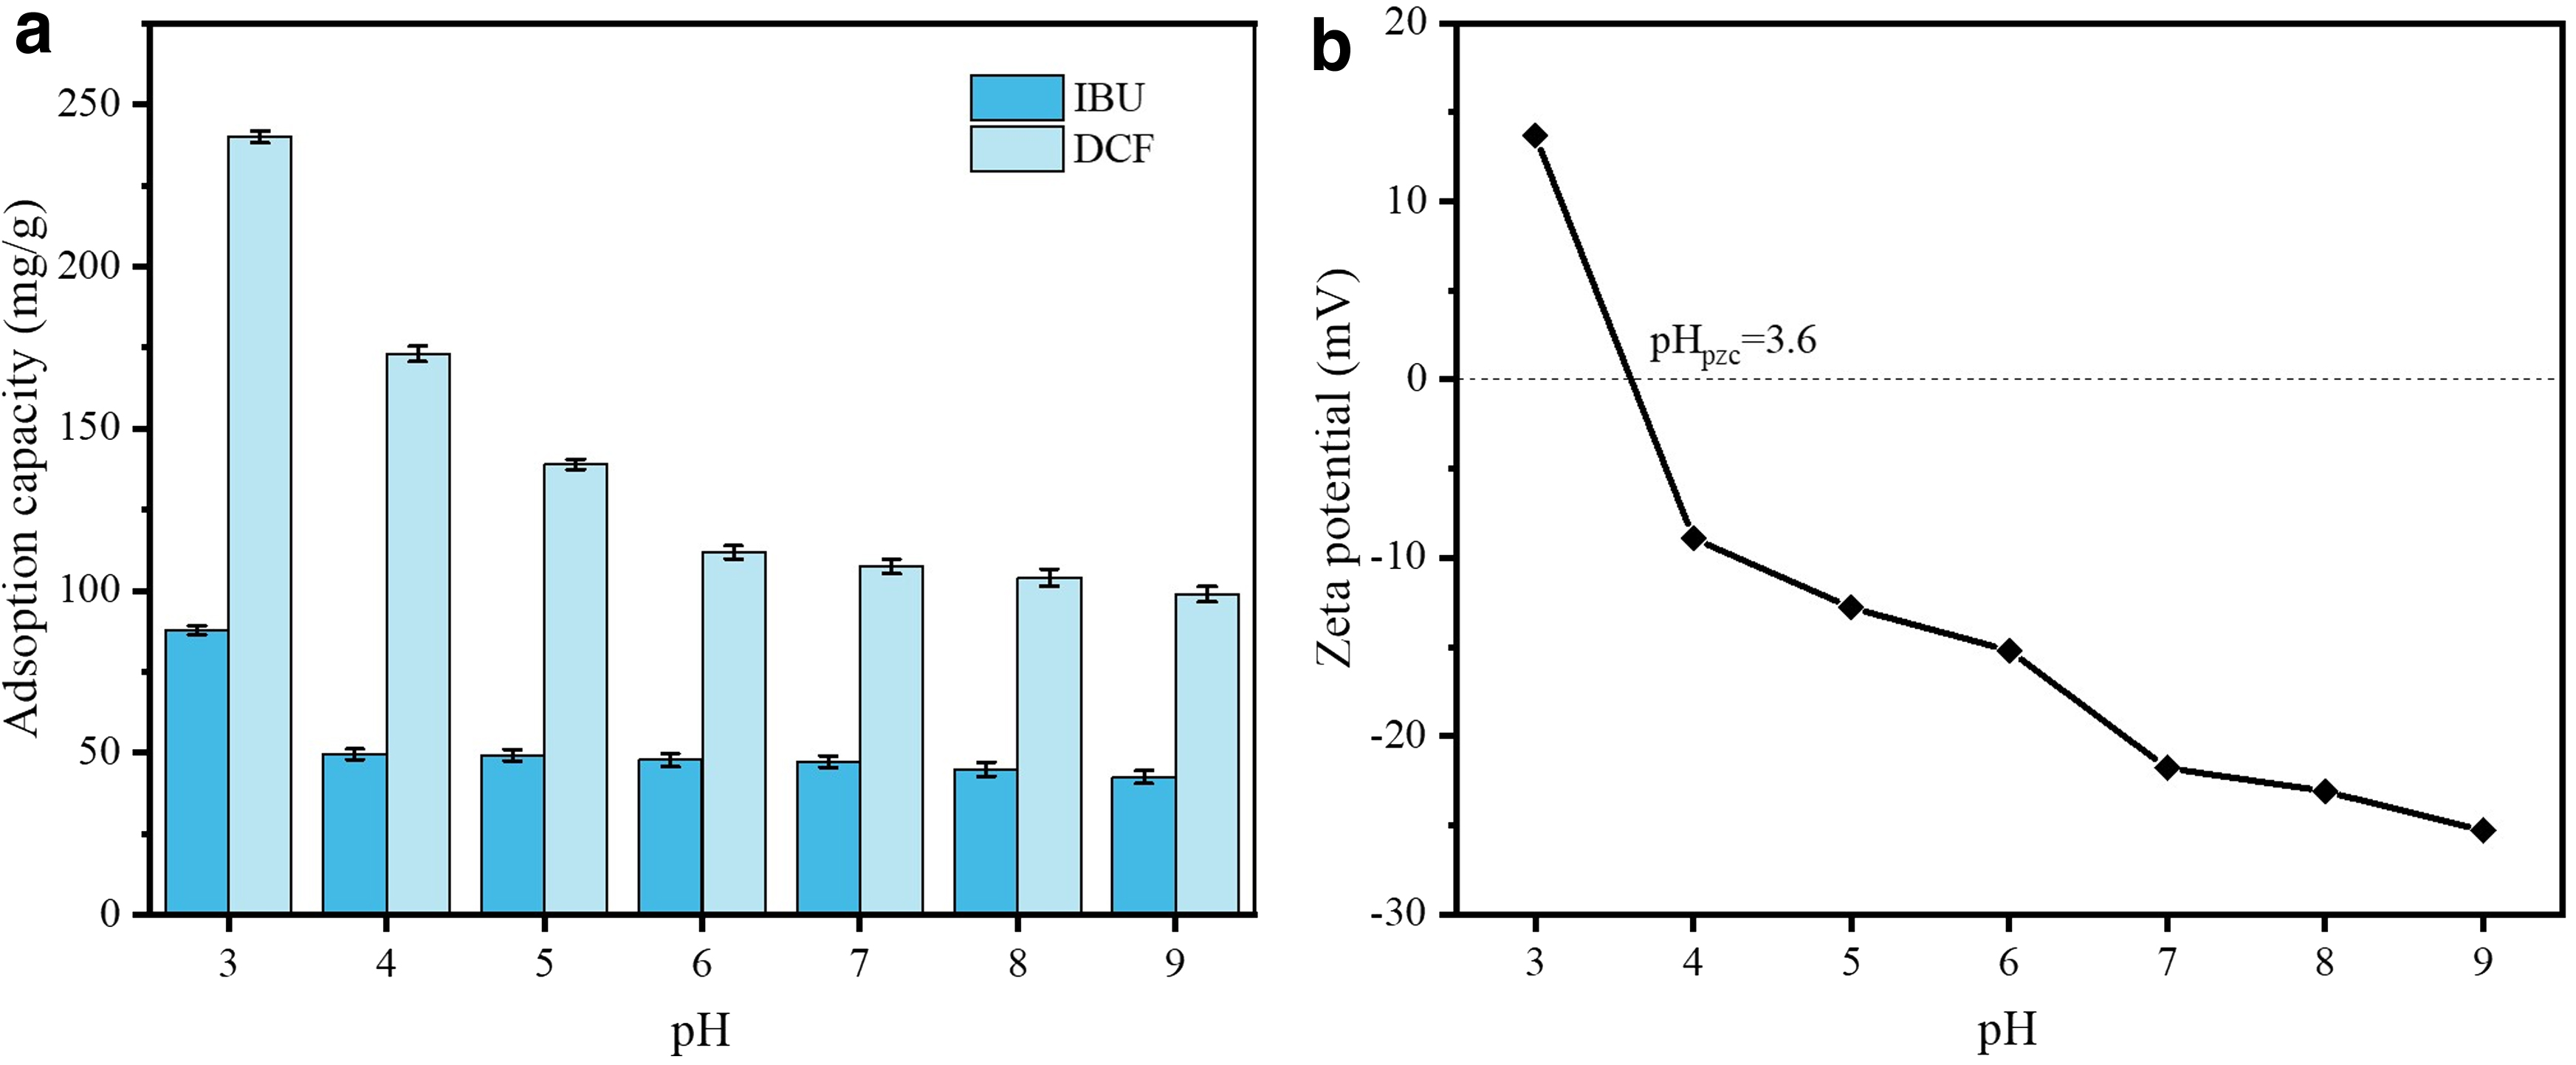
The pKa of IBU is 4.91 (Supplementary Table S1); thus, its adsorption capacity should be very low at pH >4.91 in terms of electrostatic repulsion between the negative surface of PK01 and the anion IBU. As shown in Fig. 10a, the IBU adsorbed amount was still significant at higher pH conditions (qe = 42.5 mg/g at pH 9.0) suggesting that electrostatic interaction was not the sole adsorption mechanism. Furthermore, maximum adsorption capacity was determined at the point near pHpzc suggesting the possibility of other mechanisms involved in the adsorption process. This can be attributed to hydrogen bonds with oxygen-containing groups (i.e., OH−) on the surface of the adsorbent.
DCF sodium has a pKa value of 4.15 (Supplementary Table S1), and similar to the assumption between IBU and the adsorbent, the uptake of DCF should be very low when pH >4.15. In fact, the obtained qe at pH 9.0 was relatively high (98.8 mg/g), corresponding to 42.22% of the highest value of qe at pH 3.0 (234.0 mg/g). Thus, it could be assumed that physical processes (i.e., electrostatic interactions) might not be the major mechanism involved in the adsorption of DCF onto PK01. Instead, the adsorption process can be explained based on electrostatic interactions, H-bonding, hydrophobic effects, and π-π EDA interactions.
Adsorption mechanism
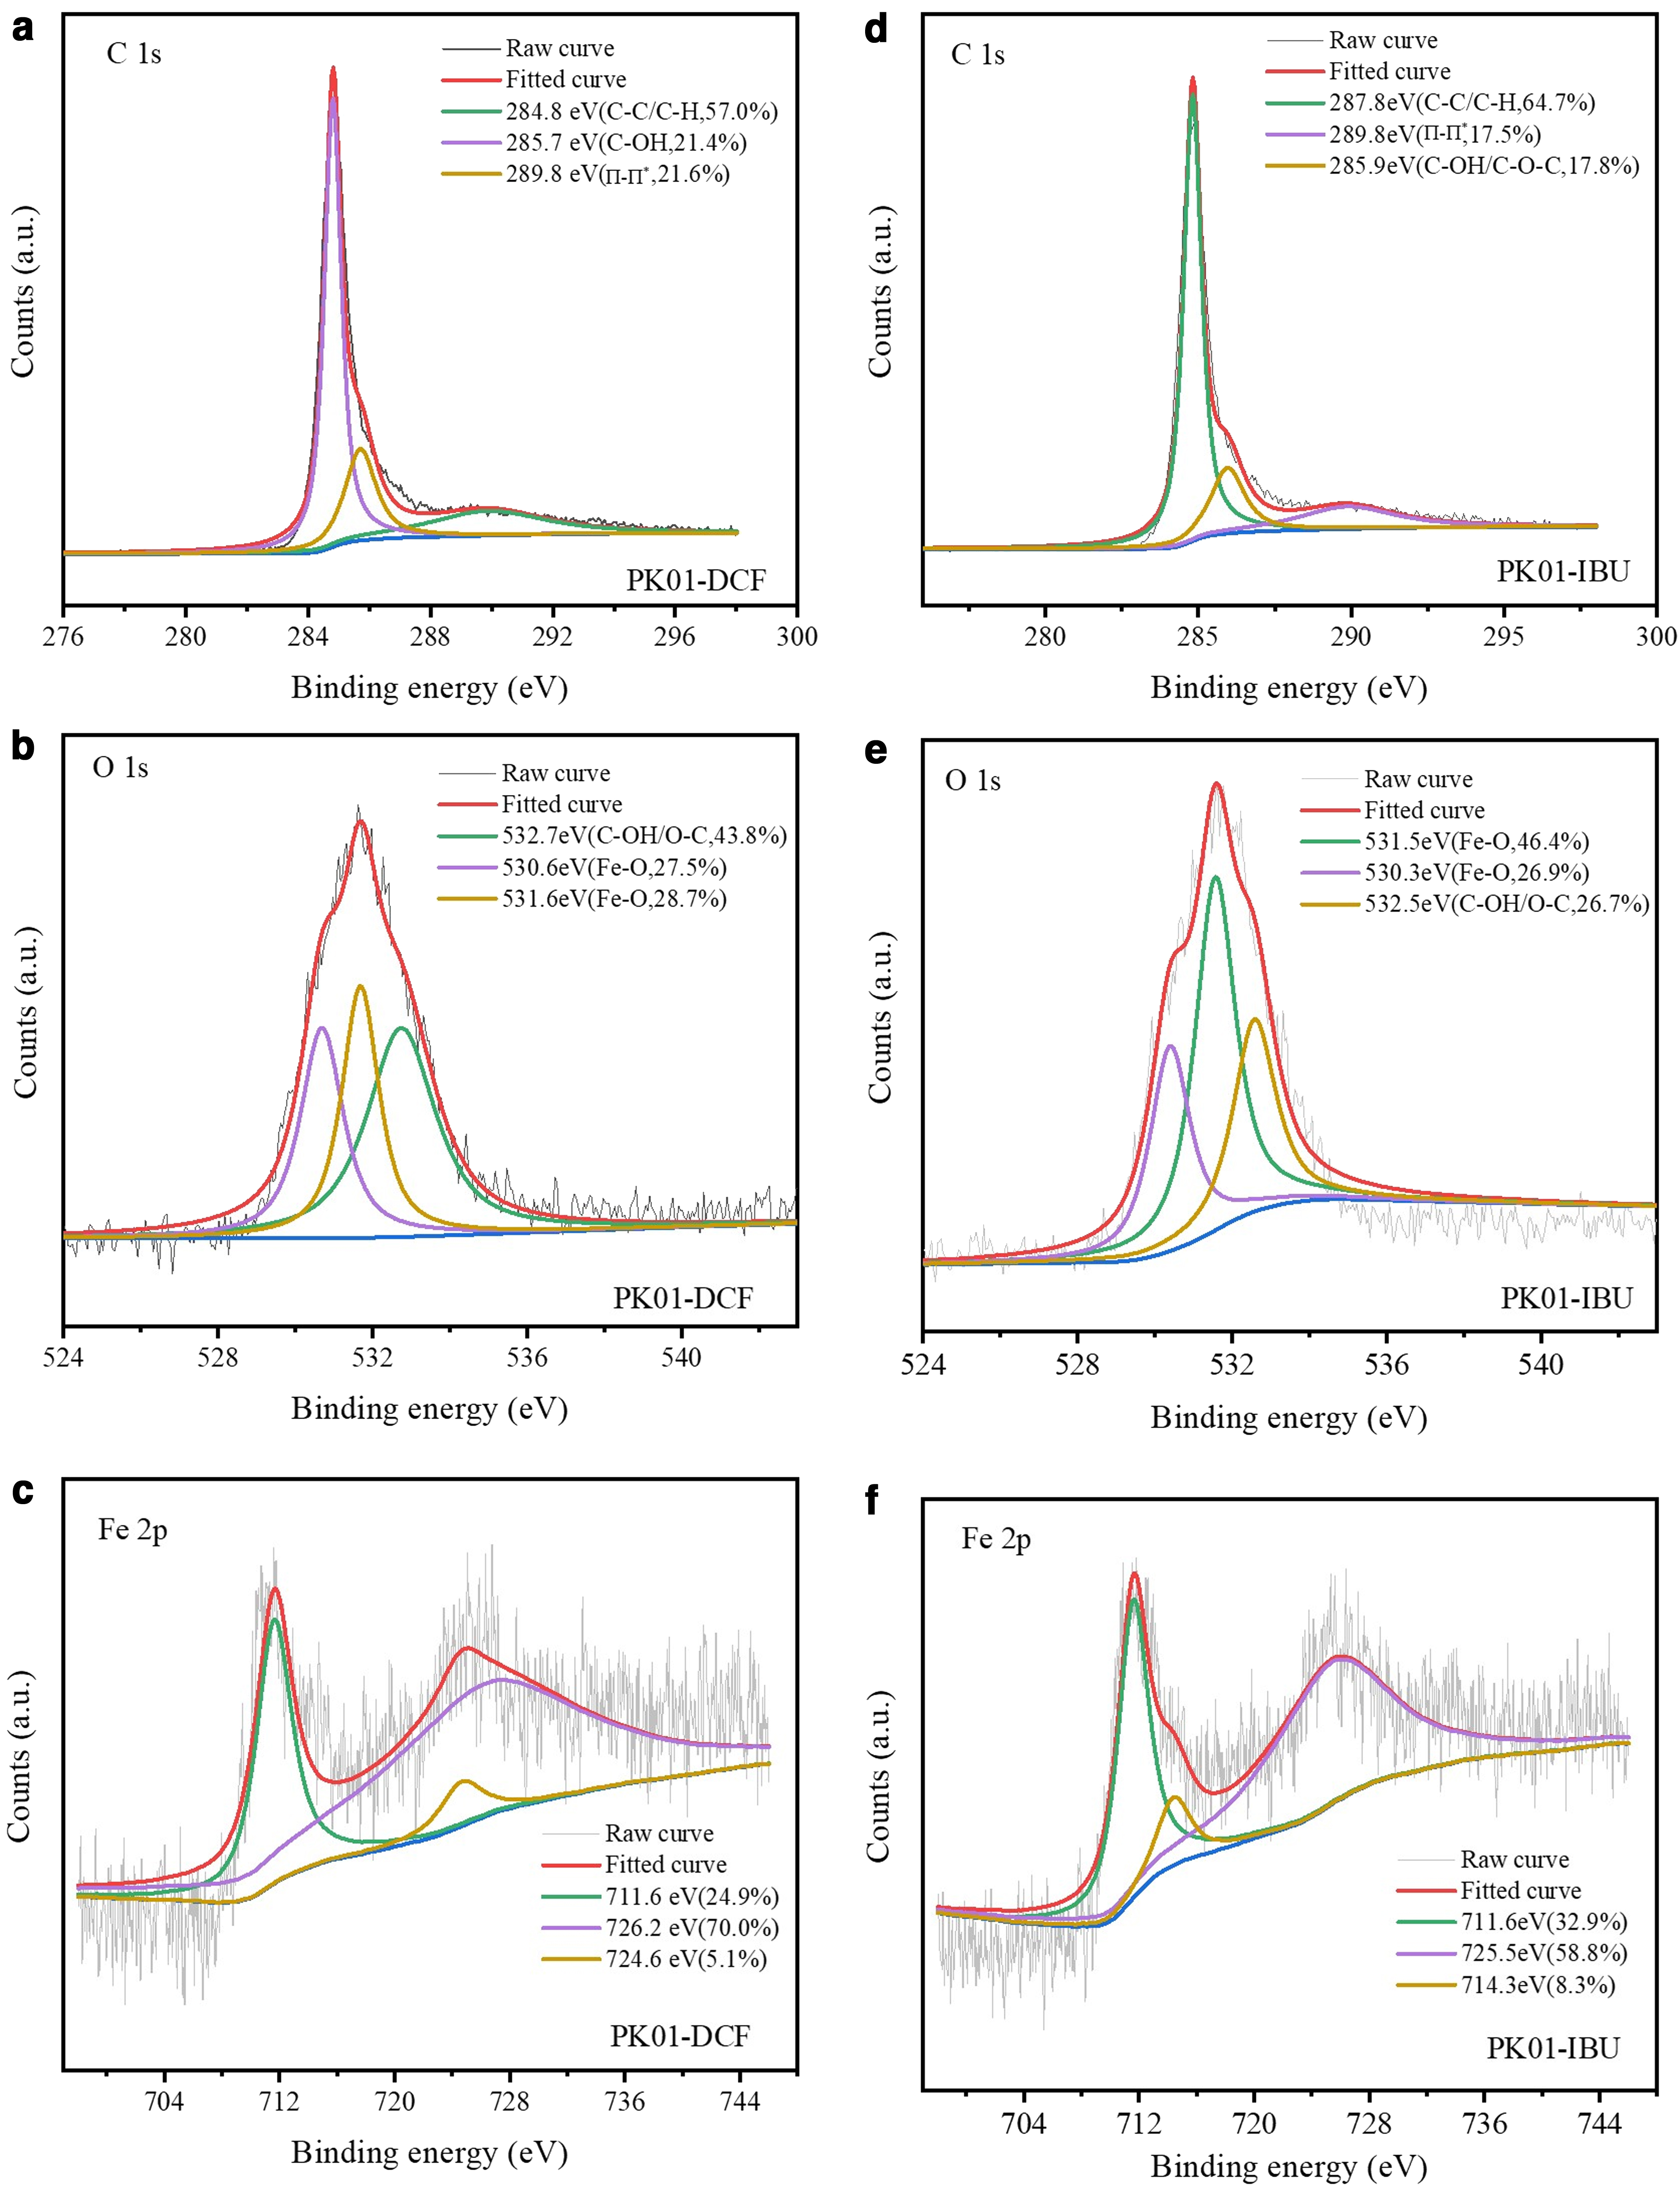
The adsorption mechanisms for IBU and DCF onto PK01 were determined according to the analyses of the above results. The results of kinetic studies indicated that Pseudo-second-order kinetic model fitted the experimental data well, suggesting that the surface functional groups had an important role in the drug adsorption processes. It could be concluded that the sorption processes of IBU and DCF involved chemisorption and rate-limiting step. The molecule of two NSAIDs contains some aromatic rings, while PK01 consisted of carboxylic functional groups (−C = O), which may be the π-electron acceptor site for the interactions. The −OH in the drug molecules could act as the π-electron donor site, and the π-π EDA interactions could be easily formed. Figure 11a and b shows the FTIR spectra of PK01 before and after IBU and DCF adsorption, respectively. As could be observed from the FTIR spectra of PK01 (Fig. 11a, b), the broad peak at 3,428 cm−1 was assigned to the −OH stretching vibration. The peak at 1,626 cm−1 corresponded to aromatic C = C bonds (Yin et al., 2018). The peaks at 1,405, 1,037, and 570 cm−1 were attributed to carboxyl (O = C−O) bonds, C-O bonds, and Fe-O bonds (in oxides and oxyhydroxides), respectively (Amaladhas et al., 2012; Tuna et al., 2013; Long et al., 2015). Compared to PK01, there were some new peaks on the PK01 FTIR spectrum after IBU and DCF adsorption. The peaks corresponding to the C = C bonds shifted from 1,626 to 1,603 cm−1 (Fig. 11a) and 1,581 cm−1 (Fig. 11b), respectively, which confirmed the presence of π-π interaction between adsorbent and adsorbates. In addition, the skeletal vibration of O − H at the peak of 3,428 cm−1 also shifted to 3,437 and 3,436 cm−1, and the C − O stretching (1,037 cm−1) shifted to 1,040 and 1,047 cm−1 corresponding to the FTIR spectra of IBU loaded PK01 and DCF loaded PK01, respectively. The peak at 570 cm−1 (Fe-O) disappeared after adsorption. Instead, there were some new peaks at 537 cm−1 (Fig. 11a) and 555 cm−1 (Fig. 11b). The shifting of these peaks indicated that a strong associating O − H bond was formed after adsorption and the formation of hydrogen bonds between the oxygen-containing functional groups of PK01 and the two NSAID molecules. To further illustrate the findings from the FTIR results, XPS studies of the PK01 after IBU and DCF adsorption were carried out. The result is presented in Fig. 6. As mentioned in Characterization of Adsorbents section, the C 1s spectrum of PK01 could be divided into three peaks with binding energies of 284.8, 286.1, and 289.4 eV corresponding to the C-C, C-O, and COOH bonds, respectively. After adsorption, the peak at 289.8 eV appeared in C 1s high-resolution spectrum of IBU and DCF-loaded PK01, which was attributed to π-π bonds (Morais et al., 2015). This result demonstrated that π-π bonds participated in the adsorption of two drugs, which was consistent with FTIR results. Moreover, the shifting of the peak at 286.1 to 285.7 eV (DCF-loaded PK01) and 285.9 eV (IBU-loaded PK01) may be attributed to the involvement of oxygen-containing functional groups in the reaction. There were many hydroxyl and carboxylic groups on the modified-biochar surface, which could bind with the hydroxyl groups of DCF/IBU through hydrogen bonds, leading to the migration of C-O bonds. Furthermore, according to the O 1s peaks of PK01 before (Fig. 5b) and after (Fig. 6b, e) adsorption, similar migrations had occurred in the O 1s spectrum after DCF/IBU loaded on PK01. This further indicated that DCF and IBU reacted with the oxygen-containing functional groups of PK01 through hydrogen bonds. Thus, it can be concluded that the two anti-inflammatory drugs were adsorbed by electrostatic attraction, H-bonding interactions, and π-π EDA interactions. This finding matched the results of pH experiments and XPS analyses.

FTIR spectra of PK01,
The adsorption results obtained from single and binary sorbate systems under the similar experimental conditions are displayed in Fig. 12. The result showed that PK01 performed better for DCF than for IBU in terms of adsorption capacity in both single and binary systems. Besides, the qe value was lower in the binary system than in the single system. The IBU uptake in the binary system was reduced by 67.2% compared to that of the single system, while a decrease of 58.6% was seen for DCF. In fact, DCF is easier adsorbed from water than IBU because its molecule has more H-bond acceptor compared with IBU. It was reported that the number of H-donors and H-acceptors played an important role in the adsorption of pharmaceutical compounds (Seo et al., 2016). Thus, H-bonding can be considered as the prominent driving force for the adsorption of IBU and DCF onto PK01.

Adsorption capacity of DCF and IBU in single and binary systems.
Application for real water samples
The adsorption capacities of PK01 for IBU and DCF were evaluated with the real water sample, including Hunan University campus's pond water and tap water (for inhabitant direct use). The water samples were first tested, and the results showed that none of these drugs appeared in the collected water samples. Thus, spikes of single adsorbate standard and binary standard solutions were added to the samples. The reaction conditions were described in Application for the Real Water Samples section, and the obtained results are shown in Table 4. As could be seen, the quantities adsorbed of DCF were higher than those of IBU, and the adsorption capacity for each drug decreased in the binary standard solution. These phenomena may be explained by the contribution of the N-H functional group on the DCF molecule, which could interact with biochar through H-bonding, and the competitive adsorption had occurred in the mixed solution of IBU and DCF.
The Ibuprofen and Diclofenac Removal from Single and Binary Standard Spiked Water Samples
HNU, Hunan University.
Comparison with other adsorbents
As listed in Table 5, PCDM and 2CECRB possess very high adsorption capacity toward IBU and DCF. Besides other biochar-derived adsorbents such as K2CO3 activated cork waste, mung bean husk biochar, coca shell biochar, tea waste, and coconut shell are also potential adsorbents for the removal of IBU/DCF from water. Their adsorption capacities are shown in Table 5. Compared with the adsorbents derived from activated carbon or biochar, the partially graphitic biochar (PK01) prepared in this study exhibited a considerable removal efficiency of IBU and DCF from aqueous solution with the qmax value of 66.3 and 128.3 mg/g, respectively. Thus, the PK01 can be evaluated as a potential adsorbent for the removal of NSAIDs from water environment.
Comparative Analysis of Diclofenac and Ibuprofen Removal by Different Adsorbents
Conclusions
Based on the material characterization analyses along with the adsorption of IBU and DCF from water on PK01 and PK02, the following conclusions can be drawn:
A partially graphitic carbon material was successfully synthesized using K2FeO4 as the activator agent. The concentration of activator also had an important effect on the adsorption capacity. K2FeO4 0.1 M can better convert amorphous carbon (biochar) to partially graphitic carbon than K2FeO4 0.2 M. The adsorption process was affected by contact time, solution pH, and initial concentration of the drugs, and DCF was removed more efficiently than IBU in both single-solute and binary-solute systems. The maximum adsorption capacity of PK01 for IBU and DCF was found to be 66.3 and 128.3 mg/g, respectively, by Langmuir isotherm equation. The possible interaction mechanisms for the considerable IBU and DCF removal by PK01 might be electrostatic attractions, H-bonding interactions, and π-π EDA interactions. PK01 can be suggested as a potential adsorbent for the removal of nonsteroidal anti-inflammatory drugs from a set of real water samples.
Footnotes
Acknowledgments
The authors thank Key Laboratory of Environmental Biology and Pollution Control, College of Environment Science and Engineering-Hunan University for their support during experiment process. The authors also thank the anonymous reviewers who have helped to improve this article.
Author Disclosure Statement
No competing financial interests exist.
Funding Information
This work was supported by the National Natural Science Foundation of China (No. 51521006, 51609268, and 51809089) and the Key Research and Development Plan of Hunan Science and Technology Program in 2019 (2019NK2062), the Fundamental Research Funds for the Central Universities, the Natural Science Foundation of Hunan Province, China (Nos. 2018JJ3040 and 2018JJ3096).

References
Supplementary Material
Please find the following supplemental material available below.
For Open Access articles published under a Creative Commons License, all supplemental material carries the same license as the article it is associated with.
For non-Open Access articles published, all supplemental material carries a non-exclusive license, and permission requests for re-use of supplemental material or any part of supplemental material shall be sent directly to the copyright owner as specified in the copyright notice associated with the article.
