
Abstract
Batch tests were performed to investigate the effects of initial pH on the two-stage hydrogen and methane production process by co-digestion of food waste and waste activated sludge. Results show that the two-stage process had good pH adaptive capacity. Hydrogen production was similar at initial pH of 5.5–11.0 with hydrogen yields of 37.3–42.0 mL-H2/g-VSadded, but was inhibited at initial pH of 4.0. The highest hydrogen production rate was obtained at a stable pH of 4.5–5.7. The dominant acidification products at the end of hydrogen production was acetate at initial pH of 4.0 and butyrate at initial pH of 11.0, and the subsequent methane production was likely to be affected by the component of volatile fatty acids (VFA) at the end of hydrogen fermentation. The residuals produced from hydrogen fermentation process at initial pH of 5.5–10.0 had similar methane yields (MY) of 313.6–318.7 mL-CH4/g-VSadded at a fermentation time of 24.8 days. By contrast, methane production in the second stage was enhanced at extreme alkaline initial pH of 11.0 in the first stage, but partly inhibited at extreme acidic initial pH of 4.0. In the test of initial pH of 11.0, the lowest content of VFA and propionate throughout methane production stage were beneficial for MY and methane production rate. The hydrolysis efficiencies were also influenced by the initial pH in hydrogen production stage, which followed the descending order of alkaline, neutral, and acidic condition for hydrogen fermentation and the whole two-stage process, but followed the opposite orders for methane fermentation.
Introduction
As an ideal fuel, hydrogen produces only water upon combustion and releases energy of 122 kJ/g, which is much higher than hydrocarbon fuels (Wang et al., 2017). Hydrogen can also be used as industrial raw commodity in the fields of transportation, power generation sectors, fertilizer production, metal work, and so on (Kumar et al., 2018; Dawood et al., 2020), and thus hydrogen production has attracted extensive attention recently. Fossil fuels are reported to be the dominant sources for hydrogen production currently (Bičáková and Straka, 2012). However, the fossil fuels themselves are nonrenewable energy carriers and the conversion from fossil fuels to hydrogen consumes lots of energy (Wang et al., 2010), thus it is necessary to find the alternative sources for hydrogen production.
Hydrogen production from organic wastes is sustainable and eco-friendly, achieving wastes reduction and renewable energy production simultaneously. Among various hydrogen production processes, dark fermentation is one of the most commonly used technologies because of its cost-effectiveness, high efficiency, low requirement of external energy, and great-prospect in practical application (Jia et al., 2020). To obtain more bioenergy from waste organic matters, the two-stage anaerobic fermentation is widely performed with combined hydrogen fermentation and subsequent methane fermentation feeding the end products of hydrogen fermentation (Siddiqui et al., 2011; Sreela-or et al., 2011; Liu et al., 2019).
The waste activated sludge (WAS) produced in biological wastewater treatment plants contains great amounts of microorganisms and organic and inorganic matters, which might be harmful to the surrounding without effective treatment. Otherwise, the WAS is also a kind of biomass resource and could be used as substrate for anaerobic fermentation. However, because of the low carbon/nitrogen (C/N) ratio in WAS, limited biogas could be obtained through anaerobic fermentation treatment (Liu et al., 2013). Therefore, co-digestion of carbohydrate-rich organic matters and WAS is proposed to improve biogas yield (Chen et al., 2012).
Food waste (FW) is an inexpensive and abundant renewable organic waste, containing high content of easily degradable carbohydrates, whereas the anaerobic digestion of sole FW can result in rapid fatty acids production, pH decline, and microbial inhibition (Dixon et al., 2019). The co-digestion of FW and WAS is useful in the C/N ratio balance and heavy element adjustment, and thus both hydrogen and methane production can be enhanced (Kim et al., 2004; Liu et al., 2013; Yun et al., 2018).
Hydrogen production could be influenced by the operation conditions, such as pH, feeding/microorganism, temperature, pretreatment, and so on (Ghimire et al., 2016). The pH is the pivotal parameter for biogas production and microbial community structure by influencing the enzymatic activity and toxicity of the compounds in the systems (Cabrol et al., 2017).
Several pH control methods have been reported in literature to improve hydrogen production: (1) hydrogen production could be promoted at suitable controlled pH condition, and hydrogen-producing microorganisms and their metabolisms were diverse (Chen et al., 2012; Cappai et al., 2014; Yasser Farouk et al., 2020); (2) the short-term high pH shock was effective to improve the performance of hydrogen production process (Kim et al., 2010); (3) the hydrogen producing seed sludge or fermentation substrate could be pretreated by extremely high or low pH, and the microorganism selected would be dominant in the fermentation process (Wang and Wan, 2008; Jang et al., 2015); (4) the hydrolysis of complex organic matters could be enhanced at acidic or alkaline condition (Chen et al., 2007), and the released substrates would be available for hydrogen fermentation.
The initial pH also significantly affects microbial community structure and biogas production during startup stage and short-term shock by acid or alkali (Jarunglumlert et al., 2018). It was reported that different hydrogen production and lag phase time were observed at initial pH of 4.5–6.5 with sucrose and starch as substrates (Khanal, 2003). However, the optimum initial pH for hydrogen production varied with the types of substrate. The optimal initial pH was 11.0 investigated in the pH range of 5.0–12.0 for sewage sludge fermentation (Cai et al., 2004) and the highest hydrogen yield (HY) was obtained at initial pH of 8.0 studied between pH of 6.0–9.0 for FW fermentation (Kim et al., 2011a). There are limited reports on the optimum initial pH for co-digestion of FW and WAS, which has more suitable C/N ratio than sole WAS fermentation and better pH control capacity than sole FW fermentation.
It has been found that C/N ratio and controlled pH had combined effects on hydrogen production from WAS and carbohydrate-rich substrate, and the optimal controlled pH for hydrogen production changed with the carbohydrate/protein (CH/Pr) ratio of substrate (Chen et al., 2012). Therefore, the performance of co-digestion process affected by initial pH might be quite different from that in the sole substrate fermentation. It has been demonstrated that the short-term pH variation in startup period significantly affected the subsequent hydrogen production performance in operational period (Kim et al., 2011a). Therefore, it is necessary to find out the effects of initial pH on the fermentation performance and pH variation in co-digestion of WAS and FW.
Furthermore, the profiles of volatile fatty acids (VFA) and the hydrolysis of substrates in hydrogen production stage will be also influenced by initial pH (Cai et al., 2004; Kim et al., 2011b), and the composition of those end products further affected methane production in the second stage (Wang et al., 2009). It is also significant to investigate the effects of hydrolysis and acidification in the first stage on methane production, because methane production stage always obtained much more energy than hydrogen production stage (Liu et al., 2013).
The research focuses on the effects of initial pH on hydrogen production and subsequent methane production, VFA variation, and the overall hydrolysis efficiency for co-digestion of FW and WAS with nutrition-balanced mixed ratio. Batch experiments were carried out at different initial pH in hydrogen production process, and the hydrolysis efficiencies in each stage and the whole fermentation stage were compared to evaluate the effect of initial pH on the substrate conversion.
Materials and Methods
Seed sludge
The raw sludge with pH of 7.4–7.6 was obtained from the anaerobic digestion reactor with WAS as substrate. The digested sludge was centrifuged at 5,000 rpm for 3 min and washed three times using distilled water The washed sludge was heated at 100°C for 30 min to enrich hydrogen-producing bacteria before serving as hydrogen production seed sludge (Xie et al., 2008).
The pH for hydrogen production seed sludge increased to 8.4, which was probably caused by the high production of protein, polysaccharides, organic N, and inorganic N, and also the low production of VFA in the heat-treated hydrolysate (Zhao et al., 2020). The raw digested sludge was centrifuged and washed following the same procedures, and then directly used as seed sludge for methane production. The volatile solid/total solid ratio (VS/TS) was 60.4% and 58.7% for hydrogen and methane production seed sludge, respectively.
Substrates
The WAS and FW were used as mixed substrates in this study. The FW proportion was 54% in feeding VS according to our previous study (Liu et al., 2013). The WAS collected from membrane bioreactor treating bath wastewater (slightly polluted gray water) was concentrated by gravitational settling for 2 days before utilizing as fermentation substrate. The FW was collected from the students' cafeteria with low oil content. During the collection of FW, the liquid oil and the FW submerged in the oil were selectively excluded. The collected FW, which was mainly composed of rice, eggs, meat, and vegetables, was mixed with tap water (volume ratio of 1:2) and then ground into FW slurry with the particle size of lower than ∼2 mm.
The characteristics of substrates are given in Table 1. Table 1 shows that the FW was rich in carbohydrate and the ratio of chemical oxygen demand (COD)/total nitrogen (TN) was 66:1, whereas the WAS was rich in nitrogen with COD/TN ratio of 18:1. The co-digestion of FW and WAS effectively improved the nutrient balance of fermentation substrate. At the FW proportion of 54%, the substrate had the COD/TN ratio of 29:1, which was closed to the optimum COD/TN of 33:1 for hydrogen production (Sreela-or et al., 2011) and COD/TKN (total Kjeldahl nitrogen) of 31:1 for methane production (Regueiro et al., 2012).
Characteristics of Fermentation Substrates
COD, chemical oxygen demand; TN, total nitrogen; VS/TS, volatile solid/total solid.
Experimental conditions
Batch experiments were conducted in duplicate using 300 mL serum bottles filled with 150 mL fermentation mixed liquor with the substrate concentration of 10 g VS/L. The seed sludge of 0.65 g TS for hydrogen production was added in each bottle. The initial pH of the mixed liquor was adjusted to 4.0, 5.5, 7.0, 8.5, 10.0, and 11.0 by HCl and NaOH solutions, respectively. The bottle containing seed sludge without substrates addition and pH adjustment (initial pH 8.4) served as blank. All the bottles were purged by nitrogen gas for 10 min and then sealed by rubber stoppers. The hydrogen fermentation was performed at a rotating speed of 120 rpm and temperature of 37°C.
After hydrogen production ceased, the preparation for methane production started. The methane-producing seed sludge of 0.45 g TS was added into each bottle. Because of the significance of neutral condition to the methanogens, the pH of the substrates was adjusted to 7.0 and then the K2HPO4/KH2PO4 buffer solution (pH 7.0, 0.1 mol/L) was added to prevent pH decrease. All the bottles were purged by nitrogen gas for 10 min again before sealing and cultivating at 37°C for methane production. The cumulative hydrogen and methane gas volume were calculated by the equation described in the literature (Kim et al., 2011a). The actual methane production was determined based on the difference in biogas production detected in the batch tests and the blank test, because the seed sludge also produced a little methane in the second stage.
Analytical methods
Biogas volume was measured by a glass syringe and converted into standard conditions (0°C, 1.013 bar). Compositions of biogas were analyzed by a gas chromatograph (BEIFEN 3040) equipped with a thermal conductivity detector and a stainless steel packed column (TDX-01, 2 m). VFA and ethanol in the mixed liquor were analyzed by another gas chromatograph (SP6890) equipped with a flame ionization detector and a fused silica capillary column (HP-FFAP, 0.53 mm × 10 m × 1 μm). The specific analytical condition for biogas and VFA composition were described in a previous study (Liu et al., 2013). The initial pH was measured with a pH meter (Sartorius PB-10). The mixed digestate of 0.2–0.3 mL was extracted by a needle for pH measurement by a pH micrometer (Luosu RPH10) during the whole fermentation process.
The carbohydrate was analyzed using anthrone-sulfuric acid method with glucose as standard (Gaudy, 1962), and the protein was analyzed by Lowry method (Lowery et al., 1951). COD was measured by HACH method (HACH). The TS, VS, TN, and ammonium were determined according to standard methods (APHA, 2005).
Kinetic analysis
The cumulative hydrogen and methane volume in batch experiments followed the modified Gompertz equation, as given in Equation (1) (Khanal, 2003).
where H represents the cumulative hydrogen or methane production (mL), λ the lag phase time (h), P the hydrogen or methane production potential (mL), Rm the maximum hydrogen or methane production rate (mL/h), and e the constant 2.71828. The values of P, Rm, and λ for each batch were determined by best fitting the hydrogen or methane production data for Equation (1) using Microsoft software Excel 2010.
Hydrolysis efficiency and biogas efficiency and COD equivalents
The hydrolysis efficiencies in each stage and the whole two-stage process were calculated based on COD balance referring to the previous study (Niu et al., 2014), as given in Equations (2)–(4). The biogas production efficiency was calculated following Equation (5).
where
The COD equivalents utilized in the study for carbohydrate and protein was 1.06 and 1.5, respectively. The CH/Pr ratio of the fermentation substrate based on COD was ∼0.8 and the detailed calculation is available in Supplementary Equation (S1) of Supplementary Data. The VFA concentrations were also shown on COD basis, and the COD equivalents were 2.09 for ethanol, 1.07 for acetate, 1.51 for propionate, 1.82 for butyrate and i-butyrate, 2.04 for valerate and i-valerate, which were also based on their oxygen demands of complete combustion.
Statistical analysis
The SPSS software version 22.0 (IBM) was used for one-way analysis of variance and Pearson correlation test. The pairwise comparisons of the means were conducted using the Tukey's honestly significant difference test. The threshold p-value of 0.05 was declared significant.
Results and Discussion
Effects of initial pH on hydrogen production stage
Hydrogen production and pH variation
Figure 1a and b shows the cumulative hydrogen production and pH profiles at various initial pH during hydrogen fermentation, respectively. The corresponding curves of Equation (1) using the best-fitted kinetic parameters, HY, maximum specific hydrogen production rates (MSHPR), and energy yields (calculated based on VS in the substrate) are summarized in Table 2. In hydrogen fermentation stage, there was almost no biogas produced in the blank test and the pH slightly decreased from 8.4 to 7.3. The methane was not detectable in all the tests.

Cumulative H2 production
Kinetic Parameters for Hydrogen Production, the Corresponding Hydrogen and Energy Yields, Maximum Specific Hydrogen Rates at Various Initial pH at Hydrogen Production Stage
Ratio of the measured cumulative hydrogen production and the VS of substrate.
MSHPR, maximum specific hydrogen production rate.
Table 2 and Fig. 1a show that the initial pH as low as 4.0 inhibited hydrogen production obviously with the HY of only 0.3 mL/g-VS. The pH profiles in Fig. 1b indicated that the pH maintained at 3.9–3.2 for 41.4 h at the initial pH of 4.0. It was reported that undissociated VFA and low hydrogenase activity in acidic condition would be harmful for hydrogen production, which might be the reasons of inhibition for hydrogen production at initial pH of 4.0 (Hwang et al., 2004; Ren et al., 2008). Hydrogen production inhibited by the pH as low as 4.0 was also reported in the literatures treating various substrate, such as sole WAS, sole FW, and grass silage (Cai et al., 2004; Pakarinen, 2008; Zhu et al., 2009), and thus pH maintenance to >4.0 was essential for anaerobic biohydrogen production.
There was no significant difference (p > 0.05) in HY at initial pH of 5.5–11.0, which was between 37.3 mL-H2/g-VS and 42.0 mL-H2/g-VS, whereas hydrogen production from sole FW or WAS fermentation was greatly influenced by the initial pH (Cai et al., 2004; Kim et al., 2011a). The comparison between co-digestion and sole substrate fermentation indicates that hydrogen production from co-digestion process had a good adaptive capacity on pH variation. It could be assumed that the hydrogen production process could be started up at any initial pH between 5.5 and 11.0 and also might resist the short-term acidic or basic shock for co-digestion of FW and WAS. However, it should be further verified in future studies.
The HY of 40.2–42.0 mL -H2/g-VS in this study was higher than the reported 23.7 mL-H2/g-VS for co-digestion of FW and WAS (60%:40%) at initial pH of 6.0 (Kim et al., 2004), but lower than ∼60 mL-H2/g-VS at initial pH of 7.0 with FW and WAS proportion of 1:1 (Zhu et al., 2008).
As given in Table 2, the MSHPR decreased from 2.6 mL-H2/h/g-VS to 1.5 mL-H2/h/g-VS as the initial pH varied from 5.5 to 11.0, implying the hydrogen producing activity was much higher at initial pH 5.5 than the others. The lag phase time for hydrogen production [λ(H2)], reflecting a delay response of spore forming bacteria to the sudden change of environment (Ghimire et al., 2016), was relatively shorter at the initial pH of 7.0–8.5, which is similar to the studies of sole FW or sole WAS fermentation process (Cai et al., 2004, 2011a). This result implies that the hydrogen-producing seed sludge needs more time to adapt environment at extreme acidic and alkaline conditions.
The conclusions about λ(H2) and Rmax obtained from FW and WAS fermentation are quite different from those in lactose-rich substrate fermentation inoculated the precultured pig slurry, where the initial pH of 4.0–10.0 insignificantly affected lag phase and the final pH, and the Rmax linearly increased with initial pH (Vasmara and Marchetti, 2017). It seems that the types of substrates and seed sludge would affect the kinetics of hydrogen production at various initial pH.
At initial pH of 5.5–11.0, it could be obviously observed that a stable pH with the average of 4.5–5.7 (standard errors of 0.08–0.14) was maintained by itself for almost 41.4 h, and the cumulative hydrogen production rapidly increased during this period, which is given in Fig. 1a. This result indicates that the pH of 4.5–5.7 was suitable for hydrogen production from co-digestion of FW and WAS, which is coincident with the reported optimum pH of 5.2 for hydrogenase production (Vasmara and Marchetti, 2017).
However, for sole FW fermentation, the controlled pH of 5.5 reached the lowest HY (Cappai et al., 2014; Yasser Farouk et al., 2020). Actually, the effects of controlled pH on HY were reported to change with the CH/Pr ratio of fermentation substrate. In this study, the CH/Pr ratio on COD basis was ∼0.8 and a long-term stable pH of 4.5–5.7 was kept as shown in pH profiles. Similar HY was also reported at the CH/Pr ratio of 1.0 and the controlled pH of 5.0–9.0, but HYs were quite different at the high CH/Pr ratio of 3.8–6.6 (Chen et al., 2012).
It was interesting that the H2 fermentative system tended to maintain suitable pH range spontaneously for a period of time in each test of this study. The pH of fermentative liquor was mainly affected by the relative content of the produced acidic and basic materials, such as VFA and ammonium, which were mainly produced from carbohydrate and protein degradation (Li et al., 2017).
The buffering materials in the fermentation system might also promote the pH stability. The stable and suitable pH period was also found in sole FW fermentation process with the addition of buffer solution (Khanal, 2003). It has been reported that the buffer addition to hydrogen production system by FW fermentation induced to the final pH increase, and the buffering capacity could also be produced by the addition of sewage sludge (Zhu et al., 2008). Therefore, the buffering capacity of the co-substrate had also taken effects on pH maintenance. Previous studies had mentioned the importance of pH controlling on hydrogen production (Chen et al., 2012; Yasser Farouk et al., 2020), whereas the pH controlled at a suitable value by itself is attractive for large-scale hydrogen production process, because of its beneficial effects on the reduction of alkaline agent and simplification of external process control.
VFA compositions at the end of hydrogen production
Figure 2 provides the main components of VFA on the basis of COD at various initial pH at the end of hydrogen production. The i-butyrate and i-valerate with the respective concentrations of <39.1 mg-COD/L and 171.5 mg-COD/L are not given in Fig. 2. The total VFA (TVFA) increased with the initial pH basically, indicating the acidification efficiency followed the descending order of alkaline, neutral, and acidic conditions. The maximum acidification efficiency obtained at an initial pH of 10.0 was accordant with the report with FW as substrate (Dahiya et al., 2015).

VFA distribution at the end of hydrogen production stage at various initial pH. VFA, volatile fatty acids.
At the initial pH of 4.0, acetate and ethanol were dominant in liquid phase and limited biogas was produced, indicating that the main metabolic product was acetate and ethanol rather than hydrogen at initial pH of 4.0. Besides, the lowest TVFA production at initial pH of 4.0 was also caused by the inhibition of microbial activities by undissociated VFA at very low stable pH (Jiang et al., 2013).
The profiles of VFA at the initial pH of 5.5 show that the dominant VFA were butyrate with the proportion of 40.3% in the TVFA, which was followed by ethanol and acetate. However, the main products changed to butyrate and valerate at initial pH of 7.0, 8.5, and 10.0, and the sum of them accounts for 50.3–61.9% of the TVFA. At the initial pH of 11.0, the dominant VFA was butyrate with a proportion of 64.8% in the TVFA, followed by acetate accounting for 15.6% of the TVFA. Different from the VFA profiles at the initial pH of 7.0–10.0, few propionate and valerate were produced at the initial pH of 11.0.
At the initial pH of 10.0 and 11.0, the TVFA concentrations were much higher than those at other initial pH conditions, resulting in more obvious pH drop and thus similar final pH at the end of hydrogen production. The stable pH of 5.3–5.7 (initial pH of 10.0–11.0) achieved higher VFA production than stable pH of 4.5–5.0 (initial pH of 5.5–8.5), which was closed to the reported result that optimal pH for VFA production was 6.0 rather than 5.0 (Jiang et al., 2013; Yasser Farouk et al., 2020).
It was reported that hydrogen was produced accompanied by acetate, ethanol, and butyrate (Hwang et al., 2004; Kim et al., 2011a), which was also demonstrated in this study. Several studies reported the butyrate/acetate (B/A) or butyrate produced was correlated with HY (Kim et al., 2004; Ghimire et al., 2016), whereas there was no significant correlation (p > 0.05) between HY and B/A (mM/mM) or butyrate produced in this study based on Pearson correlation analysis.
The metabolic pathways involved in hydrogen production and consumption during hydrogen fermentation affected the product relationship. In acetate pathway and butyrate pathway for hydrogen production, 4 mol-H2/mol-glucose and 2 mol-H2/mol-glucose were produced respectively, whereas hydrogen might also be consumed and converted into acetate by homoacetogens during hydrogen fermentation cultivated with heat-treated seed sludge (Gao et al., 2018; Rafieenia et al., 2018). The diversified metabolic pathways at various initial pH result in different correlation between HY and B/A or produced butyrate, demonstrating that initial pH also affected the metabolic pathways involved in hydrogen production.
Effects of initial pH in hydrogen production stage on subsequent methane production stage
Methane production
To obtain more bioenergy from substrate and investigate the effects of initial pH in hydrogen production stage on further methane production stage, the anaerobic fermentation for methane production was performed with the hydrogen production residuals as substrates. Figure 3 provides the methane production and corresponding curves of Equation (1) using the best-fitted kinetic parameters summarized in Table 3. Table 3 also lists the methane yields (MY) in the fermentation time of 24.8 days, maximum specific methane production rates (MSMPR), and energy yields.
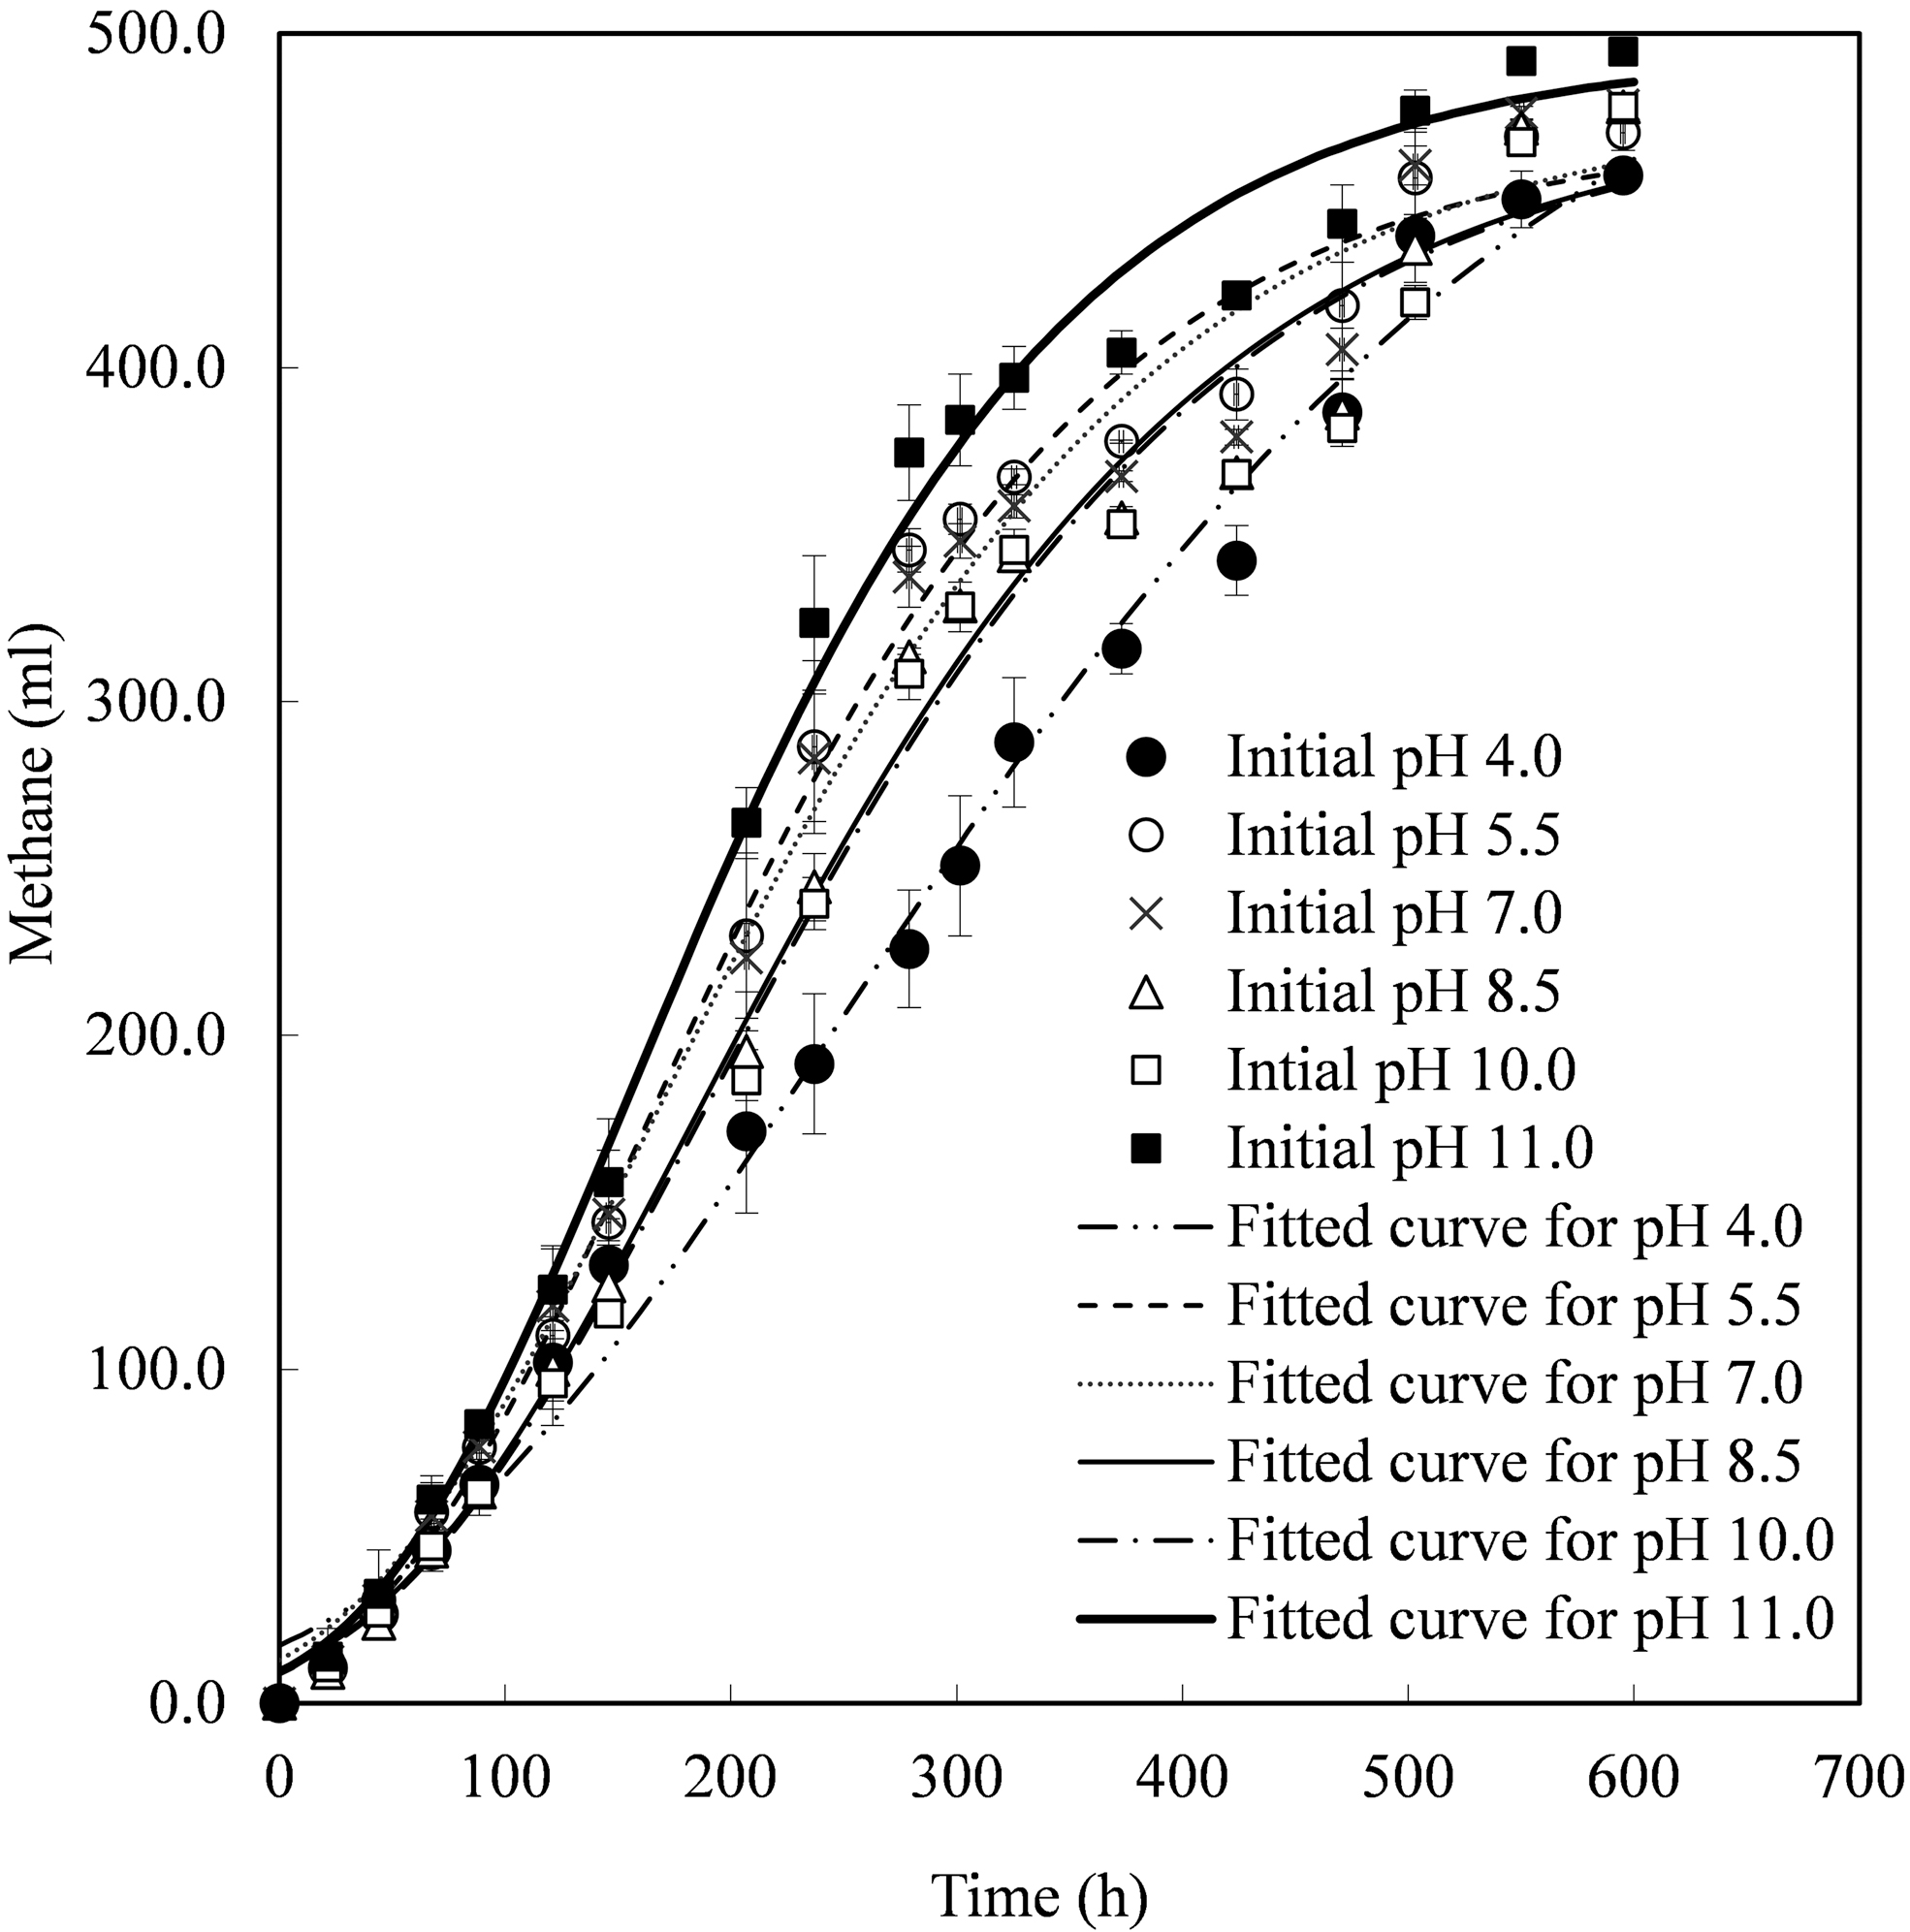
Cumulative CH4 production using the residuals produced at various initial pH in hydrogen production stage.
Kinetic Parameters for Methane Production, the Corresponding Methane and Energy Yields, Maximum Specific Methane Rates at Various Initial pH at Hydrogen Production Stage
Initial pH at hydrogen production stage.
Ratio of measured cumulative methane production at the fermentation time of 24.8 days and the VS of substrate.
MSMPR, maximum specific methane production rate.
The cumulative methane production was 19 mL-CH4 in the blank test, which was subtracted during MY calculation for various tests. Limited hydrogen with cumulative production of <1.9 mL was produced in the beginning of second stage and then was consumed gradually. Supplementary Figure S1a and b shows the variation of percentage of CH4 and CO2 in the upper space of the bottles in the second stage, respectively. The final biogas compositions were similar for all the tests with CH4 percentage of 62.0–63.1% and CO2 percentage of 33.1–35.5%. However, in the initial period of the second stage, the test of initial pH 11.0 reached the highest CH4 percentage, so did the CO2 percentage at initial pH 4.0, implying the respective high methanogenesis activities and acidification fermentation activities.
As given in Table 3, the hydrogen fermentation liquor at initial pH of 11.0 obtained the highest MY of 329.8 mL-CH4/g-VSadded, whereas that at initial pH of 4.0 obtained the lowest MY of 305.0 mL-CH4/g-VSadded at the fermentation time of 24.8 days. Statistical analysis result suggests that the extreme acidic (pH 4.0) and alkaline condition (pH 11.0) in the first stage had the opposite effect (p < 0.05) on the second stage MY obtained at 24.8 days. There was no significant difference in MY for the tests of initial pH 5.5–10.0 with the values of 313.6–318.7 mL-CH4/g-VSadded, indicating that the two-stage fermentation process had good resistance to pH variation in the range of 5.5–10.0. The MY obtained in this study was comparable with the reported 313.2–444 mL-CH4/g-VS by co-digestion of FW and WAS (Siddiqui et al., 2011).
The consistent trends of MSMPR and MY at 24.8 days are given in Table 3. The highest MSMPR of 1.6 mL-CH4/h/g-VS obtained in the test with initial pH of 11.0 was 1.6 times of that with initial pH of 4.0. However, it should also be noticed in Table 3 that the best-fitted value of the methane production potential [P(CH4)] was the highest in the initial pH 4.0 test.
For two-stage fermentation process at initial pH of 4.0, less hydrogen was released from the system in the first stage, and thus it was reasonable to have larger methane production potential in the second stage than the other tests that utilized the same substrates. Nevertheless, the MY at 24.8 days was still the lowest for the test of initial pH 4.0, mainly because of the low MSMPR. It was found in Fig. 2 that similar VFA profiles at the beginning of methane production were observed at the initial pH of 7.0, 8.5, and 10.0, where the corresponding MY obtained at 24.8 days and MSMPR were also similar. This suggests that the MY and the methane production rate were likely to be influenced by the initial VFA composition during methane production process.
VFA variations during methane production
The amounts of TVFA were first increased and then gradually decreased with fermentation time, which was typical during methane production (Kaur et al., 2020), as given in Supplementary Fig. S2. The profiles of TVFA indicate that VFA was continuously produced at the methane production stage and almost completely consumed in the end. In most cases of Supplementary Fig. S2, the TVFA reached lowest values at the test of initial pH of 11.0, implying low concentration of TVFA might be a favorable factor for methane production.
Figure 4 provides the variations of main VFA components including ethanol, acetate, propionate, butyrate, and valerate during methane production from the fermentation residuals produced at various initial pH in hydrogen production stage. The initial VFA components were the products of hydrogen production stage. The concentrations of i-butyrate and i-valerate were <273 mg-COD/L and they were totally consumed at the end of methane production, which are given in Fig. 4.

Variation of the main VFA during methane production using the residuals produced at various initial pH in hydrogen production stage.
The methanogens could only utilize simple organic matters and most of them must be first oxidized into acetate (Wang et al., 2009). Data in Fig. 3 and Table 3 illustrate that the lag time for methane production was as short as 36.7–40 h, indicating the rapid acclimatization of the inoculated methanogens and the efficient consumption of acetate. The accumulation of acetate in the initial period was caused by the conversion of other fatty acids.
The degradation of ethanol was very efficient and it was undetectable after a short period of 67.5 h in all the tests, because the oxidation of ethanol to acetate was easier than other conversions. High concentration of acetate and hydrogen was reported to inhibit the oxidation of butyrate to acetate thermodynamically (Montero et al., 2010). As a result, the butyrate degradation was suppressed by high concentration of acetate in the initial period, leading to the butyrate accumulation at the initial pH of 4.0–10.0. The butyrate concentration was decreased by the β-oxidation reaction when the acetate concentration was low enough. At the initial pH of 11.0 with high B/A ratio, continuous decrease of butyrate concentration was observed.
Valerate was reported to be produced by either amino acids degradation or oxidation–reduction reactions between amino acid pairs (Şentürk et al., 2010). The accumulation of valerate at the initial period followed by subsequent degradation was found in all the tests, which might be related to the relative rates between amino acid reaction and valerate degradation. The propionate would be produced from lactic acid and valerate degradation (Wang et al., 1999, 2009), and the oxidation of propionate to acetate was unfavorable thermodynamically because it was carried out by quite extraordinary enzyme reactions (Şentürk et al., 2010). The accumulation of propionate was observed in all the tests and it was likely to be one of the last products to be broken down to acetate before being utilized to produce methane.
However, the peak values of the propionate were different in each test with average concentrations of 2,368.9, 1,310.7, 1,610.4, 2,098.6, 2,248.3, and 885.2 mg-COD/L at the tests of initial pH from 4.0 to 11.0, respectively. The propionate was finally converted to methane and it was found that the MSMPR had a negative correlation with the peak value of propionate in the liquor (r = −0.903, p < 0.05), indicating the degradation of the propionate might be the rate-limiting step during the biochemical process for methane production. These results demonstrate that the initial pH in hydrogen production stage also had significant effects on methane production by influencing the VFA variation during methane production.
Effects of initial pH on hydrolysis efficiencies and biogas production efficiencies
For the degradation of particulate substrates in anaerobic digestion, the hydrolysis and methanogenesis were regarded as the rate-limiting stages. So the hydrolysis efficiencies and biogas production efficiencies calculated by Equations (2)–(5) were compared and the results are given in Table 4. According to Equations (2) and (3), the hydrolysis efficiencies reflect the dissolution and conversion ratio of the solid organic matters. Besides, the changes in soluble carbohydrate, soluble protein, and ammonium nitrogen at the initial and the end of hydrogen and methane production stages are given in Table 5, and the COD balance between the initial and the end of the two-stage process are given in Supplementary Table S1.
Biogas Production Efficiencies and Hydrolysis Efficiencies Affected by Various Initial pH at Hydrogen Production Stage
Initial pH at hydrogen production stage.
The biogas production efficiency in the whole process.
The hydrolysis efficiency in hydrogen production stage.
The hydrolysis efficiency in methane production stage.
The hydrolysis efficiency in whole two-stage process.
The Concentration of Soluble Carbohydrate, Soluble Protein, and Ammonium Nitrogen at the Initial and the End of Hydrogen and Methane Production Stage
As given in Table 4, the biogas production efficiencies were comparable at initial pH of 5.5–10.0 (50.0–50.9%) and improved at the initial pH of 11.0 (52.6%) but inhibited at initial pH of 4.0 (47.1%). The biogas efficiencies were significantly correlated with methane efficiencies (r = 0.976, p < 0.0.5), because the energy produced in the form of methane accounting for 96–100% of the total biogas energy.
Similarly, Table 4 also shows that the hydrolysis efficiency for co-digestion of FW and WAS in hydrogen production stage and the whole two-stage process generally increased with initial pH, indicating substrate hydrolysis efficiency also followed the descending order of alkaline, neutral, and acidic initial pH, which was coincident with acidification efficiency in hydrogen production process and biogas production efficiency in the whole process.
The obvious improvement of alkaline pH on hydrolysis of WAS had been reported in literature (Chen et al., 2007, 2012), and the initial alkaline condition for FW fermentation was also suitable for the solubilization and degradation of proteins and carbohydrate (Dahiya et al., 2015). In this study, as given in Table 5, ammonium nitrogen was higher in alkaline initial pH than neutral and acidic initial pH at the end of hydrogen production stage, demonstrating that short-period alkaline environment enhanced the protein hydrolysis and conversion during hydrogen production.
As given in Figs. 1a, 2, and Table 5, the acidic condition with initial pH of 4.0 obtained the least end products (H2, VFA, and ammonium) and the high content of soluble carbohydrate and soluble protein at the end of hydrogen production stage, indicating the substrate hydrolysis was inhibited at initial pH of 4.0. For substrate hydrolysis in acidic condition, it was found that the controlled pH 4.0 obtained higher hydrolysis efficiencies for FW than other pH (5.0, 6.0, and uncontrolled) (Wang et al., 2014), and the sludge hydrolysis was also a little higher in controlled acidic pH than neutral pH (Chen et al., 2007). These results seemed opposite to the hydrolysis inhibition by the initial acidic pH in this study. However, the pH in all the tests of this study were reduced to acidic pH within ∼11 h after start-up of fermentation, so the final stable pH for initial neutral pH was also acidic.
In this study, the lowest hydrolysis efficiencies obtained at initial pH of 4.0 (final pH of 3.2) for hydrogen production stage, partially because of the low activities of protease and α-glucosidase at extreme acidic condition, which were responsible for the solubilization and hydrolysis of proteins and carbohydrates (Xu et al., 2011; Wu et al., 2020).
For the tests of initial pH of 5.5–11.0 with stable pH of 4.5–6.7, the overall hydrolysis efficiencies were affected by both initial period and stable period, and thus displaying unique roles different from controlled pH condition. By further comparison with the hydrolysis in the reported acidogenic fermentation system, the two-stage hydrogen and methane production system produced large proportion of biogas from the hydrolyzed and acidified substrate, and the release of biogas from the anaerobic reactors relieved the biochemical inhibition of acidification metabolism and further improved the hydrolysis efficiencies. The significant positive correlation between the whole hydrolysis efficiencies and the biogas efficiencies (r = 0.973, p < 0.05) implied that biogas production enhanced substrates hydrolysis.
The hydrolysis in methane production stage had a reverse trend to the hydrogen production stage. At the test of initial pH of 4.0, the residuals produced from hydrogen production stage had the highest amount of available substrates, and thus facilitating the highest hydrolysis efficiency under neutral environment during methane fermentation.
Conclusions
The two-stage hydrogen and methane production from co-digestion of FW and WAS showed a good adaptive capacity on pH variation at initial pH of 5.5–10.0, but inhibited at initial pH of 4.0 and improved at initial pH of 11.0. Similar HY of 37.3–42.0 mL-H2/g-VSadded were achieved at the initial pH of 5.5–11.0, but almost no hydrogen was produced at the initial pH of 4.0. Relative high hydrogen production rates were observed at stable pH of 4.5–5.7. Diverse metabolic pathways at initial pH of 4.0–11.0 in hydrogen fermentation process resulted in various VFAs composition and production.
The methane production and the VFA variation during methane production stage were affected by the composition of VFAs produced at the end of hydrogen fermentation stage. The methane production rate reached the highest at initial pH 11.0 test but the lowest at initial pH 4.0 test, as well as the MY obtained at the fermentation time of 24.8 days. The high methane production performance at initial pH 11.0 test might be attributed to the low concentrations of the TVFA and propionate. The hydrolysis efficiencies in two-stage hydrogen and methane production process were significantly related to the biogas production efficiencies. The hydrolysis efficiencies in hydrogen production stage and the whole two-stage process increased with initial pH, but showed a reverse trend in methane production stage.
Footnotes
Author Disclosure Statement
No competing financial interests exist.
Funding Information
The authors are grateful to the financial support from the Natural Science Foundation of Tianjin City (16JCQNJC08200), Tianjin Enterprise Science and Technology Commissioner Project (19JCTPJC56600), and the Program of Scientific Research and Development Fund of Tianjin Agricultural University (20190115).
References
Supplementary Material
Please find the following supplemental material available below.
For Open Access articles published under a Creative Commons License, all supplemental material carries the same license as the article it is associated with.
For non-Open Access articles published, all supplemental material carries a non-exclusive license, and permission requests for re-use of supplemental material or any part of supplemental material shall be sent directly to the copyright owner as specified in the copyright notice associated with the article.