
Abstract
Municipal solid waste (MSW) generation forecasting can be considered as the biggest challenge of integrated solid waste management systems, particularly for developing countries where data collection is limited. In this study, three different machine learning algorithms, namely backpropagation neural network (BPNN), support vector regression (SVR), and general regression neural network, were applied for different countries. Comparative evaluation of these different algorithms based on gross domestic product, domestic material consumption, and resource productivity were given through the optimum solution. Moreover, the algorithms were tested for the case of Turkey. The results of this study are expected to represent a general outline for stakeholders of Turkey for improving MSW management strategies all over the country, and these results can be extended to similar developing countries across the world. It can be concluded that BPNN and SVR methods can be applied successfully for the case of Turkey and other countries across the world to predict the MSW generation, whereas BPNN is slightly better. If the input and output variables are identified well, machine learning approaches can give a good projection for waste generation, and this projection can be utilized for different countries. Furthermore, the developing countries with missing data can develop more realistic strategies for MSW management by not relying solely on international databases such as Eurostat to forecast MSW generation.
Introduction
Municipal solid waste (MSW) generation forecasting can be considered as the biggest challenge of integrated solid waste management systems, particularly for developing countries where data collection is limited. As stated in the literature, over 90% of waste in low-income countries is still openly dumped or burned (Kaza et al., 2018). Modeling methods are required for the prediction of MSW generation due to uncertainties and unavailability of sufficient data (Kolekar et al., 2016). Modern optimization methods, including machine learning algorithms, can be an option in this manner. In particular, artificial neural network (ANN) and support vector machine (SVM) methods are applied in the literature for forecasting solid waste generation. Although these two methods have a successful application in MSW generation forecasting, the number of studies using these methods in this area are limited in the literature (Kolekar et al., 2016; Melaré et al., 2017).
ANNs and SVMs are the mathematical models that accept the idea of learning and fuzzy logic systems, which are embedding structured human knowledge into workable algorithms (Kecman, 2001). Nonetheless, there is no clear boundary between these two modeling approaches, and in the literature, the terminology for SVMs can be somewhat confusing (Gunn, 1998; Kecman, 2001). The term SVM is typically used to describe classification with support vector methods, whereas support vector regression (SVR) is used to describe regression with support vector methods (Gunn, 1998). Thus, SVM can correspond to both classification and regression methods. SVMs have been developed in the reverse order manner in contrast to the development of neural networks. In other words, SVMs were derived from the theory of the implementation and experiments, whereas the ANNs followed a more heuristic path, from applications and extensive experimentation to the theory (Wang, 2005). The neural network modeling is established with a supervised learning algorithm of backpropagation (Lee and To, 2010). The backpropagation, which is a multilayered feedforward neural network, approximates the nonlinear relationship between the input and the output by adjusting the weights inwardly (Lee and To, 2010).
Understanding some factors which affect the MSW generation is essential to be able to make a projection for MSW generation (Ceylan, 2020). Some factors which tend to increase MSW generation are increasing population and economic activity (gross domestic product [GDP]), changes in lifestyles and work patterns, new products, redesign of products, and material substitution (Tchobanoglous and Kreith, 2002). Antanasijevic et al. (2013) generated GDP, domestic material consumption (DMC), and resource productivity (RP)-based parameters for the ANN models of MSW generation. They stated that these generic indicators of sustainability work well for countries with diverse levels of economic development, industrial structure, productivity, and output. Data from 26 European countries were used in the study as training, test, and validation datasets. The results were evaluated for the case of Serbia. Two types of ANN architectures, backpropagation neural network (BPNN), and general regression neural network (GRNN) for modeling MSW generation were compared.
Different ANN approaches with intelligent system algorithms are available in the literature for MSW generation forecasting. Younes et al. (2015) emphasized that solid waste generation is related to demographic, economic, and social factors and they chose the people age groups as input variables and performed the solid waste generation forecasting by using modified adaptive neuro-fuzzy inference system (ANFIS) approach. It was stated that this approach can be used to estimate solid waste generation in developing countries and three input variables (people age groups 0–14, 15–64, and above 65 years) are sufficient to forecast the waste generation in Malaysia.
Noori et al. (2009) presented the results of an improved SVM model that incorporates the principal component analysis (PCA) technique with the SVM to estimate the weekly waste generation of Mashhad City, Iran. PCA was used to lower the number of input variables and orthogonolize them. The verification of the model was performed by comparing the forecasted waste generation with the observed data and it was stated that the improved SVM model has advantages over the traditional SVM model. In a different study, Noori et al. (2010) studied four training functions related to ANNs, which were resilient backpropagation, scale conjugate gradient, one step secant, and Levenberg–Marquardt algorithms. The model approach was performed with 13 input variables using the aforementioned algorithms to optimize the network parameters for weekly solid waste generation forecasting in Mashhad, Iran.
Abbasi and Hanandeh (2016) developed a model for proper estimation of MSW generation that helps waste-related organizations to better design and operate effective MSW management systems. Four intelligent system algorithms, including SVM, ANFIS, ANN, and k-nearest neighbors (kNN) were evaluated for their ability to forecast monthly waste generation in the Logan City Council region in Queensland, Australia. They stated that machine learning algorithms can be trained with waste generation time series. They concluded that ANFIS system produces more proper estimations than kNN and SVM. Abbasi et al. (2013) stated that artificial intelligence models can be a useful solution for proper MSW generation forecasting due to dynamic and complex structure of the solid waste management system. SVM was combined with partial least square (PLS) as a feature selection tool, and was used to predict weekly MSW generation for the city of Tehran, Iran. A comparison of traditional SVM and PLS-SVM model showed PLS-SVM is better than SVM model in predictive ability. They also stated that PLS could successfully describe the complex nonlinearity and correlations among input variables and minimize them.
Minousepehr et al. (2018) utilized three computational intelligence techniques, which are M5P model trees, SVMs, and multilayer perceptron ANN to forecast solid waste generation in Hormozgan Province, Iran. It was concluded that using intelligence techniques, such as M5P model can be very practical in forecasting solid waste generation especially when there is not enough amount of recorded data for future integrated solid waste management and planning. Song and He (2014) proposed that multistep chaotic models can be used to predict solid waste generation by using time series.
Kannangara et al. (2018) developed models for proper estimation of MSW generation and diversion based on demographic and socioeconomic variables, with planned utilization of generating nationwide MSW inventories for Canada. Socioeconomic and demographic parameters of 220 municipalities in the province of Ontario, Canada were used as inputs and the corresponding residential MSW quantities were used as an output. Two machine learning algorithms, namely decision trees and neural networks, were applied to build the models. Results of the study showed that machine learning algorithms can be successfully used to generate waste models with good prediction performance. The ANN approach created remarkable models than decision tree approach and produced the best performance with 72% accuracy for out of samples. They stated that this waste generation model can be covered across Canada because the input socioeconomic parameters can be persistently generated by using census data, which are accessible to all the municipalities in Canada.
MSW management refers to all types of activities about waste generation, collection, transportation, and disposal. The forecasting of MSW generation and determination of influencing factors are the key points of MSW management strategies. Therefore, it is important that MSW decision makers select the appropriate methods to accurately predict the generation of MSW and to determine the factors that affect it. In this study, three different machine learning approaches, namely BPNN, SVR, and GRNN were applied for different countries, and comparative evaluation of these different algorithms/methods based on GDP, DMC, and RP were given through the optimum solution. The quantity of MSW highly depends on the general socioeconomic structure of the countries. Even in the same country, the characteristics and waste composition vary depending on the lifestyles, consumption habits, socioeconomic status, and traditions of people living in different cities (de Morais Vieira and Matheus, 2018). These three parameters were chosen as feature vectors or input parameters since they are generic indicators of sustainability, which work well for countries with diverse levels of economic development, industrial structure, productivity, and output (Sozen et al., 2009).
According to the results of Turkish Statistical Institute (TurkStat), MSW management is a major problem faced by municipalities (Turan et al., 2009). Yet, there is insufficient reliable data to produce a sound projection for the future of the MSW of Turkey (Bakas and Milios, 2013). Additionally, Turkey is composed of seven different geographical and climatic regions as well as different levels of economical development in each region. The chosen feature vectors are general indicators for countries with diverse levels of economic development and they are independent from the cultural habits. Therefore, to forecast the MSW of Turkey with missing data, the models which were trained with European data are tested for the case of Turkey. The results of this study are expected to fill an important gap about models to predict the MSW generation of Turkey and represent a general outline for stakeholders of Turkey for improving MSW management strategies all over the country, and these results can be extended for similar developing countries across the world. As it gives an insight for not only European countries but also developing countries, the proposed methods are applied to the case of Turkey for the first time in the literature. Furthermore, the developing countries with missing data can develop more realistic strategies for MSW management by not relying solely on international databases such as Eurostat to forecast MSW generation.
Data and Methods
Data collection
Eurostat database (Eurostat, 2019a, 2019b, 2019c), which is accessible online was used to get the required data for input and output variables of this study. Annual data of DMC were gathered as kilogram per capita (kg/ca), GDP as Euro per capita (€/ca), and waste generation as kg/ca. There are three input and one output variables in this study. Input variables are GDP/GDPEU28, DMC, and RP, whereas output variable is MSW generation. European Union (EU) currently counts 28 countries, thus EU28 abbreviation in this study stands for these countries in total. The first input variable is GDP/GDPEU28 and it was generated by assigning the GDP/GDPEU28 ratio as 1.00 for EU28 countries and taking the ratio of each country based on GDP value (Eurostat, 2019b) of each country individually. The second input variable is DMC and it was directly taken from the Eurostat database (Eurostat, 2019a). The third input variable is RP and it is the division of GDP by DMC. The only output, which is MSW generation was directly taken from the Eurostat database (Eurostat, 2019c). These input and output variables were processed in MATLAB® 2017 by using three different machine learning algorithms, which were mentioned earlier, namely BPNN, GRNN, and SVR.
Data preprocessing
Eurostat lists the broad spectrum of countries, not only for EU28 countries but also other countries involved. However, the country lists used in this study were prepared by using EU28 countries mainly. Some countries (Norway and Switzerland) were added to the list due to their similar socioeconomic characteristics. Countries such as Bulgaria, Czechia, Denmark, Cyprus, Sweden, Slovakia, and Malta were eliminated from the training dataset as they behave like outliers. These selection and elimination are performed by looking at their MSW generation and GDP correlation. For the case of Bulgaria, Cyprus, and Malta, their MSW generation are quite high comparing to their GDP. For the case of Denmark and Sweden, their MSW generation are too low with respect to their quite high income. Czechia and Slovakia are eliminated due to their quite low MSW generation with respect to their low GDP.
Decision of input parameters
As it was mentioned in the Introduction section, there are different socioeconomic factors that are affecting the MSW generation. After the comprehensive review of the literature, input variables of this study were chosen as GDP, DMC, and RP, which are representing these factors in general. The quantity of MSW highly depends on the general socioeconomic structure of the countries. Even in the same country, the characteristics and waste composition vary depending on the lifestyles, consumption habits, socioeconomic status, and traditions of people living in different cities (de Morais Vieira and Matheus, 2018). These three parameters were chosen as feature vectors or input parameters since they are generic indicators of sustainability, which work well for countries with diverse levels of economic development, industrial structure, productivity, and output (Sozen et al., 2009). Moreover, the chosen input parameters enable the evaluation of output parameter regardless of the cultural habits and lifestyles of the various countries. Hence, the models can be trained by using European countries with complete data (input/output parameters) and the trained models can be used for forcasting the MSW generation of the countries with missing data, such as Turkey.
Resource management has been performed conventionally by using the GDP parameter, which is a widely used economic indicator (Kumar et al., 2018). GDP corresponds to the added value of the products and services that depends on the resources collected and imported (Lee et al., 2014). There are different material flow indexes (i.e., DMC) and evaluation indexes (i.e., RP) mentioned in the literature about resource management (Lee et al., 2014). DMC is the industrial indicator and can be defined as the best available accounting metric for use of resources (Beça and Santos, 2014; Kalimeris et al., 2020), and it is the direct material consumption in an economy, which eliminates the exported amount (Lee et al., 2014). The other common and most efficient productivity evaluation method is using the RP index, which is a perceptible index of the resource management level required to build the long-term resource management goal for a country or an industry and to regularly assess the achievement by using the RP concept. The series of activities to improve RP include all activities that minimize resource consumption by reducing the raw materials and byproducts in all stages of the process and maximize the added value of the final products, and this concept is called as RP management (Lee et al., 2014).
According to RP statistics (Eurostat, 2020), there is no clear linear relationship between GDP and DMC. There are countries with low GDP and high DMC, (e.g., Bulgaria, Romania), but also countries with high GDP and low DMC (e.g., Netherlands). Moreover, RP quantifies the relation between economic activity—expressed by GDP—and the consumption of material resources—measured as DMC, which is an indicator derived from economy-wide material flow accounts.
Machine learning approaches
Suppose a dataset of
Backpropagation neural networks
Neural network training is about finding weights that minimize prediction error (Haykin, 2009). One of the popular neural network algorithms is the Feedforward BPNN. The training stage is usually started with a set of randomly generated weights. Then, BPNN is used to update the weights in an attempt to correctly map arbitrary inputs to outputs. BPNN training involves three steps.
Step 1 (feedforwarding of the input training signal)
Inputs are multiplied by weights; the results are then passed forward to the next layer as follows:
where K is the sigmoid activation function, n is the size of the input signal/vector, l is the size of the output signal/vector, and m is the number of neurons in the hidden layer.
Step 2 (backpropagation of the calculated associated error)
Error is defined as the dissimilarity between the actual output and predicted one as follows:
where
To reduce error, the weights should be updated, thus errors are backpropagated to update the weights using gradient descent.
Step 3 (the adjustment of the weights)
The gradient of the error function with respect to the weights of the neural network is calculated as shown below:
where
After training the application of the net only involves the feedforward step. Theoretical results show that one hidden layer is satisfactory to approximate any continuous mapping from the input signals to the output signals to an arbitrary level of accuracy by BPNN (Ojha et al., 2017). The BPNN architecture is illustrated in Fig. 1.
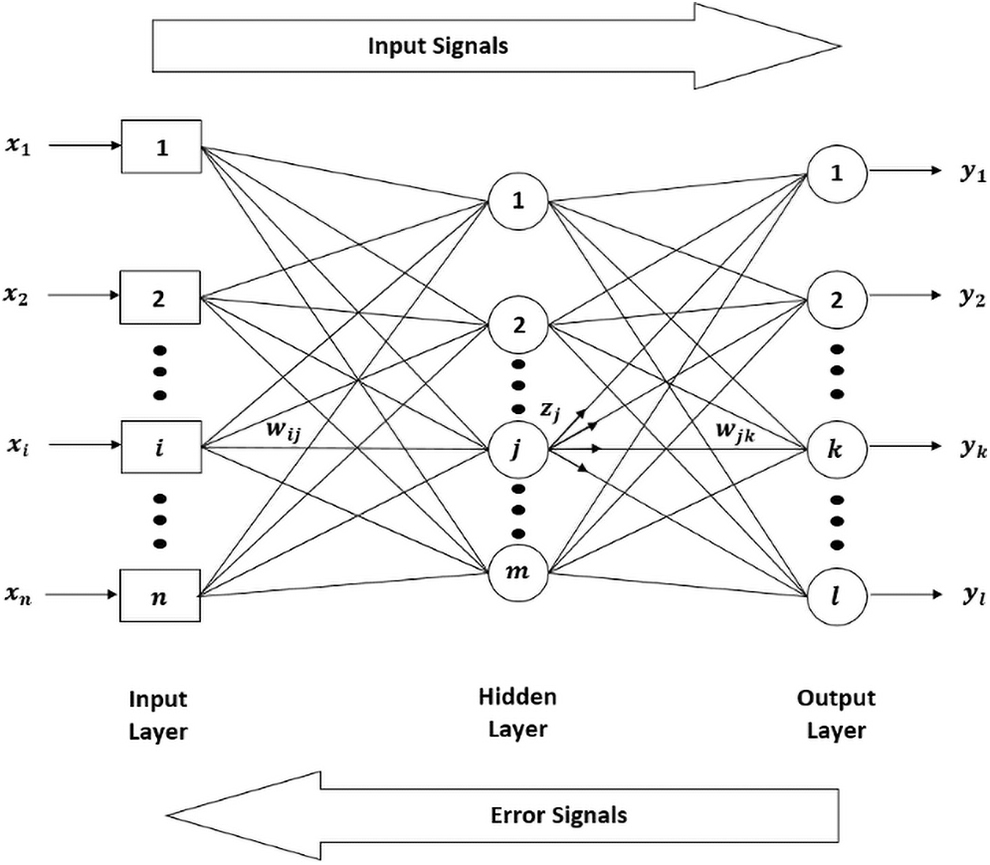
Feedforward BPNN structure. BPNN, backpropagation neural network.
General regression neural networks
GRNN relies on the nonlinear regression analysis to tackle the problem of nonlinear approximation by assessing the probability density function (Gupta, 2013). It has four layers; namely input layer, pattern layer, summation layer, and output layer and each layer has a specific task (Specht, 1991).
Input layer
The input layer is fully connected to the pattern layer, which has one neuron for each input signal. The neuron stores the values of the input variables,
Pattern layer
GRNN replaces the sigmoid activation function with a Radial Basis Function (RBF) in the pattern layer.
Summation layer
The summation layer does two different types of calculation units; the summation units and the single division unit. The number of the summation units and output units are equal.
The weighted values coming from each of the pattern neurons are accumulated in the summation units:
The division unit only sums the activation function:
Output layer
Each output unit is linked only to its corresponding summation unit and to the division unit. In each output unit, the signal coming from the summation unit is divided by the signal coming from the division unit:
and
where
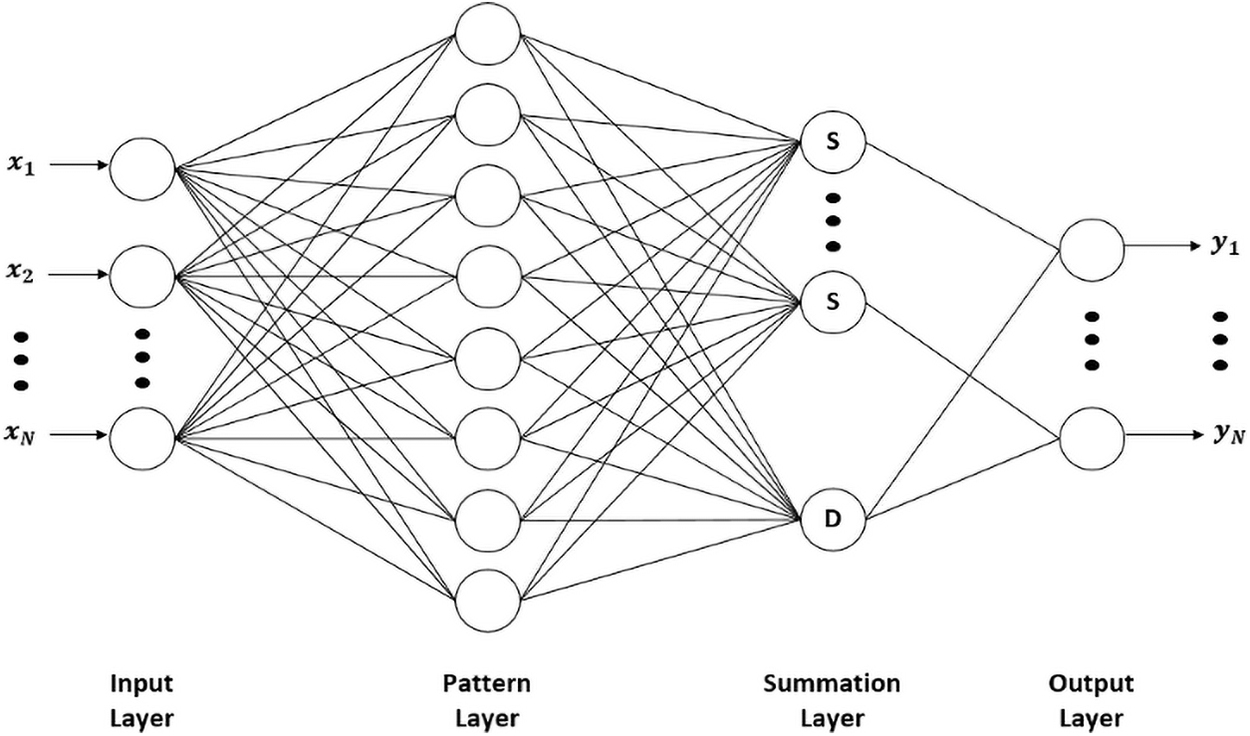
GRNN structure. GRNN, general regression neural network.
Support vector regression
The foundations of SVM/SVR have been developed by Vapnik (1995) and are gaining popularity due to many attractive features, and promising empirical performance. The variations of the method can be used for classification (SVM) and regression (SVR) problems. Linear SVR mechanism with all the data points is shown in Fig. 3.

Linear SVR mechanism. SVR, support vector regression.
The goal is to find a function
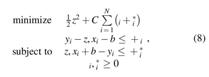
where
where
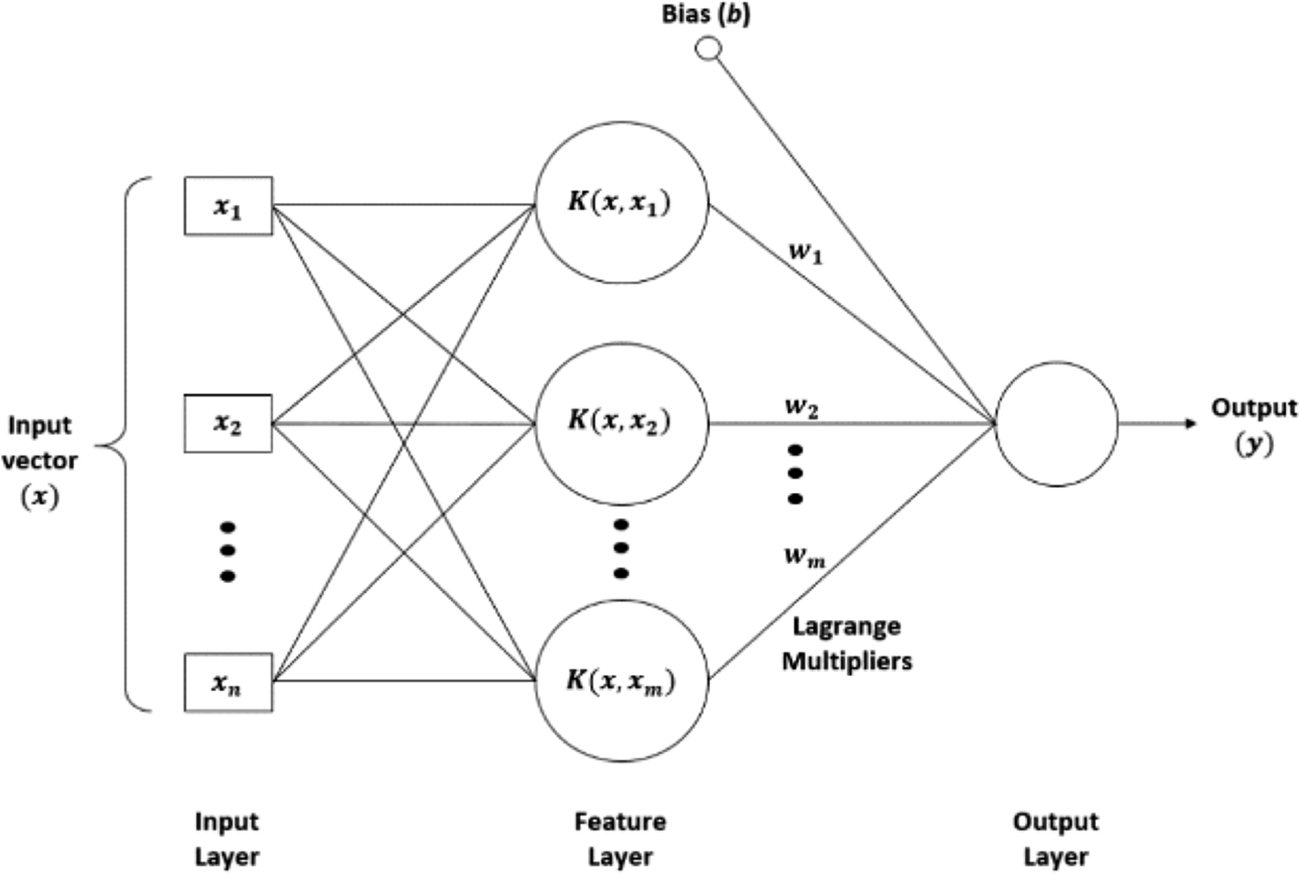
SVR structure.
Datasets
The datasets are collected from Eurostat database (Eurostat, 2019a, 2019b, 2019c) as explained in Data collection section and a preprocessing stage is applied over the data, which are mentioned in Data preprocessing section. The datasets were divided into two as training and testing datasets. Data from the years 2011 to 2013 (total of 71 input samples and 71 output samples) are used as the training dataset. As an example, the training dataset for the year 2011 is presented in Table 1, which includes the countries and the corresponding GDP/GDP_EU28 (dimensionless), DMC (kg/ca), RP (€/kg), GDP (€/ca), and MSW generation (kg/ca) values.
Training Dataset for the Year 2011
DMC, domestic material consumption; EU, European Union; GDP, gross domestic product; MSW, municipal solid waste; RP, resource productivity.
Results and Discussion
Validation of models
Three different artificial intelligence models, including BPNN, GRNN, and SVR were used to predict MSW generation in this study. The models were constructed by analyzing the correlation between a set of input and output samples.
BPNN is a widely used ANN model in different fields for the development of the nonlinear models. In this present work, a three-layer feedforward BPNN was constructed with a default parameter of ten neurons in the hidden layer, with the size of the per input sample 3 (GDP/GDPEU28, DMC, and RP) and with the size of the per output sample 1 (MSW). Levenberg–Marquardt optimization (corresponds to the network training function trainlm in MATLAB) is used to update weight and bias values. The Levenberg-Marquardt Algorithm interpolates between the Gauss–Newton algorithm and the method of gradient descent with an adapted learning rate or damping factor. The picture of the BPNN, which is obtained from MATLAB 2017 is shown in Fig. 5.
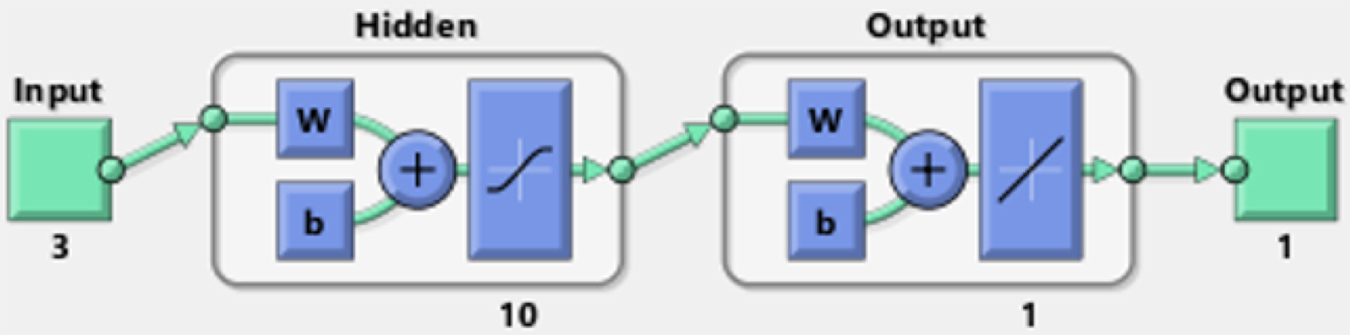
Feedforward BPNN structure for MSW generation in MATLAB® 2017. MSW, municipal solid waste.
GRNN structure was built to create MSW generation ANN model for comparison. The GRNN structure with 71 neurons in the pattern layer and those neurons that correspond to the number of samples in the training stage are illustrated in Fig. 6. Again the dimensions of the per input and output sample is 3 and 1, respectively. The spreading constant
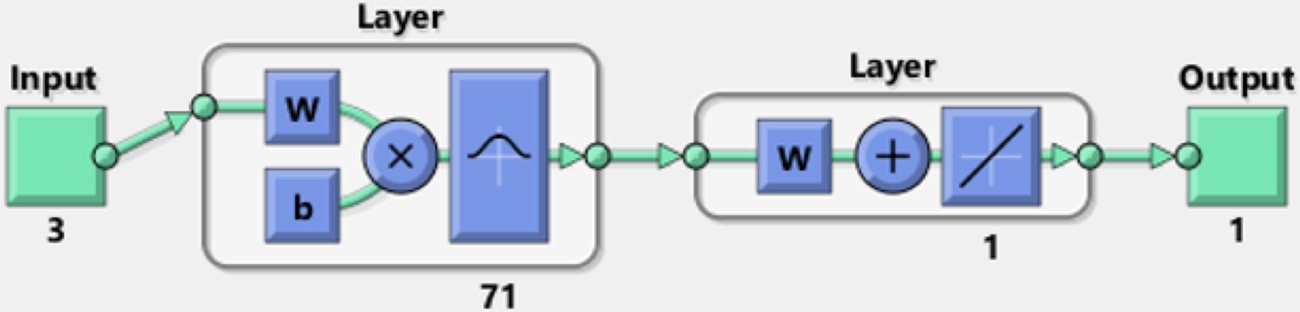
GRNN structure for MSW Generation in MATLAB 2017.
SVR is one of the machine learning techniques that has been used widely for modeling of complex nonlinear systems. The prediction performance of SVR depends on the parameters C, ɛ, and Kernel function. The RBF was chosen as Kernel Function due to its good performance (Kumar et al., 2011). The default values of C and ɛ in MATLAB 2017 are used.
There are many metrics that can be utilized to assess the performance of models in analytical studies. In this article, the predictive performance of the model is measured by the Relative Percentage Error (RelErr) and coefficient of determination (R2):

and
where N is the number of samples, Yi is the observed sample value,
Simulation results
The BPNN, GRNN, and SVR methods were implemented by using the appropriate MATLAB 2017 functions of feedforwardnet(), newgrnn(), and fitrsvm(), respectively. The running times of the algorithm can be considered almost the same in the training stage for this problem. Figure 7a and b represent the performance of the BPNN and SVR with the training datasets (2011–2013) by comparing the predicted MSW values by the models to the known actual MSW values. The coefficient of determinations,

Performances of
To demonstrate the realistic prediction capability of the models, completely new datasets are introduced to the models in the testing stage. The performances of the models are presented in Figs. 8 and 9 for the year 2010 and 2014, respectively. BPNN has R2 value varying from 0.88 to 0.87, and it is better than R2 value varying from 0.88 to 0.83 provided by SVR. These results show us that 88–87% and 88–83% of the variability in the dependent variable is predictable from the independent variables by BPNN and SVR, respectively, in the testing stage.
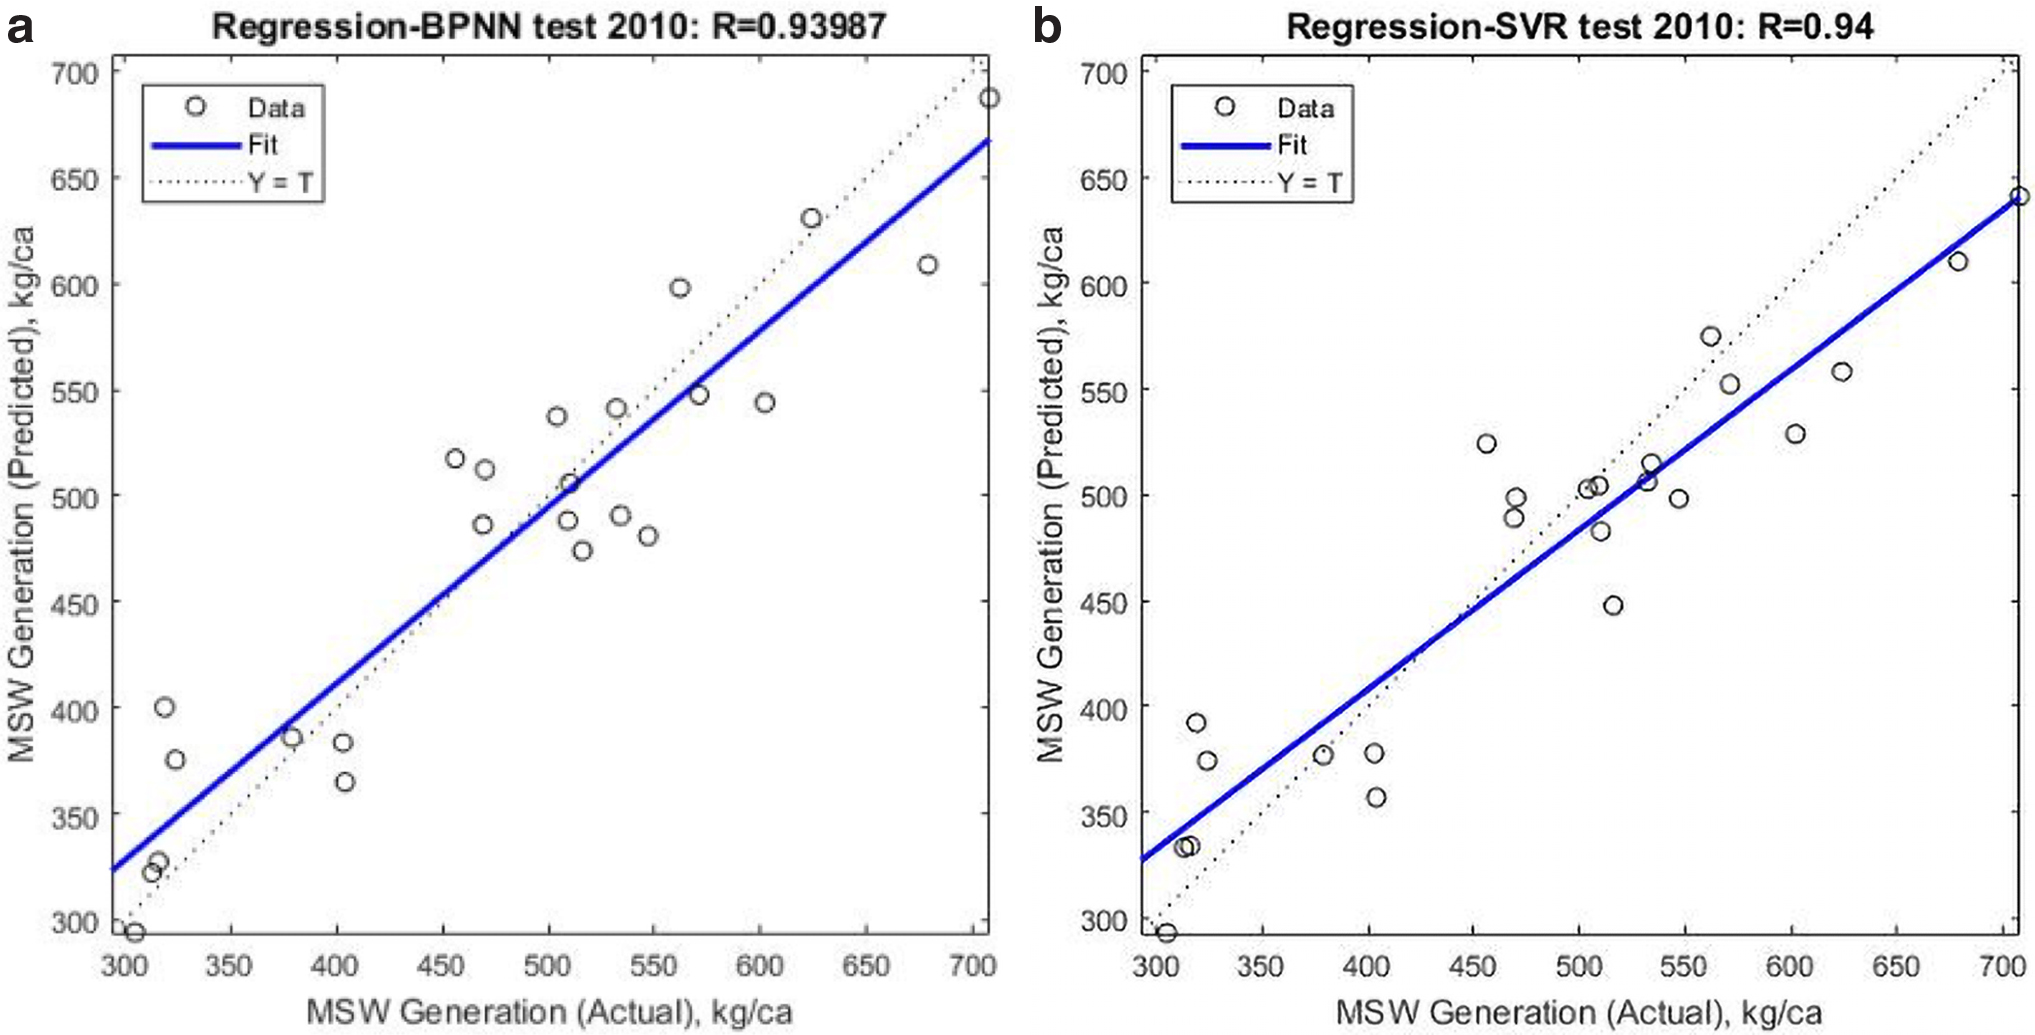
Performances of

Performances of
Table 2 demonstrates the detailed test dataset that belongs to the year 2014 and the MSW generation values predicted by the models and their relative error percentage (RelErr %). The relative error of BPNN is higher than 15% for Belgium, Poland, and Slovakia, whereas the relative error of SVR is higher than 15% for Belgium, Estonia, Poland, Romania, Slovakia, and Norway for the year 2014.
Test Dataset for 2014: Actual Values and the Predictions Made by the Models and Their Relative Errors
Bold values show the large relative errors.
BPNN, backpropagation neural network; RelErr (%), relative error percentage; SVR, support vector regression.
Machine learning models depend on data. Without a foundation of high-quality training data, even the most performant algorithms can be rendered useless. Moreover, as in the case of MSW generation, if the data itself are not appropriately collected or recorded, the results of the testing stage might show inconsistency (Tayi and Ballou, 1998). In other words, the discrepancy between the actual MSW values and the predicted values given by the BPNN and SVR is a result of the quality of the data used for training and comparison rather than the accuracy of the models. For example, in the case of Poland, the input parameters DMC and RP were estimated and these are used for the training years, which resulted in a fluctuation between the actual and the predicted values, and the relative error in 2014 is 26.5%. The MSW generation for Slovakia for model training was also calculated and this situation causes high error.
According to Table 3, the relative error of 91.6% of the countries are <15% for BPNN and SVR for the testing set of 2010. For BPNN, the relative error of 87.5% and 79.1% of the countries are <15% between 2014 and 2016. However, SVR has a lower prediction accuracy that the relative error of 75%, 66.6%, and 70.8% of the countries are <15% for the years 2014–2016. As it is stated in the literature, the relative errors lower than 15% are considered as satisfactory (Adamović et al., 2017). On the contrary to the literature (Antanasijevic et al., 2013), the relative error of 54.1%, 45.8%, 50%, and 37.5% of the countries are <15% for the years 2010, 2014, 2015, and 2016, respectively, for the GRNN algorithm. Although the training stage of GRNN was good and close to R2 = 1, the testing stages were quite unsuccessful compared with BPNN and SVR. GRNN was performed to be able to compare the results with the literature (Antanasijevic et al., 2013). However, in contrast with the literature, the results of GRNN method in this study were insufficient for the cases of European countries and Turkey. Thus, the training and test results of GRNN was not presented in the study, yet only the model prediction percentages with relative errors were given as a general projection. Therefore, the results of GRNN are not included for the above mentioned Figs. 7–9 and Table 2.
Percentage of Model Predictions with Relative Error <15% for the Test Sets in 2010, 2014, 2015, and 2016
GRNN, general regression neural network.
The integrated solid waste management in Turkey does not cover the whole country and Turkey's waste collection coverage rate is 77% in total, whereas its unsound waste disposal rate is 69% (Waste Atlas, 2020). In addition to this, the Eurostat data are reliable, yet it does not represent the whole country because it only considers the population in the areas that the data are available. Hence, the referred MSW generation actual data in this study may not represent truly the MSW generation trend of the country.
The BPNN method predicts MSW generation values of Turkey with relative errors between 6% and 16% as shown in Table 4. The relative error of SVR is between 14% and 21%. It can be concluded that BPNN and SVR methods can be applied favorably with the relative errors lower or slightly higher than 15%, whereas BPNN is slightly better for the case of Turkey.
Predicted Municipal Solid Waste Generation Values by Backpropagation Neural Network and Support Vector Regression and Their Relative Errors for Turkey
Eurostat (2019c).
According to the results of Turkish Statistical Institute (TurkStat), MSW management is a major problem faced by municipalities (Turan et al., 2009). Yet, there is insufficient reliable data to produce a sound projection for the future of the MSW of Turkey (Bakas and Milios, 2013). Therefore, the results of this study might give a rational insight into the future of MSW generation forecasting and related management strategies.
Conclusion
Waste generation forecasting, which is the main concern of MSW management systems, was performed for different countries. Machine learning approaches are mostly used in energy studies in the literature related to Turkey and the application of ANN models in MSW forecasting is limited. In this study, three different machine learning approaches (BPNN, GRNN, and SVR) were applied with training and test datasets regarding GDP, DMC, and RP inputs/parameters. The algorithms were tested with datasets, which belong to 7 years (2010–2016), and the countries mostly in Europe. The results show that BPNN and SVR methods can be applied successfully to the countries in Europe as well as for the case of Turkey to predict the MSW generation.
Estimating waste generation is essential to ensure that current waste management strategies and treatment technologies continue to function effectively and that waste generation rates are in line with future changes. A proper waste management system is influenced by a variety of factors that depend heavily on the amount of waste, such as appropriate infrastructure, government incentives, applicable laws, and regulations. Thus, with the presented results, waste management strategies can be better planned in advance and adapted to unforeseen conditions. In addition, the results presented in this study can be used as a decision support tool for MSW management planners to analyze the state of the current waste management system and generate scenarios for future projections.
If the input and output variables are identified well, machine learning approaches can give a good projection about the waste generation and this projection can be utilized for different countries. Furthermore, the developing countries with missing data can develop more realistic strategies for MSW management by not relying solely on international databases such as Eurostat to forecast MSW generation.
Footnotes
Author Disclosure Statement
No competing financial interests exist.
Funding Information
The author received no financial support for the research, authorship, and/or publication of this article.