
Abstract
This article describes the development and evaluation of a novel piped-water treatment system, which combines centralized and point-of-use components. Such system is able to provide potable tap water to all the households in a rural community in Chiapas, Mexico, at a relatively low capital and operating cost. Our system consists of centralized filtration and chlorination, as well as household-level dechlorination and safe storage. This arrangement allows for a chlorine residual to be maintained through the distribution network while avoiding potential discontent from users associated with chlorine taste and odor in the water. It also eases the operator's job and widens the safe chlorine dosing margin, thus increasing water safety and sustainability. We conducted a water quality assessment for the system, including measurements of turbidity, chlorine concentration and removal, disinfection by-products, and microbiological quality, with satisfactory results. The main objectives of improving water quality, maintaining a chlorine residual, and avoiding taste and odor issues for users were achieved. As such we consider this pilot to be successful as a proof of concept with potential to be replicated in the future.
Introduction
Despite the recognition of access to drinking water and sanitation as a human right (United Nations General Assembly, 2011), about 800 million people around the world still lack access to basic water services leading to thousands of preventable deaths on a daily basis, as well as many days of well-being, school, and productivity lost due to sickness (Prüss-Ustün et al., 2014; WHO and UNICEF, 2017). Unsurprisingly, the bulk of the mortality and morbidity associated with water-related illnesses (as is the case with most easily preventable diseases) falls on the poorest countries overall and the marginalized (e.g., lower income, rural, indigenous) populations within each country (WHO and UNICEF, 2017).
In Mexico specifically, the National Water Authority (CONAGUA) reports that ∼92% of the population has access to potable water, with 97% of that water being disinfected (Comisión Nacional del Agua, 2015). However, a study conducted in 300 rural communities with piped-water systems showed that less than 20% of drinking water samples had been properly chlorinated and over 40% tested positive for Escherichia coli (Camacho-Galván and Reygadas Robles Gil, 2019). The latter figures are more consistent with the Joint Monitoring Program reports indicating that only 43% of the Mexican population (probably less for rural areas) have access to safely managed drinking water systems that are free from contamination (UNICEF and WHO, 2019).
While water access has improved in many communities, microbiological contamination continues to be the main challenge to achieving safe drinking water for all, especially in small and community water systems in both developing and so-called developed countries (National Research Council, 1997; Semenza et al., 1998; Sobsey, 2002; US EPA, 2004; Hunter et al., 2010b; Onda et al., 2012; UNICEF and WHO, 2019). This can be explained, in part, by the fact that while the science and technology for water treatment are very well developed, they do not reach every population equally. For example, while chlorination is an established and widely proven disinfection method (Bruchet and Duguet, 2004; Ngwenya et al., 2013; WHO, 2017), small-scale community water systems often lack automation or sophisticated dosing and monitoring equipment for chlorine addition (National Research Council, 1997; Gadgil, 1998; Pickering et al., 2019).
This makes it difficult to achieve proper disinfection and the required residual levels at each household, while avoiding issues with chlorine taste and odor in the population. Such issues may undermine the acceptability requirement for compliance with the human right to water (OHCHR, 2010). This is particularly true in communities that are not accustomed to using chlorine and are therefore more susceptible to its taste, with odor/taste thresholds as low as 0.05 mg/L (Bruchet and Duguet, 2004), or that feel distrust for the introduction of chemicals to their water for cultural and historical reasons (Diezmo Ruiz, 2018; Guzmán Girón and Mostafa, 2020). This in turn compromises the sustainability or effectiveness of treatment as it may lead to chlorination being reduced or stopped altogether at the community level, or the use of alternative, less safe water sources by individual households (Rydbeck and Vander Plas, 2010; WHO, 2017).
Water treatment in rural communities
Recognizing that conventional drinking water treatment utilized in larger urban contexts may not be appropriate for rural or low-income communities, more suitable alternatives have been and continue to be developed and tested (Skinner, 2001; Montgomery and Elimelech, 2007; Smyth, 2011; Pickering et al., 2015, 2019; Amin et al., 2016; Brooks et al., 2018) providing more options to communities, government agencies, and other organizations to better serve a wider range of contexts (Hunter et al., 2010a; González Rivas et al., 2014; Mihelcic et al., 2017). Technologies are usually classified based on the scale or level at which the water is treated, including centralized or community-level, point-of-entry, and point-of-use (POU) systems, each presenting advantages and disadvantages in terms of treatment efficiency as well as the social dimensions to ensure proper and sustained use, maintenance, and monitoring.
POU systems are widely used and there is evidence of their potential positive impacts (Fewtrell et al., 2005; Clasen et al., 2006; Arnold and Colford, 2007; Sobsey et al., 2008); yet, their scalability and actual health impacts are still being debated (Hunter, 2009; Schmidt and Cairncross, 2009; Clasen et al., 2009, 2015). A major advantage of POU systems is that they treat water closer to the moment and point of consumption, which reduces the risk of (re)contamination during transport and storage (Sobsey, 2002; Fewtrell et al., 2005; Montgomery and Elimelech, 2007; UNICEF and WHO, 2019). These systems treat only the water used for consumption and few other domestic uses, which can extend the life of certain systems, such as filters. However, exposure and consumption of unsafe water remain a risk since not all the water in the home is treated (Sobsey et al., 2008). Such systems generally rely on the individual household for proper operation and maintenance, which may increase the cost and work burden for users and variability of the water quality provided (Sobsey et al., 2008). As such, most POU solutions face issues related to proper and sustained use over the long term (Sobsey et al., 2008; Brown and Clasen, 2012; Enger et al., 2013).
On the contrary, centralized treatment systems may benefit from economies of scale, which could significantly lower the cost of providing treated water and minimizing the additional efforts and behavior change required of individuals to obtain it (Pickering et al., 2015). Treated water piped to every house or public standpipes in their vicinity significantly improves the access to safe water for drinking and other uses, resulting in up to 75% reduction in the risk of diarrhea compared with unimproved sources (Fewtrell et al., 2005; Waddington et al., 2009; Wolf et al., 2018). Yet, the limited number of studies and variability in results calls for further research into safe piped-water interventions (Clasen et al., 2015). Furthermore, while piped water may show better quality overall compared with other sources (UNICEF and WHO, 2019), there is no guarantee of proper treatment; and untreated piped water may actually show lower quality at the point of consumption than other improved sources (Bain et al., 2014). This brings attention to drawbacks associated with these types of systems, including that they require more resources and higher degrees of institutional and technical capacity or community organization than POU systems to function properly and sustainably (Mintz et al., 2001; Montgomery and Elimelech, 2007; Hunter et al., 2010a; González Rivas et al., 2014; Hutchings et al., 2015; Rayner et al., 2016). Intermittency and lack of reliability of water supplies common in many developing and rural settings make effective treatment and delivery of safe water more difficult (Kumpel and Nelson, 2013; Erickson et al., 2017). This in turn can seriously undermine the health impacts of water treatment interventions even through sporadic exposure to contaminated water (Hunter et al., 2009).
This article describes the development and results derived from the implementation of a community-level, piped-water treatment system that combines centralized and POU (C-POU) treatment components to provide drinking water to every household in the community. This treatment system was designed to be compatible with the existing rural piped-water infrastructure found throughout Mexico, with the goal of serving as a model to be replicated as a retrofit to existing systems or incorporated into the design of new piped-water projects. The system components are described below followed by the water quality and user satisfaction assessment conducted to demonstrate that the goal of providing drinking water at a relatively low capital and operating cost can be achieved. Other considerations for future implementation related to cost, community management, and lessons learned are further discussed in the Supplementary Data.
System Description and Methods
Community context and system components
The C-POU water treatment system was implemented in a community in the municipality of Pantelhó, located in the highlands of Chiapas, Mexico. This rural and predominantly indigenous community (belonging to the Tseltal and Tsotsil cultures) has a population of 115 people and is classified as highly marginalized (INEGI, 2010). There is some knowledge of the health risks related to drinking untreated water, and local health agencies promote hygiene practices and boiling or at-home chlorination for treating water. This vision coexists with traditional ways of knowledge where health and disease are more closely associated with emotional states. As such, at-home treatment is not always practiced or prioritized (Diezmo Ruiz, 2018).
The community has a piped-water system that was financed by CONAGUA as part of a program to improve access to drinking water in numerous rural communities in Mexico. The original system consists of a catchment at the source (spring), piping to a storage tank, and a gravity-driven distribution network to individual households or premises, but no treatment. The C-POU treatment system was retrofitted to the existing water infrastructure and consists of centralized filtration and chlorination complemented by household-level dechlorination and safe storage (Figs. 1 and 2). The three components added as part of this intervention are as follows:
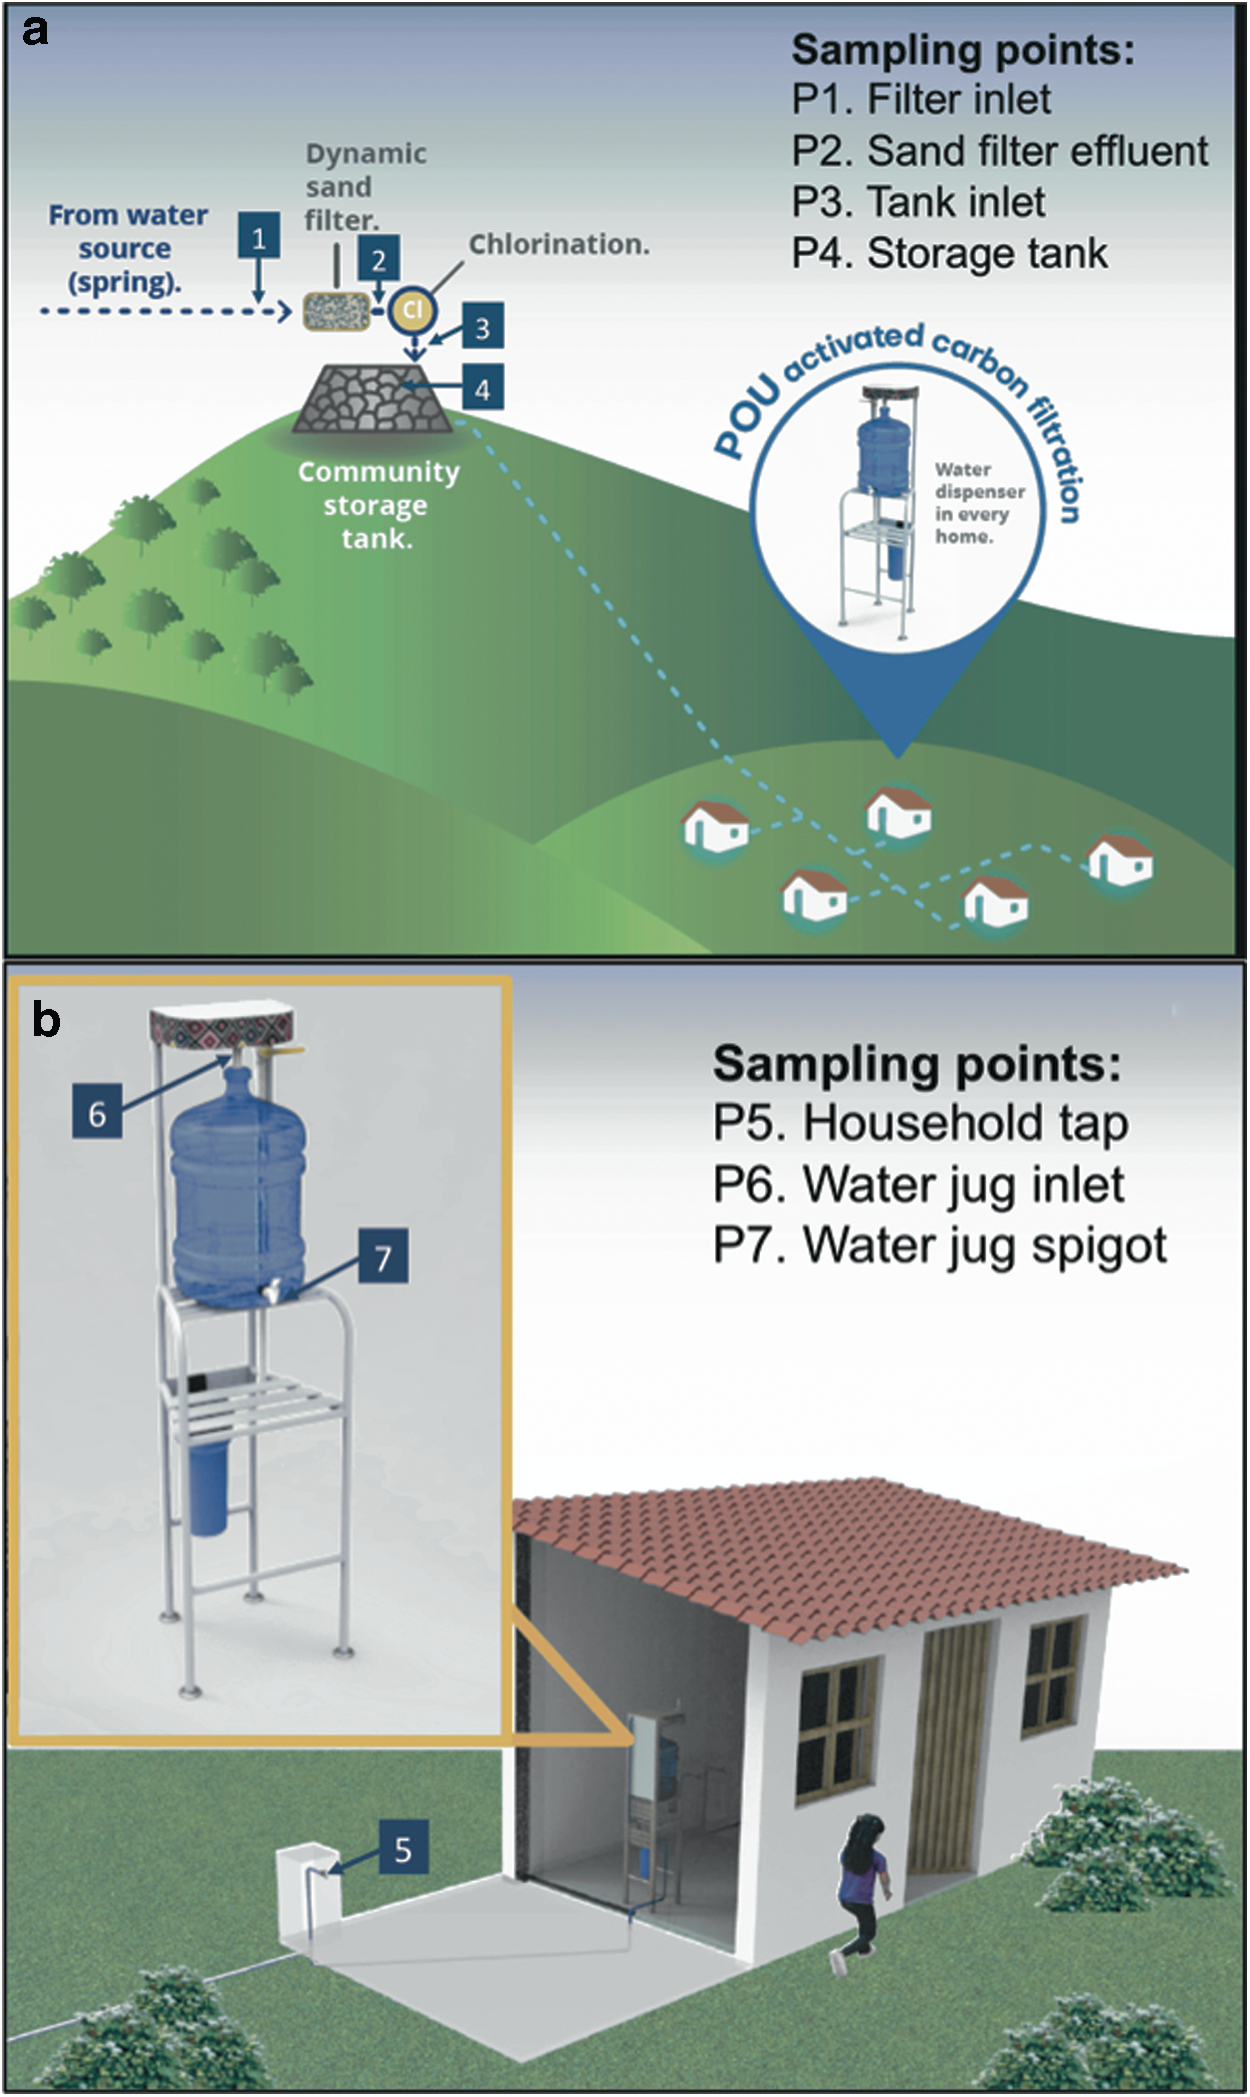
Illustration of the community water system with C-POU treatment and sampling locations
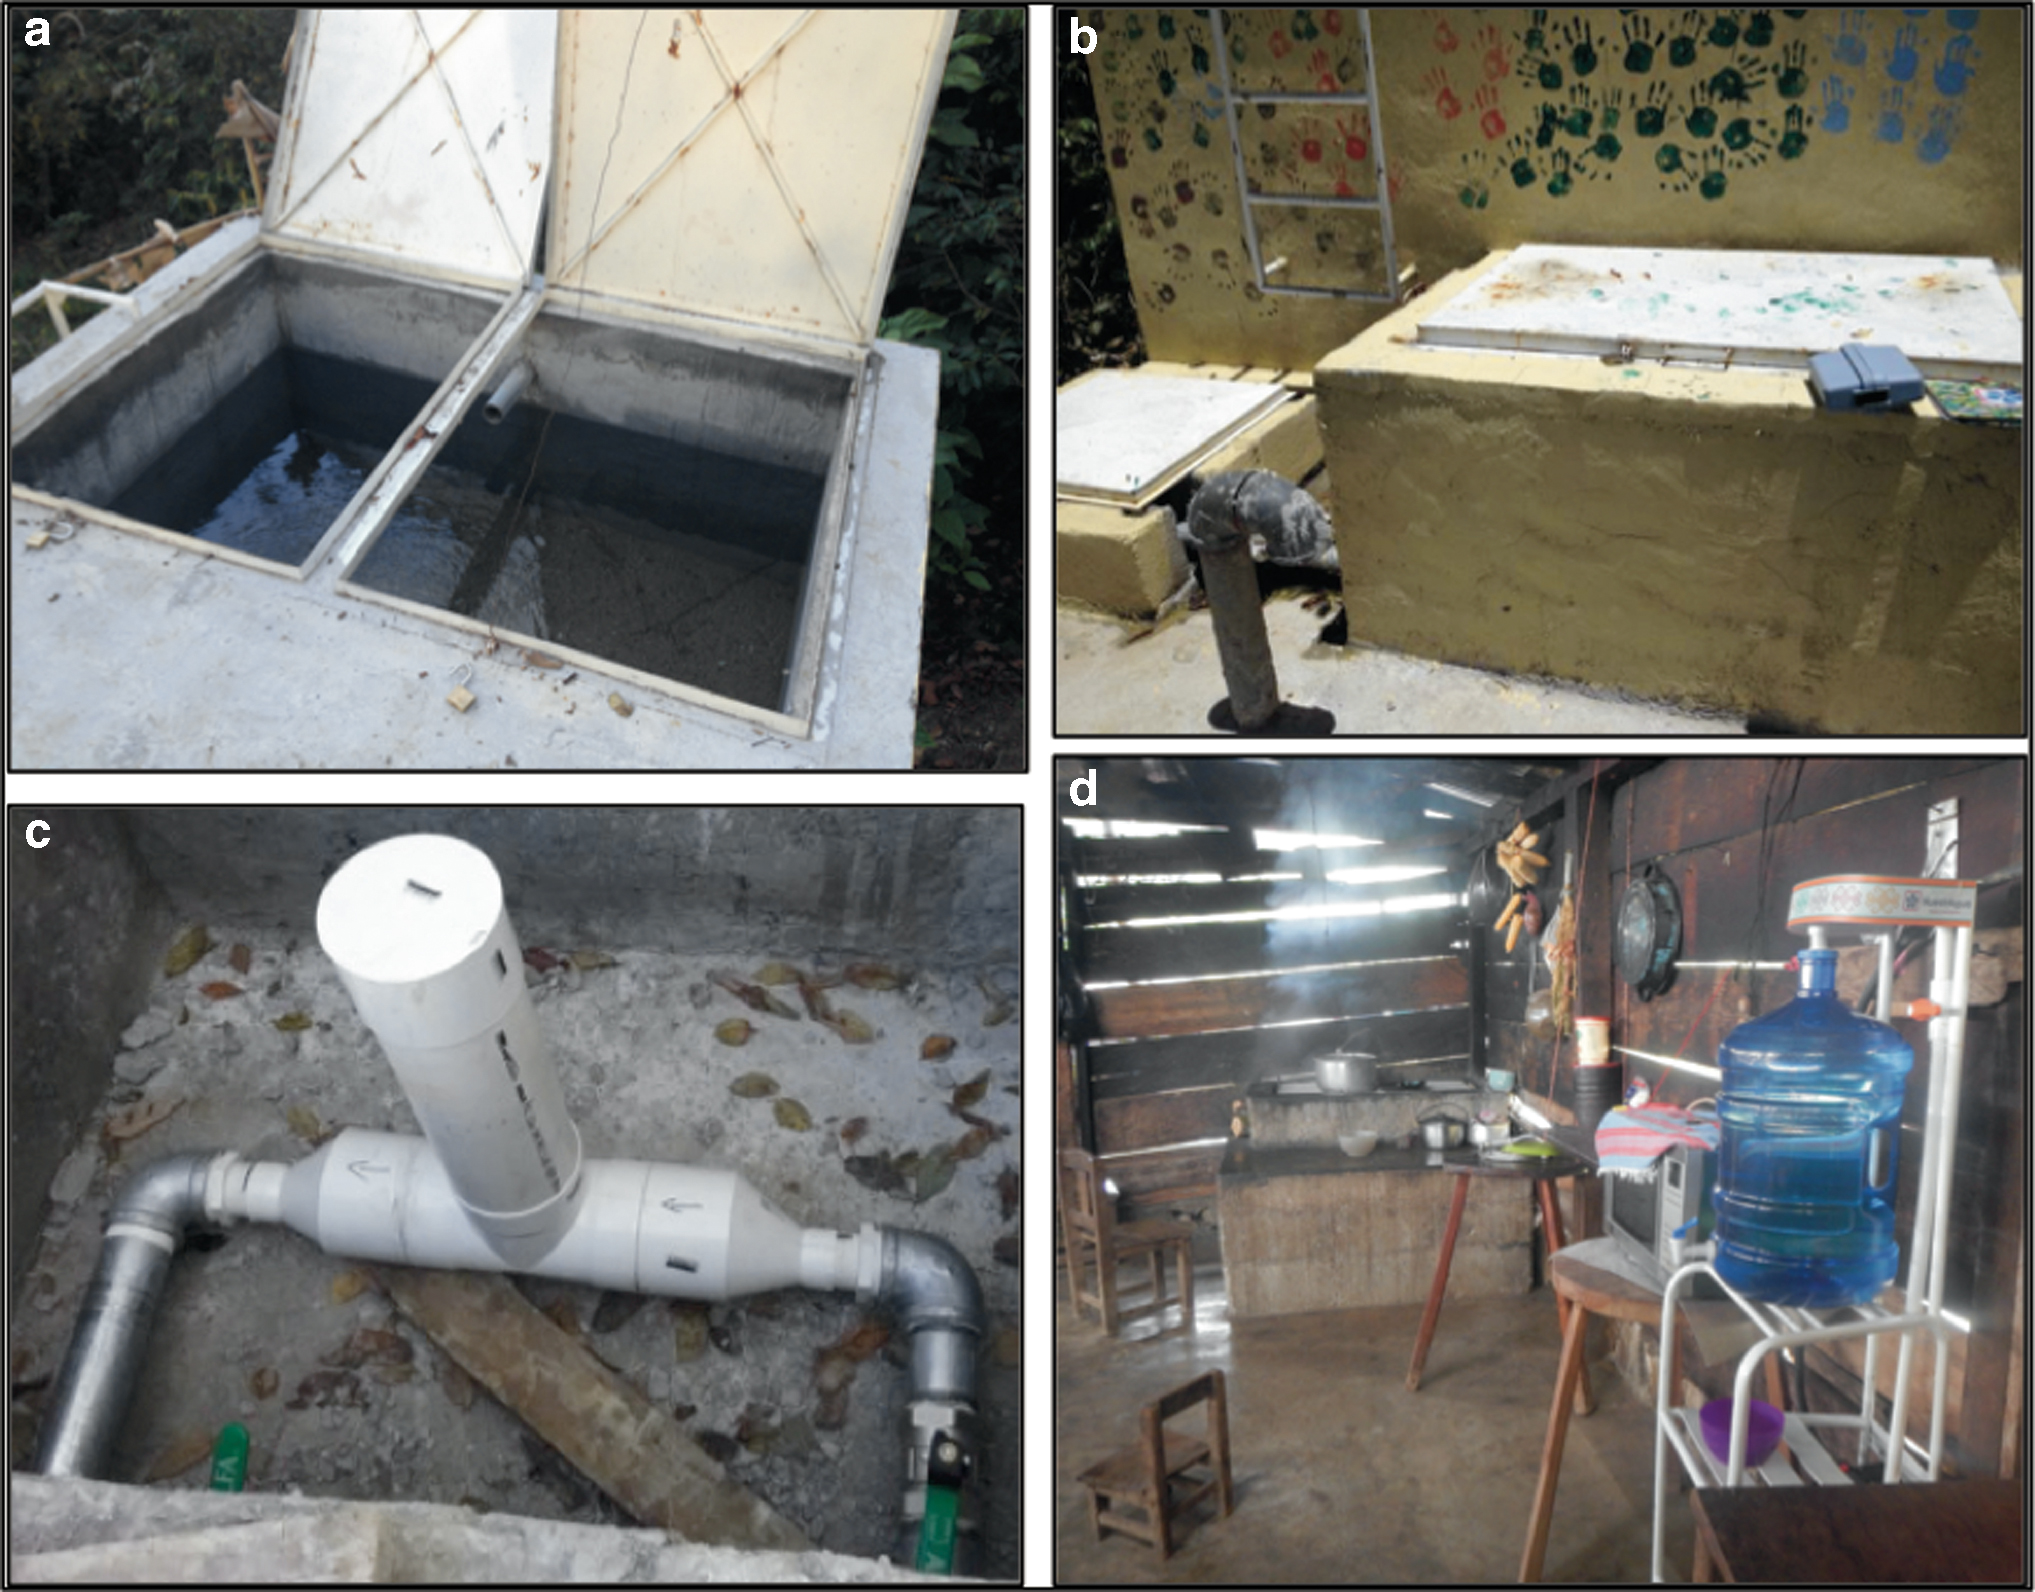
Pictures of the C-POU system, including
Dynamic Sand Filtration: Filtration of the raw water is carried out in a dynamic sand filter located before the storage tank. The purpose of this filter is to reduce the turbidity of the raw water, which was at times found to be above acceptable values during the water quality assessment. The surface area of the filter is 4 m2 and it consists of gravel (as a substrate) and sand layers of ∼20 and 70 cm, respectively. It is designed for a maximum flow rate of 133 L/min (at a filtration rate of 2 m/h) (Wegelin, 1996; Smet and van Wijk, 2002; PAHO, 2005).
Centralized Chlorination: The filtered water passes through a passive, contact chlorination system built on-site following the specifications of the CTI 8 Chlorinator designed by Compatible Technology International (EOS International, n.d.; Jacob and Taflin, n.d.). This system makes use of solid trichlor (trichloroisocyanuric acid, C3Cl3N3O3) tablets to introduce Cl into the flowing water. The degree of contact with the tablets can be adjusted to deliver the desired Cl dose and does not require electricity or any other equipment to operate. However, frequent monitoring of the Cl dose being delivered is critical to ensure proper operation.
The chlorinated water enters the community holding tank with a volume of 30,000 L, which provides storage and increases chlorine contact time (although not baffled or stirred). It is then delivered by gravity to each household (or house premises) through a closed, galvanized-pipe distribution network. Since the water is chlorinated at a centralized location (as opposed to the POU), all the water distributed has been filtered and disinfected, thus lowering the overall availability of and exposure to untreated water throughout the community.
Dechlorination and storage: The centralized treatment is complemented with a dechlorination and safe storage module at each household (typically located in or near the kitchen). The modules are equipped with a granular activated carbon (GAC) filter with a 2.5″ D × 10″ L refillable cartridge. These filters are integrated into a module where a water jug is filled to store the filtered water (Figs. 1b and 2d). The jug has a spigot that allows the water to be taken directly without having to move or open the water jug. The purpose of dechlorinating at the point of use is to allow for a chlorine residual to be maintained throughout the distribution pipe network, which would not be possible with centralized dechlorination. Furthermore, activated carbon lifetime is increased significantly by dechlorinating only water used for those purposes where taste and odor issues are most critical, such as drinking and cooking, while other taps in the household are not dechlorinated.
An important role of this filter is to provide a safety margin for operators where chlorine dosing can be increased to ensure disinfection under varying conditions, while avoiding the common aversion caused by Cl taste and odor. As such, this system can enhance both safety and sustainability of rural water systems by easing operation and reducing potential hurdles to disinfection (Arnold and Colford, 2007; Kearns et al., 2015). In addition, the GAC filters provide protection against other organic contaminants potentially present in the water, including disinfection by-products (DBPs) and pesticides, among others (Hopman et al., 1994; Lantagne, 2001; Schwarzenbach et al., 2006; Kim and Kang, 2008; Jusoh et al., 2014; Kearns et al., 2014; Benstöm et al., 2017).
Finally, the water jug provides safe storage and improves hygiene (particularly important at this stage since the water has been dechlorinated) by providing access to the stored water without the use of open containers, thus lowering the risk of recontamination (Roberts et al., 2001; Ercumen et al., 2015; UNICEF and WHO, 2019). Safe household storage (up to 20 L) can also be useful in cases where supply is inconsistent and it allows for the flow rate through the GAC filter to be adjusted without limiting water supply rate at the moment of use.
Community management and implementation
All stages of implementation of the water treatment system were performed with the consent and collaboration of the community, and gatherings were held throughout the process to consult, inform, and coordinate activities, in accordance with local customs. As part of the agreement, Cántaro Azul provided material and technical support for the construction of the system. It also provided training for its operation and management, among other support activities to enhance awareness, participation, and ownership of the project. The community provided its labor, an area for construction of the system, and commitment to operate and manage the system after implementation.
In November 2016, a participatory water quality and infrastructure assessment was performed and construction of the water treatment system began the following month. The system was completed with the installation of the household modules and operation began on February 2017, with further adjustments, training, and trouble-shooting taking place over the following 3 months.
System performance and water quality
Evaluation of the water treatment system was performed over the 6-month study period (June–December 2017) to ensure proper operation and delivery of drinking water considered safe according to national norms and international standards (NOM, 2000; WHO, 2011). Water samples were collected from seven monitoring locations during weekly visits. Locations 1–4 are situated in the centralized water treatment system, while locations 5–7 are found in the homes where the POU components of the treatment system are installed. For the latter, samples were taken from five homes each week, including those closest and farthest from the centralized water treatment system (located 81 and 307 m away, respectively), and three which were selected at random for each sampling visit. Sampling points are listed in Table 1 and shown in Fig. 1.
Sampling Points Monitored During System Evaluation
GAC, granular activated carbon; POU, point-of-use.
Turbidity was measured in the field at locations P1 and P2 (raw and filtered water) using a Hach DR 900 Colorimeter. Results are reported in formazin attenuation units and compared with the Mexican standard of <5 NTU (NOM, 2000) and the WHO's recommendation of <1 NTU (WHO, 2011) for drinking water. While these units are not equivalent under all conditions, values of 5 and 1 FAU were taken as a reference for compliance. Free chlorine (hypochlorous acid and hypochlorite ion) concentrations were measured at sampling points 3–7 using the N,N-diethyl-p-phenylenediamine method with a Hach DR 900 Colorimeter (estimated detection limit = 0.02 mg/L free Cl). The efficiency of the activated carbon filters was calculated based on the percent removal of chlorine between points 5 and 6 (before and after GAC filters in the household), and excluding instances in which concentrations at P6 were greater than P5 as they indicate likely erroneous measurements. Color was measured with a Hanna Checker HI727. Samples were not filtered before measuring color, and so, these results represent apparent color. UV absorbance at 254 nm was measured in the laboratory with an Ultrospec III UV/Vis spectrophotometer. Temperature and pH were measured in the field with an Extech EC500 Waterproof ExStik II probe. Flow rates were measured at the filter and tank inlets using the bucket method (Hudson, 1993), by measuring the time necessary to fill up a 9-L container. Turbidity, color, and flow rate measurements were conducted in triplicates and averaged for further analysis.
Total coliform bacteria (TC) are widely present in the environment and serve as a good indicator of the efficacy of disinfection processes, while E. coli are a subgroup of these and serve as indicator organisms for fecal contamination. The concentration of TC and E. coli were determined using the Colilert Quantitray system. Samples were collected in the field in sterile containers and processed within 12 h. The results obtained represent the most probable number of bacteria present in 100 mL of sample (MPN/100 mL) and range from <1 to >200.5 MPN/100 mL. The 95% confidence limit for the former is 0–3.7 MPN/100 mL and 146.1-infinite MPN/100 mL for the latter. For illustration purposes, they are represented in the figures as 0 and 201 MPN/100 mL, respectively. Total trihalomethane (TTHM) concentrations were measured for samples collected at points 5 and 7. The analyses were conducted at certified laboratories (Microlab Industrial), using the EPA 524.2 method (Munch, 1995).
Surveys (n = 50) were also conducted every two weeks during household visits to establish whether a chlorine taste/odor were detected as well as to better understand the patterns of use of the water module by community members. Data processing was conducted using Microsoft Excel for Mac 2011 and results are considered statistically significant with 90% confidence when the paired t-test (lower tailed) resulted in a p-value of <0.1.
Results and Discussion
Sand filter performance
Summary statistics of water quality parameters measured during the study and described below are shown in Table 2. Measurements showed that turbidity was reduced in most cases, although the filter was generally not greatly challenged (Fig. 3). All filter effluent samples had turbidity values below the reference value of 5 FAU, while 82% of samples had turbidity at or below the stricter standard of 1 FAU, compared with 95% and 57% respectively, for the influent raw water samples. The average raw water turbidity was reduced from 1.3 to 0.8 FAU after sand filtration, and such reduction was statistically significant. All filter effluent samples presented (apparent) color values within the national norm (<20 Platinum-Cobalt units). Absorbance was reduced after filtration by a statistically but not practically significant amount.

Distribution of turbidity values for raw water (P1) and dynamic sand filter effluent (P2), including the overall median (central line), the 25th and 75th quartiles (box), and extreme values (whiskers), excluding outliers (crosses).
Summary Statistics of Water Quality Parameters Taken at Different Locations, Including Average, Standard Deviation, Minimum and Maximum Values (min–max), and Number of Samples (n)
The p-value is included when the paired t-test was conducted for samples taken at two different locations.
CPU, Platinum-Cobalt units; FAU, formazin attenuation units; SD, standard deviation.
The average raw water flow rate into the filter was 23.9 ± 5.1 L/min, and there was no statistically significant difference to the effluent flow rate during normal operation. Such flow rate represents a supply of ∼299 L/person-day to the community and is sufficient to meet its water demand. The range of pH values in the filter effluent was 6.3–7.9 and temperatures of 17.0–29.6°C, all in compliance with the national norm for drinking water.
Chlorination
The performance of the system was evaluated with respect to its capacity to (1) chlorinate consistently at the centralized location to ensure disinfection, (2) maintain a chlorine residual of at least 0.2 mg/L free Cl in every household, in accordance with the national norm (NOM, 2000), and (3) reduce the chlorine concentration at the household level. This level should ideally drop below the taste threshold (which could be as low as 0.05 mg/L) (Bruchet and Duguet, 2004), to ensure acceptability by members of the community.
To address the first point, we measured chlorination at the tank inlet (P3), and the distribution of concentrations found is shown in Fig. 4, with a median value of 0.42 mg/L, and 25 and 75 percentile values of 0.36 and 0.48 mg/L, respectively. It must be noted that we excluded from this analysis those days when there was no water flowing into the tank or the chlorinator was not operating, that is, either water not passing through it or there were no chlorine tablets in the contactor. While these are operational and management issues that must be addressed, they were excluded to better assess the system's performance under normal operating conditions. Overall, the chlorinator serves its purpose of providing an adjustable dose while being relatively easy to operate and without the use of electricity.

Distribution of free chlorine concentration at the tank inlet (P3), within the tank (P4), at a household tap before AC filtration (P5), after AC filtration at the water jug inlet (P6), and from the water jug at the house (P7), including the overall median (central line) and 25th and 75th quartiles (box), and extreme values (whiskers) excluding outliers (crosses).
The concentrations within the tank (P4) are somewhat lower than at P3 with a median of 0.38 mg/L of free Cl, and 25 and 75 percentile values of 0.26 and 0.42 mg/L, respectively (Fig. 4). This is likely due to the chlorine demand and some volatilization taking place. Losses appear to be very small through the distribution network as no significant difference is observed between tank and household tap (P5) samples. The latter were taken before passing through the GAC filters and represent the water that would be available at any tap in the household that is not connected to the module. These samples showed a median value for free chlorine of 0.32 mg/L (with 0.20 and 0.42 mg/L for the 25 and 75 percentile values, respectively). A total of 71.2% of samples comply with the minimum required residual level of 0.2 mg/L free Cl at every tap. None of the measured samples exceeded the maximum residual concentration allowed of 1.5 mg/L free Cl.
Another useful parameter to assess disinfection performance is the (concentration × time) CT value, for which the Mexican norm does not establish a minimum. However, as a useful guidance, the U.S. EPA estimates that the free chlorine CT required to achieve 4-log removal of viruses under the conditions observed (pH 6.9–8.0, temperature 18.1–30.8°C) would be 3 mg/L-min (US EPA, 2003). For this system, the minimum effective contact time in the tank is expected to be 78.9 min, considering a baffling factor of 0.2 (for the unbaffled tank), operating at least at 50% storage capacity, and not considering the contact time in the pipes. The 25 percentile of Cl concentration at the tap is 0.19 mg/L and was used as a conservative estimate of the concentration in the tank. This provides an estimated CT of 15 mg/L-min or higher for this system, during normal operating conditions. This is considerably higher than the U.S. EPA requirements and equivalent to the WHO recommendation of a minimum contact time of 30 min with a free chlorine residual of 0.5 mg/L (resulting in a CT of 15 mg/L-min) for household disinfection (WHO, 2011).
From the analysis of Cl concentration at the tap (P5), shown in Fig. 5, we observe two types of variation, namely spatial and temporal. Spatial variation can be observed by the difference in Cl concentration at different points within the distribution network on a given day and is in the order of 0.2 mg/L. Such variation may be related to the amount of time the water spends in the pipes due to distance from the tank and volume used, as well as leaks and other variations within the system (Kumpel and Nelson, 2014). A more significant variation is observed between samples taken on different days. These changes can be due to variations in the operation of the system, for example, the amount of water flowing compared with how much chlorine there is in the contactor, as well as the incoming water quality, and thus Cl demand (Levy et al., 2014).

Free chlorine concentration at the household tap (P5) before AC filter, and from water jug spigot (P7) after granular activated carbon filtration, taken at different locations (including houses nearest and farthest from storage tank) July–December 2017.
Samples taken at P6 represent the water that has passed through the GAC filter and fills the water jug in each house. The free Cl removal efficiency of the GAC filters was 89.6% ± 4.8% (95% confidence interval), resulting in a median value of 0.02 mg/L with 0 and 0.04 mg/L free Cl at the 25 and 75 percentile levels, respectively. As expected, water samples from the jugs (P7) show a similarly low-concentration range as P6 (Fig. 4). The Cl removal efficiency of the activated carbon was maintained through the 6-month monitoring period, and so, the lifetime of this filtration medium was not ultimately determined but was shown to be greater than 6 months under these conditions.
This demonstrates one of the key expected functions of this setup, namely an ability to reduce the Cl concentration at the POU despite the spatial and temporal variations observed (Figs. 4 and 5), thus maintaining a safe residual throughout the distribution network without affecting taste and odor for the users. This in turn simplifies the job of the operators by giving them a wider range for dosing, without worrying about complaints from their fellow community members, or the need for sophisticated or very precise dosing instruments.
In addition, TTHM concentrations were below the detection limit (<0.012 mg/L) in all instances. This indicates that the formation of these DBPs is not a great concern in this system and improving microbiological water quality should be prioritized.
Microbiological water quality
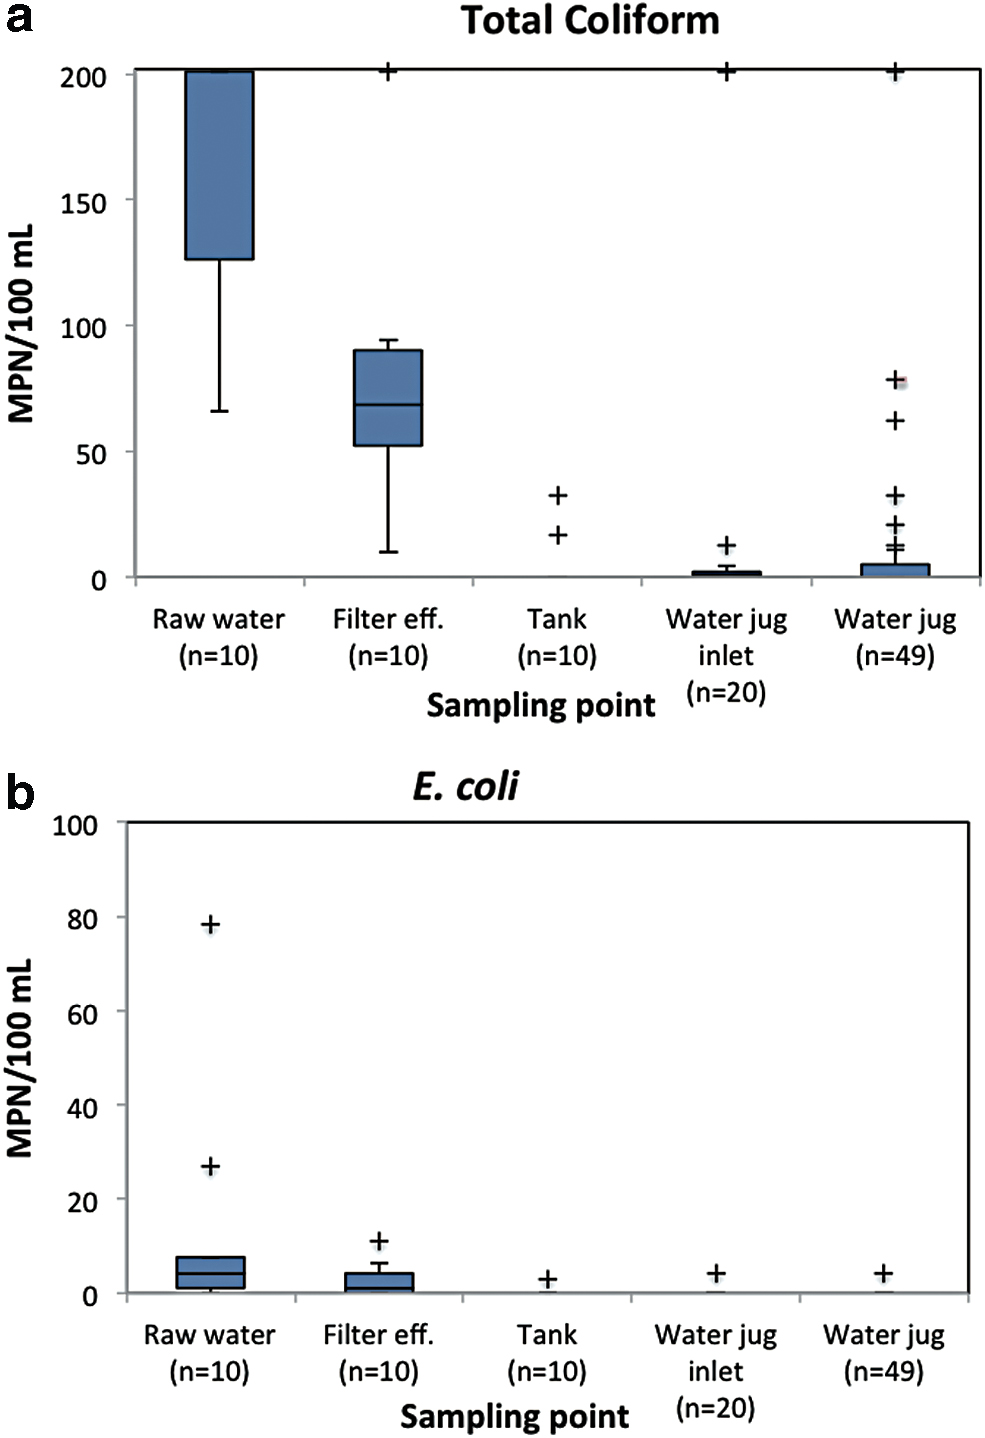
Mexican regulations require both TC and E. coli to be absent in a 100-mL volume of drinking water (NOM, 2000). Based on this standard, none of the raw water samples is in compliance for drinking water quality since TC are present in all of them, with a median of >200.5 MPN/100 mL, while 80% show a presence of E. coli. After filtration, TC are still found in every sample, but the median concentration drops to 68.7 MPN/100 mL. Through disinfection and safe storage, the TC presence drops to 43% (median of 0 MPN/100 mL) and E. coli are found in only 2% of samples at P7. This represents a significant improvement in water quality, particularly considering the low concentrations of TC and E. coli present at the point of use.
Figure 6a and b shows the concentration of TC and E. coli at the different sampling locations. The pattern observed, where TC are greatly reduced after chlorination with some resurgence at the water jug outlet, points to possible recontamination during storage. However, the fact that a similar pattern is not observed for E. coli indicates that such contamination is not likely to be of fecal origin. Nonetheless, it points to the need for proper hygiene of water jugs, especially considering that the water stored, although safely contained, has been dechlorinated and is therefore more susceptible to recontamination.
Distribution of the concentration of
Further analysis was conducted using the World Health Organization risk classification scheme (WHO, 2011). These guidelines maintain the goal of 0 CFU/100 mL of sample for both TC and E. coli, while samples showing 1–10 CFU/100 mL can be considered “low risk,” 10–100 CFU/100 mL “intermediate risk,” 100–1,000 CFU/100 mL “high risk,” and >1,000 CFU/100 mL “very high risk.” The latter two categories cannot be differentiated with our methods, so they are grouped into the “high/very high-risk” category with bacterial concentrations of >100 CFU/100 mL. Figure 7a and b shows the relative risk of samples obtained in the raw water and treated (and stored) water samples, based on the concentration of TC and E. coli.
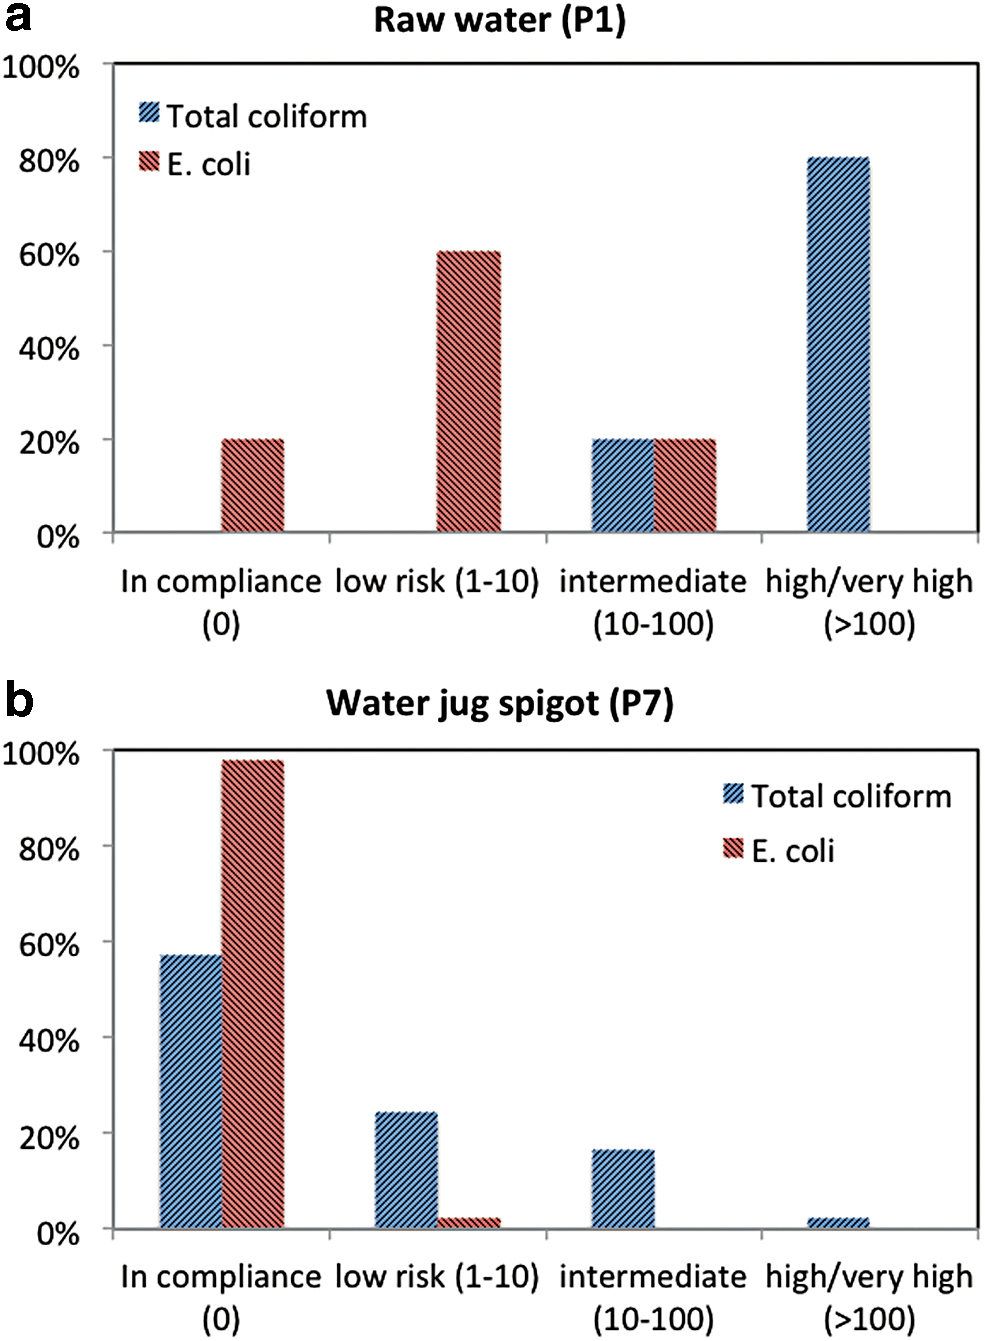
Percentage of samples within each risk category according to the WHO classification, for
Looking at the concentration of TC, most raw water samples (80%) present high/very high-risk levels with smaller percentages at lower risk levels, and none being in compliance with guidelines (0 CFU/100 mL). On the contrary, the majority of samples in the jug (57%) are in compliance, with decreasing proportions of higher levels of risk. E. coli are present in 80% of raw water samples, ranging from safe to intermediate risk, and the majority displaying low-risk levels. This risk is then reduced almost entirely after treatment and safe storage (2% E. coli presence). These results are consistent with the effectiveness of most POU chlorination interventions from a literature review showing an 80% reduction in the proportion of stored samples with E. coli contamination (Arnold and Colford, 2007). They also compare well with results obtained by Pickering et al. (2015) where E. coli presence is also significantly reduced from 75% of raw water samples to 17% and 22% of household stored samples using Aquatabs and in-line, passive chlorination, respectively.
Patterns of use and perception
Surveys indicate that people are using water from the household module consistently and self-report to wash the water jug every 2.9 ± 1 days on average. Ten percent of respondents claimed that the water in the jug had a smell or taste of chlorine the day they were surveyed, and in such cases, they all described the taste/smell as mild or small. All respondents detected a chlorine smell/taste with varying degrees of intensity at the tap water that was not filtered by activated carbon in the home.
Users also report that they prefer to take water from the jug for drinking and cooking, since these uses would expose them to the Cl taste/odor otherwise. On the contrary, they use the tap water for washing (dishes, clothes, beans, coffee, etc.), personal hygiene, and preparing nixtamal (used to make corn tortillas). Such differentiated use helps reduce taste/odor issues and the Cl residual can in fact have a positive effect for washing dishes, vegetables, and so on as it would improve its disinfection. It must be noted, however, that a good understanding of the acceptability of varying levels of chlorine for nonconsumption uses in the home is still lacking.
Community management considerations
While sustained use of POU technologies depends on behavior change by the individual households, community-level systems require broader agreements and organization by community members, and possibly external support, to properly maintain the system in the long term (Pickering et al., 2015). One issue that emerged during this intervention was that some families did not want to participate in the project (mostly due to internal community disputes), and did not have a household module. Thus, complaints would emerge occasionally from these families that did not have access to dechlorinated water in their homes. The issue was later addressed and activated carbon filters were installed in the remaining households in the community. Yet, this experience highlights the importance of full community participation to improve the sustainability of WaSH interventions.
The cost of materials for the implementation of this C-POU pilot was approximately MXN$ 89,500 (US$4317, in 2017), resulting in approximately MXN$778 (US$37.5) per capita, and would be expected to decrease by economies of scale and design optimization, if replicated. The operation of the system consists of adding chlorine tablets when needed, replacing the GAC when spent, and cleaning the sand filter periodically. The material cost associated with these tasks is estimated to be approximately MXN$10 ($0.50 USD) per household per month, not considering a possible salary for operators or savings for major repairs. For comparison, this is the approximate cost of a 2-L bottle of Coca-Cola, which is unfortunately consumed at very high rates in this region (even replacing water and other traditional drinks) and contributing to the high mortality rates due to diabetes, childhood obesity, and other health conditions observed in the local population (Lopez and Jacobs, 2018; Page Pliego, 2019).
Conclusions
Overall, the results of the pilot study were satisfactory as a proof of concept for a hybrid centralized-POU community treatment system, both in terms of water quality and user satisfaction. It provides the benefits of centralized components for filtration and disinfection, including economies of scale, reduced variability in treatment processes, and lowering the exposure to untreated water in the distribution network. On the other hand, POU units allow for optimization of resources (e.g., extending the activated carbon lifetime), maintaining a chlorine residual through the distribution network without taste/odor issues (thus improving disinfection while easing the operator's job), and providing safe and convenient storage in the home.
The sand filter provided some improvements by decreasing turbidity. The chlorinator performed well as long as normal monitoring and operation were conducted (including replenishing chlorine tablets as needed), maintaining a median concentration of 0.42 mg/L at the storage tank inlet. Furthermore, 71.2% of household tap samples were in compliance with the Mexican norm requiring a free chlorine residual of ≥0.2 mg/L through the distribution network, and with no detectable TTHM levels. The Cl concentration was significantly reduced before reaching the safe storage container, with no detectable chlorine taste/odor for users in 90% of instances.
Microbial concentrations were significantly reduced through the treatment process and safe household storage. TC were present in 100% of raw water samples, all in the intermediate to high/very high-risk category, while 82% of samples in the water jugs were either in compliance or at the low-risk level. When present, such microbial contamination is unlikely to be of fecal origin since E. coli were only found in 2% of water jugs (compared with 80% of raw water samples).
Of course, while technologies such as the one presented here will continue to emerge, communities and individuals with their own needs, beliefs, and aspirations are at the heart of every health and “development” intervention. Thus, any solution presented is only relevant with regard to how compatible it is with the specific cultural, environmental, economic, and institutional realities of the context for which it is proposed. It is our hope that new appropriate technologies and community management models that are compatible with traditional wisdom and ways of life continue to emerge. This should help address profound, historical inequalities in the realization of human rights, including water and sanitation, in traditionally marginalized communities.
Footnotes
Acknowledgments
We gratefully recognize the contributions of our colleagues at Cántaro Azul, particularly Sinead Alina Keogh, José Alonso Guzmán Girón, Beatriz Hernández López, and Mariano Ruiz Gómez, for the realization of this study. We are also thankful to the community members, authorities, and partners in the field who supported this project. Also, thanks to Lavida Kemeada Dotanto.
Author Disclosure Statement
No competing financial interests exist.
Funding Information
This study was carried out thanks to funding from the W. K. Kellogg Foundation (project P3032497).
References
Supplementary Material
Please find the following supplemental material available below.
For Open Access articles published under a Creative Commons License, all supplemental material carries the same license as the article it is associated with.
For non-Open Access articles published, all supplemental material carries a non-exclusive license, and permission requests for re-use of supplemental material or any part of supplemental material shall be sent directly to the copyright owner as specified in the copyright notice associated with the article.