
Abstract
The injection of CO2 deep underground, i.e., geologic carbon sequestration, has attracted considerable attention for climate change mitigation. A reliable caprock for secure containment is essential, alongside strategies for sealing flow paths to prevent leaks. In this study, we explore ways in which reactions of CO2 with CaSiO3 can be used for targeted mineral precipitation and permeability control in situ. Previous work has suggested that certain CaSiO3 polymorphs can produce pore-filling precipitates that successfully inhibit flow, whereas others produce precipitates with little impact. In this work, a one-dimensional reactive transport model was developed for a centimeter-scale system to explore connections between the pore and continuum scale. The model considers four reactions involving CaSiO3, CaCO3, SiO2(am), and the crystalline calcium silicate hydrate (CCSH) tobermorite. A key feature is incorporation of microporosity, with an attempt to represent favorable volume expanding changes from CCSH precipitation in porous media. At 150°C and 1.1 MPa CO2, representing typical laboratory conditions, the model predicts significant permeability drop when reacting the pseudowollastonite CaSiO3 polymorph at elevated pH to produce CaCO3, SiO2(am), and tobermorite. The effect of increasing pH via by NaOH addition, which increases CO2 solubility, increases CaSiO3 dissolution, and supports tobermorite supersaturation. In contrast, reaction of the wollastonite polymorph results in CaCO3 and SiO2(am) formation, with limited permeability impact. Wollastonite's lower solubility and slower dissolution rate inhibits tobermorite formation. Simulation at the high pressures representative of deep subsurface field conditions (40°C and 7.5 MPa CO2) suggests that reaction of CaSiO3 with CO2 could reduce permeability and seal unwanted leakage pathways.
Introduction
Agrowing interest in deep subsurface environments for their importance in geologic CO2 storage has resulted in concerns regarding the migration of fluids into the environment (White et al., 2020). Sites of undesired fluid migration underground may include natural faults, fractures, or degraded areas associated with wellbores (Deng and Peters, 2019, 2020; Spokas et al., 2019). In geologic sequestration of CO2 deep underground, buoyant forces could allow CO2 to leak from its storage location and escape into the atmosphere, undermining the goal of permanently sequestering CO2 (Bohnhoff and Zoback, 2010; Bielicki et al., 2015, 2016; Deng et al., 2017). These risks highlight the need for approaches to seal leaks and control permeability and flow in the subsurface.
One possible solution for altering fluid flow in geologic CO2 reservoirs is through controlled mineral precipitation by the targeted delivery of calcium silicates. The topic of carbon mineralization by silicate dissolution with subsequent precipitation of carbonate minerals has been well studied and that research has provided valuable insights about the controlling mechanisms of these geochemical reactions (Jun et al., 2013; Zhao et al., 2013; Stack et al., 2014). However, these reactions have only recently been proposed in the context of subsurface technologies in support of induced precipitation for permeability control (Deng and Peters, 2019, 2020; Spokas et al., 2019). Our recent work has examined the feasibility of such targeted mineral precipitation by delivering calcium silicate particles headed for leakage sites to produce secondary minerals that occupy pore space and decrease permeability (Fig. 1) (Tao et al., 2016; Plattenberger et al., 2019, 2020). Physical properties of the particles, including size, microporosity, and the use of polymer coatings (Lee et al., 2007; Plattenberger et al., 2020), can be engineered to control buoyancy, the extent of vertical migration during injection, and the temperature at which the reactions begin.
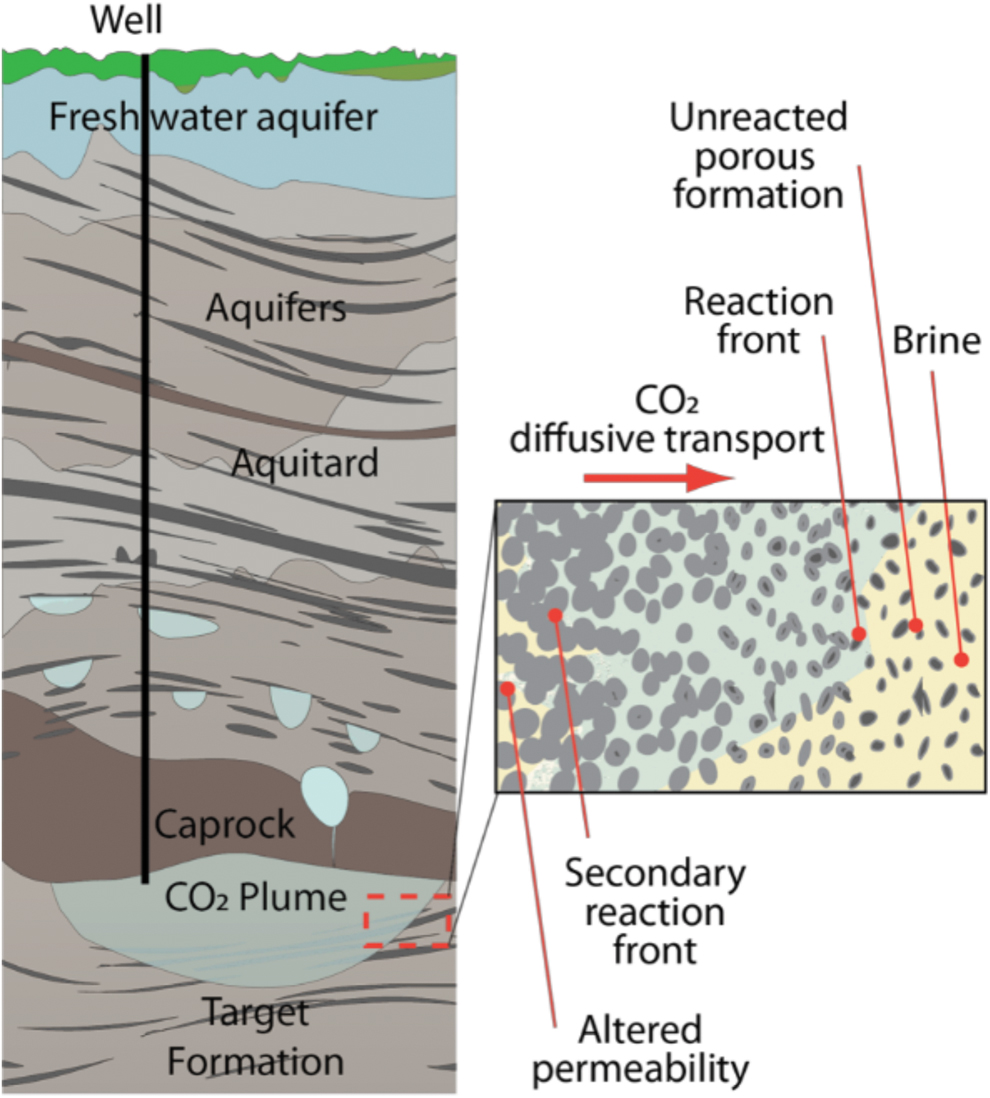
A CO2 plume from a target formation can potentially be sealed using targeted delivery of calcium silicate particles. The CaSiO3 particles would react with the diffusing CO2, producing mineral precipitates to decrease permeability, sealing the leakage.
When considering CaSiO3 reactions with CO2, the mineral wollastonite has been widely studied for its ability to mineralize CO2 into CaCO3, while also forming SiO2(am) and minor amounts of crystalline calcium silicate hydrate (CCSH) (Berner et al., 1983; Daval et al., 2009b).
In contrast, the CaSiO3 polymorph pseudowollastonite produces relatively larger quantities of CCSH when reacting with CO2 (Ashraf and Olek, 2016; Plattenberger et al., 2018, 2019; Monasterio-Guillot et al., 2019). These differences may be due to pseudowollastonite's stoichiometric dissolution and wollastonite's nonstoichiometric dissolution (Casey et al., 1993; Schott et al., 2012). The difference in release rates of Ca2+ and SiO2(aq) is thought to affect whether CaCO3 or CCSH forms (Plattenberger et al., 2018; Monasterio-Guillot et al., 2019).
The resulting CCSH phases exhibit properties that will likely benefit the development of targeted mineral precipitation technology for permeability control. CCSH phases show substantial resilience to redissolution in acid compared to CaCO3 (Plattenberger et al., 2018, 2019), a desirable characteristic to ensure the long-term containment of CO2, which exists in aqueous solution as carbonic acid. Furthermore, the molar volumes of CaCO3 (3.12 × 10⁻⁵ m3) and CaSiO3 (3.98 × 10⁻⁵ m3) are quite similar and may not be advantageous for sealing subsurface leakages. We suspect that the large molar volumes of CCSH in comparison to CaCO3 minerals, the ability of some CCSHs to expand and hold structural water, and the extensive microporosity observed in their formation will contribute to the pore-filling effectiveness of CCSH in porous media.
In this study, we used reactive transport modeling to explore calcium silicates in porous media reacting with diffusing CO2 and the extent of permeability reduction due to mineral precipitation. The modeling was aimed at addressing the following questions: Why does dissolution of different calcium silicates, wollastonite and pseudowollastonite, affect mineral formation? How do the properties of CCSH, their ability to create microporosity, and their co-occurrence with CaCO3 and SiO2(am) affect their ability to fill pore space? What pH conditions promote CCSH formation? Finally, how might changes in temperature and CO2 pressure affect the reactions involved, particularly under field conditions for geologic CO2 storage?
A one-dimensional (1D) reactive transport model was built to examine the conditions that allow for CCSH formation and quantify permeability alteration. Permeability was used as a metric to gauge the effectiveness of sealing the porous medium. For calibration of mineral precipitation kinetics and for model validation, simulations were compared with previously published experimental results in Plattenberger et al. (2019). In addition to the modeling, a single new experiment with a glass bead column was conducted, in which the column was filled with pseudowollastonite and reacted with CO2. The column was examined using x-ray computed tomography (xCT) imaging to observe pore space filling and changes in pore connectivity.
One-Dimensional Reactive Transport Model
Model system
The model system was selected to represent a porous medium with nonadvective diffusive flux at one end, similar to that originally configured by Giammar et al. (2014). A diffusion-limited environment is expected at the edge of the CO2 plume in a target formation (Fig. 1). A schematic of the model system is shown in Fig. 2. The constant boundary condition is represented as H2O equilibrated with an overhead pressure of CO2. Throughout this article, this boundary is referred to as the “CO2 source.” The remainder of the cells represents the porous medium, initially containing CaSiO3 and equilibrated with pH 7 solution. The last cell is a no-flux boundary. The cross-sectional dimensions of the 1D system were selected to allow comparison to experiments reported in Plattenberger et al. (2019) and cell volume calculations with changing porosity.
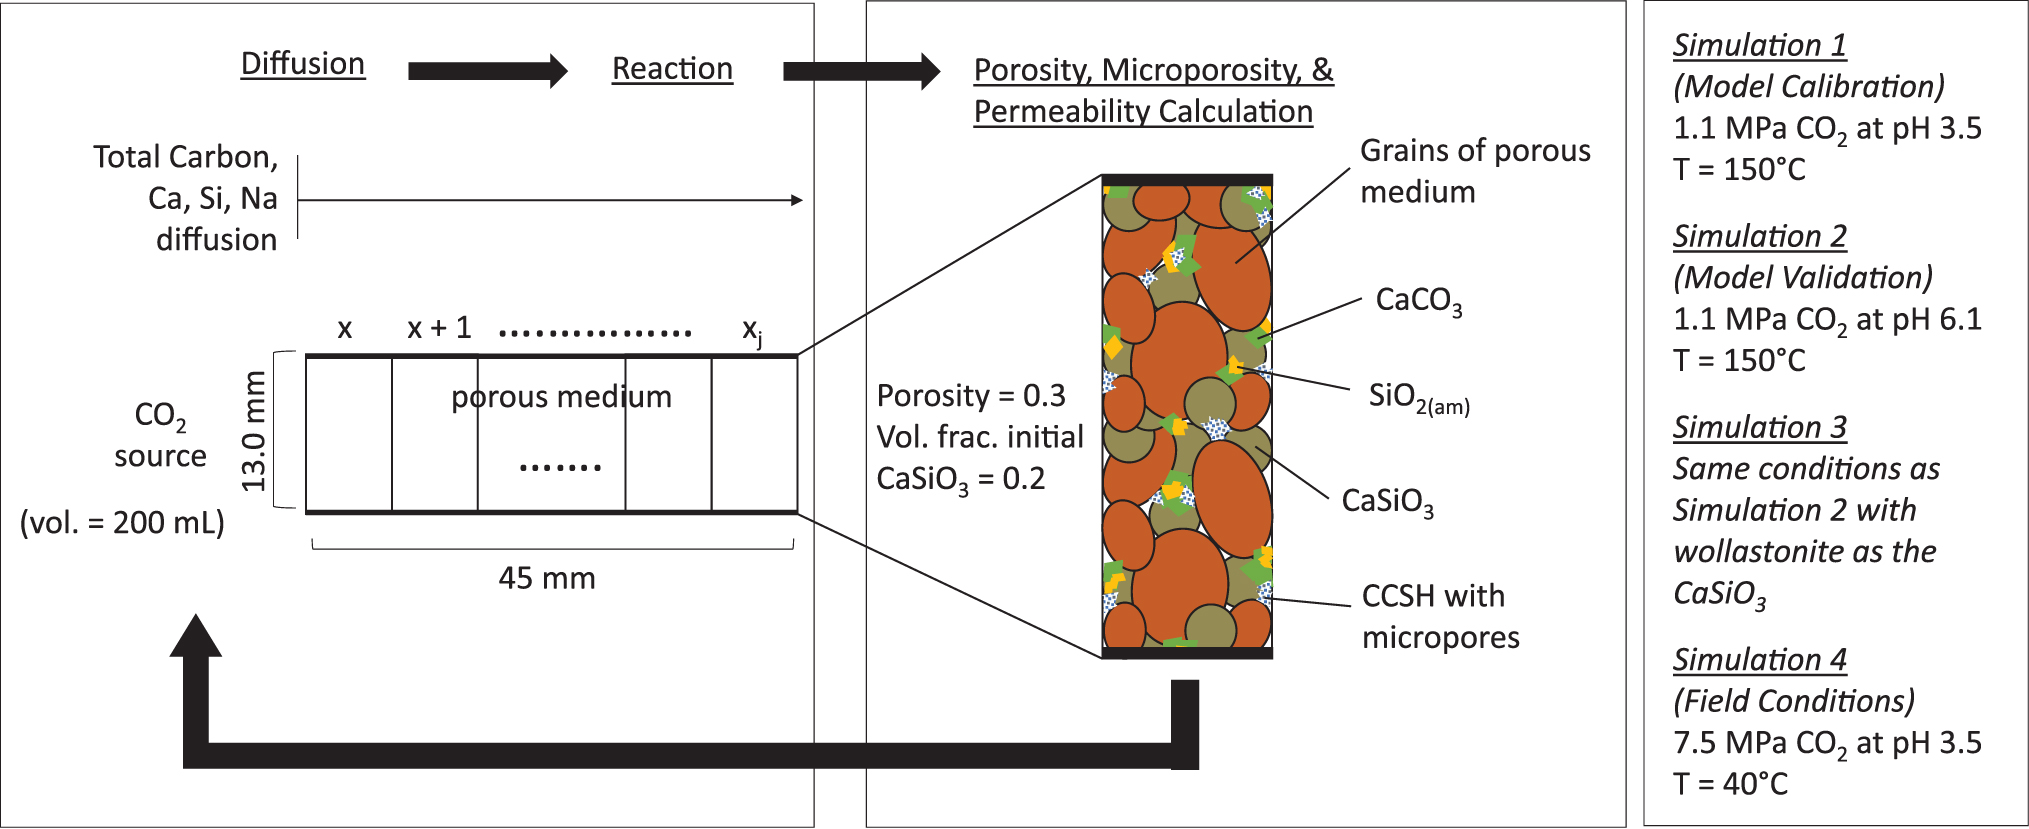
Schematic summarizing the components of the one-dimensional model and the simulation conditions. The parameter xj represents the space step, ranging from 0 to 45 mm.
Reactions and rate laws
CaSiO3 dissolution
CaSiO3 dissolution and precipitation were modeled kinetically for both wollastonite and pseudowollastonite according to the following reaction:
The rate of dissolution for wollastonite is described by the rate law derived from transition state theory:
where the rate is in units of mol/s, A is the reactive surface area,
For wollastonite, kinetic rate parameter values were estimated from Casey et al. (1993), Schott et al. (2012), and Ptáček et al. (2011), giving
All reaction parameters are included in Table 1.
Modeled Reactions and Kinetic and Thermodynamic Parameters
The molar volume for each reaction is the molar volume of the solid phase in that reaction.
CaCO3 dissolution
The dissolution of CaCO3 was modeled with the three parallel reactions:
The dissolution of CaCO3 follows the rate law (Plummer et al., 1978; Chou et al., 1989):
where
CaCO3 dissolves when the solution is undersaturated (
SiO2(am) dissolution
The dissolution of amorphous silica was modeled based on the experimental results of others that observed SiO2(am) formation in the reaction of calcium silicates with CO2 (Daval et al., 2009a; Plattenberger et al., 2018; Monasterio-Guillot et al., 2019). Dissolution was modeled according to the following reaction:
When the solution was undersaturated with respect to SiO2(am), then dissolution was allowed to occur. The rate of dissolution, according to Dove and Crerar (1990), is as follows:
The rate constant
Modeling of CaSiO3, CaCO3, and SiO2(am) precipitation
Precipitation reactions for CaSiO3, CaCO3, and SiO2(am), as described in Table 1, were modeled kinetically with rate equations. For all solids, precipitation was allowed to occur when the
where the rate is in units of mol/[cm2·s] and A is the reactive surface area. The precipitation rate constant,
CCSH dissolution and precipitation
CCSH dissolution and precipitation were modeled thermodynamically with no kinetic equations with tobermorite as the model CCSH. Tobermorite was chosen from many known CCSH phases because it is one of the most well-studied calcium silicate hydrates. In addition, Daval et al. (2009b) studied the reaction of wollastonite with CO2 and identified small amounts of calcium silicate hydrate that was likely 14 Å-tobermorite. Monasterio-Guillot et al. (2019) also identified what was likely metastable tobermorite in pseudowollastonite carbonation reactions.
The dissolution reaction of 11 Å-tobermorite is described as follows:
The saturation index for tobermorite is,
In the model, dissolution occurs when
Aqueous speciation
Table 1 includes all modeled aqueous speciation reactions along with their equilibrium constants and database sources. These species include H+, OH−, H2CO3(aq), HCO3−, CO32−, SiO2(aq), Na+, and Ca2+. Activity coefficients of all species were calculated using the Davies equation. CO2 was modeled as an aqueous solute, not as a separate phase. The concentration of dissolved CO2 was calculated using equations of state from Sterner and Pitzer (1994) and the solubility equations of Duan and Sun (2003). Speciation is calculated to satisfy the thermodynamic equilibrium of each species, listed in Table 1, and to satisfy the conservation of charge using the bisection method:
Transport
Diffusion
The governing equation for mass transport coupled with chemical reaction is as follows:
where Ci is the concentration of species i, t is time, D is the diffusion coefficient,
Porosity and microporosity
Porosity available for diffusion (
where
In order for microporosity to limit further precipitation in a cell, the porosity available for precipitation (
Once
This method of incorporating microporosity in the model provides a way to simulate continued reactive transport downstream from regions where reaction has stopped because there is no volume remaining for mineral precipitation.
Permeability
The permeability change that resulted from the mineral precipitation filling the pore space was calculated using the power law relation with porosity change:
where kx is the permeability of cell
The initial permeability was calculated using the Kozeny-Carman relationship:
where
To find the permeability (KP) of the entire length of the porous medium, the harmonic average of the individual kx values for each cell was calculated (Khan, 2012) as follows:
where KP is in mD and N is the number of cells.
Simulation Conditions and Model Parameters
Simulation conditions
The first model simulation was for calibration toward published experimental data to determine precipitation rate constants. Second, the pH was increased by adding 0.1 M NaOH to examine the effect of pH on the reaction front. The simulation was also used as validation by comparing with published experimental results from Plattenberger et al. (2019). A third set of simulations examined the effects of CaSiO3 solubility constants and dissolution rates to understand differences between wollastonite and pseudowollastonite and their effects on mineral precipitation and permeability reduction. A fourth simulation was done for field conditions at 40°C and CO2 pressures of 7.5 MPa (Crandell et al., 2010). All simulations were allowed to run to 96 h.
Model calibration
The calibration simulation (Simulation 1) results were compared to an experimental result from Plattenberger et al. (2019) in which a sand column containing pseudowollastonite was reacted at 150°C with boundary condition water equilibrated with 1.1 MPa CO2. The precipitation rate constants
Sensitivity analyses of these rate constants in pseudowollastonite reactions indicated that the CaSiO3 precipitation rate constant largely controlled where the observable CaCO3 precipitation front occurred (Supplementary Fig. S1a). As the rate constant
The precipitation rate constant for CaCO3 affects the mass of CaCO3 precipitation occurring in the regions of CaCO3 precipitation. As the
Model validation
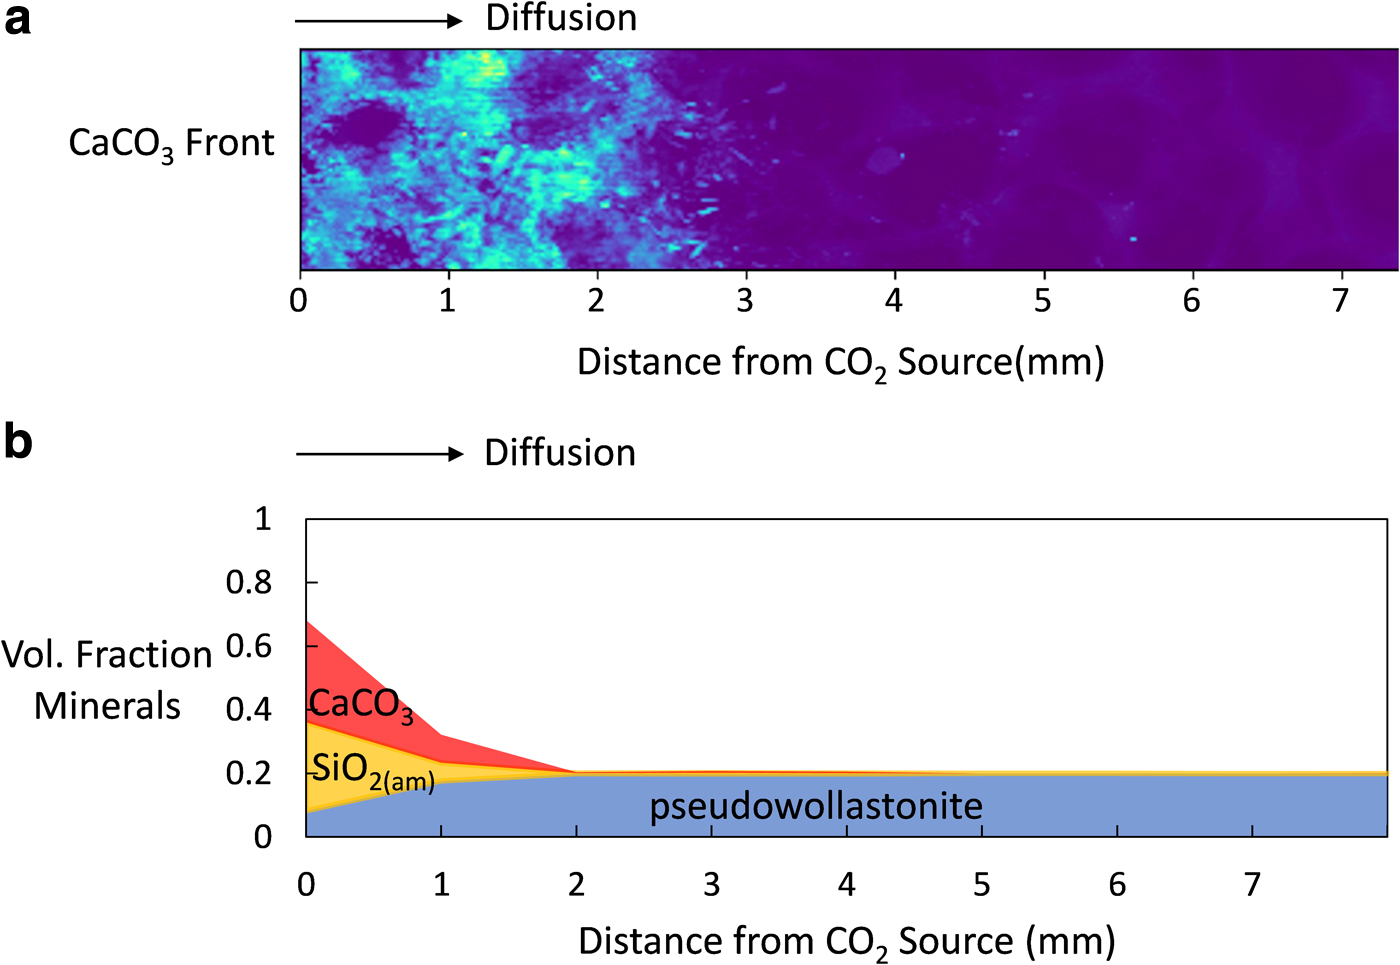
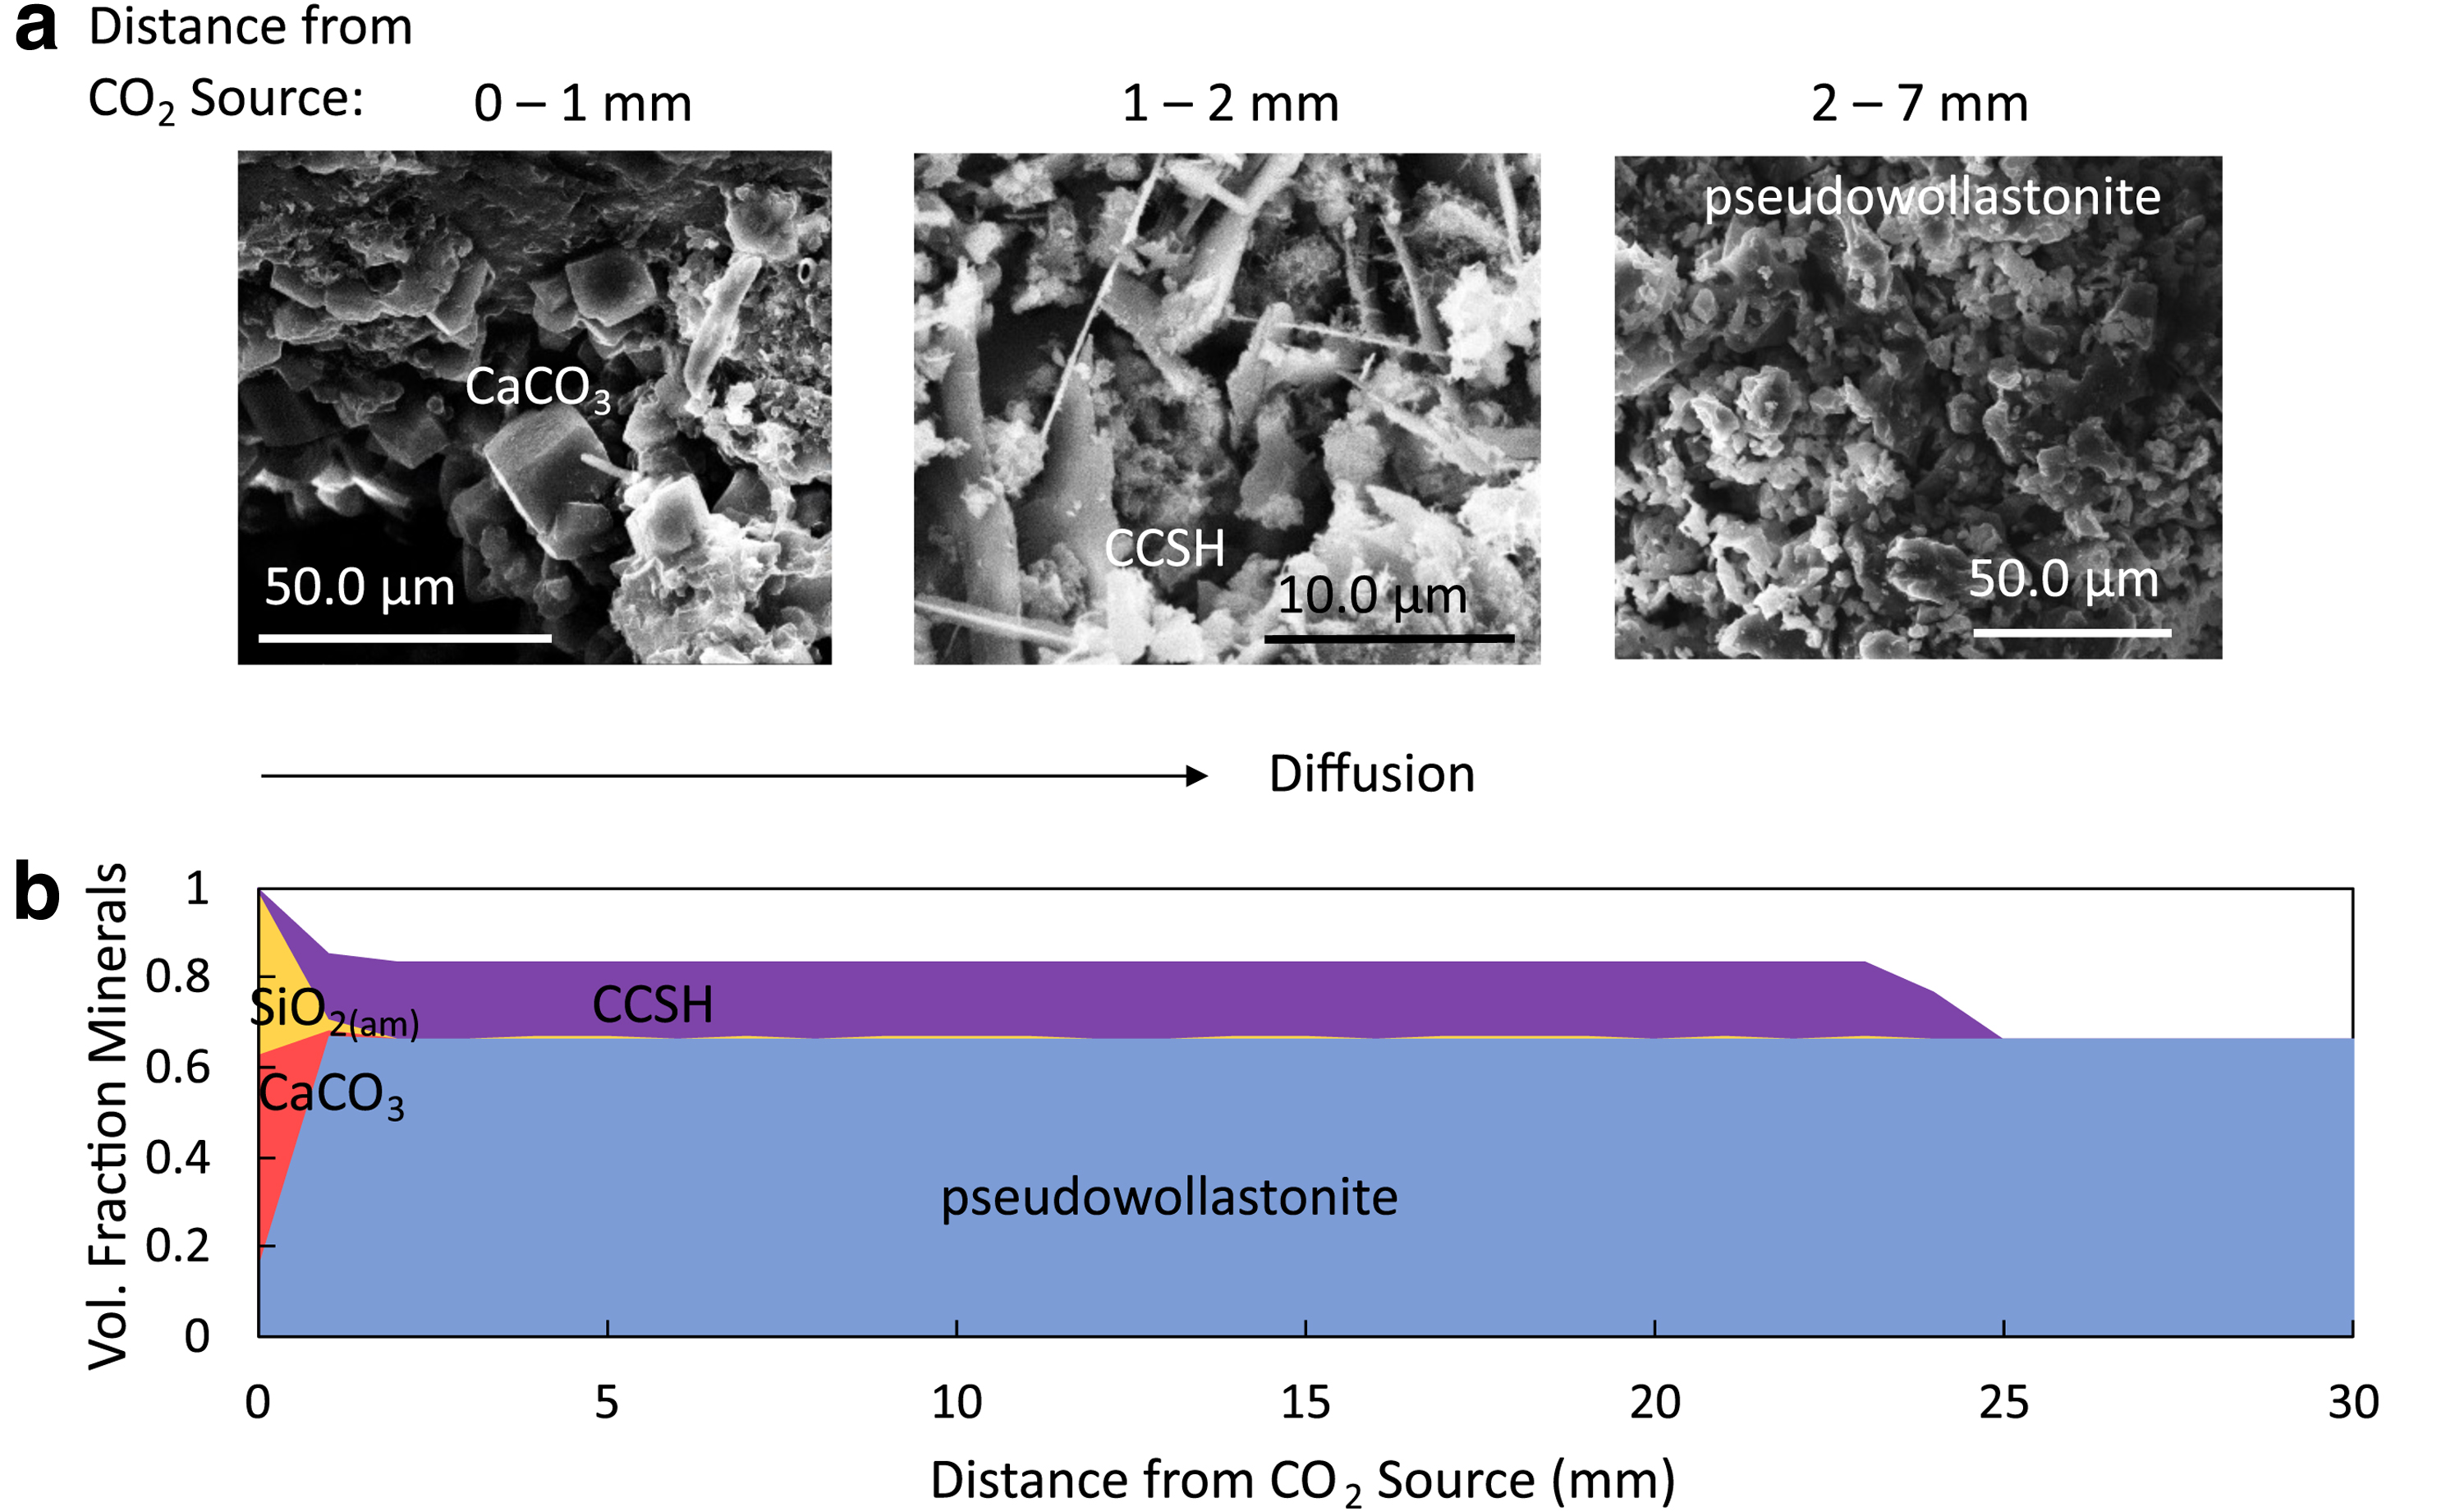
The model was validated in Simulation 2 as a result of adjusting the boundary pH to 6.1 by adding 0.1 M NaOH and comparing simulations with experimental results from Plattenberger et al. (2019). Those sand column experiments showed that, with higher pH, a small amount of CaCO3 precipitation occurred at the inlet, and CCSH precipitation was predominant from the inlet to ∼2–3 mm into the porous medium (Fig. 4a). The remainder of the porous medium stayed in its initial pseudowollastonite phase by 96 h of reaction, although permeability continued to decrease for 495 h. Similarly, the model showed that increased pH resulted in precipitation of CaCO3 and SiO2(am) largely within 1 mm from the CO2 source. A region of tobermorite precipitation formed farther in, occurring from 1 to 25 mm from the inlet by 96 h (Fig. 4b), producing more extensive CCSH precipitation than Plattenberger et al. (2019). This difference can be attributed to simplifications made in the model regarding CCSH formation.
Simplifications in the model were made due to the complexity of CCSH forming in experiments. Many calcium silicate hydrates like tobermorite can exist as metastable solids intergrown with each other and with a range of molar volumes depending on the amount of water molecules held within its structure (Richardson, 2008; Houston et al., 2009). This model does not evaluate the effects of hydration on permeability, or the diversity of calcium silicate hydrates that can coexist in the same environment to similarly alter flow. Furthermore, the rate of tobermorite precipitation was not modeled due to the lack of known kinetic information regarding CCSH. Despite these differences, the simulated results still match at least the spatial regimes reasonably well, if not the actual length scales of those regimes.
Experimental Methods
Reactive diffusion column experiments
Glass beads (595–841 μm; Mo-Sci Corporation) were placed in a stainless steel tube (outder diameter: ¼,” Wall thickness: 0.049,” Length: 1”) and sintered together at 680°C following methods by Berge et al. (1995). A filter was placed at the outlet of the column and pseudowollastonite (Sigma-Aldrich) was flowed through the glass bead column by pressurized water to fill the pore space. The filter was then removed, and the column was allowed to dry at 105°C for 24 h. The glass bead column was then placed in a stainless steel pressure vessel (300 mL; Parr) and filled with 250 mL of deionized water. It was reacted at 120°C degrees with a CO2 overhead pressure of 15 MPa, and allowed to react for 96 h. After reaction, the column was again dried at 105°C for 24 h. Permeability of the glass bead columns was measured before and after reaction with CO2 using air permeability, which measures the flow rate and pressure potential of air in the column (Tanikawa and Shimamoto, 2009).
Analysis of the column and reacted solids
After removal of the steel casing, the entire reacted glass bead column was imaged with xCT using a Zeiss Xradia 520 Versa High-resolution three-dimensional (3D) X-ray tomography microscopy (Princeton Imaging and Analysis Center) with a spatial resolution of 7.5 μm. Radiographs were collected by energy 80 kV with exposure times of 8.0 s. Three-dimensional image reconstructions were carried out in Scout-and-Scan Control System Reconstructor on 2048 radiographs taken over 180 degrees. Image processing for phase segmentation was conducted using Avizo 9 (FEI Systems) software. Subvolumes (1074 × 1277 × 1756 pixels) removing curved edges of the glass bead cylinder were used for further analysis.
X-ray diffraction (PANalytical X-Pert Pro Multipurpose Diffractor, Cu-Kα) was used to analyze the CaSiO3 before and after reaction with CO2. Scanning electron microscopy (SEM) coupled with energy dispersive X-ray spectroscopy (EDS) (Quanta-650) was used to examine morphology and elemental abundance of the prereaction and postreaction materials. For SEM/EDS analysis, samples were coated with Au/Pd.
Results and Discussion
Effect of pH on calcium silicate hydrate precipitation
As expected, experiments indicate that increasing pH can cause more CCSH precipitation (Simulations 1, 2; Figs. 3 and 4), but our model reveals why this occurred by examining the concentrations of aqueous species and the coinciding precipitation over time. Mineral solubility, CO2 solubility, and carbonate speciation all play a role.
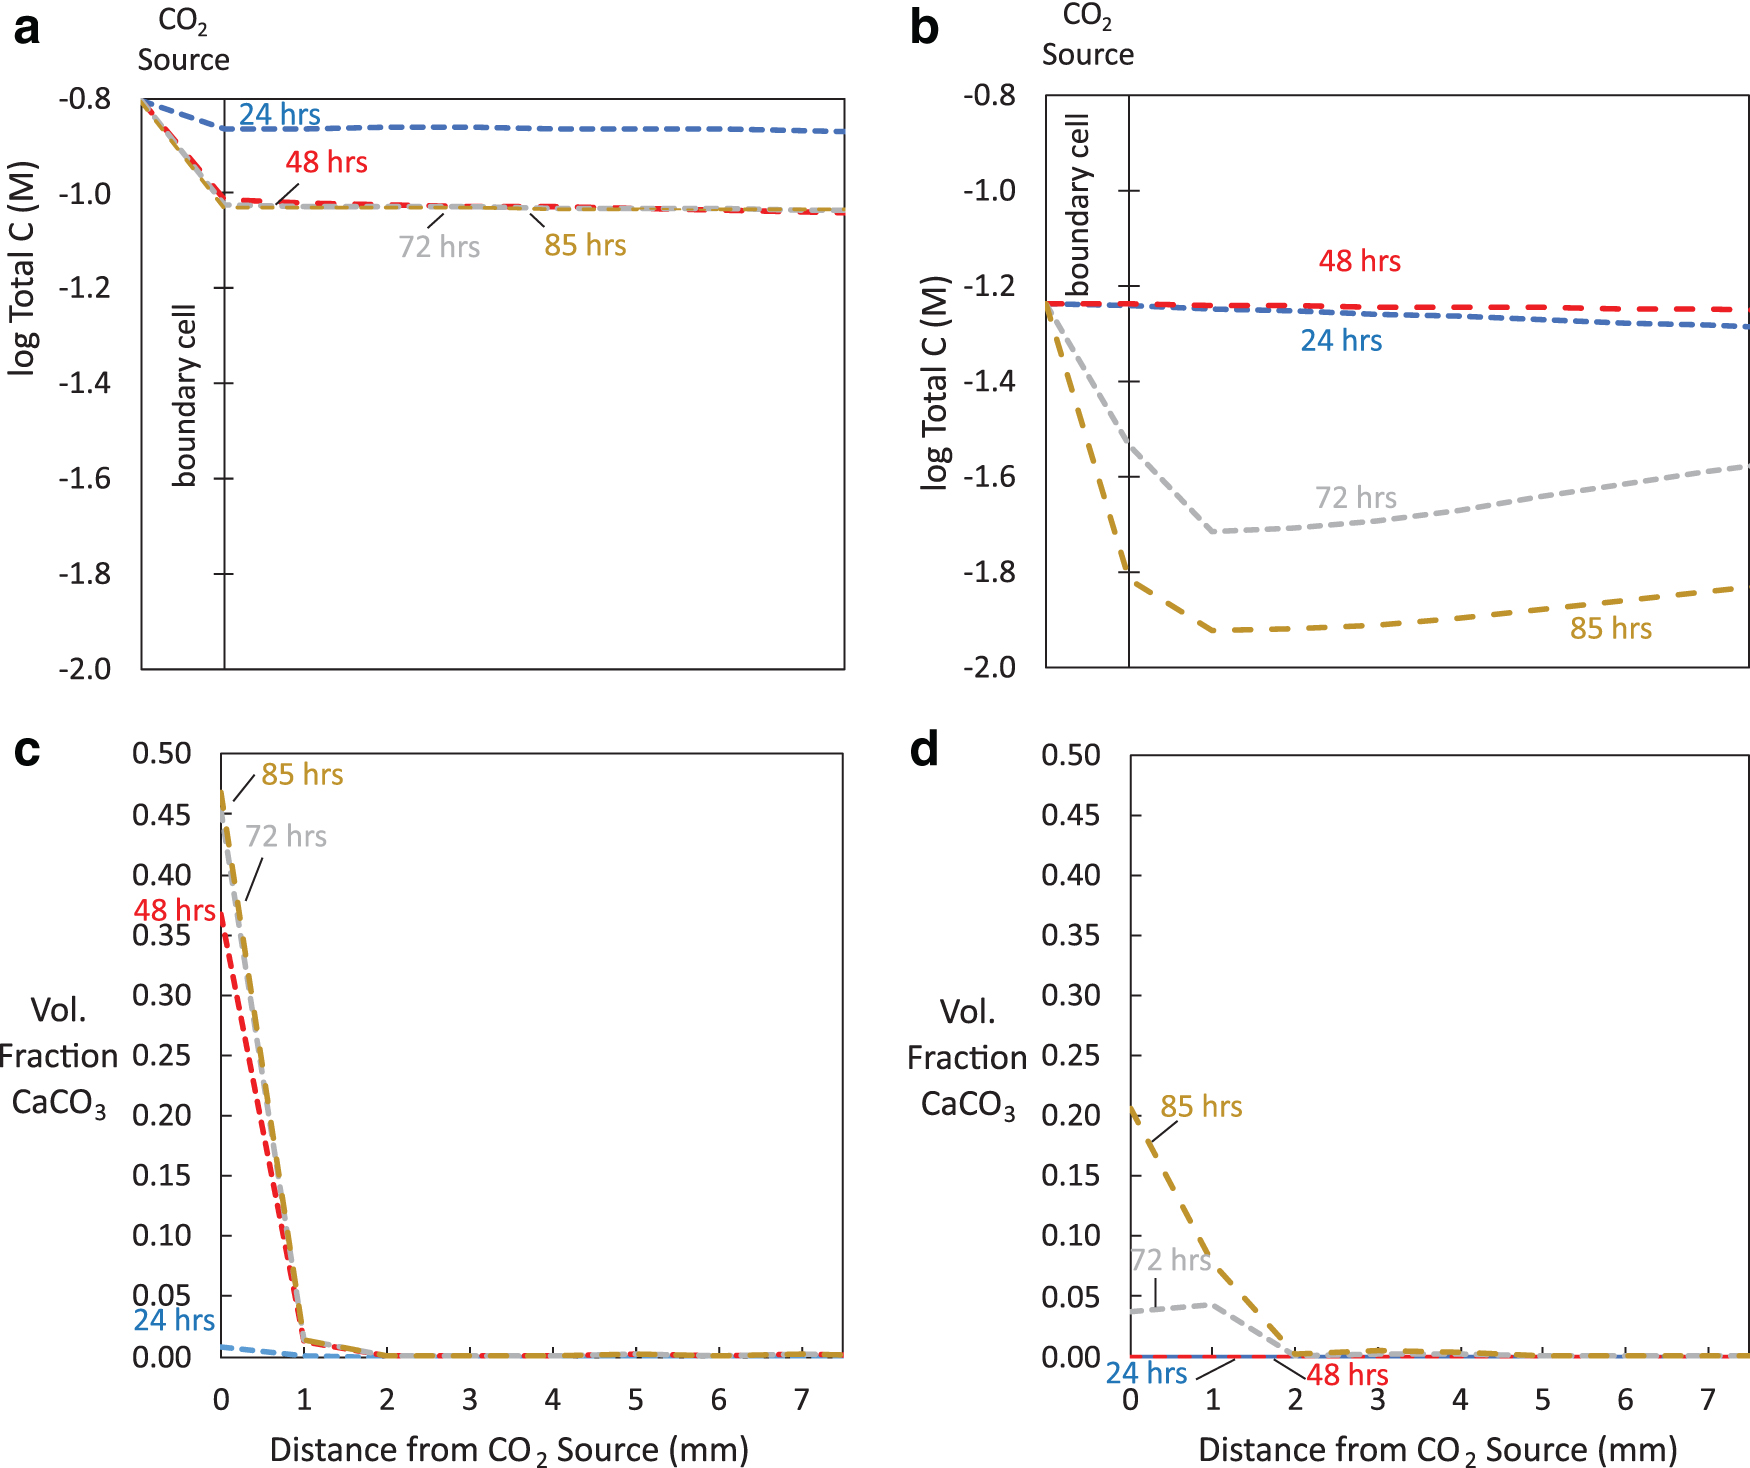
Two boundary pH conditions of 3.5 (Fig. 3) and 6.1 (Fig. 4) were examined by maintaining an overhead pressure of 1.1 MPa CO2 and adding 0.1 M NaOH to increase pH. The increase in pH increased the solubility of CO2, increasing the total carbon concentration in solution at the boundary from 0.058 to 0.156 M (Fig. 5a, b), thereby increasing the amount of diffusing CO32−. Subsequently, because CaCO3 formation [Eq. (7)] is generally limited by the CO32− supply in the system, the simulations at increased pH had more rapid CaCO3 precipitation within the first 48 h (Fig. 5c, d). CaCO3 precipitation began to slow near the CO2 source in simulations at increased pH after ∼48 h due to limited supply of CO32−, although minor CaCO3 precipitation continued up to 85 h (Fig. 5c).
In Simulation 2 with pseudowollastonite reacted with boundary pH 6.1,
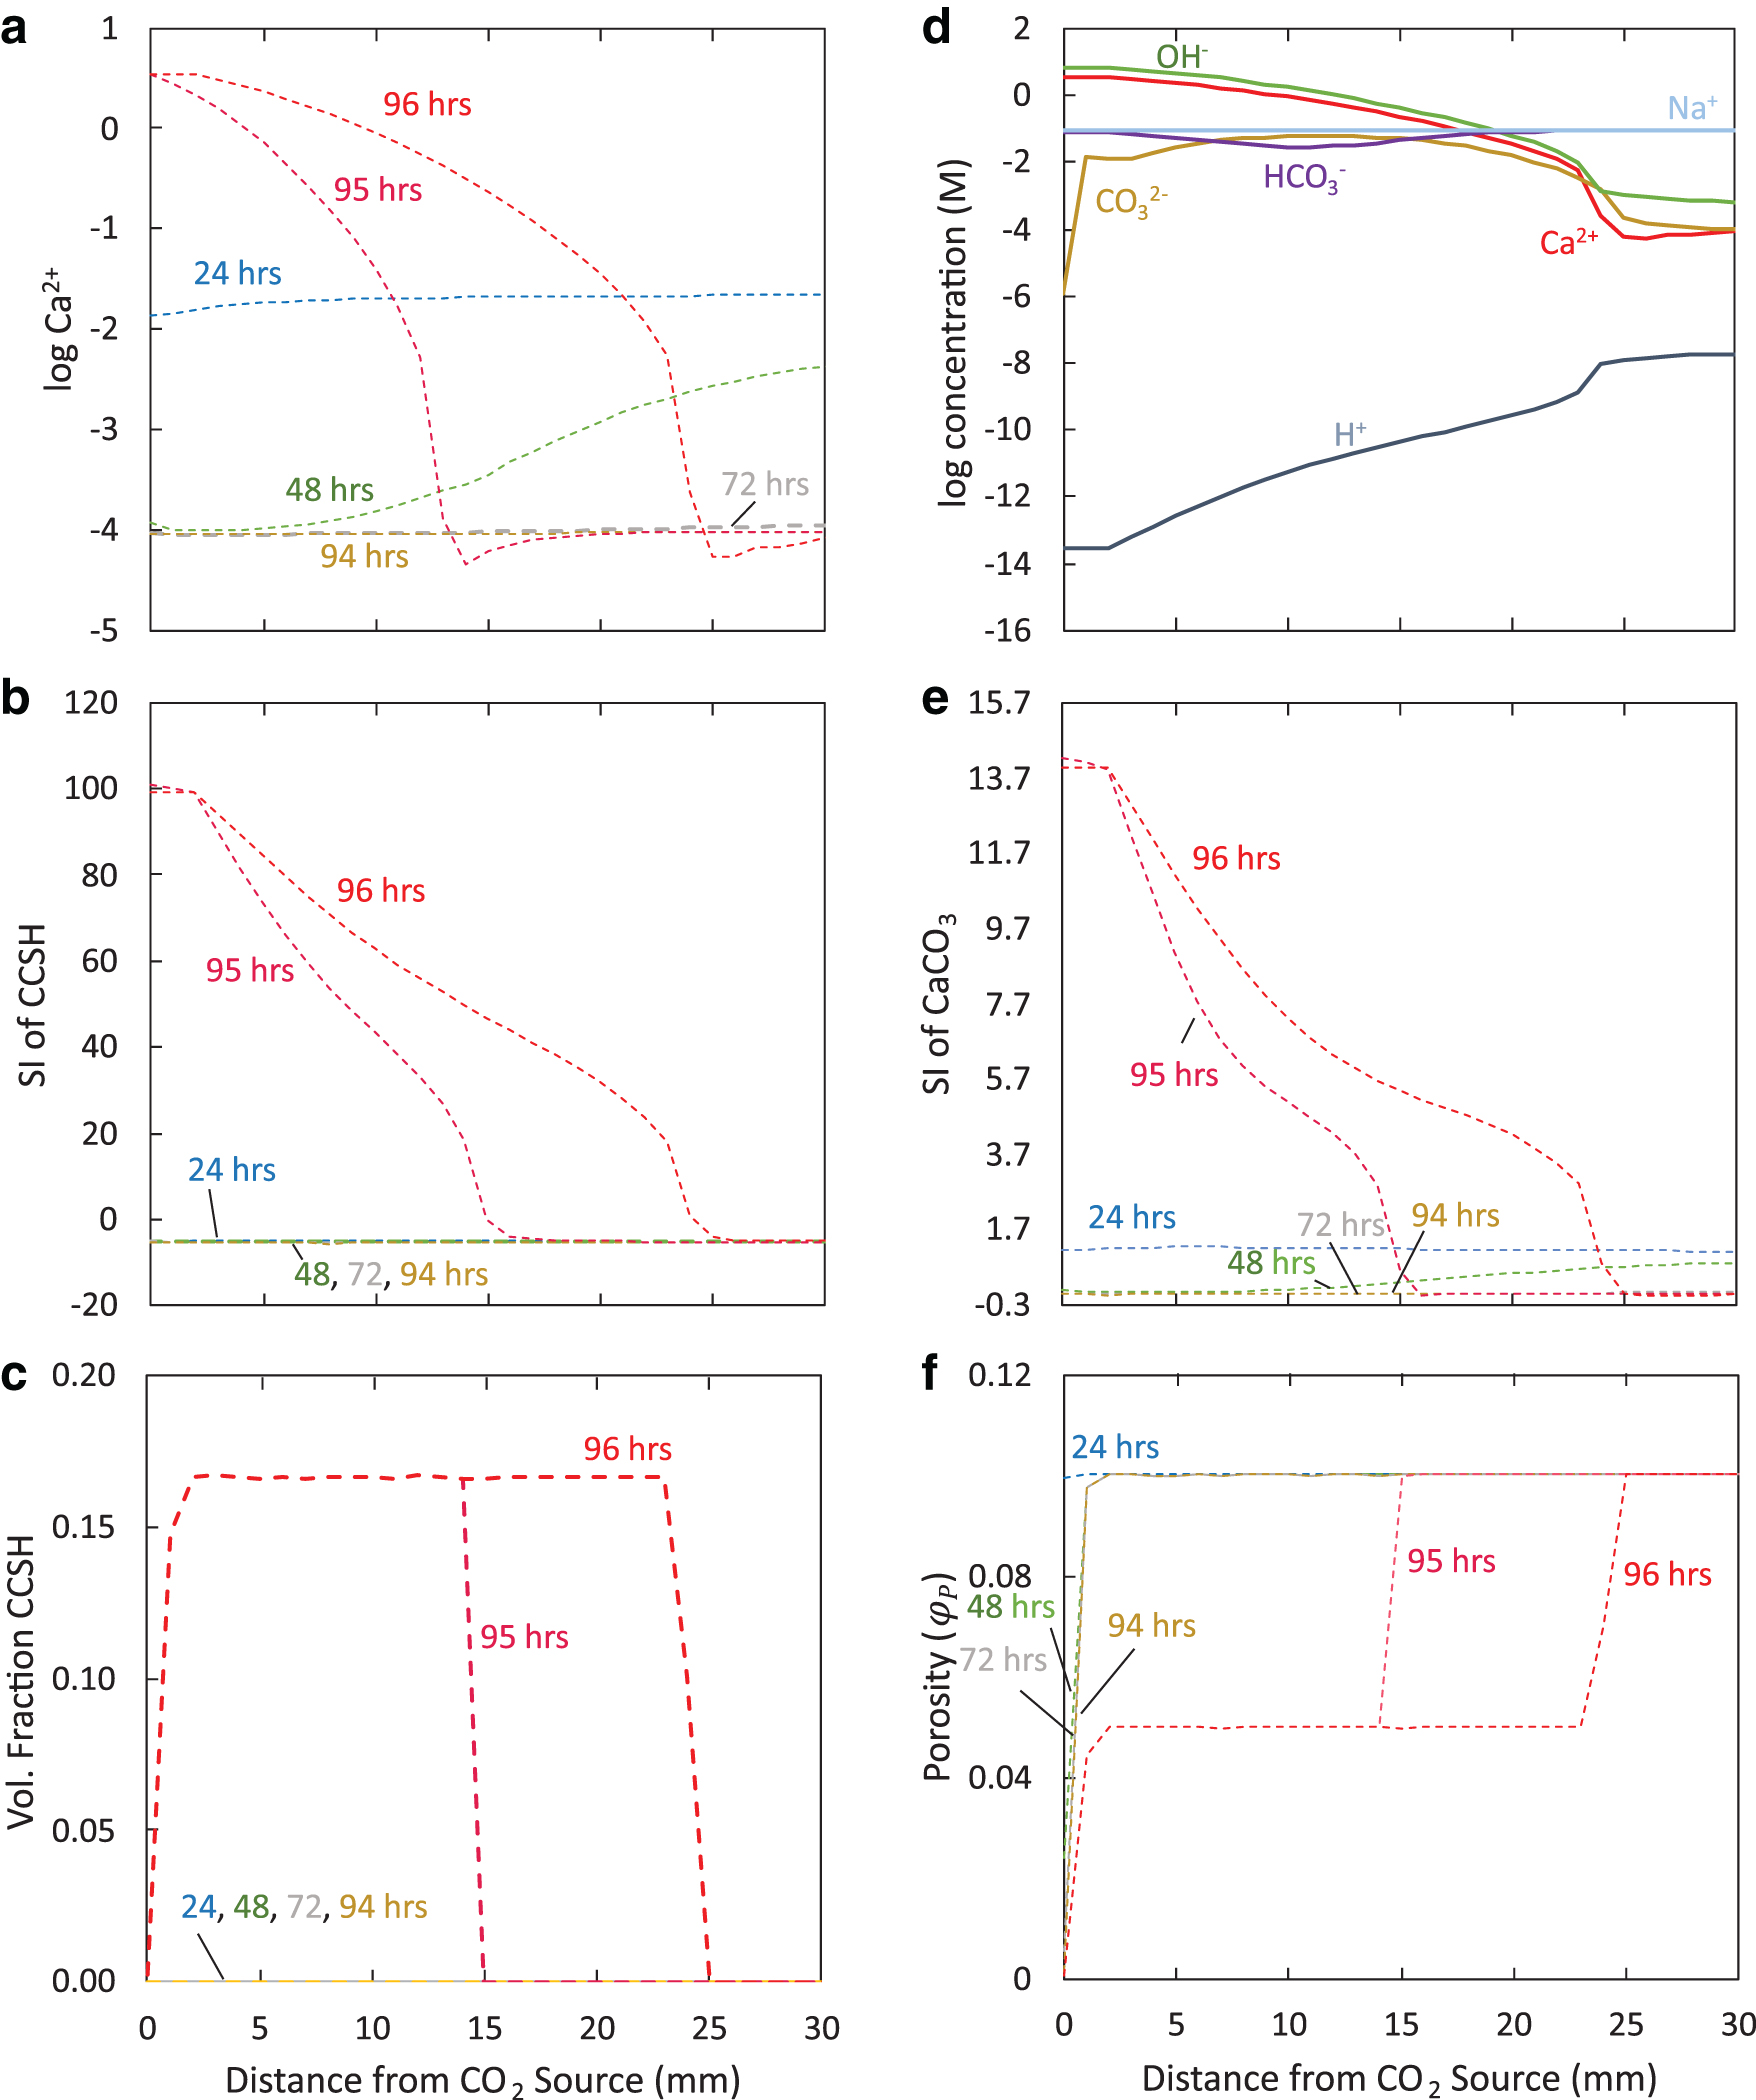
As shown in Fig. 6a, after ∼94 h, Ca2+ began to significantly accumulate near the inlet. The accumulation of Ca2+ over time promoted tobermorite precipitation through its influence on the saturation index (Fig. 6b). Precipitation of tobermorite occurred by 95 h (Fig. 6c) when it became oversaturated based on the
In Simulation 2 with pseudowollastonite reacting with boundary pH 6.1,
Increased Ca2+ concentration from accumulation increased
Spatial distribution of precipitating solids
The spatial distribution of solids throughout the porous medium in experiments with the boundary pH 6.1 can be explained by the order of reactions described above in Effect of pH on Calcium Silicate Hydrate Precipitation section. In the first regime reaching 1 mm from the inlet, CaCO3 and SiO2(am) dominate (Fig. 4). Because CaCO3 begins precipitating within the first hour of reaction and is limited by the supply of CO32−, it forms near the CO2 source. SiO2(am) precipitation, which depends on the supply of SiO2(aq) ions, forms where SiO2(aq) is released from CaSiO3 dissolution, coinciding with where CaCO3 forms. We note that although dissolution of CaCO3 and SiO2(am) was included in the model, their dissolution did not play a role in our simulations due to the presence of supersaturated solutions. During the first 94 h of reaction, tobermorite remains undersaturated (Fig. 6b) and does not compete for ions near the inlet.
In the second regime from 1 to 25 mm from the inlet, tobermorite dominates by 96 h (Fig. 4). Because tobermorite precipitation depends on Ca2+, SiO2(aq), and H+ concentrations as opposed to CO32− concentrations, it forms where Ca2+ accumulates after CaCO3 precipitation has slowed, occurring after 94 h. Note that this compares well with experiments by Plattenberger et al. (2019), which found that permeability differences between experiments with and without NaOH did not occur until after 96 h.
In the model, tobermorite's instantaneous precipitation to reach equilibrium removes Ca2+ and SiO2(aq) ions from solution, which could be available for CaCO3 and SiO2(am) formation. In the second regime, once CaCO3 and SiO2(am) do become supersaturated, they are still modeled as rate-controlled precipitation reactions competing with the instantaneous, equilibrium-driven tobermorite precipitation. Although the high-volume fractions of tobermorite are partly an artifact of the different methods used to model CaCO3, SiO2(am), and CCSH precipitation, the correct spatial pattern reproduced in the model was similar to experimental results by Plattenberger et al. (2019), confirming the likelihood that CCSH formation in the second regime depletes ions for CaCO3 and SiO2(am) precipitation. On the other hand, the larger spatial extent of CCSH precipitation suggests that CCSH precipitation may be rate limited, like CaCO3 and SiO2(am) precipitation.
In the third regime from 25 mm to the end of the modeled porous medium (Fig. 4b), limited CaSiO3 dissolution occurred with minor amounts of CaCO3 formation. Although HCO3− and CO32− are present in this regime, their concentrations are still less than concentrations near the inlet at 96 h, limiting CaCO3 precipitation. The relatively stable pH also prevents rapid CaSiO3 dissolution. Consequently, unreacted pseudowollastonite dominates the third regime.
Effects of CaCO3, SiO2(am), and CCSH on permeability change
The predicted changes in permeability in simulations 1 and 2 coincide with accumulating precipitates and their effects on porosity. When the boundary pH is 3.5 (Simulation 1), permeability does not start to significantly decrease until after ∼72 h (Fig. 7) when noticeable CaCO3 and SiO2(am) precipitation start (Fig. 5d and Supplementary Fig. S2a). By 96 h, the simulated permeability decreases by 1 order of magnitude. Model predictions of permeability were comparable to experimental results by Plattenberger et al. (2019). In those experiments conducted, sand columns under the same experimental conditions decreased by 0.46 orders of magnitude in 96 h and continued to decrease by 0.84 orders of magnitude after ∼168 h.

Permeability decreased for simulations with pseudowollastonite reacted with CO2 for boundary pH 3.5 (Simulation 1) and 6.1 (Simulation 2), with a larger decrease occurring at higher pH.
For Simulation 2 with the boundary pH 6.1, permeability starts to decrease (Fig. 7) when CaCO3 and SiO2(am) precipitation occur from ∼30 to 94 h of reaction (Figs. 5c and 3b). By 94 h, the permeability for simulated porous media decreased by ∼8 orders of magnitude. After 94 h, the model shows that permeability remains relatively stable, coinciding with rapid tobermorite precipitation (Fig. 6c). Although one might expect large amounts of CCSH precipitation to decrease permeability, an explanation lies in the modeling of microporosity and its effect on permeability. In the model, microporosity is available for diffusion, but not for precipitation. However, microporosity is incorporated into the calculation of the porosity available for diffusion,
The role of microporosity
The modeling of microporosity opens new doors and generates new questions. First, the inclusion of microporosity with CCSH precipitation permits continued diffusion and reaction in the model over longer time scales. In particular, for Simulation 2 with pseudowollastonite reacting with CO2 for the case of boundary pH 6.1 (Fig. 4), the pore space available for precipitation,
Microporosity plays an important role in filling pore space with mineral precipitation, although questions regarding its effect on permeability remain. Because microporosity represents pore space available for diffusion, it was included in the calculation of permeability. The designated amount of microporosity produced by CCSH formation, one in which the volume of micropores is equivalent to the volume of CCSH, resulted in no permeability decrease directly caused by CCSH precipitation. Despite this simulated result, we suspect that the formation of CCSH does, in fact, lead to permeability decrease, based on continued permeability decreases in sand column experiments by Plattenberger et al. (2019) when substantial CCSH formed. A decreased volume of microporosity resulting from CCSH formation would yield lower permeability. An improved estimation of the volume of microporosity produced from the different precipitation reactions would provide a better estimate of the actual effect of microporosity on permeability.
In addition, the model does not include microporosity from CaCO3, SiO2(am), or CaSiO3. This may account for the larger decrease in permeability in our simulations than the values measured in experiments, although the relative changes in permeability for different experiments remain accurate. We note that, in general, the effect of microporosity on permeability is poorly understood and is further complicated by pore connectivity, pore geometry, and ratio relative to macropores (Weger et al., 2009; Mehmani and Prodanović, 2014; Apourvari and Arns, 2016). Nonetheless, the model provides interesting insight into how microporosity from CCSH precipitation might influence permeability.
Permeability, porosity, and pore connectivity
To better understand the role of precipitation on porosity and permeability, experiments were conducted using sintered glass bead columns containing CaSiO3 to react with CO2. The use of sintered glass beads allowed for xCT analysis and differentiation between the glass beads, pores, and minerals. Because the glass beads were sintered together, the steel casing, which would have made it difficult to differentiate between materials like CaSiO3 and CaCO3 that may have more similar densities, could be removed. On the other hand, the glass bead surfaces were found to undergo minor dissolution, likely releasing additional ions in solution. Due to the resulting uncertainties and complications, we did not directly model glass bead column experiments.
The xCT images of glass bead column experiments showed that material filling the pore space near the column inlet had a different density than material filling the pore space near the closed end of the column (Fig. 8a). X-ray diffraction informed by chemical compositions detected from SEM/EDS analyses indicated that calcite formed at the inlet, while the calcium silicate hydrate fedorite formed in the remaining column.
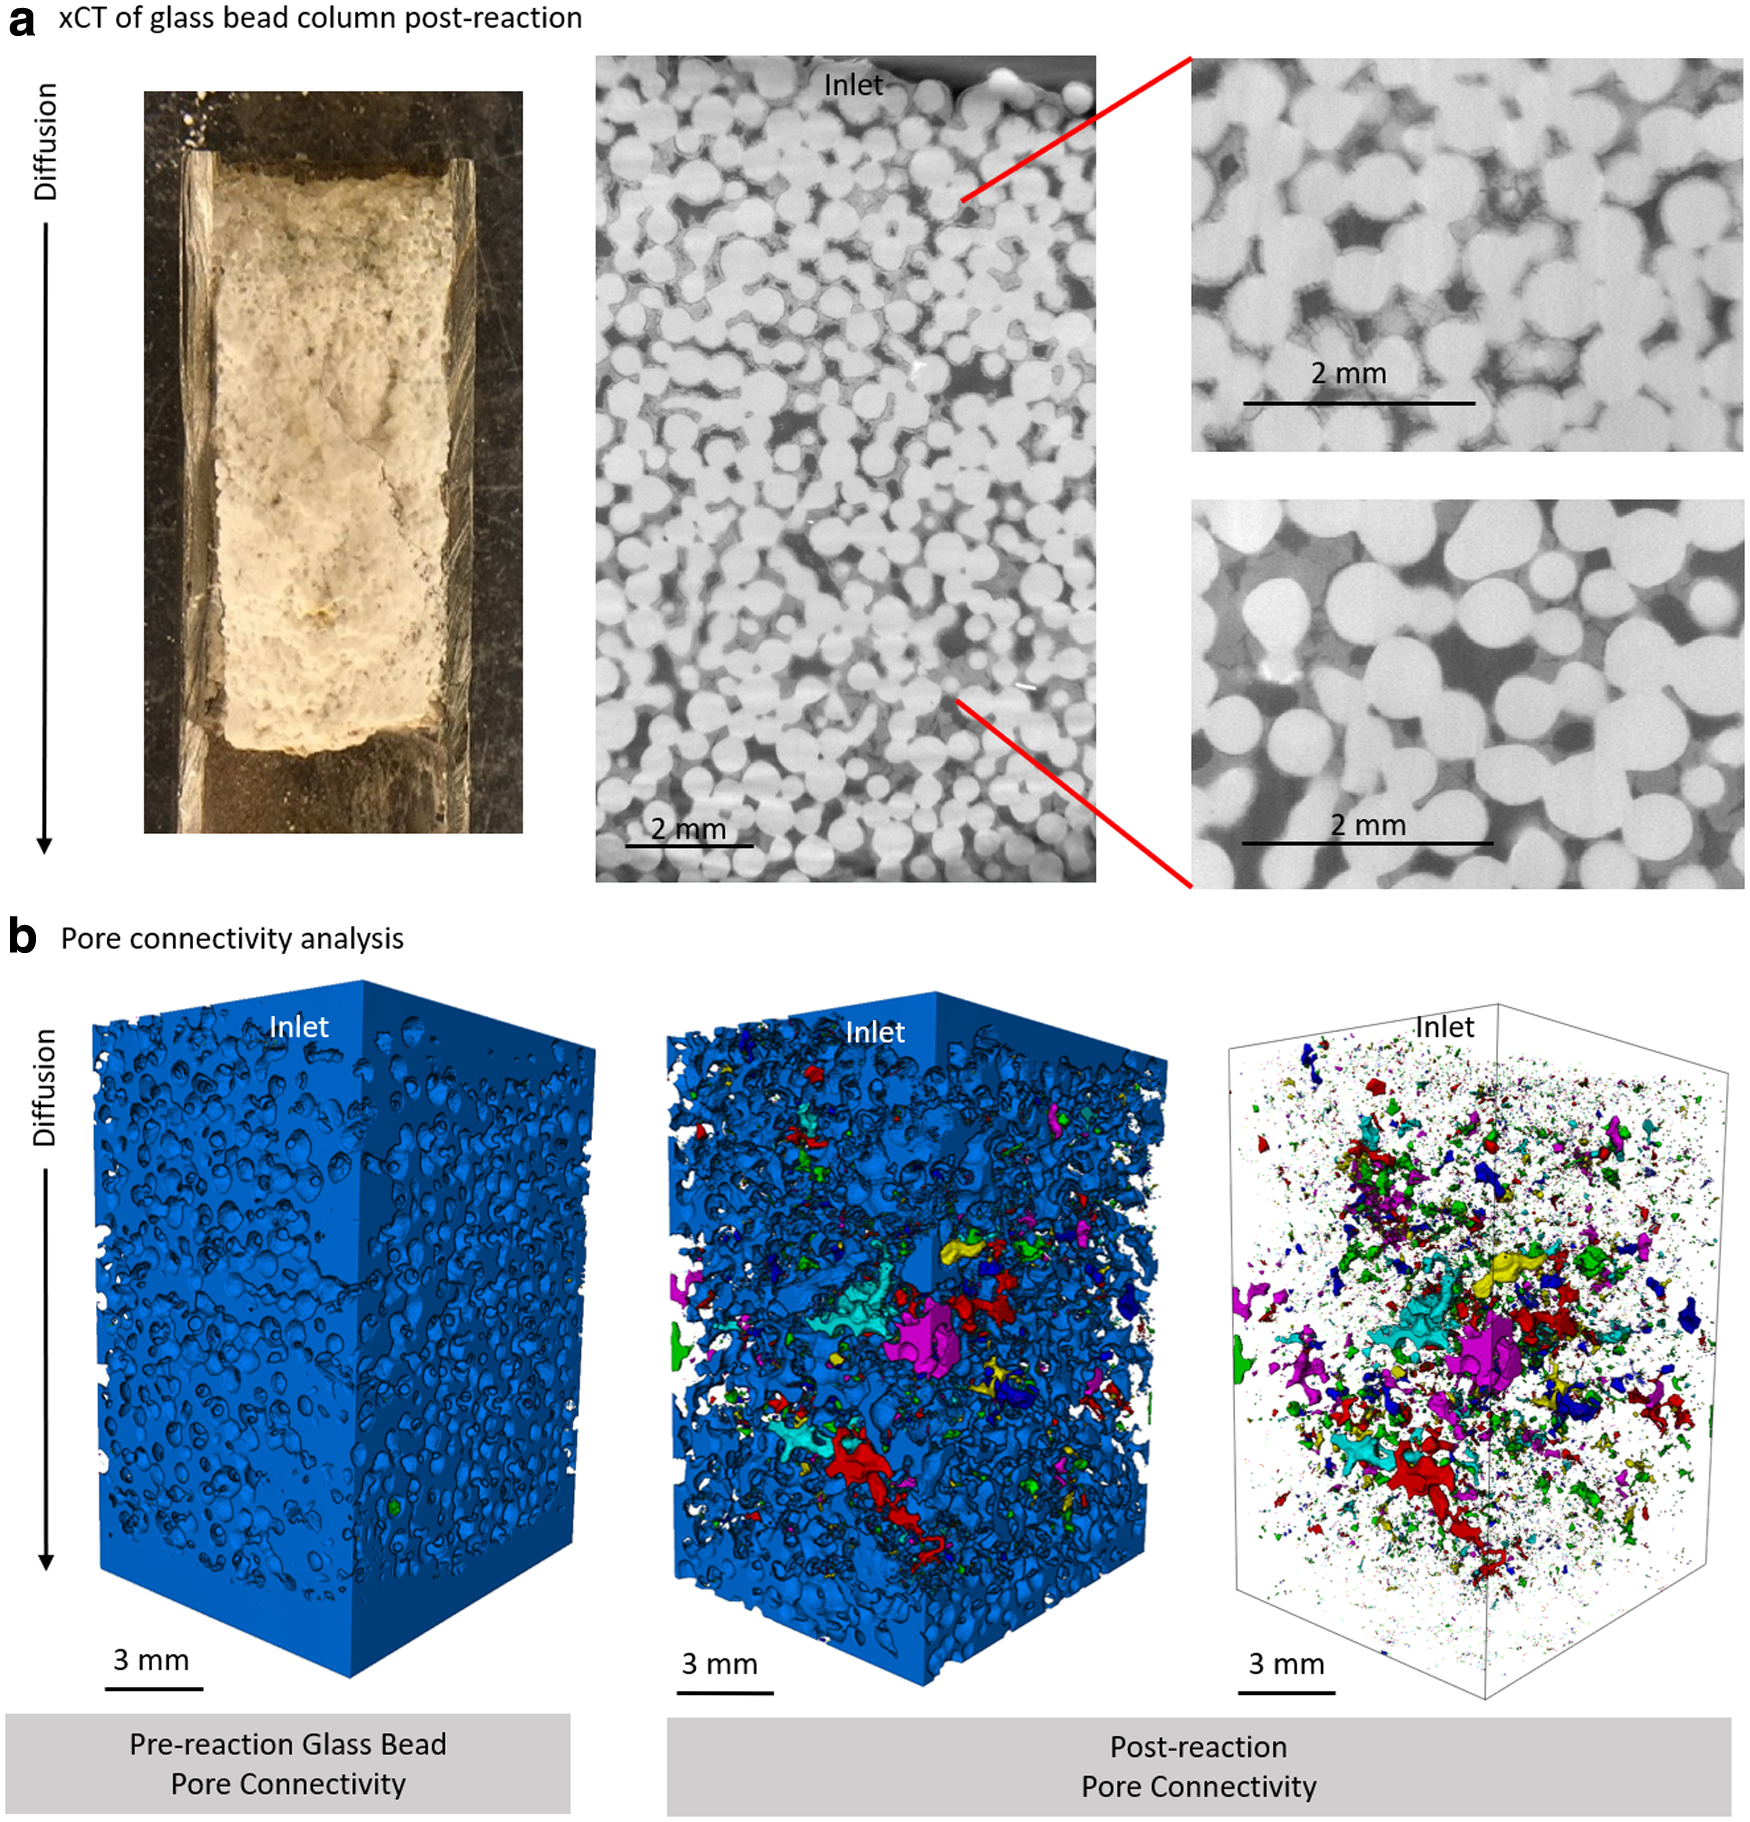
Analysis of the pore spaces showed that pore connectivity greatly decreased after CaSiO3 was added and reacted with CO2 (Fig. 8b), resulting in a permeability change of 2 orders of magnitude from 256 ± 29 to 7 ± 2 mD after 96 h of reaction. The pore connectivity arises from the 3D nature of a porous system and cannot be accounted for in a 1D model. However, the role of pore connectivity in permeability change should not be overlooked.
Comparison between wollastonite and pseudowollastonite in a diffusive system
To understand differences between wollastonite and pseudowollastonite dissolution on mineral precipitation, we modeled the effects of their distinct solubility constant, differences in dissolution rates for the two CaSiO3 minerals, and differences in precipitating CaCO3 mineral solubility constants.
In contrast to Simulation 2 for the 96-h simulations of pseudowollastonite reactions with CO2 for the case of boundary pH 6.1, reactions using the wollastonite solubility constant and a slowed dissolution rate led to no tobermorite formation (Fig. 9a). The use of calcite or aragonite's solubility constant for the CaCO3 phase did not affect tobermorite formation. The precipitation from CaCO3 and SiO2(am) led to decreases in permeability by 96 h (Fig. 9b), with the change larger than the simulations for pseudowollastonite reacting with CO2 for the case of the pH 3.5 boundary, but less than the simulations with the pH 6.1 boundary (Fig. 7).

Simulation 3 with the pH 6.1 boundary using the Ksp of wollastonite, the dissolution rate of wollastonite, and the Ksp of calcite as opposed to aragonite for the precipitation CaCO3 produced,
Examination of all three parameters that varied between wollastonite and pseudowollastonite simulations, which include the
The differences in precipitation products formed from wollastonite or pseudowollastonite highlight the importance of crystal structure in predicting reactions in the field if either CaSiO3 was used to seal leakages from geologic CO2 reservoirs. Pseudowollastonite has a structure consisting of isolated trisilicate rings (Yang and Prewitt, 1999), while wollastonite consists of silicate chains (Seryotkin et al., 2012). When reacting with CO2, wollastonite dissolves nonstoichiometrically, while pseudowollastonite dissolves stoichiometrically (Casey et al., 1993; Schott et al., 2012). The type of dissolution has been attributed to the difference in precipitates formed between the two calcium silicates, although this work suggests that dissolution rate and solubility likely play important roles as well.
Extrapolation to field conditions for a geologic CO2 reservoir
To examine the reactions relevant to a CaSiO3-CO2 system in a geologic CO2 reservoir, the field conditions of 40°C and 7.5 MPa CO2 were selected to run in the 1D model for Simulation 4. Although the boundary pH was 3.1, CCSH still formed throughout the porous medium, mostly from 1 to 44 mm at the closed end of the porous medium (Fig. 10a). In these regions, CCSH precipitates immediately at the start of the simulation. This results from the initial equilibration of pseudowollastonite throughout the porous medium at 0 h, which creates the conditions appropriate for CCSH to become supersaturated (Supplementary Fig. S3a).
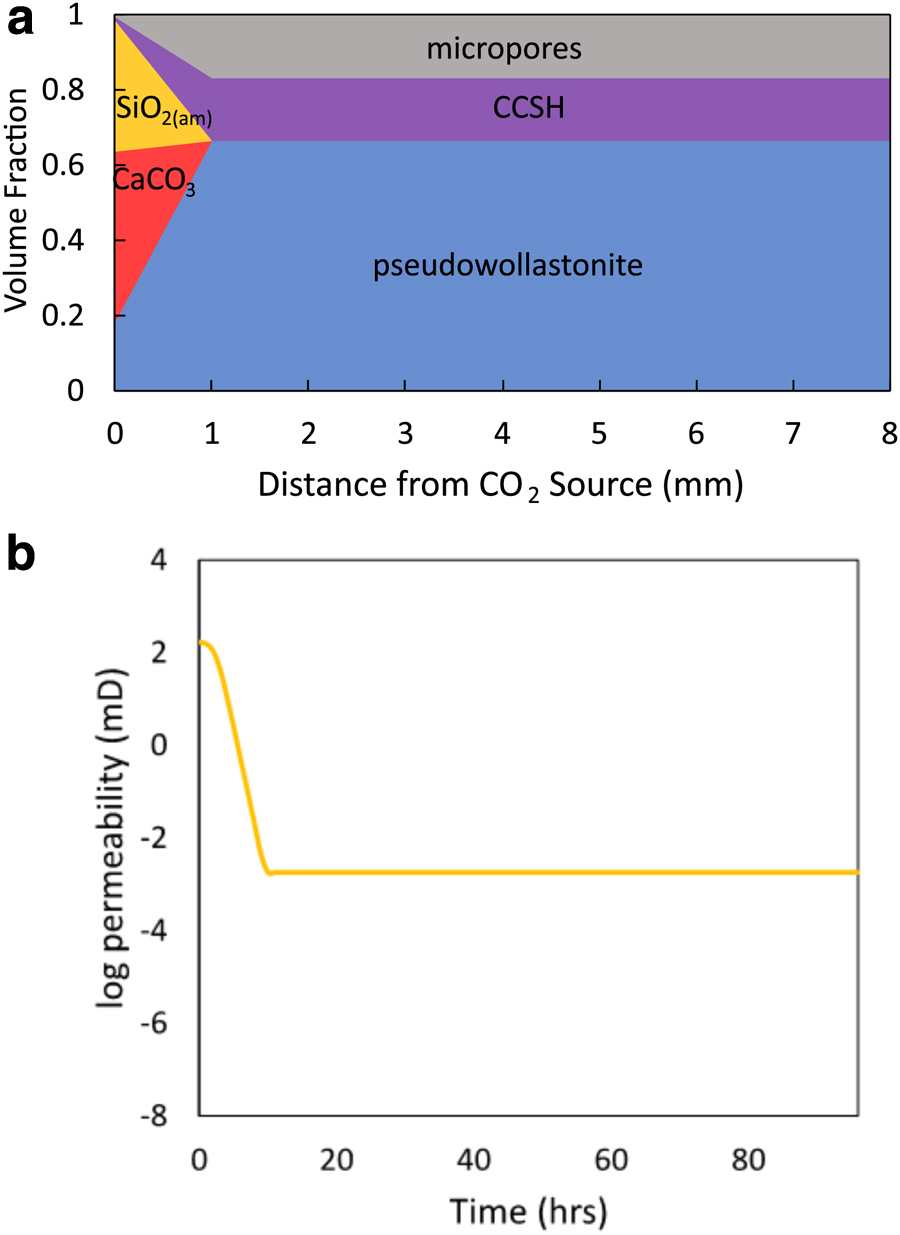
Simulation 4 under field conditions at 40°C and 7.5 MPa CO2 with no additional ions added formed
The change in initial conditions at 40°C field conditions and 150°C experimental conditions results from changes in equilibrium constant values due to temperature. Although the
The remaining significant decreases in permeability up to 11 h result from CaCO3 and SiO2(am) precipitation. Under field conditions, almost all CaCO3 and SiO2(am) formation occurred rapidly within 11 h of reaction (Supplementary Fig. S4b, c). Only minor increases in precipitation and decreases in permeability continued to occur due to <0.001 vol. fraction of CaCO3 precipitation at the inlet from 11 to 96 h.
The fast approach to a relatively stable environment in porous media under field conditions was initially surprising, particularly because it occurred faster than in high temperature simulations. However, an understanding of CO2 solubility explains the unexpected result. CO2 solubility decreases with increasing temperature. As a result, CO2 dissolves more readily at 40°C, yielding higher total carbon concentrations for the CO2 source than at 150°C. In addition, the field conditions had a higher overhead CO2 pressure at 7.5 MPa, higher than the experimental overhead CO2 pressure at 1.1 MPa. Therefore, the simulation at 150°C had total carbon concentrations of 0.05776 M for the CO2 source, while the simulations under field conditions had total carbon concentrations of 1.152 M carbon. These increased levels of CO2 in solution led to faster precipitation reactions for all solid phases and a faster approach to equilibrium under field conditions in comparison to the simulated conditions at 150°C.
At the same time, we recognize the limitations of the model in correctly predicting expected results under field conditions. In particular, the precipitation rate constants for CaSiO3, CaCO3, and SiO2(am) were calibrated to match with the CaCO3 precipitation front produced in experiments at 150°C. These rate constants may change with temperature, but due to the complexity of precipitation rates, we chose to keep them constant across all simulations.
Implications
These modeling results using field conditions typical for a geologic CO2 reservoir yield promising insights into deploying CaSiO3 particles for targeted mineral precipitation. The predicted precipitation of CCSH under field conditions has positive implications for using pseudowollastonite for targeted mineral precipitation. CCSH formation will likely contribute to significant decreases in porosity and permeability, particularly considering the large molar volumes of different CCSH phases in comparison to aragonite and calcite.
The expected formation of CCSH under field conditions may also improve the long-term stability of precipitated minerals used to prevent further leakage of CO2 or other subsurface contaminants. The observed acid resistivity of certain CCSH relative to CaCO3 will likely prove useful. The spatial relationship between CaCO3 and CCSH precipitation also results in the advantageous formation of a thicker precipitation barrier that would not be possible with only CaCO3 formation. CaCO3 formation relies largely on the supply of CO32−, which is heavily limited by CO2 diffusion. In addition, the presence of CO32− is also limited by pH, with CO32− forming as the dominant carbonate species only at high pH. Most systems may not reach a high enough pH for CO32− to be the dominating carbonate ion. CCSH formation, on the other hand, depends on the more abundant Ca2+ and SiO2(aq) ions, along with an alkaline pH that can arise naturally from the presence of Ca2+. The formation of different regimes of precipitation resulting from diffusion-limited species emphasizes the complexity of transport in such systems, and hints at the possibility of engineering multilayered barriers for targeted mineralization.
In addition, this work elucidates the role that basic conditions may play in developing targeted mineralization technology. The presence of other ions can influence the solubility of CO2, consequently affecting the rates of precipitation, the supply of diffusing ions, and the potential for taking advantage of multiple forms of precipitation in a mineralized barrier. The application of adding basic ions may be used for improving outcomes during the process of sealing leakages if CaSiO3 nanoparticles were injected in a pH-adjusted solution. In addition to controlling injected mixtures, the presence of other ions can also affect the pH of diffusing solutions, determining the amount of dissolution and precipitation that may occur. Such considerations are relevant to leakages occurring in a wide variety of subsurface settings, including those that contain brines.
The development of this 1D model enabled us to explore the deployment of CaSiO3 particles in the subsurface. We can now examine different solution conditions, a diversity of rock types, a variety of CaSiO3 particle sizes, and the effects of uneven distribution of CaSiO3 minerals within the porous medium depending on where they accumulate after deployment. This model will help tackle the complex systems in which targeted mineral precipitation technology will be implemented.
Footnotes
Acknowledgment
We thank Zhiyuan Tao for his contribution to glass bead column experiments.
Author Disclosure Statement
No competing financial interests exist.
Funding Information
This work was supported by the U.S. Department of Energy National Energy Technology Laboratory (Grant DE-FE0026583 to the University of Virginia and Grant DE-FE0026582 to Princeton University) and the National Science Foundation (Grant NSF CBET-1805075 to the University of Virginia). The authors acknowledge the use of Princeton's Imaging and Analysis Center, which is partially supported by the Princeton Center for Complex Materials through the National Science Foundation-MRSEC program (DMR-1420541).
References
Supplementary Material
Please find the following supplemental material available below.
For Open Access articles published under a Creative Commons License, all supplemental material carries the same license as the article it is associated with.
For non-Open Access articles published, all supplemental material carries a non-exclusive license, and permission requests for re-use of supplemental material or any part of supplemental material shall be sent directly to the copyright owner as specified in the copyright notice associated with the article.