
Abstract
Enhanced coagulation can remove dissolved organic carbon (DOC) that acts as a precursor to disinfection byproducts (DBPs). However, previous studies have not elucidated the effect of certain coagulation and settling parameters, such as the fast-mixing rate and settling time, on haloacetic acids (HAAs) and trihalomethanes (THMs). Furthermore, coagulant dosage, fast mixing power, and settling time play essential roles in the cost-efficiency of operation and construction of a water treatment plant. This study aims to present a novel investigation of the effects associated with the operational factors of coagulation-flocculation and sedimentation to achieve feasible solutions for management of DBPs. The simultaneous effects of pH (4.5–8.5), coagulant type (Fe3+/Fe3+ + Al3+ ratio), coagulant dosage, fast-mixing rate, and settling time were examined using a response surface methodology design. Accordingly, predictive models were generated by conducting 2 sets of experiments, which comprised 50 runs of jar tests that were performed in triplicate of 2 blocks for 2 natural drinking water sources in Newfoundland, Canada. The results were validated on four natural waters and two synthetic water samples. The multivariate optimization on THM4 and HAA5 resulted in a significant reduction in the fast-mixing energy by 59.9%, and a reduction of 23.4–41.1% in coagulant dosage. The results of natural organic matter fractionation on water samples revealed that the optimized coagulant dosage of 3.83–5.95 mg/mg DOC could remove up to 91.00%, 72.64%, and 70.79% of THM4, HAA5, and DOC, respectively, in natural water samples with a very hydrophobic acid (VHA) fraction of 0.67–0.81 VHA/DOC.
Introduction
More than a century ago, chlorine was the first disinfectant used to eradicate waterborne diseases (Kristiana et al., 2011). The chain of reactions between chlorine-based disinfectants and natural organic matter (NOM) decreases the effectiveness of chlorination in distribution systems and leads to the formation of hazardous disinfection byproducts (DBPs) (Liao et al., 2018).
Trihalomethanes (THMs) and haloacetic acids (HAAs) are two groups of DBPs that are regulated by the U.S. EPA and originated from NOM. The U.S. EPA announced the maximum contaminant levels (MCLs) of 80 and 60 ppb for four species of THMs (THM4) (i.e., chloroform, bromoform, bromodichloromethane, and dibromochloromethane) and five compounds of HAAs (HAA5) (i.e., monochloroacetic acids, dichloroacetic acids, trichloroacetic acids, monobromoacetic acids, and dibromoacetic acids), respectively (EPA, 1999). The International Agency for Research on Cancer (IARC) has classified chloroform and bromodichloromethane in Group 2B as possible human carcinogens with increased risk of liver cancers (IARC, 1999).
Enhanced coagulation (EC) is one of the most efficient, simple, and low-cost methods for removing NOM from water (Racar et al., 2017). The U.S. EPA requires conventional water treatment plants (WTPs) to decrease the level of DBPs by considering a surrogate measurement of total organic carbon (TOC) removal because of its feasibility of testing. Accordingly, WTPs must reduce TOC level by 15–50% using EC based on the raw water's alkalinity and TOC, as mentioned in the Supplementary Table S.1 (EPA, 1999).
However, in addition to the changes in the concentration and structure of NOM fractions over time, the unique properties of NOM in every water source, such as hydrophobicity, molecular weight, and structure (Liao et al., 2018), expose EC WTPs to difficulties regarding DBPs (Sharp et al., 2006). In a study in Australia, EC in a full-scale WTP could remove dissolved organic carbon (DOC) by 80–90%. However, the high levels of NOM content in water resources, as reported by the research, required additional materials (i.e., activated carbon) to decrease the level of DBPs (Kristiana et al., 2011) to the MCL. The level of DOC in two-thirds of surface waters of Newfoundland (NL), Canada, is more than 5 mg/L, with an average of 9 mg/L (Department of Environment and Conservation, 2011). A maximum of 14.4–21.2 mg/L DOC was observed in tap water in some areas of the province in 2019–2020 (Water Resources Management Division, 2020). Consequently, achieving the MCL for DBPs using the U.S. EPA suggestions and conventional jar tests has not been a success in some WTPs. Eight out of 16 treatment facilities in NL utilize EC as a part of their WTP for DOC removal. Meanwhile, 147 occurrences of THM4 level exceedance were observed among a total of 505 points of measurement in 2019–2020. In a case study, a DOC decrease of 65% in an EC full-scale WTP was not considered satisfactory for the reduction of DBPs to the MCL in NL (Department of Environment and Conservation, 2011). Therefore, it is necessary to conduct a comprehensive study to efficiently amend conventional WTPs in the province and reduce the levels of hazardous DBPs through predictive models specifically designed for NOM characteristics in NL by assessing the effective parameters in EC.
The U.S. EPA requires the WTPs to adjust the operational conditions of EC by using jar tests (EPA, 1999). Conventional jar tests are one-factor-at-a-time experiments. Although this approach provides an easy trial-and-error setup (achieved by changing one factor while other factors remain fixed), it is not a recommended strategy as it requires a large number of experimental runs and is characterized by limitations when applying the optimal conditions for all variables. Considering the necessity of prompt adjustment of coagulation conditions by operators in WTPs, faster methods for optimizing EC conditions are required. The response surface methodology (RSM), as a more rapid and feasible statistical design of experiment (SDE), has been propitiously used in earlier studies to investigate the effect of multiple operational factors for coagulation and to minimize coagulant dosage. Table 1 summarizes the studies performed in the last 20 years to develop predictive polynomial equations and enhance operational conditions (i.e., minimized dosage and maximized DOC removal) in WTPs using synthetic and natural water samples. The optimization of dosage and pH in investigations on natural waters resulted in a coagulant dosage of 5.85 to 26.26 mg/mg DOC and a DOC removal of 34.3–75.0% by alum (Park et al., 2000; Trinh and Kang, 2011; Beauchamp et al., 2020). Up to 67% DOC could be removed by applying ferric chloride at an optimized dosage of 24.59 mg/mg DOC by considering the following factors: DOC, ferric chloride dosage, chlorine dosage, and disinfection time (Uyak and Toroz, 2006). One of the most famous approaches suggested by the U.S. EPA requires the water samples with specific characteristics to increase the coagulant dosage to the “point of diminishing return” (PODR), wherein the ratio of TOC removal and coagulant dosage (i.e., alum) is more than 0.3:10 during jar testing (EPA, 1999). To overcome the laboriousness of the EPA's suggested method, a recent study by Beauchamp et al. (2020) on alum dosage and UV254 of raw water, showed that a 180 mg alum cm/L dose of alum/UV254 reflected the PODR in EC. This presents a promising and faster technique for reducing DOC up to 75%. Nevertheless, most of the research studies to date have made an effort to reduce the surrogate parameters of DOC and UV254; however, the number of research studies on EC that have been performed by measuring THM4 and HAA5 is limited.
Summary of Studies on the Mathematical Models of Disinfection Byproducts and Organic Carbon in Enhanced Coagulation
CCD, central composite design; CD, coagulant dosage is calculated in mg/mg DOC from the literature; DOC, dissolved organic carbon; HAA, haloacetic acid; N/A, not available; PACl, poly aluminum chloride; PFC, poly ferric chloride; R, removal efficiency for DOC; RSM, response surface methodology; SUVA, specific ultraviolet absorbance; THM, trihalomethane; TOC, total organic carbon; UV, ultraviolet.
The results of the research studies obtained so far illustrate that the effectiveness of coagulation in NOM removal depends on various factors, such as NOM properties, pH, type of coagulants and their dosage, water temperature, UV254, and the level of specific ultraviolet (UV) absorbance (Jeong et al., 2014; Agbaba et al., 2016; Beauchamp et al., 2020). In addition, other factors, such as a fast mixing rate and settling time, are essential in the coagulation-flocculation–settling (CFS) process (Teh et al., 2016). Rapid mixing is the second-highest power consumption unit in WTPs in the United States, with an energy requirement of 0.008–0.022 kWh/m3 from a power utilization total of 0.18–0.48 kWh/m3 (Plappally and Lienhard, 2012). Due to the effect of mixing conditions on energy consumption and floc size (BinAhmed et al., 2015; Vadasarukkai and Gagnon, 2017), the standard jar testing method of D2035-19 (ASTM, 2019) involves the optimization of stirring conditions as well as the parameters of coagulants and pH that the U.S. EPA mandated in 1999.
Thus far, no comprehensive study has attempted to assess the interacting effects of pH, dosage, coagulant type, fast-mixing speed, and settling time on the EC process in relationship to the THM4 and HAA5 reduction. The empirical data from such a study would identify the most significant variables for reducing HAA5 and THM4 during EC, which in turn would assist in modifying the operational conditions, thereby reducing costs in WTPs, and decreasing the adverse health effects of DBPs on residents.
Addressing this research gap, the current study presents an investigation on the removal of NOM via EC to fulfill the following objectives: (i) identify and compare the optimal conditions for decreasing THM4, HAA5, and DOC by assessing the effect of five factors, namely pH, coagulant type, dosage, and mixing speed, and settling time in EC; (ii) improve optimal conditions required for EC in WTPs by decreasing power intensities and minimizing coagulant dosage; and (iii) utilize the fractional factorial and central composite design (CCD) to decrease the number of jar testing experiments and subsequently develop predictive mathematical models for the reduction of DBPs and DOC in EC, with the aim of efficiently changing operational conditions in WTPs in NL.
Materials and Methods
Preparation and procedures
Only reagent-grade chemicals were used in this study. The jar tests were performed using aluminum sulfate (Thermo Fisher Scientific, Canada) and anhydrous ferric chloride (VWR, Canada). DBPs formation potential tests were conducted by dosing the samples with chlorine and holding for 72 h; this was achieved by adding 30% sodium hypochlorite solution, such that the residual free chlorine remained within 0.05 to 2.50 mg/L after contact time. The initial dosage of chlorine on the raw and treated samples was chosen based on the chlorine demand method D1291-17 (ASTM D 1291-17, 2017). The residual free chlorine was quenched using ammonium chloride at a concentration of 100 mg/L of sample before extraction of DBPs. THM4 and HAA5 samples were extracted in methyl tert-butyl ether according to the U.S. EPA methods, as described in the Supplementary Information section S.2.1.
The NOM in the water samples was characterized and fractionated based on its acidity and hydrophobicity. Four fractions of NOM, that is, very hydrophobic acid (VHA), slightly hydrophobic acid, charged hydrophilic, and neutral hydrophilic (NHI), were detected based on their adsorption to the resins according to the rapid fractionation technique used in previous studies (Chow et al., 2004; Vieira et al., 2012). Figure 1 presents a schematic of the steps and experiments. Detailed procedures for preparing the coagulation-flocculation and sample analysis are presented in the Supplementary Information section S.2.
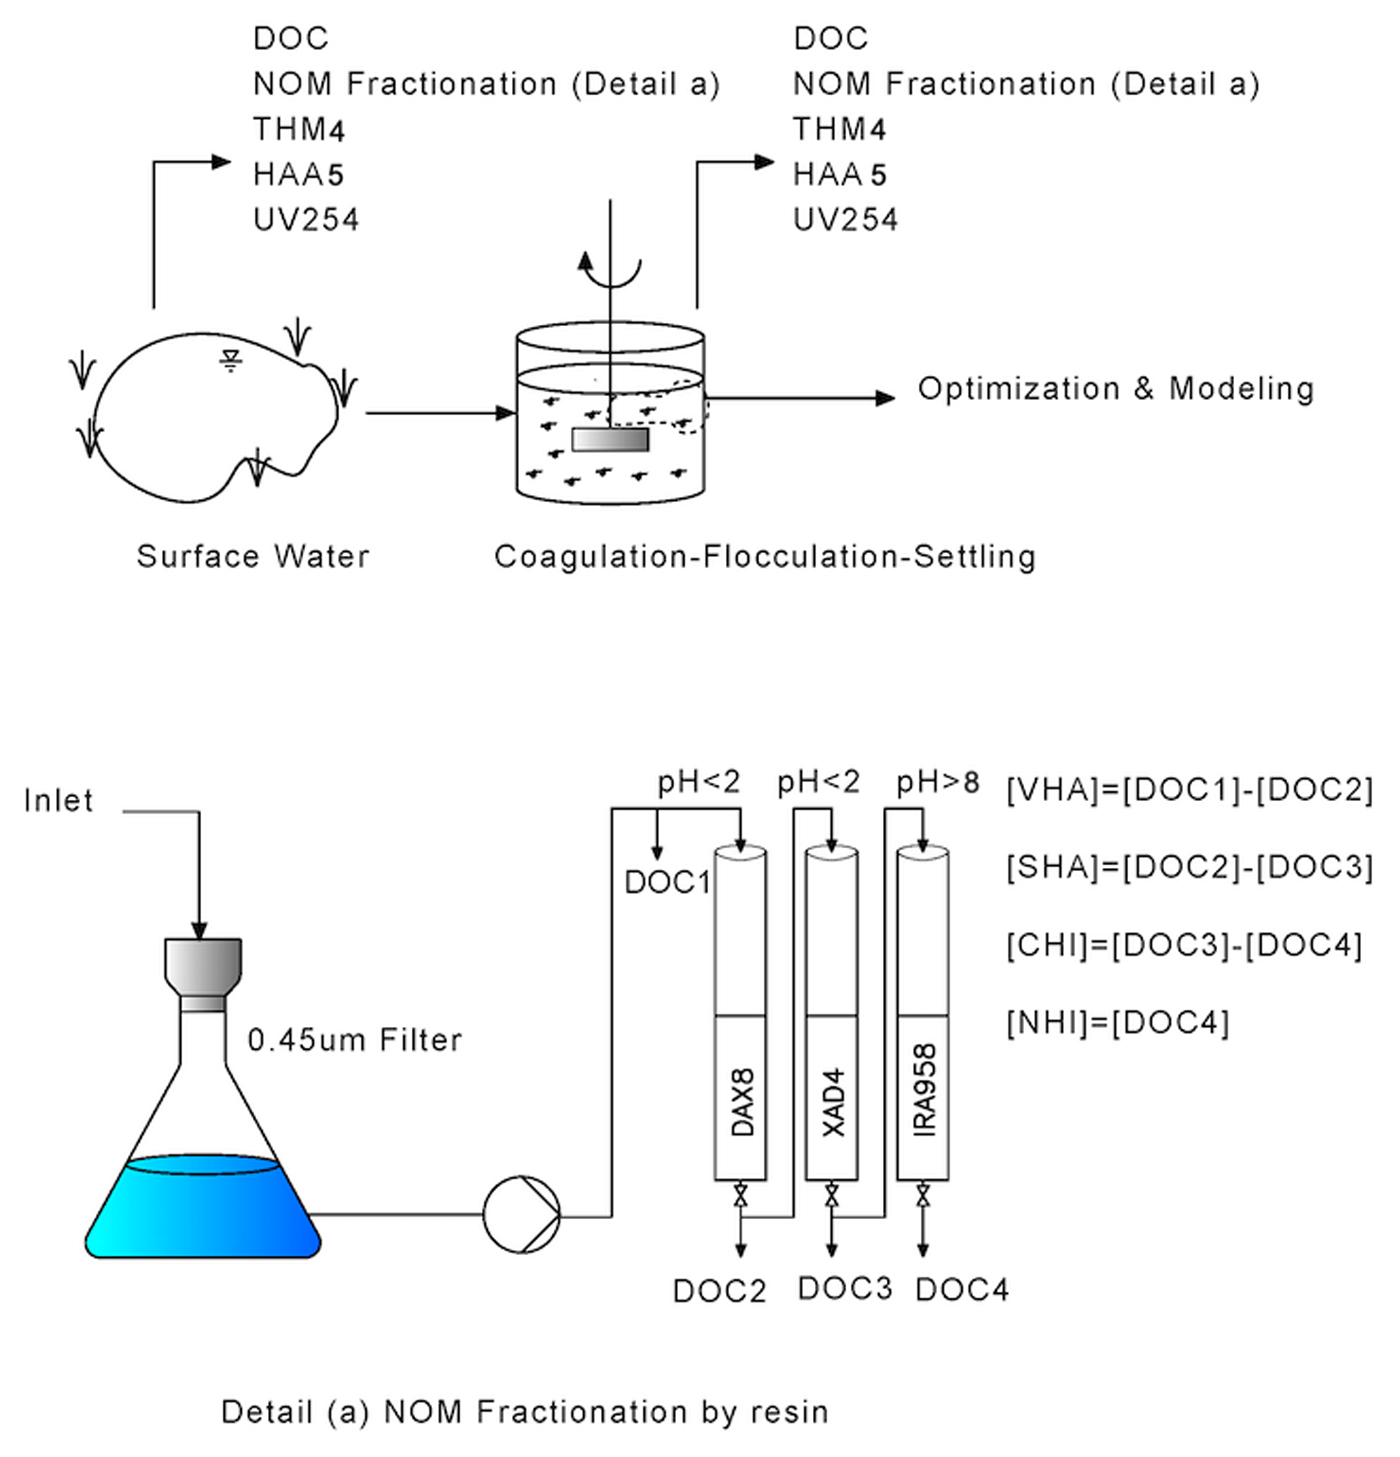
Schematic presentation of the experiments.
The reduction and removal efficiencies (R, %) of the parameters were calculated as follows:
where Ci is the initial level (mg/L) of the targeted parameter in the untreated water and Cf is the final value of this parameter in the treated water.
Water sampling
Two surface water sources, where drinking water for Pouch Cove and Sunnyside (NL, Canada) towns originate from, hereafter referred to as Water 1 and Water 2, respectively, were explored in this study. The water samples were selected based on the DOC levels and NOM fractions throughout 1 year of sampling from August 2016 to August 2017. The samples were analyzed for pH, DOC, NOM fractionation, THM4, HAA5, and UV absorbance at a wavelength of 254 nm. Table 2 summarizes the characteristics of the water samples. The levels of HAA5 and THM4 were more than the MCLs mandated by Health Canada and the U.S. EPA. This is because, in this study, the method of DBPs formation potential within 72 h was chosen to understand the variations of the subjected parameters better. Four other water samples were used to validate the produced statistical models, and their characteristics are presented in Supplementary Table S.5.
Raw Water Characterization
Specific UV absorbance at a wavelength of 254 nm (SUV254): 100 × (UV254/DOC mg/L).
CHI, charged hydrophilic; NHI, neutral hydrophilic; SHA, slightly hydrophobic acid; VHA, very hydrophobic acid.
Statistical design of experiments
The SDE for the mathematical modeling and optimization includes the following steps: (i) recognition of factors and levels; (ii) designing of the run sheet via concurrent alteration of all independent variables; (iii) analysis of the results and establishment of the regression models; (iv) examination of the adequacy of the model and curvature in the linear analysis; (v) extension to RSM design (if necessary); (vi) validation of the model accuracy; and (vii) projection of the optimized condition.
Choice of factors and levels
The independent variables, that is, pH (X1), coagulant dosage (X2), coagulant type [X3; defined as Fe/(Fe + Al)], speed of fast mixing (X4), and settling time (X5) were selected for investigating the DOC removal, THM4 and HAA5 reduction, and UV absorbance at 254 nm. The coagulant type was considered a numerical factor to minimize the experimental runs for developing a time efficient method. Table 3 presents the actual and coded levels of the factors. The minimum and maximum values (−1 and +1) were selected based on the possibility of maintaining an extension to −α and +α in the RSM design.
Actual and Coded Levels of the Variables
A preliminary study was conducted to determine the dosage of the coagulants and their ratios. The injection dose was estimated based on the initial experiments with 1–15 mg/mg DOC, corresponding to 0.015–0.75 mmol metal/mg DOC and a pH of 5.5–7.5 (Davis and Edwards, 2017), a fast-mixing speed of 120–210 rpm for 60 s (BinAhmed et al., 2015), a settling time of 20–60 min (Rizzo et al., 2005; Zhao et al., 2013; Jeong et al., 2014), and flocculation at 25 rpm (van Leeuwen et al., 2005) for 25 min.
Design procedure
The ability to point out clear effects with a small number of tests is crucial for choosing a test design. The number of runs in SDE can be reduced as long as the design's resolution remains satisfactory and the main effects and two-factor interactions are aliased with high-order interactions (Chen et al., 2017). A half fractional factorial design
To present a correlation between factors and responses in a linear model, a polynomial equation [Eq. (2)] can be used:

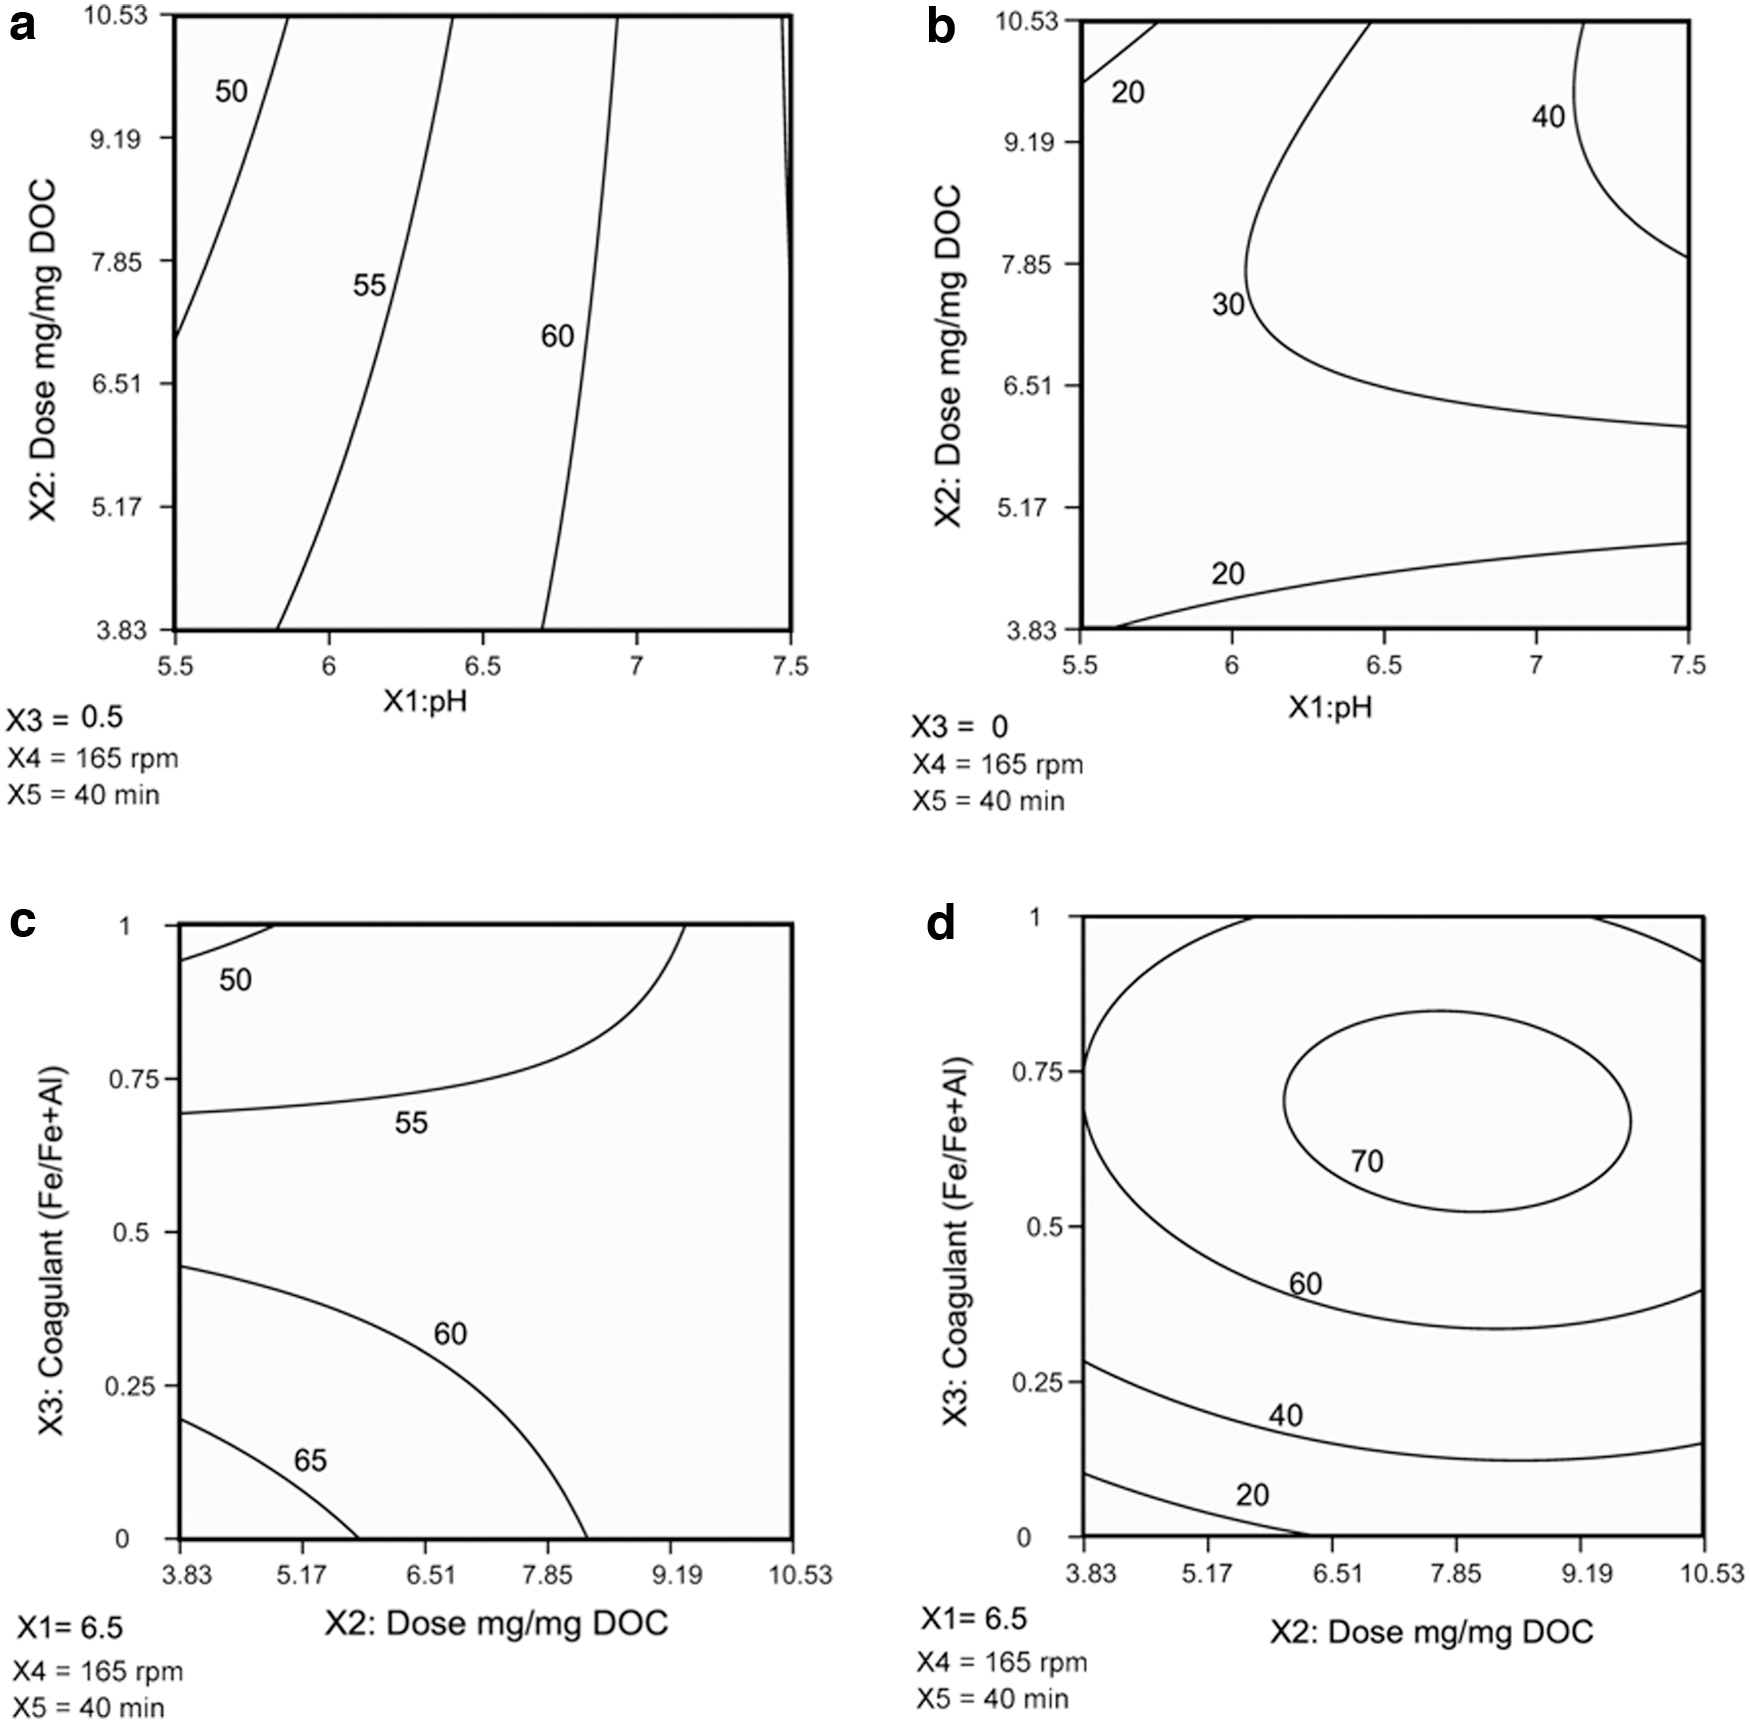
where Y is the predicted value for the responses, that is, DOC removal, UV254, HAA5, and THM4; β0 is the constant coefficient; β i is the linear coefficient of regression; k is the number of factors (k = 5 in this study); and X is the effective factor for the response, Y. The RSM can fit a second-order quadratic model to the data according to Equation (3) below (Montgomery, 2013).
Estimation of the coefficients and similitude analysis were carried out via an analysis of variances (ANOVA) using the backward elimination of insignificant factors (p > 0.10) with the Design-Expert (2017) (version 10.0.8.0), This software was also used for the contour maps and overlay plots of optimal conditions.
Results and Discussion
Experimental results
The experimental results for the responses of the DOC, HAA5, THM4, and UV254 for Water 1 and Water 2 are presented in the Supplementary Tables S.2 and S.3. The ANOVA results (Supplementary Table S.4) showed a significant curvature term in the polynomial equations for Water 2. Consequently, the test extended to an RSM-CCD, and the results for 12 designed experiments of RSM are reported in Supplementary Table S.3.
ANOVA and fitted models
A mathematical model was fitted to the data for each of the responses, thereby relating the response to a function of the effective variables. The confidence interval for the test was 90% in this study; therefore, for all the generated mathematical models, the significant terms with p-value <0.10 were included in the regression. In this study, the data were appropriately fitted to the models, and an insignificant lack of fit, with a p-value >0.10, was obtained for each model, as presented in Supplementary Information section S.3 (Supplementary Table S.4). The center points in the experimental design assessed the curvature. The p-values for the curvature term in all the dependent responses for Water 2 were <0.05. Thus, further investigation, with an extension to the RSM, was performed for Water 2. Three terms were used to examine the fitted models' precision at predicting new data: R2, R2adjusted, and R2predicted. The models' ability to predict new points was assessed via R2predicted and R2adjusted, where no substantial difference (difference >20%) was observed, indicating the goodness of fit of the developed quadratic and polynomial regression models. Further information on the produced models' prediction ability is presented in the Supplementary Information section S.3.
The models' adequacy was assessed with prerequisite assumptions for the ANOVA, including the normality of residuals, independence of the runs overtime, and homogeneity of the residuals' variance. All the models were adequate, and the normality of the data was demonstrated for all of them; normal plots of the residuals are presented in sections S.4 and S.5 of the Supplementary Information.
The fitted regression models for four responses (DOC removal, UV254 reduction, THM4 reduction, and HAA5 reduction), in terms of the coded factors within the coded levels (−1,1) for Water 1 and Water 2, are as follows:
where the actual levels of the variables are subjected to the following conditions: 5.5
Effect of factors on DOC removal and UV254
Equations (4) to (7) are used to predict DOC removal and UV254 reduction in Water 1 and Water 2, respectively. The most effective model terms (p < 0.05) with highest coefficients of the coded factors in order of importance are type of coagulant [i.e., ratio of Fe/(Fe + Al)] > dose-coagulant interaction > pH > coagulant dosage in Water 1 and
Effect of factors on DBPs reduction
Equations (8) and (9) describe the fitted models for THM4 reduction in EC. The ANOVA results indicate that the most significant factors (according to their regression coefficients) are pH, Fe/(Fe + Al), dosage, mixing speed, and settling time. The order of importance of the factors is:
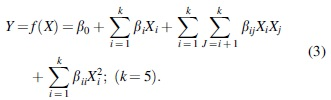
The results obtained from the interactions of dose-coagulant type and pH-coagulant type in two sets of experiments present two different coagulation mechanisms (i.e., charge neutralization and sweeping) that are defined by the operational conditions. The regression coefficients for the pH and dosage for Water 1 indicate that the pH positively affects THM4 reduction, while the coagulant dosage negatively impacts it. A high pH and low dosage of ferric chloride increased THM4's removal. The observed results agree with the obtained models of DOC removal in this study (Supplementary Information section S.6). The contour graph for the interaction effect of pH × Fe/(Fe + Al) on THM4 reduction (Fig. 2a) indicates that aluminum sulfate at a pH <6 results in the lowest removal (<50.47%) of THM4 in Water 1. Charge neutralization is the predominant process for NOM removal at pH <6.0 owing to the dominance of polymeric Al species over amorphous Al (OH)3 (i.e., the contributing compound to sweeping mechanism), which implies that the sweeping mode is more efficient in THM4 reduction than charge neutralization in both water samples.
Contour plot of the interaction effects for THM4 reduction.
The negative regression coefficients of mixing speed reveal that the low mixing speeds (i.e., 120 rpm) contribute more effectively to THM4 reduction. Mixing steps are necessary for producing metal (Al and Fe) hydroxide particles resulting in the removal of THM4 precursors in sweeping mode. However, the high power of mixing (i.e., higher velocity gradient than 190 s−1 in this study and increased mixing time) contribute to the break of the produced amorphous Al(OH)3 flocs that remove DOC in sweeping mode. The effect of the mixing speed on DOC removal was not statistically significant because the flocs were not critical for the regression models of DOC removal in this study as all undissolved flocs (i.e., >0.45 μm) were eliminated before testing by the TOC analyzer according to ASTM D 7573 (2013). On the contrary, the presence of unsettled flocs with particle size >0.45 μm influenced THM4. THM4 samples were unfiltered in this study. A study by Abeynayaka et al. (2012) on the performance of filtration systems after coagulation on DOC and THMs formation potential in full-scale and pilot-scale WTPs showed that the pore size in the filtration systems influences the removal of THM precursors. THMs level after sand filtration and ceramic microfiltration were 160 and 74 ppb, respectively. The results of Abeynayaka et al. (2012) show consistency with the current study (i.e., unfiltered and pore size: 0.45 μm). However, an investigation on the relationship between floc size in coagulation and THM reduction is recommended as an extension to this study.
The settling time positively affected THM4 reduction in Water 1, although with less significance than dose, coagulant type, and pH, in which sweeping was the primary coagulation mechanism. With longer settling times, the flocs become larger, and there was an increase in the contact time between the small, precipitated flocs, which increased the NOM removal in unfiltered water samples. In contrast, neutralization was the dominant process for DOC removal in Water 2, where the regression coefficients of the settling time and mixing speed had the lowest values among all variables during THM4 formation. In general, the regression coefficients in the fitted model for reducing THM4 in Water 2 were consistent with the respective values in the DOC removal model [Eq. (8)]. However, the settling time negatively affected THM4 reduction in Water 2. Previous studies by Vieira et al. (2012) showed that the structure, molecular weight, and molecular size of NOM compounds influence the efficacy of treatment processes and the type of DBPs produced. Their study showed that small to intermediate humic acid molecules were more prone to generating THM4 than larger molecules. Longer settling time increases the hydrolysis of large NOM molecules (such as NHI), leading to their disintegration into smaller molecules, as was proved in a previous study by Alfaro et al. (2016) as well and observed in our results. NHIs are more prone to forming THM4 after EC and cannot be easily removed compared to hydrophobic compounds with higher molecular weights. Thus, as observed in this study, low mixing energy (i.e., stirring speed of 120 rpm that equals velocity gradient of 190 s−1) and shorter settling time (i.e., 20 min) depending on the predominant mechanism of coagulation influenced the level of THM4. The results of this study are in agreement with observations by BinAhmed et al. (2015), where the largest and strongest flocs in EC were produced at a fast-mixing speed of 120 rpm for 60 s of mixing and contributed positively to the removal of THM4 precursors. Further, the study by Vadasarukkai and Gagnon (2017) showed that excessive energy consumption at the fast-mixing stage of EC does not contribute to the DOC removal for humic acids.
The regression models for reducing HAA5 [Eqs. (10) and (11)] indicate that the variables of pH, dose, mixing speed, Fe/(Fe + Al), and settling time have a substantial effect on reducing HAA5 during EC. The order of importance of factors in Water 1 is:
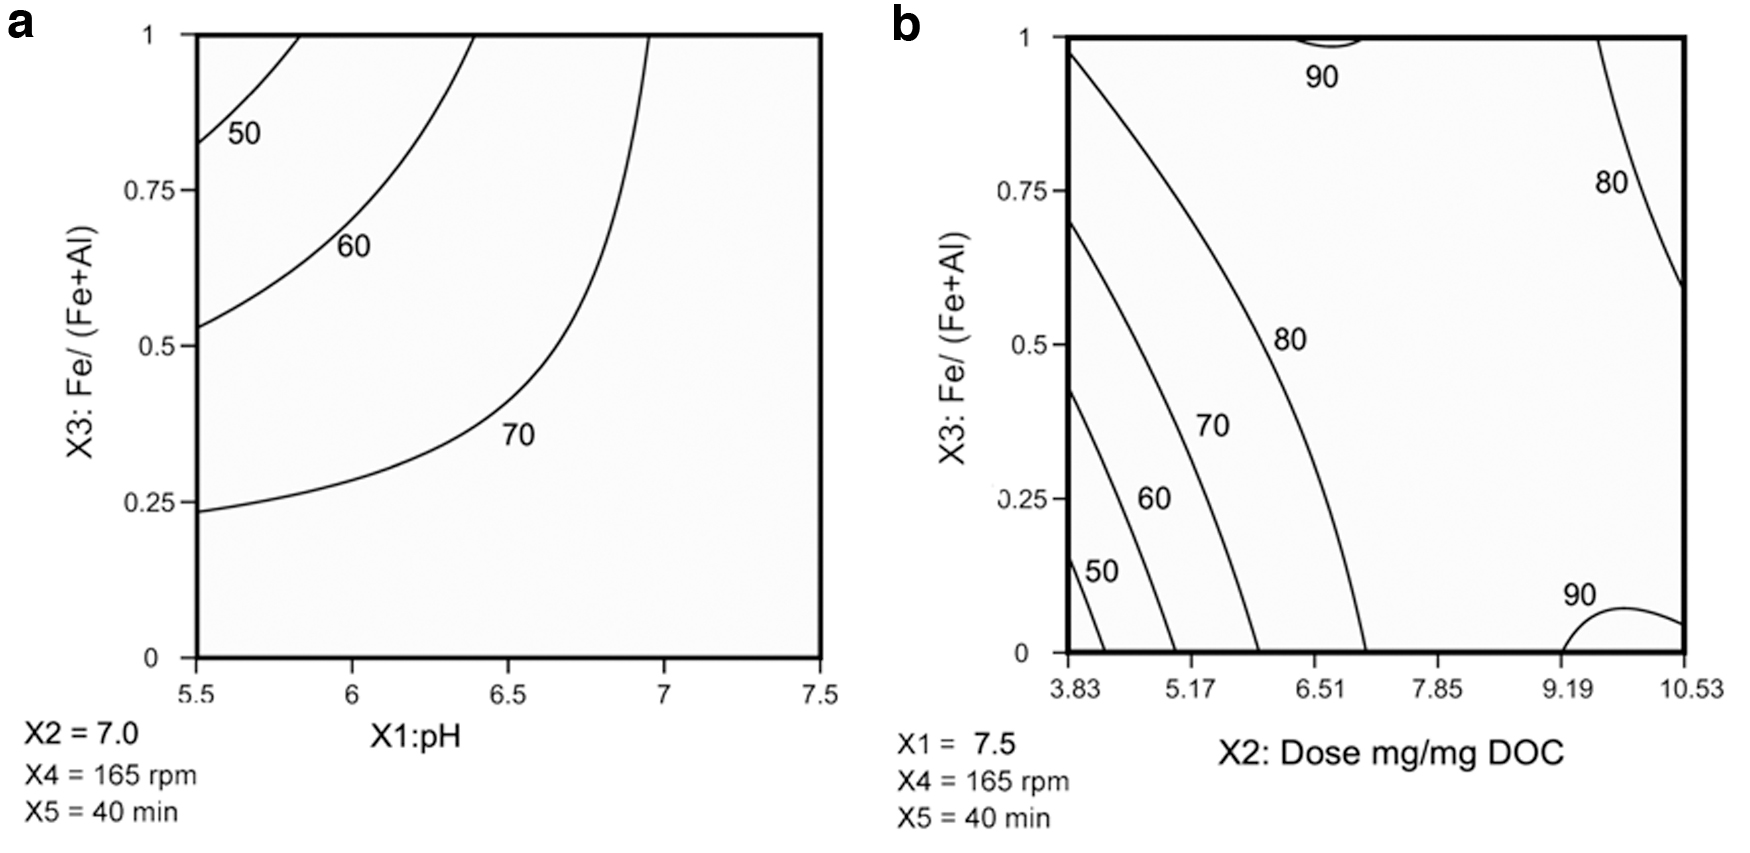
In terms of the pH, a higher pH positively affects the removal of HAA5 (Fig. 3a, b). The highest levels of HAA5 reduction, that is, 68% and 80% for Water 1 and Water 2, respectively, were obtained at higher pH levels. A considerably steep increase in the removal of HAA5 occurred at a pH >7.5 and dose >9.20 (mg/mg DOC) in Water 2 (Fig. 3b, d). Observations by Lekkas and Nikolaou (2004) showed that the pH had a positive impact on the formation of HAA5. However, a review by Ged et al. (2015) on 87 developed models for HAA5 and THM4 generation during the chlorination process in previous studies did not show any specific relationship between the production of HAA5 and pH. In terms of the dosage, a high dosage of coagulants increases the available amorphous metal hydroxide at a basic pH for entrapping NOM, which is consistent with the results of DOC removal in a study by Alfaro et al. (2016) that is described in detail in the Supplementary Information section S.6. The mixing speed and settling time negatively affected the decrease in HAA5 in Equations (10) and (11).
Contour plot of the interaction effects for HAA5 reduction.
The interaction effect that the dose-coagulant type (Fe/Fe + Al) has on HAA5 reduction is presented in the contour plot (Fig. 3c). For HAA5 removal in Water 1, the optimum dosage was <5.17 and the ratio for Fe/Fe + Al equals to zero. Thus, a low dosage of aluminum sulfate at a high pH removes the HAA5 precursors in Water 1, which is consistent with the observed results of DOC removal in the sweeping process (see Supplementary Information section S.6). The contour plot of HAA5 reduction for the dose-coagulant type (Fig. 3c, d) illustrates that higher pH values (pH >7.5), 0.75 < Fe/Fe + Al <1.0, and 6.51 < dosage <9.19 (mg/mg DOC) led to the maximum removal of HAA5. Similar results were obtained in the contour plots and fitted models of DOC removal. The developed models for HAA5 in both water samples revealed that the levels of pH, dose, coagulant type, fast-mixing speed, and settling time play a crucial role in DBPs removal in EC that have not been investigated thus far. The results of this study prove the necessity of investigation of EC contributing to THM4 and HAA5 production before filtration rather than relying only on the observations of DOC measurements.
Validation and optimization
EC is an economical process for the removal of DOC and DBPs. However, to prevent excessive consumption of coagulants and, consequently, to avoid producing a large amount of sludge, optimization is necessary. Moreover, taking into account the power intensiveness of the fast-mixing stage, a reduction in this unit's energy consumption can be financially beneficial for the WTPs. Therefore, undertaking a multivariate optimization of EC to minimize coagulant dosage and mixing speed and higher DBP removal (i.e., maximization of HAA5 and THM4 reduction) is desirable. The optimal operational conditions for the individual responses were found through a desirability function using the Design-Expert (2017) software by using the produced mathematical models. The results of optimization revealed that the minimization of DOC, THM4, and HAA5 occurs under different operational conditions, as visualized in the overlay plot (Fig. 4a, b). The highest desirability for the maximum removal of THM4 and HAA5 occurs at coagulant doses as low as 3.83–5.95 mg/mg DOC, while the optimization based on DOC removal without considering fast-mixing energy and settling time results in coagulant doses of 6.51–7.85 mg/mg DOC. Thus, a reduction of 23.8–41.1% in coagulant dosage can be achieved by multivariate optimization of all five factors influencing DBP reduction compared to the optimization of only coagulant dosage, pH, and coagulant type for DOC removal.
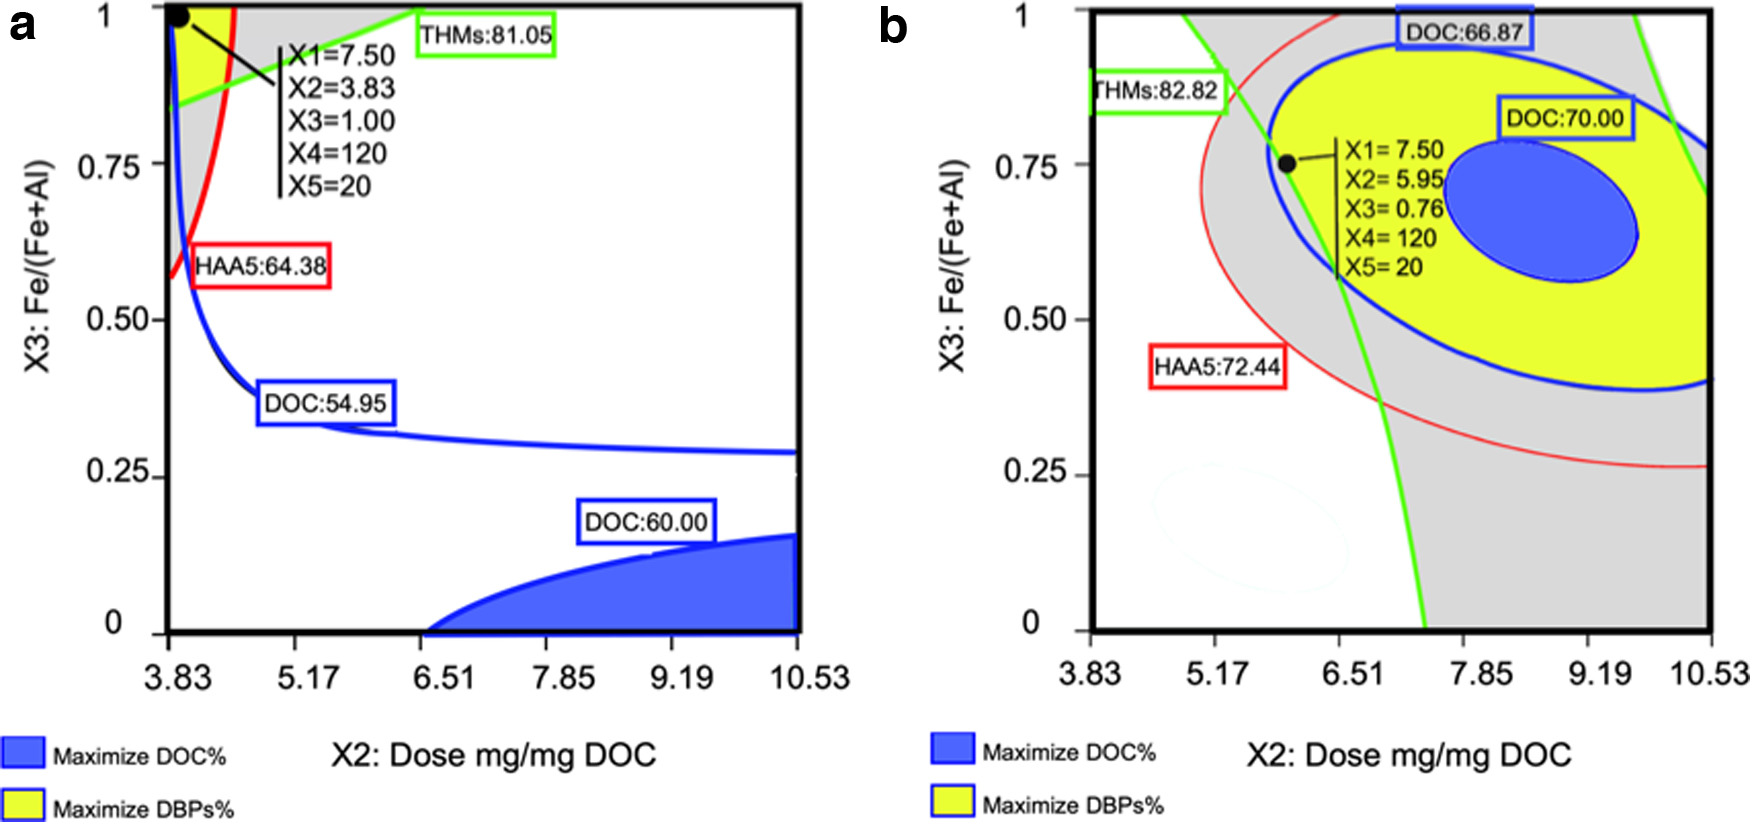
Overlay plot for maximizing DOC, THM4, and HAA5 reduction.
The predicted optimal conditions, that is, not used in model training, were validated on six water samples. The characteristics of Water 1, Water 2, and four other water samples, including two from natural sources in New-Wes-Valley, NL, and two synthetic water samples using humic acids and polysaccharides, are presented in the Supplementary Table S.5. The generated mathematical models were used to predict the DOC, HAA5, and THM4 values, which had a maximum removal of 67.31% for DOC, 78.14% for HAA5, and 84.00% for THM4 at pH = 7.50, dose = 5.95 mg/mg DOC, Fe/Fe + Al = 0.76, stirring rate = 120 rpm, and settling time = 20 min.
For Waters 3 to 6, a maximum DOC removal of 44.98–89.48% was achieved, and the THM4 reduction ranged from 68.38% to 94.00%. The highest error was observed in the results obtained from Waters 5 and 6, ranging from 33.18% to 32.94% for DOC removal, 12.41–18.95% for THM4 reduction, and 13.63–41.75% for HAA5 reduction. In contrast, Waters 1, 2, 3, and 4 exhibited low error levels (<10%) in predicting DBPs reduction. The maximum removals of 91.00%, 72.64%, and 70.79% of THM4, HAA5, and DOC were obtained, respectively, in natural waters (Supplementary Table S.6). The coagulant dosage obtained in previous studies using alum was 5.85 to 26.26 mg/mg DOC as presented in Table 1. Our results present a minimum dosage of 3.83–5.95 mg/mg DOC for DBPs reduction, which is in a lower range compared with the reported investigations. The results obtained from Beauchamp et al. (2020) using alum at a concentration of 5.85 mg/mg DOC showed a maximum HAA6 and DOC reduction of 95% and 75%, respectively. However, the coagulant dosage for other coagulants (e.g., ferric chloride) was not evaluated in their research.
Figure 5a–c presents a schematic of the observed results of the reduction for DOC, HAA5, and THM4, contributing to the deviation of the hydrophobicity in the water samples from reference water (i.e., Water 2) and the error of the predictions. The hydrophobicity variations (i.e., VHA difference) and prediction error of the samples were calculated as follows:
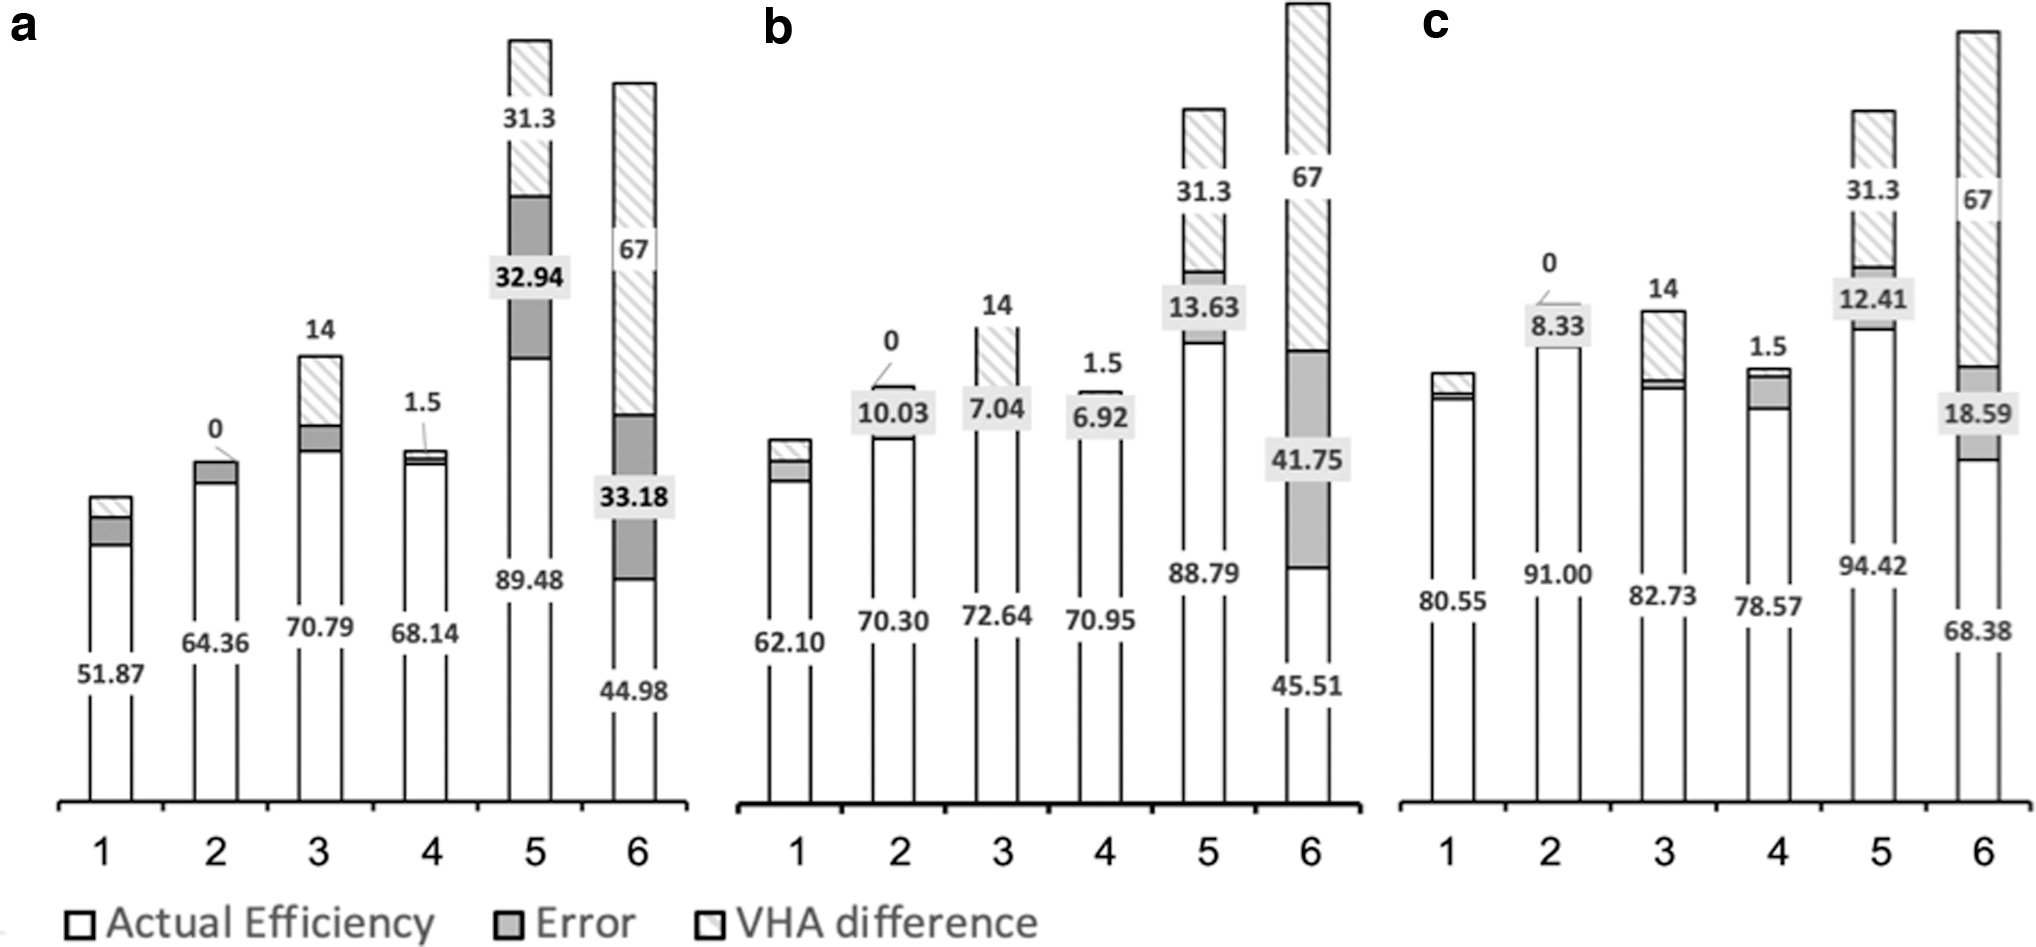
A schematic of the correlation between measured responses, prediction error and VHA differences in
where VHAref denotes the VHAs' fraction of the reference water sample; DOCref is the DOC content of the reference water sample in modeling; VHA and DOC are the VHA and DOC content of the water samples used in validation, respectively (i.e., Water 1 to Water 6); Rp is the predicted value for responses using the statistical model, and Ra is the natural value of the observed response under laboratory conditions.
The natural values of the responses under laboratory conditions show that the actual DOC removal and DBP reduction were close to the values predicted by the mathematical models at optimal conditions for the samples with similar hydrophobicity to Water 2 (VHA difference: 0–14%). The highest prediction error levels are observed in all three models of DOC, THM4, and HAA5 in the synthetic water samples. VHA was the predominant fraction of NOM ranging from 67.05% to 81.16% in the natural water samples. In contrast, Water 5 was prepared using humic acids (VHA/DOC: 0.98), which possess extreme hydrophobic properties, and polysaccharose, that is, a NHI NOM, was the main component of Water 6. Thus, the results of this study might be used for optimal operation of pilot-scale and full-scale WTPs with sources of water with similar hydrophobicity (VHA/DOC of 0.67–0.81) with anticipated error <10%. However, pilot-scale and full-scale WTP studies are suggested to advance this research further.
The results of this study are in agreement with the research by Alfaro et al. (2016) in terms of the correlation of hydrophobicity and DOC removal in the EC process. Alfaro et al. (2016) found that DOC removal was correlated to NOM hydrophobicity and VHA/NHI fraction. The maximum DOC removal of 82.8–90.5% was achieved for a VHA/NHI: 100% with a coagulant dosage ranging from 21.92 to 40.51 mg/mg DOC in their study. The DOC removal for Water 5 with similar characteristics in our study shows the same removal efficiency with a lower coagulant concentration (dose: 5.93 mg/mg DOC).
The optimal operating conditions in Table 4 indicate that the lower settling time and fast-mixing speed (20 min and 120 rpm, respectively) contributed to the maximum removal efficiency of DBPs, which agrees with the observations in Effect of Factors on DBPs Reduction section.
Optimization Results for the Maximum Removal of Dissolved Organic Carbon, HAA5, and THM4
An analysis of the velocity gradient and power reduction is presented in section S.9 of the Supplementary Information. The velocity gradient in the current study was calculated as 190 s−1, referring to the samples' volume and the G curve provided by the manufacturer of the jar testing device. The U.S. EPA suggests a velocity gradient of 300–1000 s−1 for proper mixing and a settling time of 30–60 min (EPA, 1999). The results obtained in the current study show that a reduction of fast mixing velocity gradient from 300 to 190 s−1 contributed to the reduction of THM4 and HAA5 and reduced the power consumption in fast mixing units by 59.88%, as estimated in Supplementary Information section S.9. Excessive power consumption for mixing and a settling time >20 min could adversely affect the reduction of THM4 and HAA5.
Reductions in the coagulant dosage and fast mixing intensiveness can improve the cost efficiency of EC operations at WTPs. A hypothetical WTP with an average flow of 1 m3/s has been used to evaluate the cost reduction due to power reduction and dosage optimization. The results are reported in Supplementary Tables S.7 and S.8. As a result, optimization for DOC removal and DBPs reduction contribute to 7.81 and 5.95 mg/mg DOC of coagulant dosage, respectively. A dosage reduction from 7.81 to 5.95 mg/mg DOC at Fe/Fe + Al of 0.76 mol/mol contributes to a cost-cutoff of 194,920.25 CAD. The decrease in the velocity gradient of fast mixing unit contributes to a cost reduction of 4,198.00 CAD. Thus, the financial benefits from both adjustments equal a total saving of 198,478.25 CAD per annum in a typical WTP.
Summary
This study aimed to enhance the effectiveness and cost efficiency of EC for the reduction of DBPs in natural waters of NL via multivariate optimization and by using predictive statistical models. The principal results of the experiments in this study are as follows:
Fractional factorial and CCD are effective methods for investigating the coagulation process, which reduces the number of jar test runs and assists the operators in saving time for operational conditions adjustment. Furthermore, multivariate optimization on DBPs removal reduces the coagulant dosage, energy consumption by fast mixing, and settling time. HAA5 and THM4 were affected by the following variables: pH, dose, coagulant type (Fe/Fe + Al), fast-mixing speed, and settling time. The optimal operational conditions for maximizing DBPs reduction and decreasing coagulant dosage were as follows: a pH of 7.5, dosage of 3.83–5.95 mg/mg DOC, Fe/Fe + Al of 0.75–1.00, fast-mixing velocity gradient of 190 s−1, and a settling time of 20 min. The models of THM4 and HAA5 reduction established acceptable predictability (error <10%) under the optimized operation conditions in water samples with a VHA/DOC ratio of 0.67 to 0.81 (with similar hydrophobicity levels to Water 1 and Water 2).
This study showed that the models used thus far for the reduction of THM4 and HAA5 have not considered crucial parameters, such as the settling time and fast-mixing speed during EC. These factors contribute to improvements in the efficiency of the EC process for water treatment systems by (i) decreasing the level of DBPs and NOM; (ii) decreasing the possible health risks for residents as a result of lowering the DBPs level; (iii) minimizing the chemical consumption during EC and energy consumption at the fast-mixing stage, thereby benefiting the environment; and (iv) aiding in lowering the operating costs of WTPs.
The results of this research can be utilized for the optimization of operational conditions needed for EC in WTPs with water sources containing hydrophobic NOM (VHA/DOC = 0.67–0.81). The generation of an inclusive model for DBPs reduction of all water samples in CFS processes requires further studies to include variations in VHA/DOC levels (e.g., VHA/DOC: 0.2–0.4 and 0.4–0.6).
Footnotes
Acknowledgments
The authors express their gratitude to the Natural Sciences and Engineering Research Council of Canada (NSERC) and Industry, Energy and Technology (IET) for their support! The authors are also grateful for the Core Research Equipment and Instrument Training Network (CREAIT) liaison at the Memorial University of Newfoundland.
Author Disclosure Statement
The authors certify that they have no involvement or affiliation with any organization or entity with any financial or nonfinancial interest in the topic investigated in this study.
Funding Information
This study was financially supported by the National Center of Science and Engineering Research Council, Discovery Grants, Canada (Grant No. 210412), and the School of Graduate Studies (SGS) at the Memorial University of Newfoundland.
References
Supplementary Material
Please find the following supplemental material available below.
For Open Access articles published under a Creative Commons License, all supplemental material carries the same license as the article it is associated with.
For non-Open Access articles published, all supplemental material carries a non-exclusive license, and permission requests for re-use of supplemental material or any part of supplemental material shall be sent directly to the copyright owner as specified in the copyright notice associated with the article.