




Abstract
Research interests in the node cities along the Belt and Road have been increasing since the Belt and Road Initiative was proposed in 2013. Most of the existing studies tend to analyze the Belt and Road Initiative qualitatively, either regard a single node city as the subject, or take one aspect of the node cities into consideration. However, we select 10 inland node cities as our study subjects and quantitatively evaluate them from 2009 to 2018, based on the definition of node cities, theory of comprehensive carrying capacity, and a set of evaluation methods. In our article, we first defined node cities and explained why the 10 inland node cities were chosen. And then we set up an evaluation index system with 5 subsystems, 25 indicators (10 unique indicators for the Belt and Road), which were estimated with the application of analytic hierarchy process method, principal component analysis method, improved entropy, and multiobjective linear weighting function method. We made some progress in the entropy method, which was not limited to calculate a single city's weight at a specific time, but 10 node cities with 10-year-time span. Finally, we analyzed the evaluation results and made some policy suggestions. Our quantitative and systematic studies can not only fill the previous global and local theoretical gaps to some degree, but also provide some valuable theories and measures for the government and practitioners in the country to solve the problems encountered by Chinese node cities during their contribution to the building of the Belt and Road.
1. Introduction
In March 2015, Chinese government issued the Vision and Actions on Jointly Building Silk Road Economic Belt (the Belt) and 21st-Century Maritime Silk Road (the Road), in which the Belt and Road would focus on jointly building a new Eurasian Land Bridge and developing China–Mongolia–Russia, China–Central Asia–West Asia, and China–Indochina Peninsula economic corridors by taking advantage of international transport routes, relying on core cities along the Belt and Road. Therefore, the core cities were the main force to contribute to the building of the Belt and Road, and at the same time the Belt and Road Initiative would supply unprecedented opportunities for the core cities to develop profoundly. According to the core cities' roles and functions along the Belt and Road, the core cities have been also called node cities in Chinese literatures (Liu et al., 2016, 2020; Zhao et al., 2018).
Theory of node city was first proposed in The Image of the City written by Kevin Lynch (American architect) (Kevin, 1960), in which node city was one of the five elements of the city. And then Castells Manual (American sociologist) (Castells, 1996) proposed that the development of node cities would depend on their position in the global network. In this article, we define node cities as those cities with key transportation, trade, logistics, culture, science and education centers in their region. In other words, these node cities can speed up the development of their regional cities, and contribute to the building of the Belt and Road simultaneously. Therefore, it is essential and significant to study them. The node cities can be divided into inland node cities and coastal node cities. On account of the different characteristics between them, we only discuss inland node cities in our article this time.
Inland node cities are crucial parts of the Belt, which includes tens of different node cities. However, we select 10 inland node cities (Xi'an, Zhengzhou, Hefei, Wuhan, Nanchang, Changsha, Chongqing, Chengdu, Lanzhou, and Xining) as our study subjects for the reasons explained as follows.
First, only the 10 inland node cities selected have been positioned as the Inland Opening-up Economic Highlands in the Vision and Actions (An, 2016; Zhong and Zhang, 2018), which are typical to be studied.
Second, the 10 inland code cities play an important role in the building of the Belt and Road. Actually, the Belt and the Road are connected through the YangtZe River Economic Belt, which is one of the fastest growing UAs in the world (Tian and Sun, 2017; Zhao et al., 2018). Most of the 10 inland node cities are located in or close to the YangtZe River Economic Belt.
At last, the 10 inland node cities are located in the middle or the west of China, according to China's Western Region Development Strategy (2000) and Master plan for the new land and sea corridor in the west (2019), the economic development of the western region is relatively backward, the Per Capita gross domestic product (GDP) is only two-thirds of the national average level, <40% of the average degree in the eastern region.
As a result, it is essential to study the present status of the selected representative inland node cities and make some policy suggestions to push them to keep up with the cities in the eastern region.
International studies on the node cities along the Belt and Road have tended to be macroscopic and strategic (Lu et al., 2020). National studies on the node cities have been more related to the node cities' competitiveness (Tang and Xu, 2016; Zhong, 2019; Zhang, 2019), transport development (Kou et al., 2018; Chen et al., 2020), economic development (He et al., 2017; Zou., 2017; Zhao, 2018), or single-node-city studies (Tang, 2016; Han, 2020). In a word, most of the existing research studies rarely take all aspects of node cities' development into consideration (Cheng et al., 2015), or do illustrate the development status of the node cities quantitatively. Consequently, the theory of comprehensive carrying capacity is applied to our article.
Comprehensive carrying capacity is referred to taking all the related aspects such as economy, society, transportation, and environment into consideration, based on aggregate indicator values with the application of multiple methods (Liu, 2012; Weng et al., 2020). In this article, the study of comprehensive carrying capacity not only enables us to systematically know the all-round development status of each node city but also helps us to make quantitative comparison analysis of changes of the node cities before and after the Belt and Road Initiative is put forward.
Different from the previous qualitative analysis on the Belt and Road Initiative, either studies on a single node city or one development aspect of the city, we applied the theory of comprehensive carrying capacity, which could take all-round development aspects of the 10 inland node cities into consideration. In addition, according to the 10 node cities' functions and roles along the Belt and Road, we set up an index system and evaluated the indicators (including common indicators and unique indicators for the Belt and Road) quantitatively from 2009 to 2018 with the application of a set of methods.
These methods included the framework of analytic hierarchy process (AHP), principal component analysis (PCA), improved entropy, and multiobjective linear weighting function. Specially, we made some progress in the method of entropy, which was improved not limited to calculate a single city's weights at a specific time, but 10 inland node cities with 10-year time span. Furthermore, the evaluation results made us know the inland node cities better about their development advantages and disadvantages. Simultaneously, the evaluation results illustrated their future improvement directions along the Belt and Road. Therefore, our quantitative and systematic studies can both fill the previous theoretical gaps and make contributions to the regional development.
On the whole, the main contents of this article are as follows: an evaluation index system and a set of evaluation methods are described in Section “Methodology and Data Sources”; the comprehensive carrying capacity is calculated and analyzed in Section “Results”; the studies of this article are discussed in Section “Discussion”; in Section “Conclusions and Policy Suggestions,” we summarize the studies and propose some policy suggestions.
2. Methodology and Data Sources
In this article, we first explain the principles for index selection. Second, we set up an index system with the application of AHP because of its complexity and multilayer. Third, the questions that we study, the 10 inland node cities, 25 indices, and 10-year time series, are cross-sectional and static. Therefore, we use the PCA as an approach to solve the questions mentioned (Liu, 2012). At last, we apply the improved entropy and multiobjective linear weighting function to evaluate the comprehensive carrying capacity. The methods mentioned above are combined in our article, which help us build a systematical index system, to make dynamic and quantitative estimation of the indicators easy, and then to analyze different node cities at the same time.
2.1 Principles for index selection
On account of both space-dimension and time-dimension quantitative evaluation, we comply with the principles listed as follows: sustainability, integrity, maneuverability, and quantification (Liu et al., 2010; Zhang et al., 2020).
2.2 Construction of the index system
In compliance with the principles indicated above, based on the definition of node cities, the theory of comprehensive carrying capacity, functions, and roles played by the 10 node cities along the Belt and Road (Table 1), we take the aspects of economy, comprehensive transportation, society, resources and energy, ecology and environment into consideration, and then build the index system with 5 subsystems and 25 indices (Table 2) with the application of AHP (Chen et al., 2015). The index system is divided into four hierarchies (comprehensive target, subsystem, evaluative area, and indicator).
Introduction of the 10 Inland Node Cities Along the Belt and Road
Originated from National Urban System Planning 2005–2020. The national central city is the core city of the national urban system, which plays an important and central role in China's finance, management, culture, and transportation, and also plays an important portal role in promoting international economic development and cultural exchange.
The Comprehensive Carrying Capacity Evaluation Index System of the 10 Node Cities
GDP, gross domestic product.
2.2.1 Dimension of time
The year 2013 is the starting year when the Belt and Road Initiative was proposed, therefore we choose the dimension of time from 2009 to 2018, then we can make comparison of changes of the node cities before and after the Belt and Road Initiative is put forward.
2.2.2 Dimension of space
While we study the 10 node cities, we take a city as both an individuality and one of the research region's components into consideration (Egger, 2006).
2.2.3 Index system
The 10 inland node cities selected have both their own attributes and the unique functions for the Belt and Road. In general, economy (including trade and logistics) is thought to be the cities' basis to develop. Society covers a city's culture, science and education, which also pushes the city to development. Resources and energy can provide the cities with the land, water, coals, gas, etc. Ecology and environment particularly refer to the space closely related to human living and the pollution factors caused by human behaviors in this article. Simultaneously, we have to take the unique functions of the 10 inland node cities for the Belt and Road into consideration. Therefore, the indicators included in the index are divided into the common indicators (Downs et al., 2008) and unique indicators. However, we have to think of the accessibility of data from 2009 to 2018 of the 10 inland node cities. Finally, we set up the index system covering 5 subsystems and 25 indicators explained as follows:
First, economy is the most crucial and important part, which can obviously show the level of the cities' development, then we choose GDP, Per Capita GDP, Import and Export Dollar Caliber Data (unique indicator), and International Tourism Foreign Exchange Earnings (unique indicator).
Second, the 10 inland node cities are all positioned as transportation hubs, then we choose the statistical indices related to railway, highway, and aviation as our unique indicators, with the exception of waterway, which is not covered by Xi'an, Lanzhou, and Xining.
Third, when we choose the social indices, we include population, urbanization rate, people's livelihood, medical conditions, informationization degree, technology innovation, and education degree into the index system.
Fourth, population density can demonstrate a city's land resources to some degree; the amount of water supply and electricity consumption can, respectively, demonstrate a city's water resources and energy.
At last, we choose the coverage rate of green area in completed area, volume of chemistry oxygen demand and sulfur dioxide emission as the city's ecology and environment indices.
2.2.4 Attributes
The indicators have either positive (+) or negative (−) effects on the comprehensive carrying capacity, according to their expected attributes.
2.3 Data source
This article involves 25 indices corresponding to the 10 inland node cities from the year 2009 to 2018. To ensure the reliability of basic data, the data are directly chosen from China City Statistical Yearbook, corresponding node cities' Statistical Yearbook, Bulletin and Statistical Yearbook on Environment.
2.4 Estimation methods for comprehensive carrying capacity
2.4.1 Multidimensional time series
We assume n cities as the evaluation samples of the comprehensive carrying capacity. Each sample has p indicator variables. The matrix of Rn◊p is set up as follows: the span of time is supposed as t. Then, K of the multidimensional time series is constructed.
Taking x1, x2, …, xp as the index of variables at the moment of t, Xt will be indicated as follows:
where, n∈[1,10], p∈[1,25], T∈[1,10].
2.4.2 Evaluation process
Evaluating the index of comprehensive carrying capacity involves four steps: dimensionless standardization, weight calculation, indicator evaluation, and comprehensive carrying capacity evaluation.
First, we apply the method of dimensionless standardization (Wei et al., 2016) to normalize the value of indices in each year. For the positive indices, they are transformed by equation (3); correspondingly, the negative indices are transformed by equation (4).
In the above-mentioned formulas, max(xj) is the maximum value of xj and min(xj) is the minimum value of xj.
Second, we introduce the improved entropy method to determine the weights of each indicator. We add t together with n in the original formula to improve the existing entropy method to evaluate the 10 inland node cities with the time span of 10 years. We assume that


Third, we assume wj as j indicator's entropy in t year, then it can be evaluated as follows:

At last, on the basis of the evaluation above, we can obtain n city's comprehensive carrying capacity in t year with the application of the method named multiobjective linear weighting function (Sun et al., 2008) as the following equation:

In the equation above,
3. Results
3.1 Index weight and evaluation results
As noted above and shown in Table 2, of the 25 indicators, 6 indicators are considered negative, and the remaining 19 indicators are positive. All indices are dimensionless. The entropy weighting method has been applied to calculate the weight of each indicator. The results are shown in Fig. 1. On account of both time-dimension and space-dimension evaluation, the weights are largely different in specific years, with the values from 0.011287 to 0.125157. The results shown in Fig. 1 indicate the largest value of the corresponding indicators in specific year.
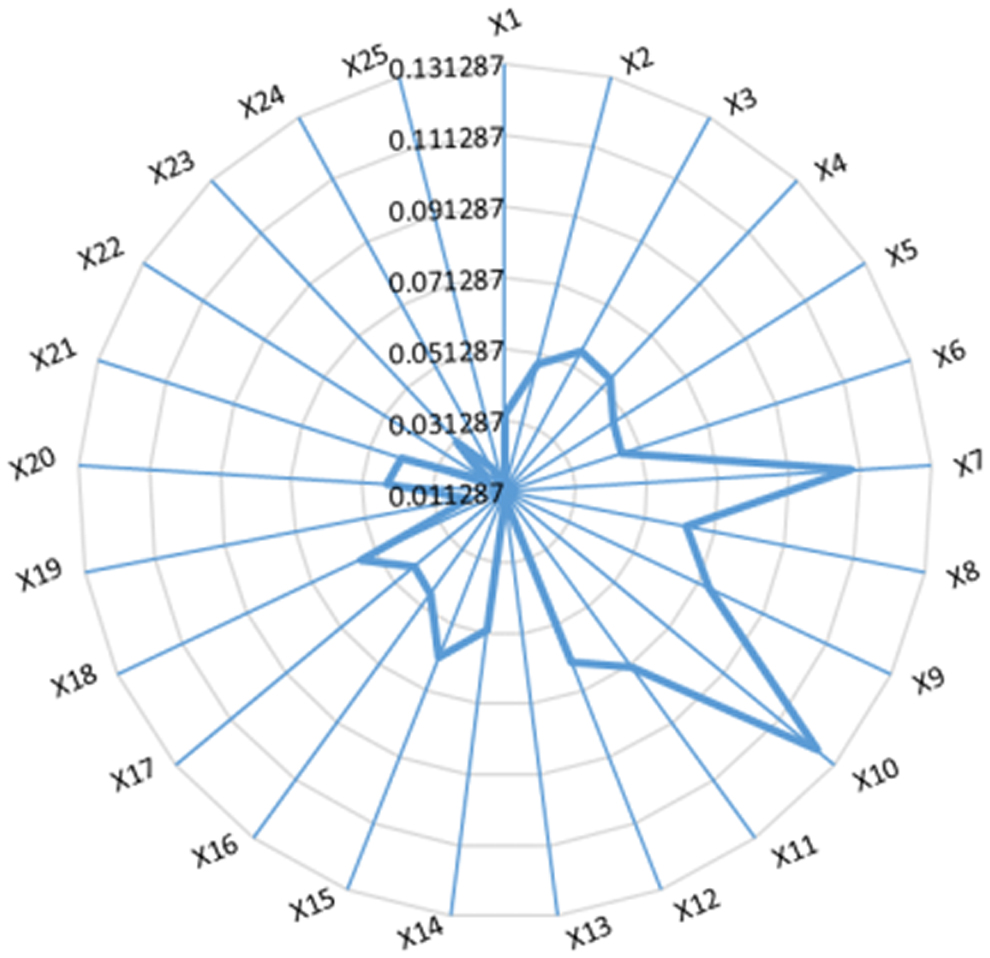
The weights of the 25 indicators.
As is demonstrated in Fig. 1, the weights for the index of Railway Passenger Traffic (X10) and Railway Freight Traffic(X7) are the highest indicators, and both are positive, indicating the positive role of comprehensive transportation in the development of the node cities. These are followed by Registered Unemployment Rate (X15) besides other transportation indicators.
However, the weights of Volume of Chemistry Oxygen Demand Emission (X24) and Volume of Sulfur Dioxide Emission (X25) are the lowest, both of which are negative indicators belonging to ecology and environment subsystem. In total, these results illustrate the unique importance of the comprehensive transportation for the development of the 10 inland node cities along the Belt and Road, and at the same time explain why these 10 inland cities are positioned as transportation hubs to some degree.
3.2 Comprehensive carrying capacity of the 10 inland node cities
The results of comprehensive carrying capacity are shown in Table 3 and Figs. 2 and 3.
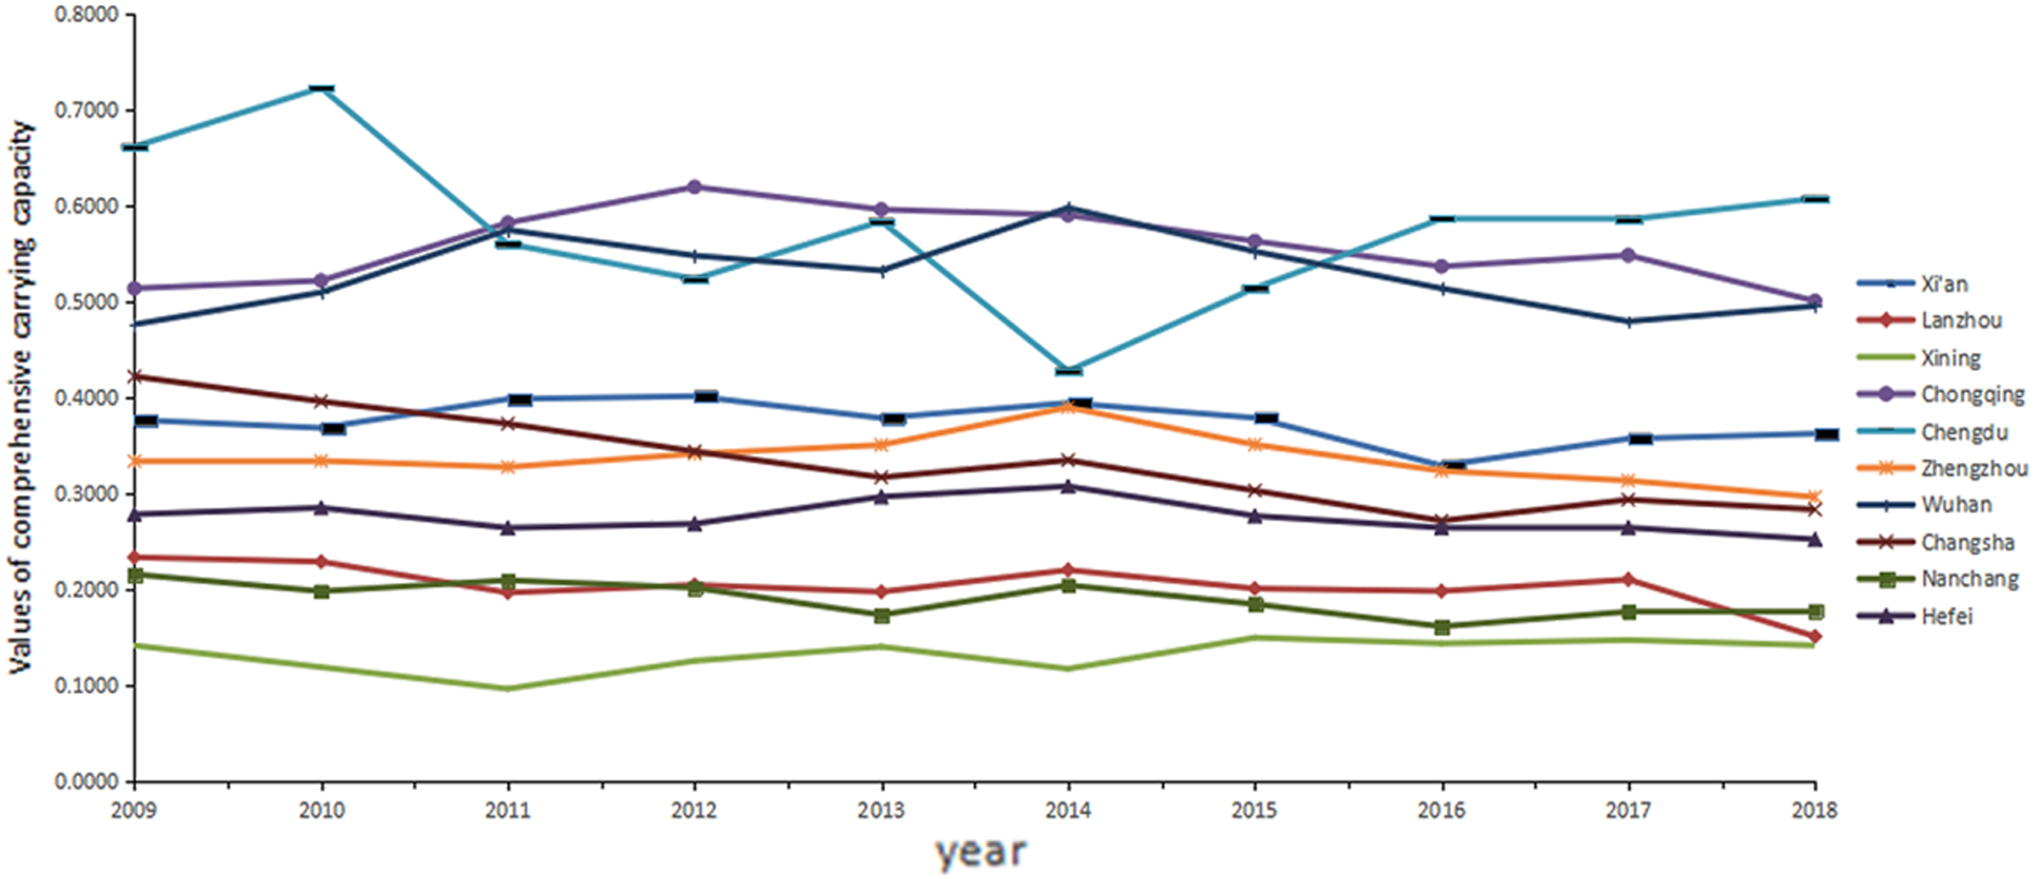
Comprehensive carrying capacity of 10 inland node cities.
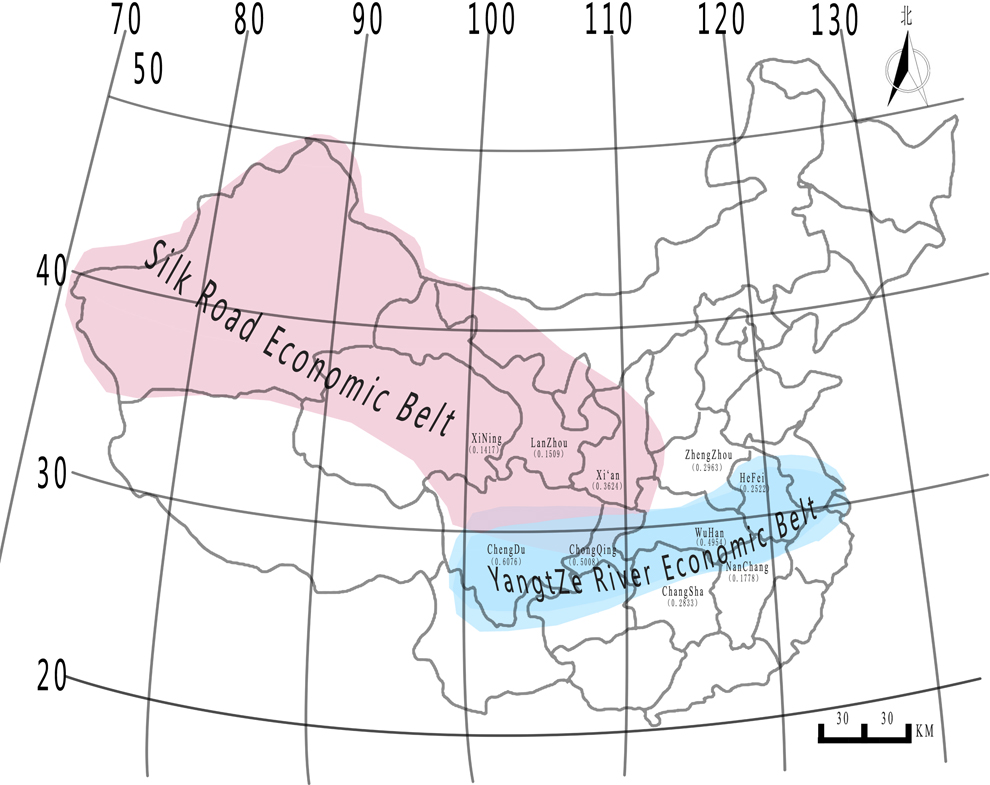
Comprehensive carrying capacity of 10 inland node cities in 2018.
Comprehensive Carrying Capacity Index Values from 2009 to 2018 for the 10 Inland Node Cities Under the Belt and the Road Initiative
As is illustrated in Fig. 2, Chengdu, Chongqing, and Wuhan had much better values of comprehensive carrying capacity than the remaining 6 cities with Xi'an as the boundary. Chengdu had been fluctuated until it hit the lowest point 0.4278 in 2014 on account of its relatively low transportation contribution, while it rose steadily and reached 0.6076 in 2018. Wuhan had been following after Chongqing and reached almost the same value 0.4954 as Chongqing. Xi'an, Zhengzhou, Changsha, Hefei, Lanzhou, and Nanchang were demonstrated to vary steadily. Xining was the worst performing city. It reached the peak at 0.1496 in 2015. However, its best value was nearly one-third of Chengdu's worst value in 2014.
The comparison analysis between Chengdu and Xining is illustrated in Table 4. As shown in Table 4, the gap between Chengdu and Xining had fluctuated, but it was downward before 2013. However, the gap was upward after 2013.
The Comparison Analysis of the Values for the Comprehensive Carrying Capacity Between Chengdu and Xining from 2009 to 2018
In addition, as demonstrated in Fig. 2, Xi'an had been varying slightly from 2009 to 2018, meanwhile it became the boundary of better values and worse values. Therefore, if we assumed that its values for comprehensive carrying capacity were zero, then the gap values between it and other remaining cities could be illustrated in Fig. 4. We found that the gap values fluctuated greatly before 2013. However, the gap values had been varying slightly and tending to become smaller except Chengdu since 2014, which was the first year since the Belt and Road Initiative began to be carried out. On such conditions only, we concluded that the 10 inland code cities had been affected by the Belt and Road Initiative especially Chengdu. Although Xining had the worst values, yet its gap values were upward after 2014.

Gap values for comprehensive carrying capacity of 10 inland node cities.
Overall, based on the spatial perspective (shown in Fig. 3), Chongqing, Chengdu, and Wuhan are in the Yangtze River Economic Belt. Their higher values can illustrate their economic and regional development advantages. Moreover, the values of Changsha are nearly two times as many as Nanchang. Xi'an, Zhengzhou, and Hefei are located in Central China, which have transportation and social development foundations. However, the values of Xining have been fluctuated from 0.0963 to 0.1496 because of its scarce resources and disadvantaged geographical location. Although Lanzhou is located in the west of China, whose values are still comparable with Nanchang, for its resources and energy superiorities.
3.3 Comprehensive carrying capacity evaluation for the five subsystems
Figure 5 presents the carrying capacity values for the five subsystems—economy, comprehensive transportation, society, resources and energy, ecology and environment—for each city in 2018.
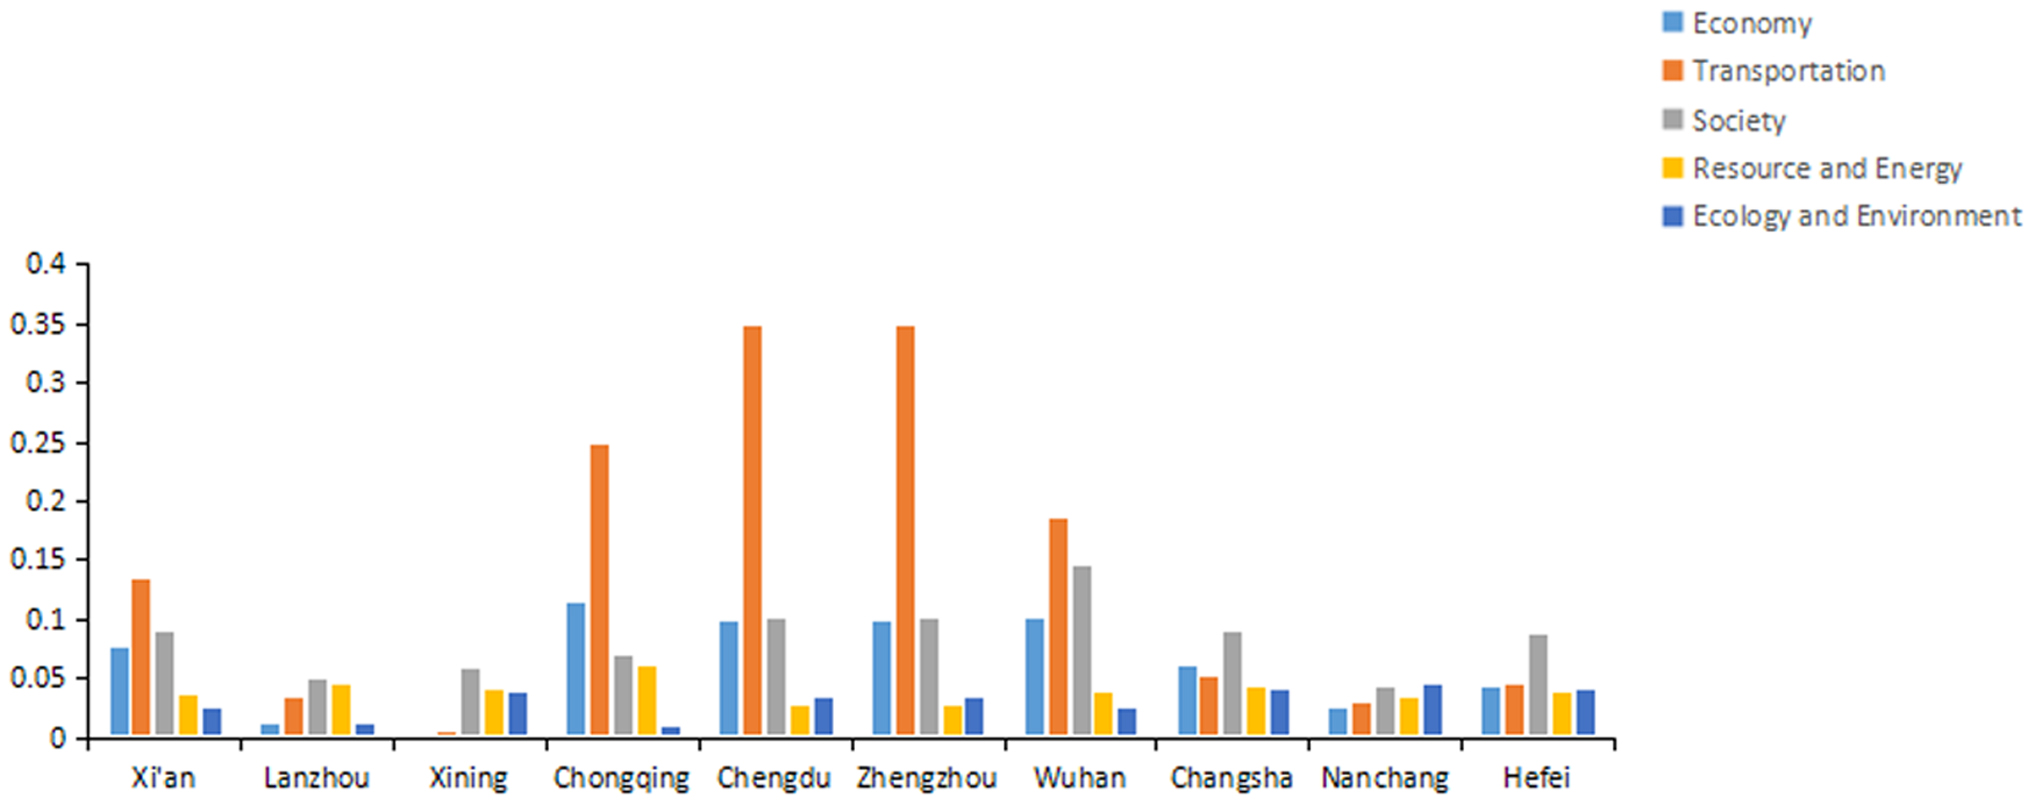
Values for 5 subsystems of 10 inland node cities.
As could be seen from the figure, the values for the comprehensive transportation subsystem are more obvious than the other four subsystems, especially for Chengdu, Zhengzhou, and Chongqing. This finding was consistent with the results outlined in “Weights of the 25 indicators”: the weights of the comprehensive transportation subsystem were comparatively high and played an important role in the evaluation system, followed in order by the society, economy, resources and energy, ecology and environment.
Specifically, Wuhan performed best in the social aspect due to its excellent provision of technology innovation and education resources. Chongqing ranked first in economy subsystem on account of the prominent contribution from trade and international tourism. Chengdu, Zhengzhou, and Wuhan almost had the same status in economy subsystem. However, the value for Xining was nearly equal to 0 for its worst economy basis. Chongqing had a relatively high score in the resource and energy subsystem due to its vast water supply and lower energy consumption. Lanzhou and Chongqing performed badly in ecology and environment subsystem. Lanzhou had the worst value of Coverage Rate of Green Area in Completed Area, meanwhile Chongqing had the vast volume of Chemistry Oxygen Demand and Sulfur Dioxide.
4. Discussion
4.1 Main findings
In this article, we analyzed comprehensive carrying capacity of the 10 inland node cities along the Belt and Road from 2009 to 2018. The comprehensive carrying capacity evaluation index system has included 25 indicators, which are evaluated quantitatively from the perspective of economy, comprehensive transportation, society, resources and energy, ecology and environment with the application of a set of calculation methods. The comprehensive carrying capacity of the 10 inland node cities helps us to know better their development status, the correlation between them, and the Belt and Road.
4.2 Theoretical and empirical implications
In summary, our studies have made some improvements in theory and can present valuable information for the government and practitioners in the country to solve the problems encountered by Chinese node cities during their contribution to the building of the Belt and Road.
Theoretically, our research subjects are representative. The 10 inland node cities selected by us play a dominant role both in the building of the Belt and Road, and in the development of the middle and western region of China. In addition, with the construction of an index system with 25 indicators (10 unique indicators for the Belt and Road) and the evaluation of comprehensive carrying capacity, our research results are quantitative and systematical, which can fill the previous global and local qualitative study gaps to some extent. Furthermore, the method of entropy has been added t together with n into the original formula, which was not limited to calculate a single city's weight at a specific time.
Consequently, our theoretical studies provide important heuristic references for perceiving future quantitative and systematical studies on the global and local node cities along the Belt and Road, thus help select research topics potentially valuable but not yet addressed in previous academic field with the application of comprehensive carrying capacity.
Practically, our quantitative evaluation system and measurable indicators can be applied or modified to assess other regional node cities. Furthermore, our research results and suggestions can help the government and practitioners in the country to know better the development advantages and disadvantages of the node cities along the Belt and Road, and then promote them to make proper policies and decisions.
4.3 Research limitations and future directions
In this article, we tried to put forward all-round aspects and the unique indicators for the 10 inland node cities on the basis of the theory of node cities and their functions for the Belt and Road. However, on account of the data accessibility for the 10 inland node cities from 2009 to 2018, we finally set up 5 subsystems with 10 unique indicators (illustrated in Table 2) related closely to the Belt and Road.
Regarding the research limitations mentioned above, future studies should be focused on unique indicators, the interactions between the development of node cities and the Belt and Road Initiative.
5. Conclusions and Policy Suggestions
Inland node cities are indispensable part of the Belt. In this article, based on the theory of comprehensive carrying capacity, we select 10 inland node cities to set up an evaluation index system with 5 subsystems, 25 indicators, which have been evaluated quantitatively and analyzed systematically. The main conclusions are summarized as below:
First, Of the 25 indicators, the weights for the index of Railway Passenger Traffic and Railway Freight Traffic were the highest, and the weights of Volume of Chemistry Oxygen Demand Emission and Volume of Sulfur Dioxide Emission were the lowest.
Second, Chengdu, Chongqing, and Wuhan had the best values, and Xining had the worst values of comprehensive carrying capacity.
Third, the comparison analysis between Chengdu and Xining was performed. It was found that the gap between Chengdu and Xining fluctuated downward before 2013. However, the gap was upward after 2013.
Fourth, if we assumed that the values of Xi'an for comprehensive carrying capacity were zero, the gap values between it and other remaining cities were studied. We found that a turning point took place in 2013. The gap values fluctuated greatly before 2013. However, after 2013, the gap values had been varying slightly and tending to become smaller except Chengdu.
At last, we concluded that the development of the 10 inland node cities had been affected by the Belt and Road Initiative.
According to the conclusions above, some policy suggestions of the 10 inland node cities are made as follows:
First, the inland node cities should optimize their integrated collection and distribution system based on China–Europe Railway Express, Airport Economic Demonstration Zone, Information Highway, New International Land–Sea Trade Corridor. Under this premise, they can make great progress in the comprehensive transportation and play an important role in the international transportation system in the future.
Second, with the aim of building green Belt and Road, the inland node cities should pay more attention to their protection of ecology and environment. Energy-saving and environmental protection industry, new energy technology, Green industry technology, and more investments in pollution control are suggested to be promoted.
Third, Chinese government should enhance the important role of the Yangtze River Economic Belt in the building of the Belt and Road by making policies such as sharing the integrated transportation corridor, and connectivity of infrastructure, unimpeded trade, financial integration among the node cities along the river.
Fourth, the node city of Xining had the worst values of comprehensive carrying capacity. Chinese government should give full scope to the ethnic and cultural advantages of Xining and speed up its opening-up reform (Vision and Actions).
At last, Chinese government should implement more policies, strategies, measures, and investments to strengthen the interaction and cooperation among the node cities along the Belt and Road based on the city clusters, including the middle reaches of the Yangtze River, around Chengdu and Chongqing, in central Henan province and Lanzhou—Xining city area.
Footnotes
Acknowledgments
We express our sincere gratitude to the editor and anonymous reviewers for their insightful and constructive comments.
Author Disclosure Statement
No competing financial interests exist.
Funding Information
No funding was received for this study.