
Abstract
Technological progress is vital for China to reduce carbon emissions. A comprehensive understanding of the relationship between intellectual property (IPR) protection and city carbon emissions can better serve China achieve carbon peak and carbon neutral goals. This study focuses on exploring the spatial effects of IPR protection on city-level carbon dioxide (CO2) emissions through research and development (R&D) investment, foreign direct investment (FDI) technology spillover, and intercity technology spillover (DS). This work developed an extended Environmental Kuznets Curve model to investigate the influencing mechanism of IPR protection using the geographical weighted regression Kriging method. Our study period covered 2005, 2009, 2013, and 2017. We identified spatial correlation characteristics in various cities and found that the impact of IPR protection on carbon emissions through R&D investment showed a trend of decreasing first and then increasing. IPR protection through DS had a significant impact of inhibiting CO2 emissions. The impact of IPR protection on carbon emissions through FDI showed a trend of fluctuating up and down. Space coordination in IPR protection, technology convergence between cities, infrastructure construction, and a strict negative list of foreign investment all contributed to city carbon-emission reduction.
Introduction
United Nations Framework Convention on Climate Change, Kyoto Protocol, and The Paris Agreement call on participating countries to work hard to reduce carbon emissions. The Chinese government has set a target of reaching a carbon peak by 2030 and becoming carbon neutral by 2060. The realization of low carbon targets depends on the carbon emission reduction of each city. Low-carbon cities can be achieved through different ways, such as accelerating industrial restructuring or optimizing energy mix (Raheem and Ogebe, 2017). However, it is not easy to adjust the industrial structure and energy structure in the short term. Technological progress has become a primary consideration for carbon emission reduction (Dou, 2013; Jiao et al., 2018). For example, innovation activities have become the main driver for carbon decoupling of economic development in both developed and developing countries (Wang and Jiang, 2019; Wang and Zhang, 2020).
The innovation and dissemination of low-carbon technology do not occur naturally, but need the necessary institutional guarantee provided by the government. Intellectual property (IPR) protection, as a policy tool to encourage innovation, can either promote or hinder the spread of low-carbon technologies (WIPO Report, 2011). Effective IPR protection mechanisms promote research and development (R&D) collaboration, the affordability of new environmental technologies, and effective solutions for technology exporters and importers. Ineffective IPR protection will increase the cost of social innovation and reduce the free flow of innovation elements (Ghosh et al., 2018). However, whether and to what extent IPR protection plays a role in the carbon emission at the city level remains an open question. In addition, appropriate IPR protection is conducive to the free flow of technological factors in space. Carbon emissions also showed strong spatial correlation among different cities. Hao and Deng (2018) believed that the government should give full consideration to the spatial impact of carbon emissions in different regions when formulating emission reduction policies. Similarly, this study deemed it necessary to consider the spatial correlation of the effect of IPR protection on carbon emissions at the city level. This also provides references for other developing countries in their low-carbon development in the process of urbanization.
This study utilized city panel data from 2005 to 2017, considering data on economic development (“GDP”), industry structure (“IS”), R&D investment (“R&D”), foreign direct investment (FDI) technology spillover (“FDI”), intercity technology spillover (“DS”), and IPR protection (“IPR”) as explanatory indicators, with city carbon dioxide (CO2) emissions as the explained indicator. Compared with previous research, this study had three important contributions. First, theoretically, the article adds value by expanding the current framing of technology progress to a wider understanding that includes R&D investment, DS, and FDI technology spillover, exploring the effect of IPR protection on CO2 emissions through the three technology progress channels. Second, empirically, the article adds value using a geographical weighted regression Kriging (GWRK) approach, examining the spatial effect of IPR protection on CO2 emissions at a city level in China. Third, by fully considering the spatial effect characteristics and various technology sources, various CO2-abatement policies were formulated.
The remainder of the article is structured as follows. In Literature Review section, relevant literature is reviewed. In Research Methodology and Data Sources section, the methodology is introduced, and the data source is described. The empirical results based on spatial regression are discussed in Results section. In Discussion section, the conclusion and policy suggestions are presented.
Literature Review
Technological progress and CO2 emissions
There are a lot of literatures on the relationship between technological progress and carbon emissions. From the perspective of content, technological progress includes R&D investment and technology spillover.
On the one hand, R&D input and output reduce carbon emissions in a region by optimizing energy efficiency, energy intensity, and energy mix. According to Lee and Min (2015), green R&D investment could effectively improve the way resources are organized and reduce Japan's carbon-emission level. According to Wang et al. (2011), the output index of R&D, patents, could significantly improve the utilization rate of free-carbon energy and reduce CO2 emissions in the east of China. Ang (2009), referring to modern endogenous growth, found that research intensity could effectively improve energy efficiency and abate CO2 emissions in China. Ahmed et al. (2016), in reference to the output index of R&D input, found that bioenergy technology innovation could reduce carbon emissions by bringing energy efficiency in the long run. Zhang et al. (2017) indicated that the economic contribution of R&D could boost the application for environmental patents, improve energy efficiency, and achieve a reduction in CO2 emissions. Wei et al. (2016) concluded that technological reformation and R&D could promote regional energy utilization efficiency and decrease CO2 in Shanghai. Tamazian et al. (2009) believed that supporting investment in the R&D of energy-efficient technologies in Brazil, Russia, India, China and South Africa (BRICS) countries might promote technological innovation, which might aid in emission reduction efforts. Yang et al. (2014) confirmed that domestic R&D activity could effectively abate CO2 emission by increasing its beneficial effect on CO2 intensity. Huang and Yu (2016) confirmed that domestic R&D was the most powerful tool for reducing CO2 by decreasing energy intensity. Wang and Zhang (2020), in reference to the input index of R&D, found that R&D promoted renewable energy consumption and thus promoted carbon decoupling for economic development. Wang and Wang (2019a) indicated that R&D intensity and R&D efficiency have a significant impact on the energy intensity and carbon decoupling of the U.S. economy. On the other hand, R&D investment reduces carbon emissions in the region by improving the local technology absorption capacity. Enhancing local R&D could increase the absorption capacity of low-carbon technologies, thereby reducing CO2 emissions (Ang, 2009). Indigenous R&D activities and human capital, as variables of technology absorption, were correlated negatively with energy intensity and carbon emission (Huang et al., 2017a, 2017b; Jiao et al., 2018). R&D activities could improve the environment, either by improving energy efficiency or by providing the necessary basis for technology absorption.
As a carrier of capital, management, and technology, FDI is often viewed as an important means of technology transfer. The transfer of green technology to China by foreign companies has helped reduce CO2 emissions in the west (Zhang et al., 2016). This finding supported the “pollution halo” hypothesis. However, research by Kivyiro and Arminen (2014) indicated that technology transfer generated by FDI could have the opposite effect on CO2 emission in different sub-Saharan countries in Africa. Developed countries, under unique environmental pressures, generally transferred their polluting industries to developing countries with less-stringent environmental regulations. However, results obtained by previous researchers generally supported the “pollution haven” or “pollution halo” hypothesis. Doytch and Uctum (2016) suggested that FDI could worsen the environment in low- and middle-income countries and benefit high-income countries. Peng and Tan (2016) found no consistent conclusion regarding the relationship between technology transfer generated by FDI and CO2 emissions. This suggests that the “pollution haven” and “pollution halo” hypotheses could exist concurrently. A study by Lan et al. (2012) showed that FDI increases pollution emissions only in areas with low levels of human capital, which supported the “pollution haven” hypothesis. FDI has different environmental effects in different countries.
As for the impact of R&D on carbon emissions, previous studies mainly analyzed the impact mechanism of R&D expenditure on green technology and energy utilization efficiency. The influence of R&D investment on regional technology absorption capacity is mainly manifested in the enhancement of human capital level and the improvement of business environment. However, the impact of FDI technology spillover on the environment shows the coexistence of “pollution paradise” and “pollution halo” effect and shows regional heterogeneity.
IPR protection and technological progress
The relationship between IPR protection and technological progress is discussed from these two aspects.
On the one hand, optimal IPR protection promotes innovation. Petit and Sanna (2000) found that IPR protection had a positive impact on R&D and international expansion in the duopoly model. When IPR protection was strict, the R&D level of a company would be relatively high. According to Marjita and Yang (2015), IPR protection increased the “innovation effect” through R&D incentives. Mathew and Mukherjee (2014) concluded that technological progress results from technological innovation and technological spillover; R&D in developing countries played a vital role in the relationship between IPR protection and FDI. Munirul and Nabin (2017) believed that IPR protection had a positive effect on both the processes of R&D and product innovation.
On the other hand, the effect of IPR protection on technology transfer was found to be uncertain. Ghosh et al. (2018) found that inadequate IPR protection in southern countries led to the spread of technology from northern firms. Intarakumnerd and Charoenporn (2015) noted that a stronger patent regime affected knowledge transfer in both breadth and character. Kirchherr and Urban (2018) indicated that IPR protection could inhibit or drive technology transfer in different developing countries. Ockwell and Haum (2010) believed that inadequate IPR protection should be enhanced to benefit technology transfer. Oh and Matsuoka (2016) indicated that IPR could facilitate or hinder the transfer of environmental technologies. Yang and Maskus (2009) found that IPR protection promoted technology spillover through licensing. FDI was often used as a vehicle for technology transfer, but the effects of IPR protection on FDI were uncertain. Lai (1998) and Glass and Saggi (2002), using a north–south dynamic general equilibrium model, came to different conclusions. Glass and Wu (2007) argued that enforcing IPR protection was negatively related to FDI when introducing low-cost imitation. Moreover, IPR protection was more influential for intellectual-rich FDI (Javorcik, 2004). Awokuse and Yin (2010) pointed out that IPR protection attracted R&D-intensive foreign investment into China. Hsu and Tiao (2015), taking Asian countries as examples, analyzed the positive relationship between IPR protection and foreign capital inflow.
As mentioned above, most scholars agreed that technological progress, which includes R&D activities and technology spillover, could reduce carbon emissions. Some researchers also explored the relationship between IPR protection and technological progress, while failed to reveal how IPR protection abates city CO2 emissions through different technology progress channels. In addition, China is a country with large regional disparities in technology levels, human capital levels, and regime development levels. The spatial relationship between IPR protection and carbon emissions needs to be further explored. These analyses provide the foundation for an improved understanding of the mechanisms by which IPR protection affects technology progress and city-level carbon emissions. Therefore, the government can carry some effective technology upgrading or carbon-reduction policy in the future by considering the spatial effect.
To address the conflicts in contemporary discussion on this topic, we extended the theoretical framework proposed by Grossman and Krueger (1992) to examine the relationships between technology progress, including R&D, FDI technology spillover, DS, and IPR protection for cities in China. To understand the influence of these factors on city carbon emissions, we used the GWRK method. Research Methodology and Data Sources section provides further details on the estimation methodology and data source.
Research Methodology and Data Sources
CO2 emission calculation
CO2 emissions in this study are mainly considered from the perspective of energy consumption, which is based on the method recommended by the Intergovernmental Panel on Climate Change (IPCC) (IPCC, 2006). The calculation formula is as follows:
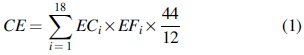
where CE denotes CO2 emissions, ECi (i = 1; 2; 3 … 18) refers to the consumption of fossil energy i, and EF represents the carbon emission coefficient corresponding to the ith energy source. The factor 44/12 refers to the ratio of CO2 molecules to carbon atoms by weight; by multiplying this coefficient, carbon emissions can be converted to CO2 emissions. To get a more meaningful and comprehensive result, we include 18 kinds of energy sources. Specifically, calculations are performed for raw coal, refined coal, other refined coal, coal, coke, coke oven gas, petroleum, crude oil, gasoline, kerosene, diesel oil, fuel oil, liquefied petroleum gas, refinery gas, natural gas, other coke chemicals, other petroleum, other coal washing, and other energy sources. The carbon emission coefficients have been derived from IPCC and the China Energy Statistical Year Book. The carbonization coefficients of these energies are shown in Table 1.
Carbon Conversion Rates for 18 Fossil Fuels
Factors influencing CO2 emissions
Grossman and Krueger (1992) provided an Environmental Kuznets Curve (EKC) theoretical framework for CO2 emission, which presumed that the scale factor, structure factor, and technological progress factor contribute mainly to CO2 emissions. The expression of carbon emission is:
where C indicates the carbon emission level, that is, CO2 emissions per capita refer to this variable (Sehrawat et al., 2015); Y is the scale factor, GDP per capita is used widely (Ahmed, 2014); S is the structural factor, often referred to industrial added value (Raheem and Ogebe, 2017); and T is a technical factor. In addition to local R&D (RD) and FDI spillover (FDI), we considered DS and IPR protection as technical factors in the following equation:
where RD denotes R&D intensity, which can be computed as R&D stock divided by industrial output value (Yang et al., 2014); FDI is measured as FDI net inflow to GDP (Efobi et al., 2014), which can be applied to measure the transitional technology spillover (Zhou et al., 2013). DS is the technology spillover between cities, which measures the diffusion of technology between different cities within a country (Yang et al., 2014). Substituting (3) into (2), the following is obtained:
Following Yang et al. (2014), DS can be considered the weighted sum of R&D resource reserves of other cities, excepting the city itself. This can be expressed by:
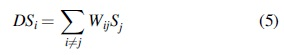
Sj is the R&D reserves in the jth city, and Wij is the intercity technology diffusion weights. According to research by Lin and Tan (2017) on the geo-economic spatial matrix, the interprovincial R&D technology spillover weight can be expressed as:
where wij is the geographical distance. The inverse structure of the spherical distance between provincial capitals was adopted. Differences in economic levels between regions are described by eij, which is expressed by the inverse of the absolute difference of the per capita real GDP of each city in each year during the study period.
Local Moran index
Local Moran index (LMI) was proposed by Anselin and Rey (2010), which is based on global measurement step by step. Whether there are similarities or differences between values are examined to calculate the similarity between this region and other similar regions. Although the Moran index can reflect the clustering degree of the observed objects in space, its internal distribution characteristics can't be manifested. The LMI can not only analyze the degree and type of agglomeration of each regional unit but also quantify each region. The contribution of domain elements to global spatial autocorrelation is evaluated, and the extent to which spatial autocorrelation conceals local instability is evaluated. On the basis of the global clustering test of Moran index, the LMI is used to further observe the clustering in various regions. The calculation formula is:
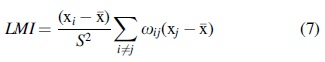
LMI represents the LMI of the ith region. xi and xj represent CO2 emissions in regions i and j, respectively. S2 = 1/n (xi–x̄) represents the mean square deviation of CO2 emissions. ωij is the spatial weight matrix.
If the value of local Moran's I index is >0, it indicates a positive correlation. If the value is <0, it means a negative correlation. The closer the absolute value is to 0, the less correlation there is.
GWRK model
Geographical weighted regression (GWR) was first proposed by Brunsdon et al. (1996). GWR is an improved spatial linear regression model, of which the spatial weight matrix is applied to the linear regression model. The GWR model considers spatial heterogeneity and has stronger explanatory power for economic and environmental issues (Sheng et al., 2017). The model explores the potential of geospatial changes in the regression model. It is based on the nonparametric local weighted regression technique. The local regression parameter uses the number of adjacent monitoring points in variable space to evaluate against a subset, which is expressed as:
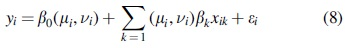
where yi is the CO2 emission for the ith city, xik means the value of the kth explanatory variable in the ith city;
GWRK is an extension of GWR model, which can improve spatial residual autocorrelation better than GWR model. Due to the numerous influencing factors of carbon emissions, the residuals and independent variables are highly likely to produce spatial autocorrelation. Therefore, GWRK model is more suitable to study this problem. This model carries out ordinary Kriging (OK) interpolation on the fitting residual part of GWR model. Then the residual, which is fitted to the GWR model, is added with the trend terms. The expression is as follows:
ɛ^OK(μi, vi) is the residual value of the model at point i. OK interpolation is an unbiased linear interpolation method, the expression is:
In the formula, λi is the contribution weight of the observed value in the neighborhood to the observed value at point i, which can be determined by the variation function, and the expression is:
Where y(h) is the variation function; h is the step size; N(h) is the number of observations in the range h; Z (xi+h) is the observed value at (xi+h); Z (xi) is the observed value at xi.
In this study, the scale factor and structure factor are considered as the control variables. The CO2 emission of a district is not only influenced by its own economic level and technological development but also by the surrounding areas. CO2 emission has a strong spatial autocorrelation, and the heterogeneity of IPR protection in different regions will affect the technology accumulation in different regions. In addition, the spatial aggregation of technology is considered to enhance the dependence of CO2 emissions. Therefore, the relationship between IPR protection and environmental pollution must be evaluated in consideration of the spatial relationship. Based on relevant literatures, IPR protection improves the environment through three mediator variables, which are indigenous R&D activity (RD), intercity R&D spillovers (DS), and FDI technology spillovers (FDI). All three channels need to be considered when estimating the spatial effect on CO2 emissions using the GWRK model. The GWRK model is premised on low correlations between variables. We attempted to select the three most influential and appropriate technical variables as the factors that affected CO2 emissions. Multicollinearity testing should be used to test these variables, which include R&D, FDI, DS, and IPR. The regression model was converted into the double-log form, and the model specification is:
where
Data source
Our study period was 2005, 2009, 2013, and 2017, because of a lack of data; the research samples include 262 cities. The reason why this study chose 2005 as the starting point of the study is that China accelerated the legal construction of IPR protection since 2005. Since 2005, China's Supreme People's Court has selected 100 typical cases of judicial protection of IPR rights and made them public. These cases filled in the legal gaps and promoted the process of IPR legal system. More importantly, the results of these 100 cases have well realized the unity of legal effect and social effect, which has a strong guiding significance and exemplary value. The year 2017 was chosen as the end point of the study, mainly because the latest data of IPR protection and city carbon emissions were updated to 2017. Therefore, the data from 2005 to 2017 can better reflect the impact of changes in IPR protection on city carbon emissions. In addition, we chose 2009 and 2013 as the study samples because there was little change in IPR rights in a short period of time, and the legal system of IPR protection would be significantly improved every 4 years. The study uses these data to analyze the spatial impact of IPR protection on greenhouse gas emission.
The data on CO2 emissions were obtained from Carbon Emission Accounts and Datasets for emerging economies. Information on the population of the cities, industrial added value (structural factor), R&D expenditure, and IFDI (FDI spillover) was obtained from the Urban Statistical Yearbook. Information on IPR protection (number of foreign patent applications) was collected from the China Statistical Yearbook on Science and Technology and State Intellectual Property Office Patent Office. DS was calculated based on Eq. (5).
Results
The local spatial correlation of CO2 emission
To further detect local agglomeration of CO2 concentrations, Fig. 1 shows the distribution of LMI for CO2 during 2005–2017. During the study period, CO2 concentration tends to converge, characterized by a low–low cluster and three high–high clusters. High CO2 concentration areas were mainly distributed in Beijing–Tianjin–Hebei, Shandong peninsula, and Jiangsu province, while low CO2 concentration areas were mainly distributed in Chongqing, Xinjiang, Tibet, and Yunnan Province.

CO2 Lisa map. CO2, carbon dioxide.
Overall estimation results
When the GWRK model is applied to regression analysis, multicollinearity in the model increases the variance in parameter estimation, thus leading to inaccurate estimation. Therefore, the multicollinearity diagnosis of the GWRK model is an important component in accurate and effective regression analysis. There are two common diagnostic methods of multicollinearity, namely, the variance inflation factor (VIF) and the Condition Index and Variance Decomposition Proportions. These methods have been proven suitable for ordinary linearity through experimental application of the global regression model. We used the VIF to perform the multicollinearity test. The results showed that there was no multicollinearity problem among the core explanatory variables (Table 2).
Variance Inflation Factor Test Results
DS, intercity technology spillover; FDI, foreign direct investment; IPR, intellectual property; R&D, research and development.
Table 3 shows the estimation results of the effect of various technology progress channels on CO2 emissions in 2005, 2009, 2013, and 2017, and they were computed using the ArcGIS 10.5 system. Local R2 scores showed that the explanatory variables have spatial variation characteristics for CO2 emissions over time. As shown in Table 2, according to the calculation results of the GWRK model, the local R2 increased year by year, indicating that technology had an increasingly significant effect on the reduction of carbon emissions. In 2017, the local R2 value reached 0.903 (adjusted R2 = 0.814), suggesting that 81.4% of the spatial variation could be expressed by the three technology channels.
National Regression Results of the Geographical Weighted Regression Kriging Model
Based on the GWRK model, the results of parameter estimates provided an effective measure for spatial variation relations. Table 3 shows the estimated value interval of the influence coefficient of each explanatory variable for 262 cities during the research period. The estimation result expressed the strong interpretation effect of IPR*R&D, IPR*DS, and IPR*FDI on CO2 emissions at a city level. The largest coefficients of IPR*R&D were 1.621, 0.234, 0.022, and 0.325 over the 4-year study period, suggesting that the effect of IPR on CO2 emissions through R&D first goes down and then goes up. The highest coefficient of IPR*DS in 2005 was 0.578, which increased in 2009 (0.618) and, subsequently, decreased in 2013 (0.345) and 2017 (0.313). As regards IPR*FDI, the coefficients were 0.956, 0.981, 0.734, and 0.864 during the study period, suggesting that the effect of IPR protection on CO2 emissions through FDI technology spillover fluctuated and decreased with each passing year. These results indicate that, from a national perspective, under the current level of IPR protection, the three technological progress paths have an overall promoting effect on carbon emissions in most cities. However, with the improvement of IPR protection and the development of low-carbon technology, carbon emission reduction is constantly strengthened. Residual sum of squares is a data-processing method that approximately describes or compares the discrete points on the plane by a continuous curve to express the function relation among the coordinates. The results calculated by the GWRK model showed a smallest residual square (1.049) in 2013, indicating that the model in the 4 years exhibited optimal fit.
Effect mechanism of IPR protection on CO2 emissions
Effect of IPR protection through R&D investment
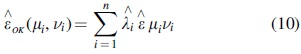
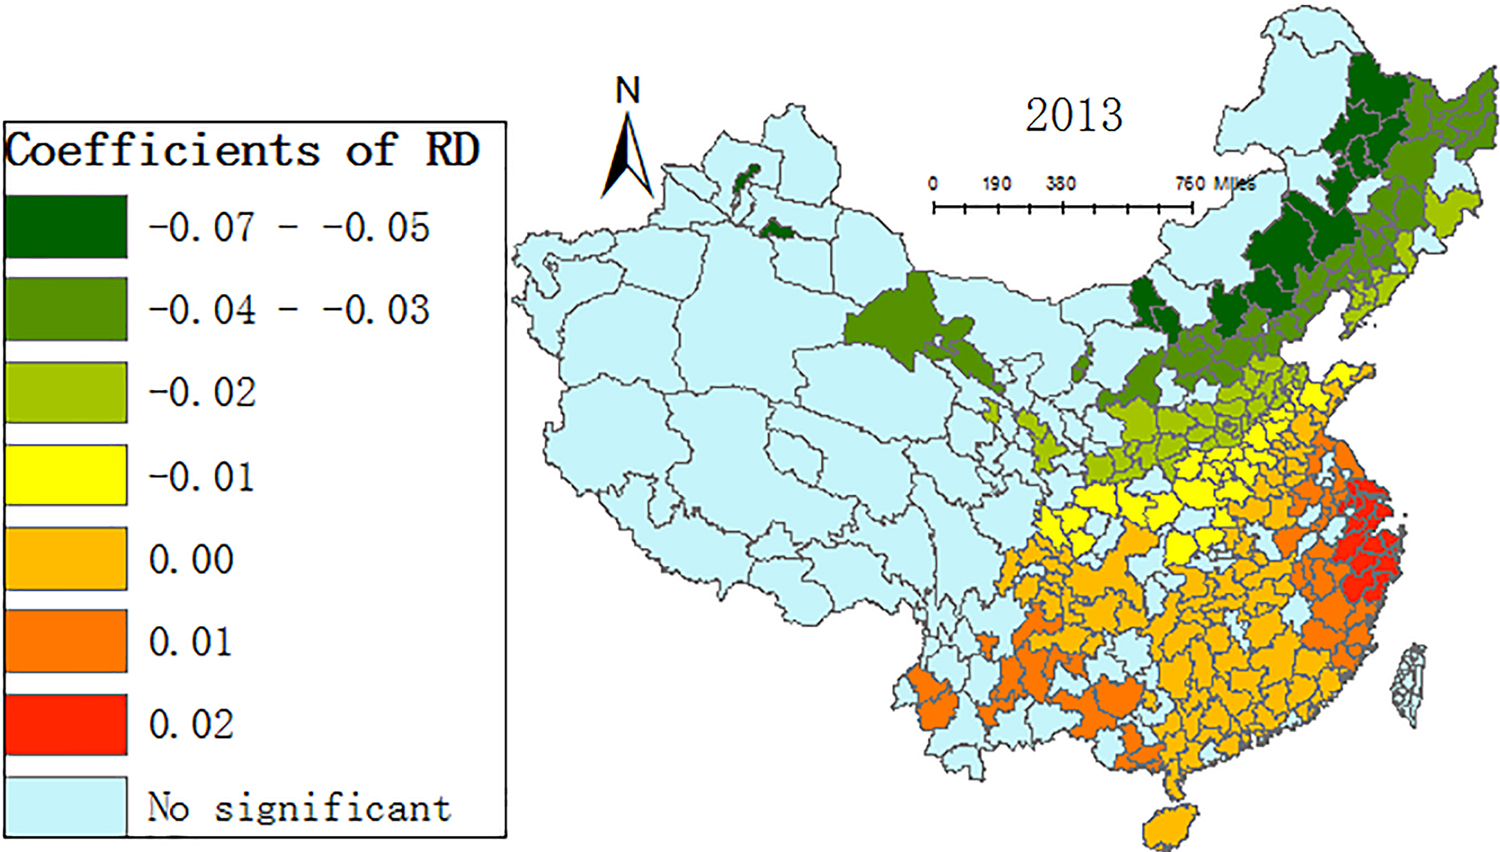
From the perspective of city, from 2005 to 2017, the impact of IPR protection on carbon emissions through R&D activities showed a trend of decreasing first and then increasing (as shown in Figs. 2–5). However, this effect showed a large spatial difference. In the cities of Northeast China, North China, and East Shandong, the impact coefficient first decreased and then increased. In the southern Jiangsu and Zhejiang, the impact coefficient first increased and then decreased. In the cities of Pearl River Delta, the impact coefficient has been declining. This indicates that regional differences in IPR protection and R&D investment have significant spatial differences in the impact on carbon emissions. The result also showed that the improvement of IPR protection at the city level did not have a stable effect on the CO2 emission. This result is supported by Yang and Li (2017) and Chen (2010).
Regression coefficients of the effect of IPR through R&D investment for 2005. IPR, intellectual property; R&D, research and development.
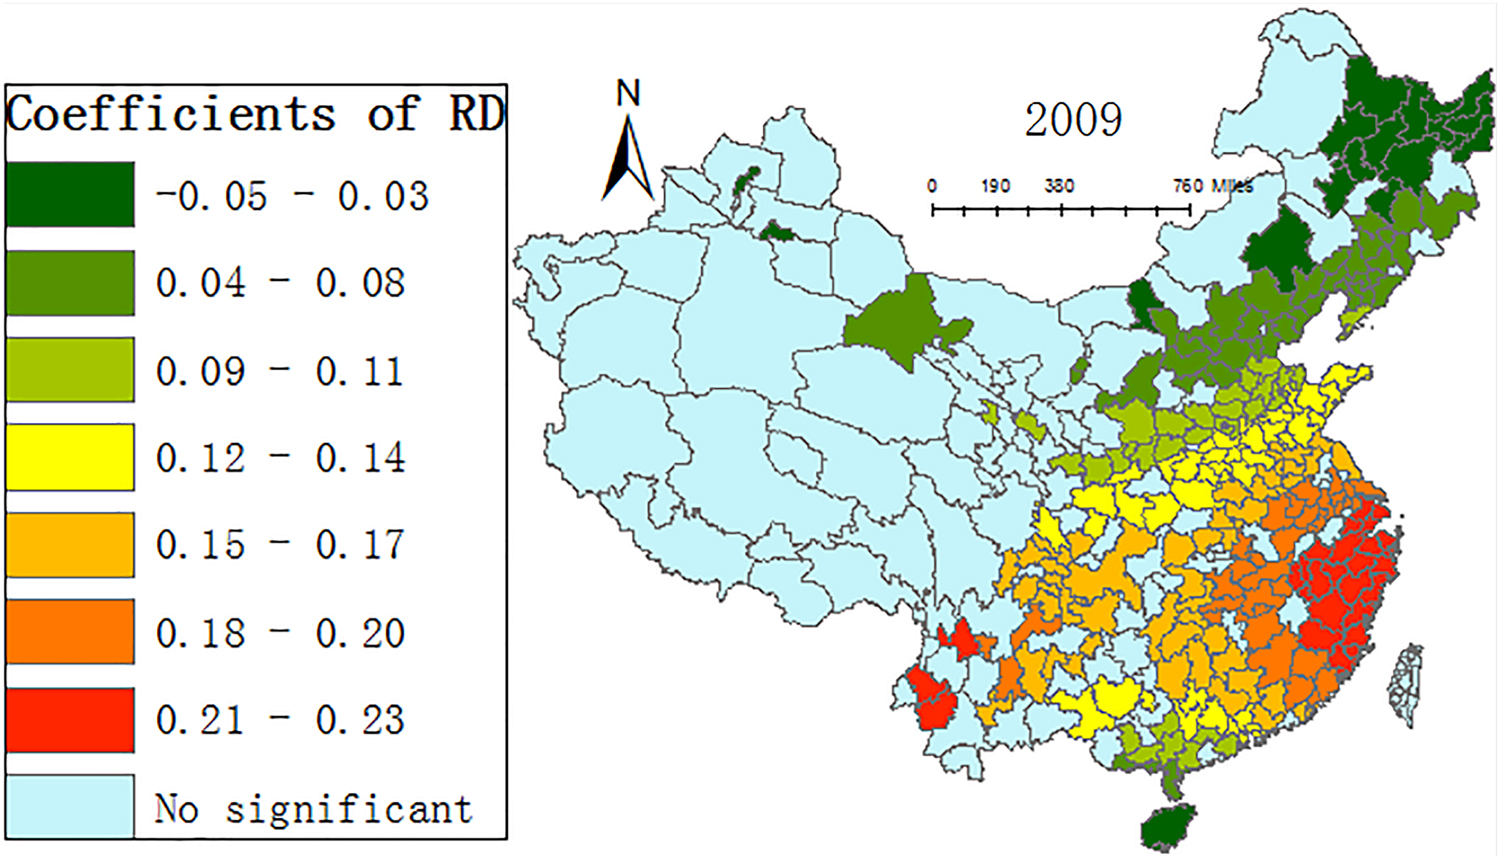
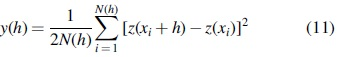
Regression coefficients of the effect of IPR through R&D investment for 2009.
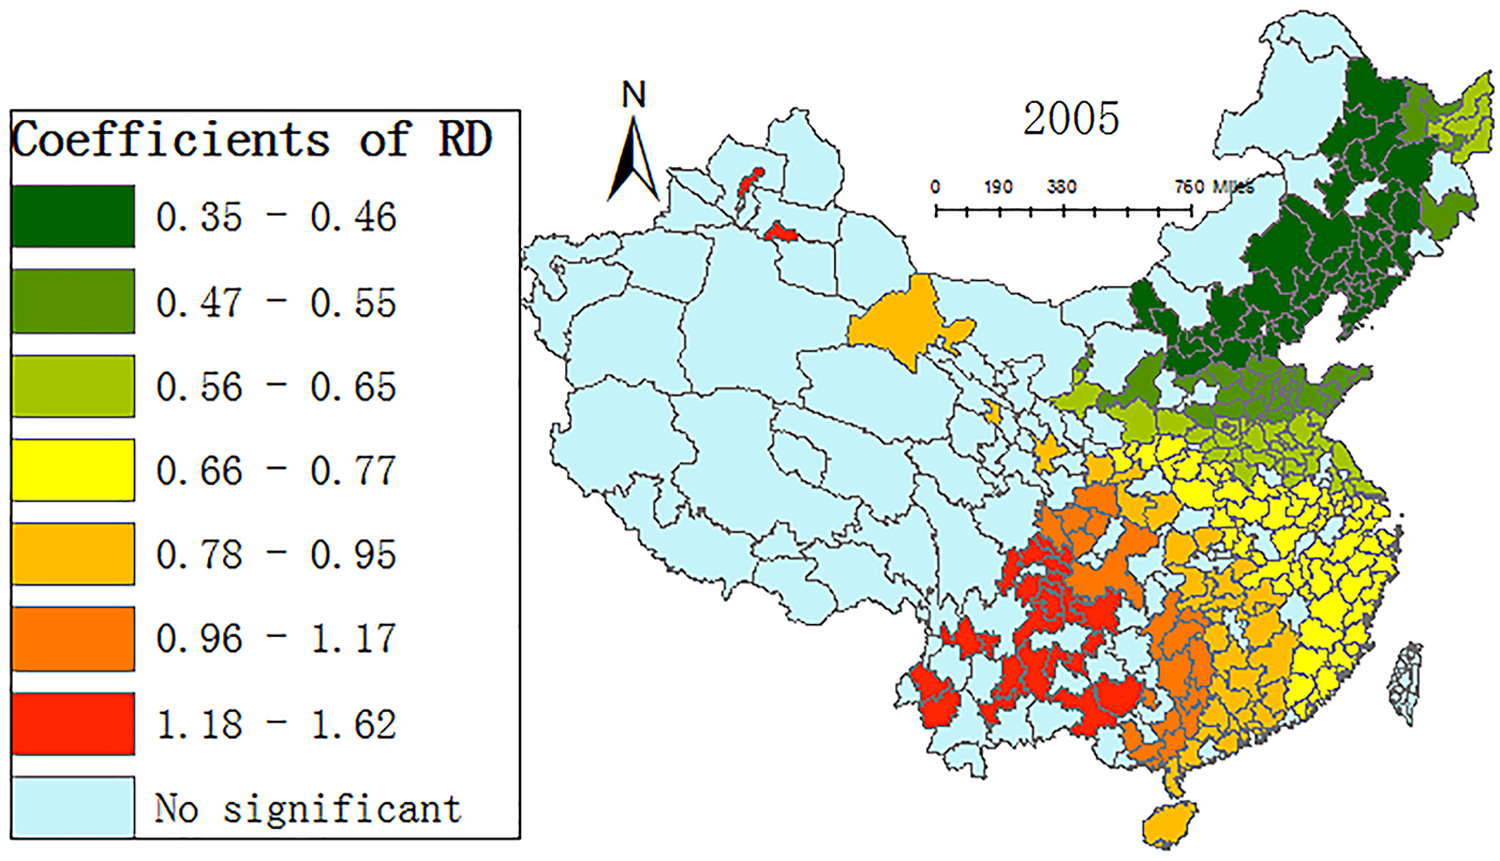
Regression coefficients of the effect of IPR through R&D investment for 2013.

Regression coefficients of the effect of IPR through R&D investment for 2017.
In 2005, the influence coefficient of IPR*R&D from large to small is: Cities in the southwest > Cities in the south > Cities along the Yangtze River > Cities along the Yellow River > Cities in northern North China and western Northeast China. The areas with the lowest impact coefficient are Harbin, Heihe, Qiqihar, Daqing, and Suihua in Heilongjiang Province, Changchun and Siping in Jilin Province, the whole region of Liaoning Province, and Beijing, Tianjin, Tangshan, and Qinhuangdao in the north of North China. This indicates that geographical proximity makes the technological elements in Northeast China and North China exhibit similar environmental effects. Due to the implementation of the revitalization strategy in Northeast China, the energy efficiency has been improved owing to investment in R&D activities, and the carbon emission level is lower compared with other regions. The regions with the largest impact coefficients are located in Kunming, Qujing, Baoshan, and Lincang in Yunnan, Baise and Hechi in Guangxi, and Chengdu, Ya'an, Deyang, and Leshan in Sichuan. In addition, these areas are relatively scattered. These results indicate that the technology development in Southwest China during this period is mainly manifested as production expansion, but the improvement of energy efficiency is very weak, thus generating more carbon emissions (Wang et al., 2018).
In 2009, the influence coefficient of IPR*R&D from large to small is: Cities in Jiangsu and Zhejiang > Cities in Central China > Cities in South China, Henan, Zhengzhou > Cities in North China > Cities in Northeast. The negative impact coefficient was concentrated in all Heilongjiang's cities except Daxing'anling and Mudanjiang. The negative impact coefficient was also concentrated in Changchun and Baicheng in Jilin Province. The regions with the largest impact coefficients were located in Shanghai, Suzhou, Wuxi, and all prefecture-level cities in Zhejiang. This indicates that under the appropriate IPR protection strength, R&D investment has carbon emission reduction effect in Heilongjiang. However, under the promotion of the 4 trillion yuan plan, the R&D of the manufacturing industry in Jiangsu and Zhejiang mainly plays a role of production expansion, while the protection of IPR rights fails to play the role of guiding green technology.
In 2013, the influence coefficient of IPR*R&D from large to small is: Cities in South Jiangsu and North Zhejiang > Cities in South China and Central China > Southern cities in North China > Northern cities in North China > Cities in Northeast. The areas with negative impact coefficients extended to Henan, Shandong, and the north of them, while the areas with the highest impact coefficient were only 0.02 in southern Jiangsu and northern Zhejiang. This shows that with appropriate levels of IPR protection, energy efficiency has improved in all regions. At this stage, the economy is slowing down. Environmentally friendly IPR protection systems in northeast and north China will force companies to upgrade their industries through R&D, which would reduce CO2 emissions significantly. This is consistent with the findings of most previous studies (Dong et al., 2016; Wang and Wang, 2019b).
In 2017, the influence coefficient of IPR*R&D from large to small is: Cities in the Northeast, East of North China > Cities in Central China > Cities in South China. Different from previous years, Harbin, Jiamusi, Yichun, and Mudanjiang in Heilongjiang Province were the regions with the highest impact coefficients, while most cities in Guangdong, such as Shenzhen and Guangzhou, were negative. This indicates that the impact of IPR protection on carbon emissions through R&D activities is characterized by fluctuations. This finding is consistent with Wang and Jiang (2019), who argued that technology roughly neither increased nor decreased energy related carbon emission.
Effect of IPR protection through DS
Figures 6–9 show that from 2005 to 2017, the impact of IPR protection on carbon emission reduction through DS gradually expanded to most of the country. The influence coefficients of northern and western cities change from positive to negative, while that of southern cities is always negative. This indicates that the IPR policies of different cities in China provide a good institutional basis for DS, which is beneficial for most cities to achieve carbon emission reduction.
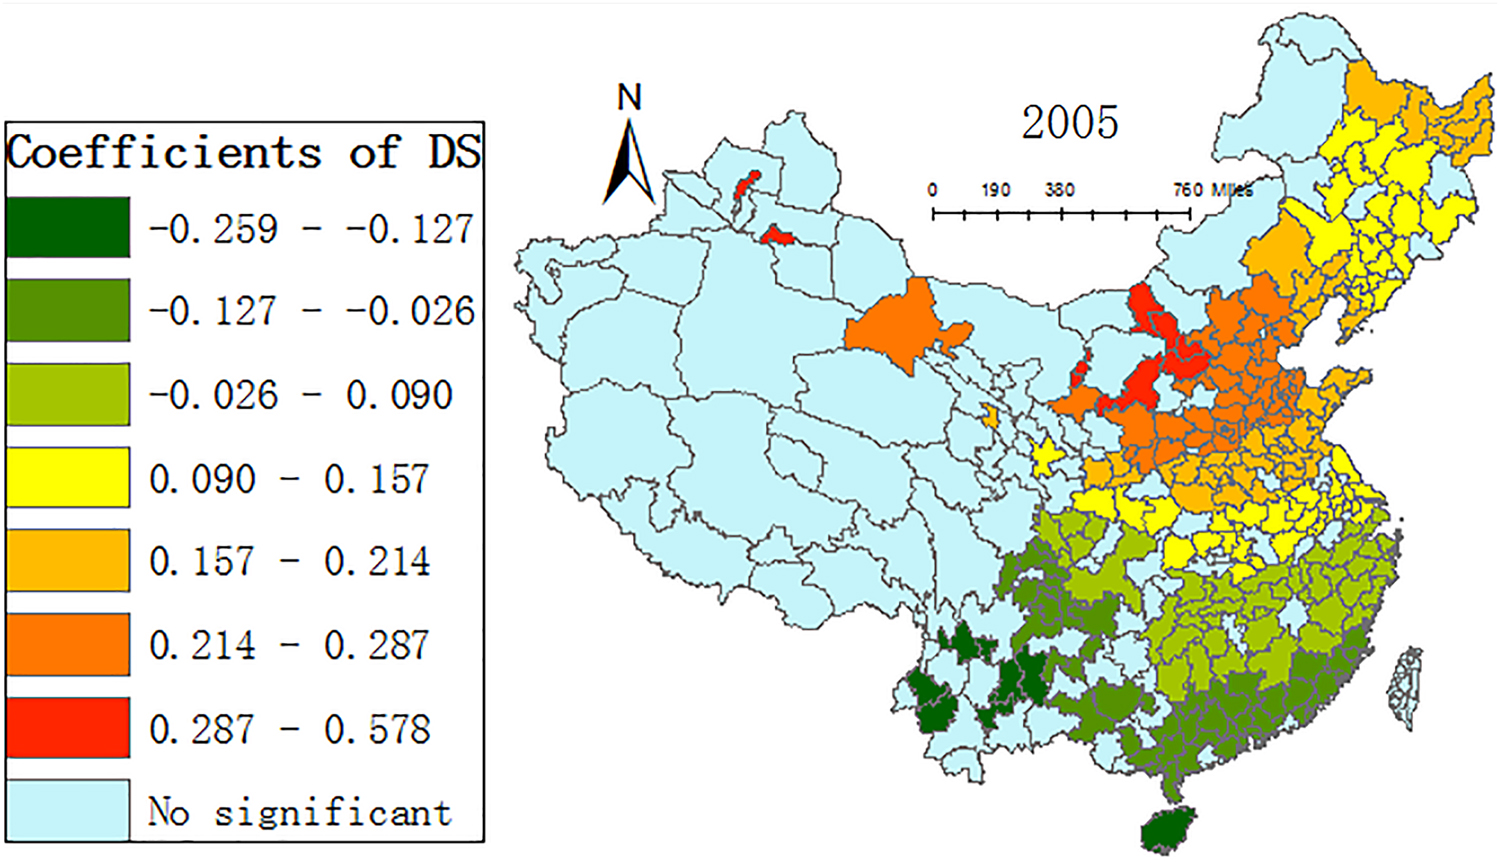
Regression coefficients of the effect of IPR on CO2 through DS for 2005. DS, intercity technology spillover.
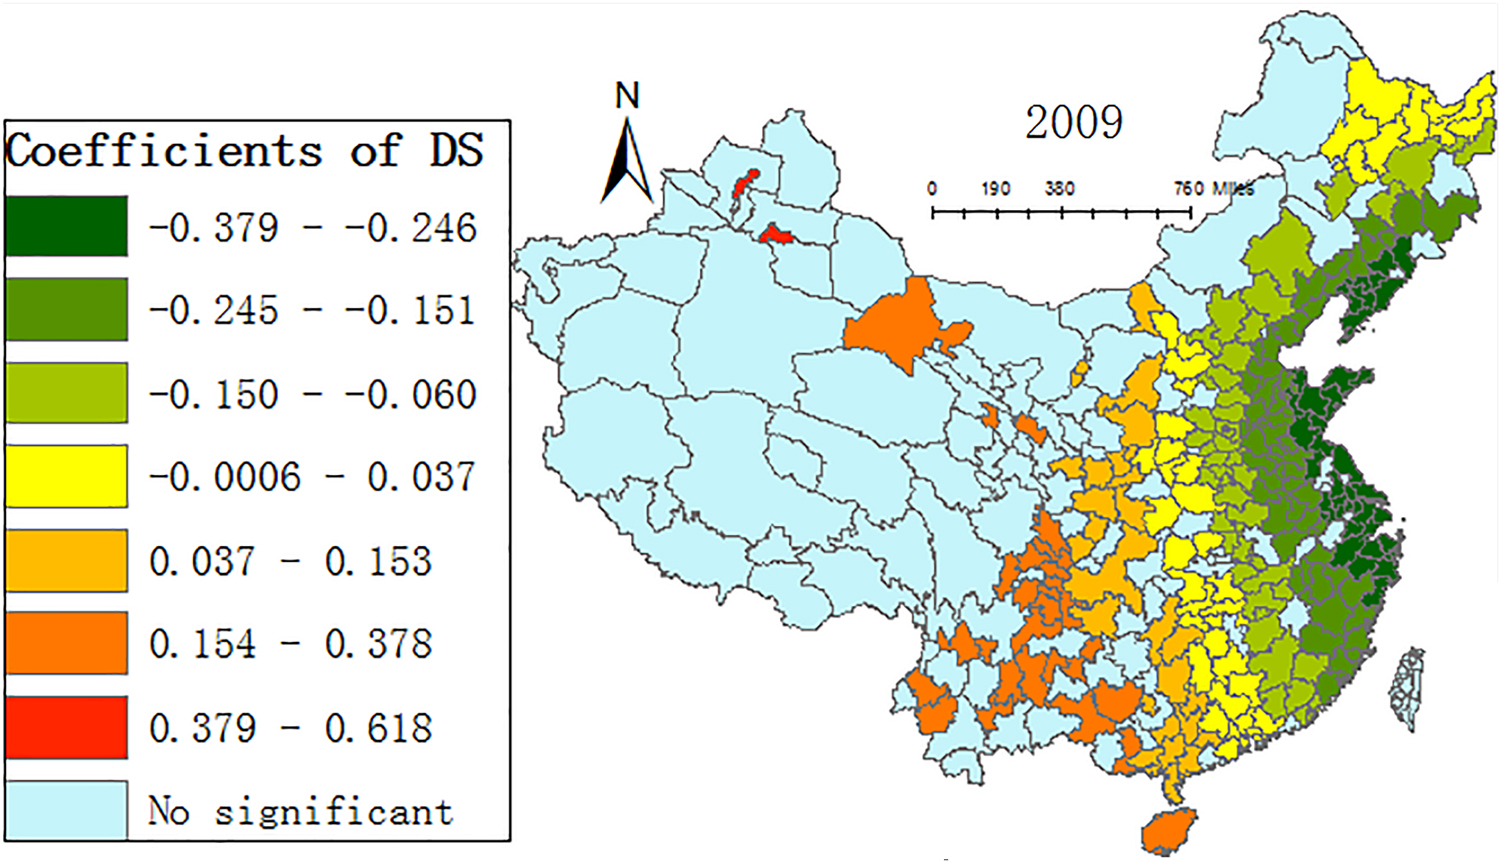
Regression coefficients of the effect of IPR on CO2 through DS for 2009.
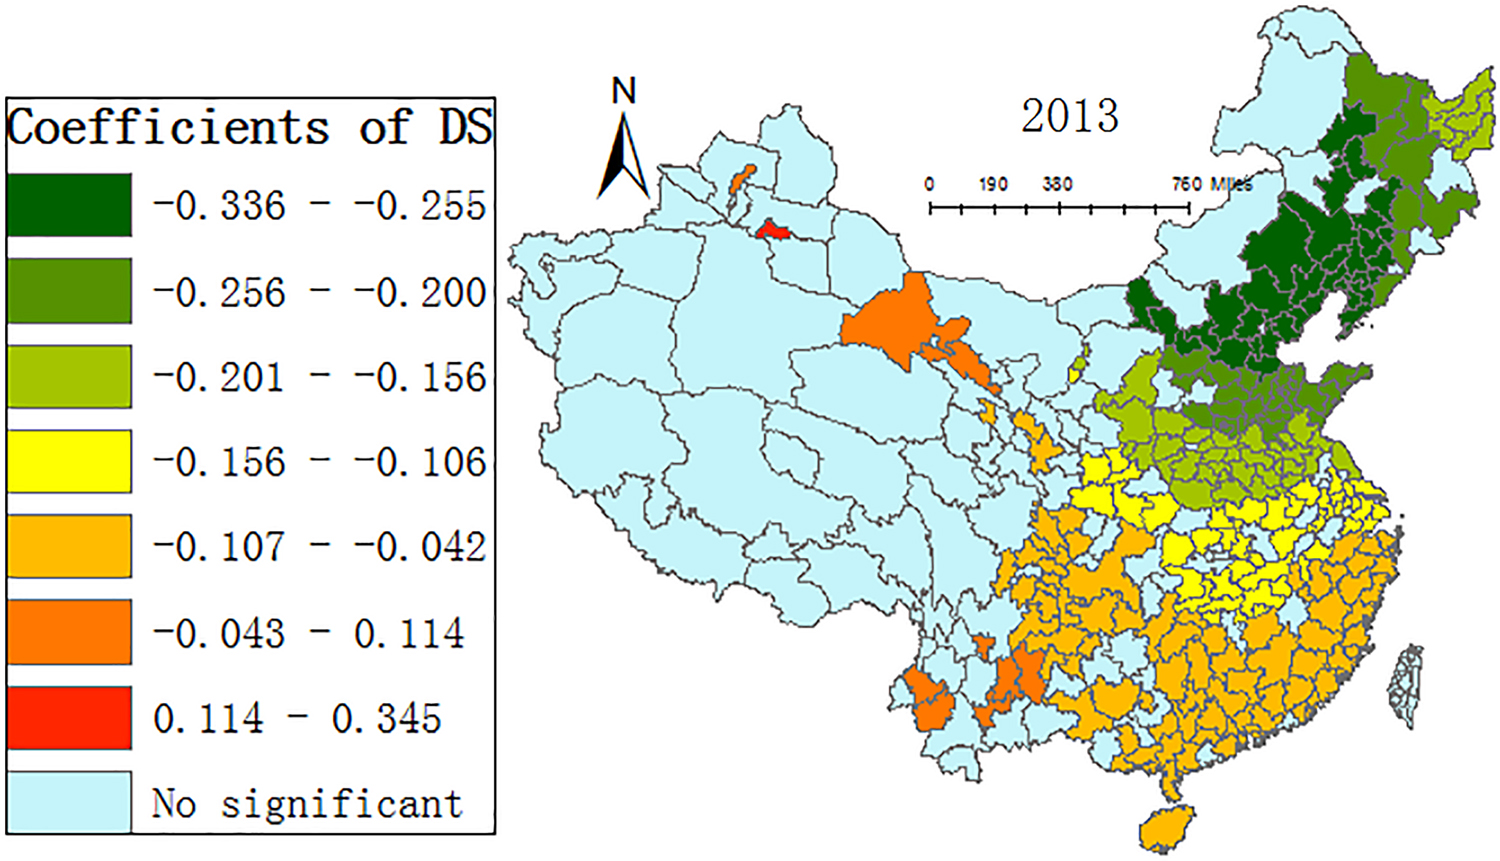
Regression coefficients of the effect of IPR on CO2 through DS for 2013.
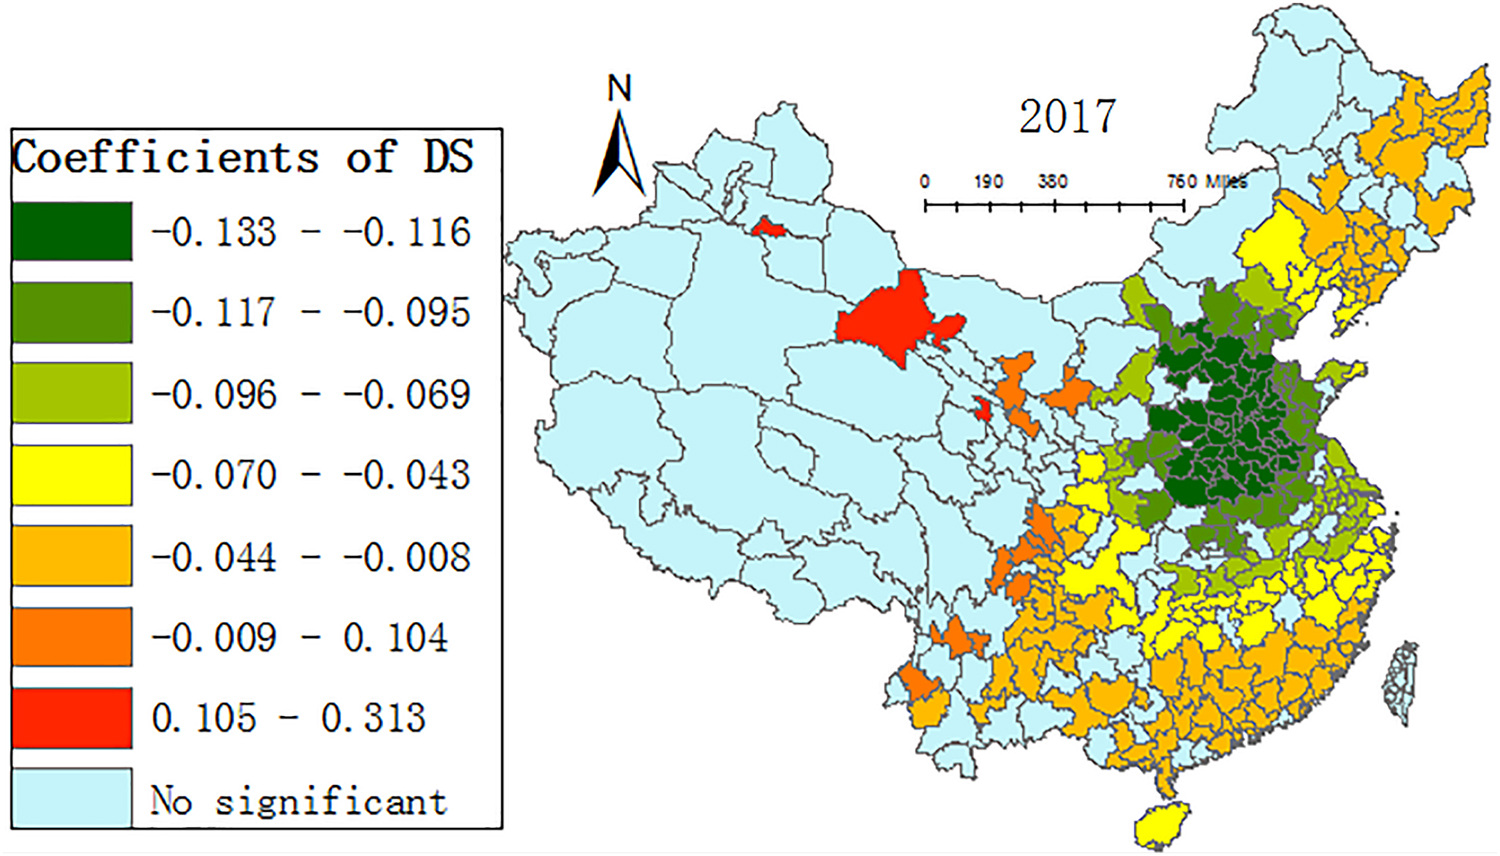
Regression coefficients of the effect of IPR on CO2 through DS for 2017.
In 2005, the influence coefficient of IPR*DS from large to small is: Huhhot, Baotou, Shuozhou, Xinzhou > cities in North China > cities in Huaihe River Plain > cities in Yangtze River Basin > cities in Pearl River Delta > Cities in Yunnan, such as Kunming, Lijiang, and Qujing. The influence coefficients are all negative in cities south of the Yangtze River and positive in cities north of the Yangtze River. This shows that in most cities south of the Yangtze River, IPR protection provides institutional incentives for intercity green technology spillover, while in most cities north of the Yangtze River, the intercity green technology spillover is hindered by institutional obstacle.
In 2009, the influence coefficient of IPR*DS from large to small is: Western inland city > Central inland city > Eastern inland city > Eastern coastal city. The central inland city and the eastern inland city are the positive and negative boundary of the influence coefficient. The cities of Shandong Peninsula, Jiangsu Province, Shanghai, and Hangzhou Bay have the highest negative impact coefficient, which indicate that both IPR protection and regional technical cooperation mechanism in these regions provide guarantee for low carbon technology diffusion. The cities with the highest impact coefficients are Urumqi and Karamay in Xinjiang Province, which indicate that resource-based cities' acquisition of technologies from other cities actually increases their carbon emissions (Meng and Lu, 2012; Meng and Wang, 2017).
In 2013, the influence coefficient of IPR*DS from large to small is: Cities in the northwest and Yunnan province > Cities in the south of the Yangtze River > Cities in North China > Cities in the northeast China. Except for Urumqi and Karamay, the influence coefficients in all cities are negative. This indicates that during this period, almost all cities achieved CO2 emission reduction through DS.
In 2017, the influence coefficient of IPR*DS from large to small is: Cities in the northwest > Cities in the south of the Yangtze River and northeast China > Cities along the Yangtze River > Cities in North China. The cities with the highest impact coefficients are located in Urumqi and Alxa League, while the regions with the lowest impact coefficients are located in the southern cities of Hebei and the whole region of Henan. This shows that IPR protection gradually expands the impact area of carbon emission reduction through promoting DS (Jiao et al., 2018). This technology progress channel should be served as an important emission reduction measure.
Effect of IPR protection through FDI
From 2005 to 2017, the impact of IPR protection on carbon emissions through FDI showed a trend of fluctuating up and down (as shown in Figs. 10–13). In different times, the positive and negative influence coefficients always coexist in different regions. This indicates that the “pollution haven” effect and “pollution halo” effect always coexist at different times (Jiang et al., 2018).
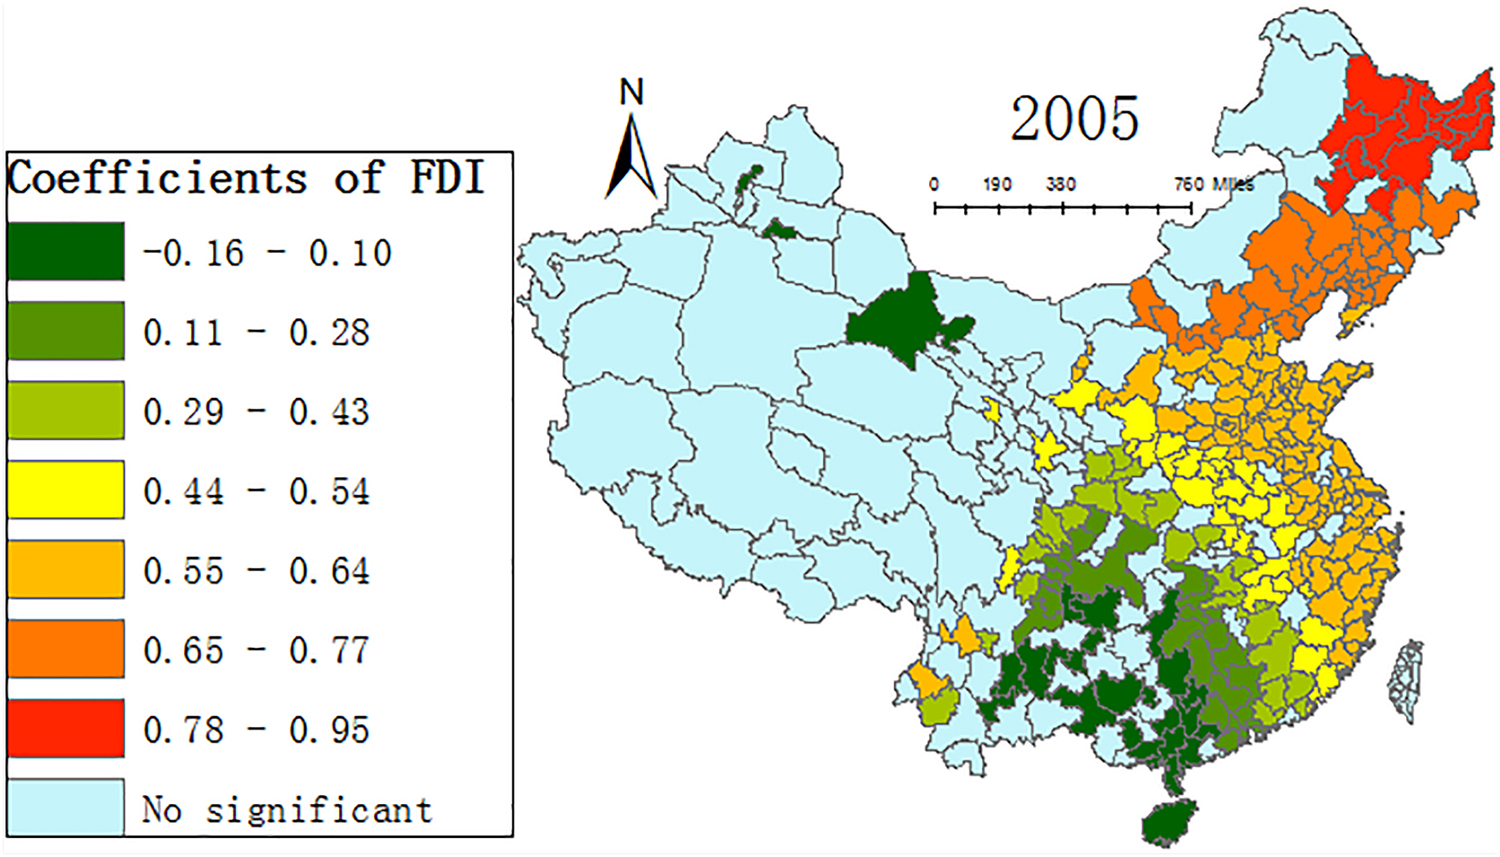
Regression coefficients of the effect of IPR on CO2 through FDI for 2005. FDI, foreign direct investment.
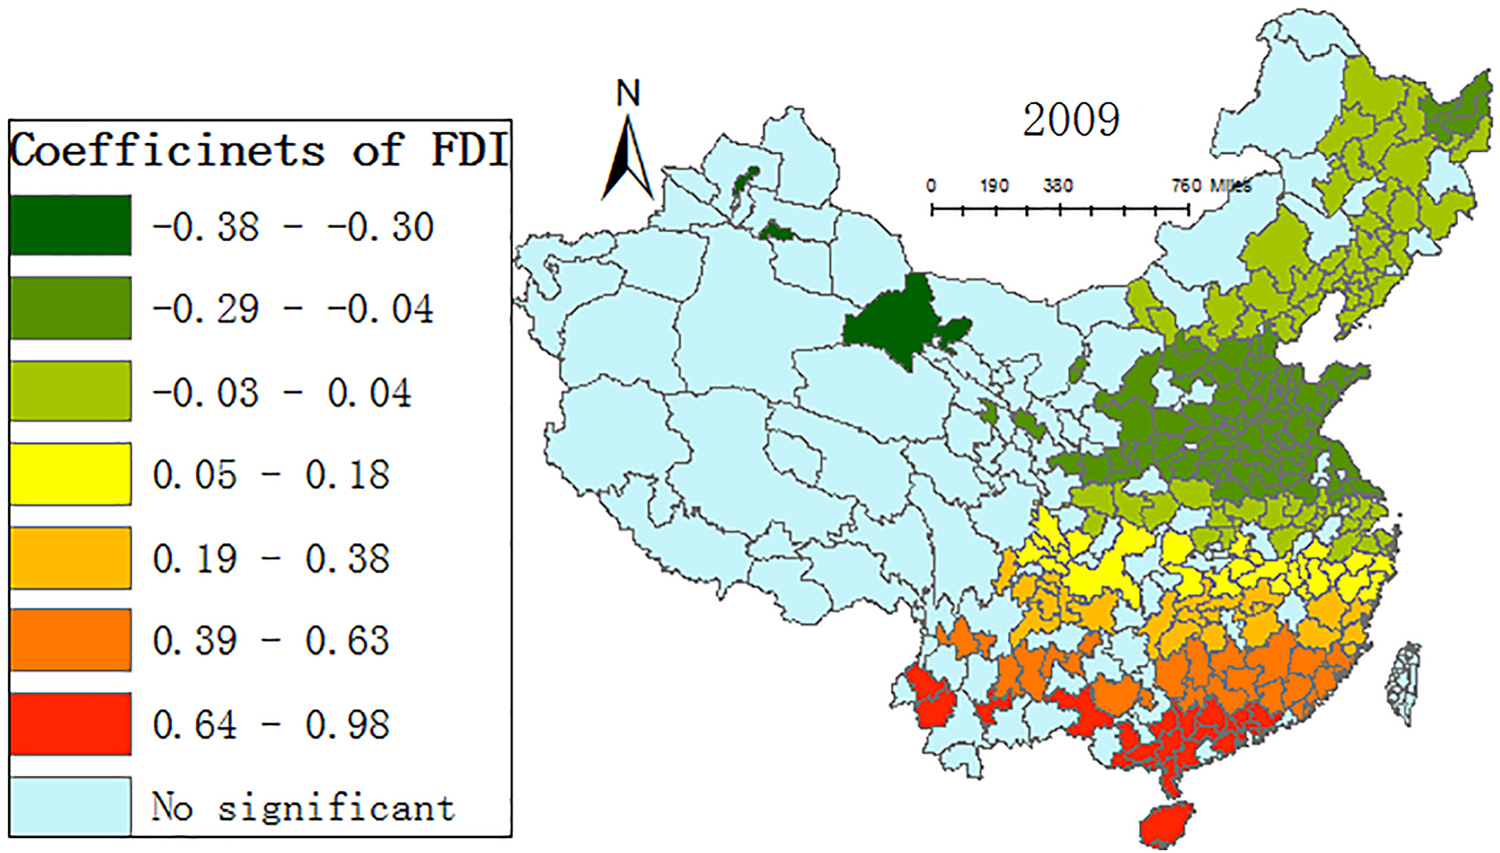
Regression coefficients of the effect of IPR on CO2 through FDI for 2009.
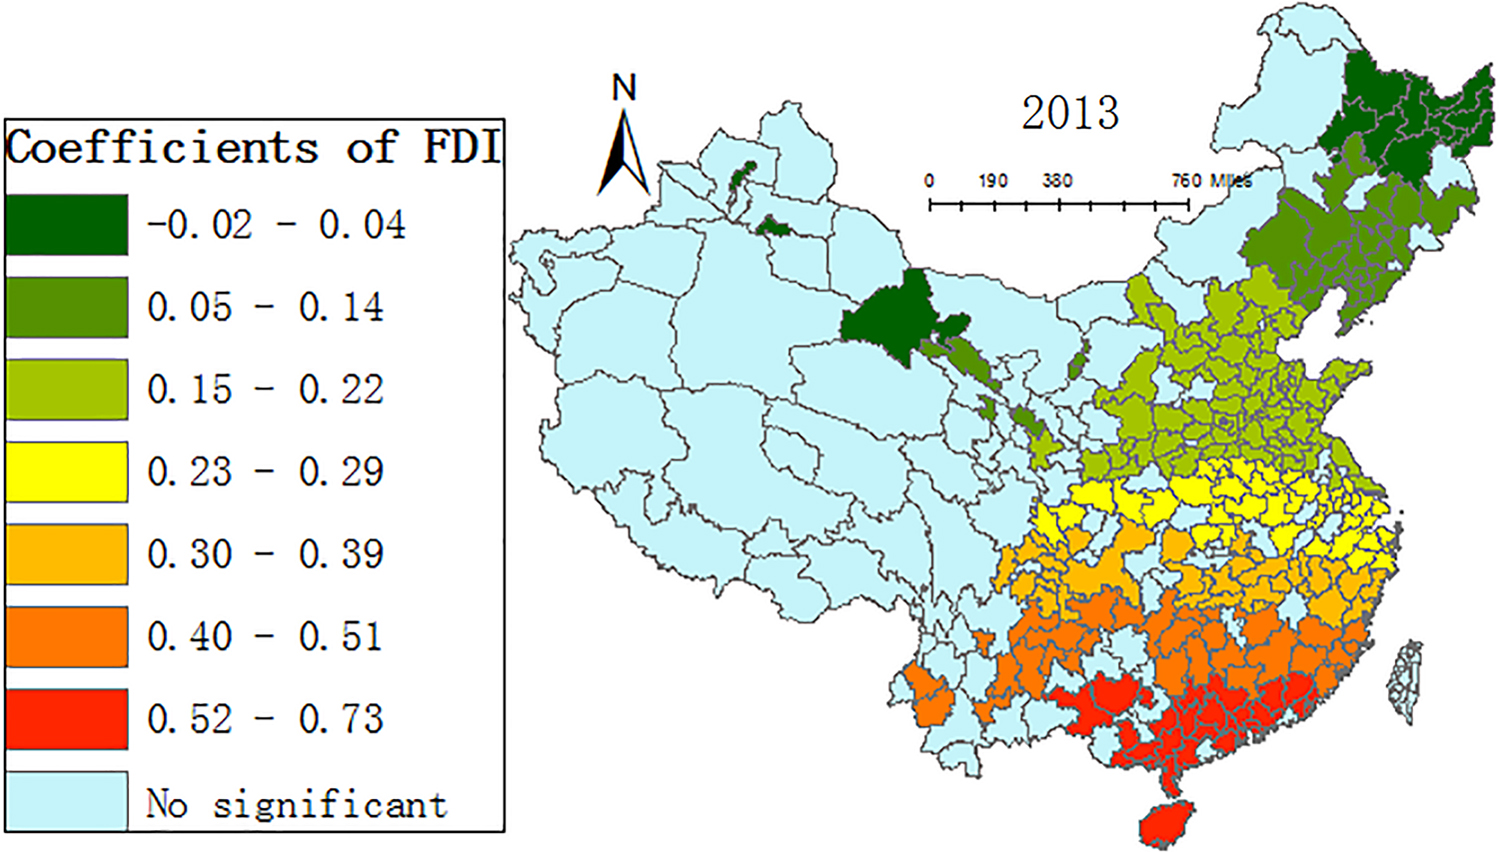
Regression coefficients of the effect of IPR on CO2 through FDI for 2013.

Regression coefficients of the effect of IPR on CO2 through FDI for 2017.
In 2005, the influence coefficient of IPR*FDI from large to small is: Most of the cities in Heilongjiang > Cities in Liaoning > Cities in North China > Cities along the Yangtze River > Cities in South China. The areas with the highest influence coefficients are located in Harbin, Yichun, Jiamusi, and other surrounding cities. This indicates that the “pollution haven” effect is significant in Northeast China. The areas with the negative influence coefficient are located in Kunming, Yuxi, Nanning, and Fangchenggang. This indicates that the “pollution halo” effect is significant in Southwest China.
In 2009, 2013, and 2017, the influence coefficient of IPR*FDI from large to small is: Pearl River Delta cities > Cities along the Yangtze River > Cities in North China > Cities in the Northeast. The reason why the impact coefficient of IPR protection keeps a similar influence law is that since 2009, China's economy has evolved from east–west differentiation to north–south differentiation, and the regional differentiation presents the “Matthew effect.” Cities along the Pearl River Delta and the Yangtze River have continuously optimized the business environment for attracting foreign investment. The continuous inflow of population has promoted the further economic development of the region, which has generated a virtuous cycle for attracting foreign investment. On the contrary, the northern region, especially the northeast region, has seen the flight of population and foreign capital, thus reducing its environmental impact. This shows that IPR protection failed to provide an environment that encouraged the entrance of high-technology foreign companies. Consequently, the pollution-intensive industries migrated to most south cities, showing the “pollution haven” effect.
Robustness check
The previous research is mainly based on the spatial geographical distance to construct the spatial weight matrix, without taking into account the spatial correlation of economic activities. Based on the research of Jiao et al. (2018), this study incorporated regional economic activities into the framework and constructed an economic distance weight matrix that could take into account the spatial correlation of regional economy and geography at the same time, so as to test whether the results are robust. The results show that the GWRK model still has the best fitting effect using the economic distance weight matrix. And although the coefficients of the estimated results varied, their direction and significance level did not change fundamentally (Table 4). This also indicates that the results are robust and reliable.
Robustness Tests with Different Spatial Weight Matrices
Discussion
Using the city-level CO2 concentration in China from 2005 to 2017, the GWRK model was used to explore the spatial distribution of the influence of technological progress in three forms. We found that there was significant spatial heterogeneity on the impact of IPR protection on CO2 emissions through different technological progress channels. These new empirical results help to determine the direction and strength of the spatial impact of IPR protection on CO2 at a city level, which is in contrast to the results of previous researches (Dou, 2013; Jiao et al., 2018).
The first finding is that in most cities, IPR protection increases carbon emissions through R&D, but the impact is decreasing. While in a few cities, it reduces carbon emissions, there is a north–south divide in this impact, which is in line with existing researches (Dong et al., 2016; Wang et al., 2016). However, existing studies mostly use data at the provincial level, and this study further analyzes the relationship at a city level. Generally, the major mechanisms for IPR protection through R&D investment to decrease CO2 emissions depend on direct and indirect influences. IPR had a direct effect on CO2 emissions. Reasonable protection of IPR enables converting R&D investment into green technologies, which, on the one hand, promotes industrial upgrading and, on the other hand, directly utilizes energy conservation and emission-reduction technologies (Bai et al., 2019). IPR had an indirect effect on CO2 emissions through a regional demonstration effect or competition effect. In addition, the increase or decrease of carbon emissions depends on the combined effect of two factors: R&D intensity and R&D efficiency (Wang and Wang, 2019). Although most cities have increased the R&D intensity, the level of IPR protection has affected the market-oriented transformation of technological achievements and reduced the R&D efficiency.
IPR protection through DS had a significant impact of inhibiting CO2 emissions. There is also a north–south divide in this impact. This is not in line with existing research of Dong et al. (2016) and Wang et al. (2016), who believed that the impact of technology spillover on carbon emissions showed a difference between the east and the west. Beijing, Shanghai, and the southern cities are rich in technology and talent reserves and have developed intercity and intracity transport networks. This has led to a technology agglomeration effect in these areas, making it the birthplace of low-carbon technologies; thus, these cities exhibit significantly reduced carbon emissions. In addition, we found that this effect is not affected by provincial administrative barriers, but strongly correlated with intercity economic and traffic closeness. The Beijing–Tianjin–Hebei region, the Yangtze River Economic Belt, and the Pearl River Delta, for example, all showed similar effects. A superior IPR environment, well-connected university, and talent resources in the inner metropolitan area have provided a foundation for technology absorption as well. The density of internal transport infrastructure in the inner metropolitan area is conducive to diffusion of technology.
IPR protection through FDI technology spillover had a significant effect of first promoting and then inhibiting CO2 emissions in north cities, while in south cities, IPR protection first inhibits and then promotes CO2 emissions. The law of influence is mainly manifested as the difference between north and south. As regards the country as a whole, with the improvement in the IPR protection level, the “pollution haven” effect of FDI was reduced year by year, whereas the “pollution halo” effect was increasing. IPR protection boosts the development of high and new-technology industries, including information, new energy development, and reserve industries and other industries with high yield, high efficiency, and low consumption. Quality of FDI investment was gradually improved, which was more spent on innovation and application of energy-saving and carbon-reduction technologies, rather than expansion of production scale. In the future, efforts should be made to continue optimizing FDI directory listing. In short, the effect of IPR protection on carbon emissions through FDI technology spillover was manifested as “pollution haven” and “pollution halo” effects. The combined effect of the two effects depended on the energy mix and the technological absorption capacity of the provinces.
Conclusions and Policy Implications
This study focuses on exploring the spatial effects of IPR protection on city-level CO2 emissions through R&D investment, FDI technology spillover, and DS. This work developed an extended EKC model to investigate the influencing mechanism of IPR protection using the GWRK method. The main conclusions are as follows.
The impact of IPR protection on carbon emissions through R&D investment showed a trend of decreasing first and then increasing. This effect showed a large spatial difference, which is related to the impact of IPR protection on R&D efficiency.
IPR protection through DS had a significant effect of inhibiting CO2 emissions. There is a north–south divide in this impact, which is related closely to the transport connectivity, technology absorption capacity, and IPR environment of each region.
The impact of IPR protection on carbon emissions through FDI showed a trend of fluctuating up and down. The influence of IPR protection on CO2 emissions through FDI depended on the “pollution haven” effect and “pollution halo” effect.
Given the above conclusions, we propose the following policies to reduce city carbon emissions:
As the effect of IPR protection on CO2 emission demonstrated spatial effect characteristics, each city must consider both its own economic level, R&D stocks, and human capital status, as well as those of its neighboring cities, when setting the level of IPR protection. IPR protection should be reasonably determined to promote the improvement of R&D efficiency. IPR protection plays a vital role in reducing CO2 through DS. Infrastructure connectivity in Beijing–Tianjin–Hebei and the Yangtze River Delta should be strengthened. Since urban technology spillover is not restricted by provincial boundaries, technical cooperation between cities in different provinces within metropolitan areas should be strengthened. The government should continue to create a high-quality IPR system to promote foreign investment in the local green-technology drive. This implies that foreign investment should be pursued to promote local green development rather than short-term economic benefits. A high-quality IPR system will attract more foreign companies to cooperate with local companies, rather than simply investing in domestic economic output, which may promote local green technology.
Nonetheless, these findings are still preliminary, and there are some limitations in this study. First, the transition from R&D investment to technology commercialization spillover occurs over a long period, and the lag order of R&D spillover was not considered. Further notable results may be obtained by considering the time lag of technology spillovers. Second, the nonlinear effect of technology spillover was not included in the model; thus, the spatial panel threshold model may be adopted to solve this problem in future research. Therefore, future studies should assess the impact of international and domestic technology spillover from these perspectives.
Footnotes
Author Disclosure Statement
The authors declare that they have no known competing financial interests or personal relationships that could have appeared to influence the work reported in this study.
Funding Information
Shijiazhuang Tiedao University's Engineering Construction Management Research Center; the Hebei Province Soft Science Research Base; the Hebei Science and Technology Department's Soft Science Research Project (Grant No. 19456228D); Top Youth Project of Education Department of Hebei Province (Grant No. BJ2020078).