
Abstract
Grassland ecosystems in China are generally fragile, and have suffered severe degradation and desertification in recent decades. Understanding these changes and their drivers is crucial for projecting ecosystem dynamics. This study investigated the spatiotemporal variation of grasslands in China, and quantitatively assessed the influence of natural and anthropogenic factors using net primary productivity (NPP) from 2000 to 2014. The results showed a net increase in total grassland area of 1.30 × 10⁵ km2, and the annual NPP increased significantly from 119.37 to 140.67 g C/(m2·a). Restored grassland dominated the research area, but the spatial distribution of grassland health was highly heterogeneous. Climate change contributed most to the recovery of degraded grasslands, especially in Inner Mongolia and Qinghai, where it was the dominant influence for 83.21% and 87.06% of the total grassland areas, respectively. Meanwhile, human activities contributed to the mitigation of grassland degradation in Tibet and Xinjiang. The opposite occurred in some localized areas of Inner Mongolia and Xinjiang. This suggested that restoration projects should be tailored to alleviate local grassland retrogression and adapt to unexpected events such as concentrated degradation.
Introduction
China has 3.93 million km2 of grassland, which accounts for about 40% of China's total land area (Ni, 2002). However, under the influence of global warming over the last 50 years (Chase et al., 2000) and extensive human activities (Tan et al., 2012) associated with rapid population growth, substantial land use and land cover change, and socioeconomic development (Mu et al., 2013; Zhou et al., 2014), nearly 866,700 km2 (90%) of China's grassland, has been degraded (Nan, 2005; Grumbine, 2014). Five major pastoral areas, mainly located in the Northwest and the Tibetan Plateau, account for nearly 78% of all Chinese grassland (Chen and Wang, 2000), and are more sensitive to climate change and human influences due to their regional climates (e.g., little rain, strong winds, cold, and dry) and fragile ecological environments (e.g., poor soils, sparse vegetation cover, low water content, etc.). Their characteristics have resulted in even more severe degradation or desertification in these grasslands (Wang et al., 2011; Li et al., 2017). Kawanabe et al. (1998) reported that, over the past 40–50 years, one-third of the grassland area of north-eastern China and Inner Mongolia has become degraded. Specifically, nearly 0.62 million km2 of the natural grassland of Inner Mongolia has experienced serious desertification in recent decades (State Forestry Administration, 2011), and nearly 40% of the Tibetan Plateau grassland has been degraded to the point where deserts or “black soil beaches” now occur along with invasion by toxic and inedible species (Li and Huang, 1995; Liu et al., 2008). The situation in Qinghai province has followed similar trends, with the area covered by degraded meadows increasing from 747.73 km2 in 1976 to 900.01 km2 (20.36%) in 2015 (Li et al., 2018).
Substantial land degradation has been linked to issues such as productivity decline, biodiversity loss, environmental carrying capacity decrease, reduced agropastoralist community benefit, etc., all of which impact ecosystems and socioeconomic sustainability (Mao et al., 2018). Although the causes behind grassland degradation are complex, it is widely accepted that climate change and human activities are the main driving forces (Wang et al., 2015; Jiang et al., 2017). Climate change alters photosynthesis rates and controls grass growth by affecting temperature and precipitation (Lehnert et al., 2016; Byrne et al., 2017), and human activities directly damage grassland through agricultural development, tourism development, ecological programs, and especially overgrazing. These pressures not only negatively affect the quality of grassland, but can alter the equilibrium between the supply and demand of grassland creating a feedback loop that exacerbates degradation (Davidson et al., 2012; Wang et al., 2015). To mitigate and manage the multifaceted environmental degradation, a series of national-scale ecological policies and programs concerning pastoral areas have been launched by the Chinese government since 2000, thus shifting the focus toward improving grassland restoration programs (Gang et al., 2018; Huang et al., 2018; Zhang et al., 2018a). However, it is important to note that restoration programs take time before their effects become clear. Therefore, after decades of effort, the following questions can now be addressed: how have the ecological and environment conditions, especially the state of grasslands, changed in the main pastoral areas of China? How have climate change and human activities influenced the grassland ecosystem?
Net primary productivity (NPP) is an objective measure of vegetation cover and plant health, and variability in NPP reflects changes in vegetation-growing conditions (Piao et al., 2007). Numerous studies have reported that NPP is sensitive to both climate change and human effects (Yang et al., 2014), and thus has been widely used to evaluate the recovery of degraded grassland and distinguish between the effects of climate change and human activities on ecosystems (Li et al., 2016; Zhou et al., 2017; Chen et al., 2019; Leeuw et al., 2019). NPP ultimately measures the net amount of solar energy converted into chemical energy through photosynthesis (Field et al., 1998). Haberl (1997) first proposed the human appropriation of NPP to measure the environmental impacts of human activities when the potential and actual NPP was used to assess the relative roles of climate change and the two factors, respectively. It was then introduced as a quantitative assessment of the effects of climate change and human activities on the exacerbation and mitigation of desertification (Xu et al., 2014; Zhou et al., 2015; Chen et al., 2019).
To support the development of policies and programs to mitigate grassland degradation in the pastural areas of China, a deeper and more comprehensive understanding of the relative contributions of climatic change and human activities to changes in grasslands must be prioritized. In this study, a time series of products from the Moderate Resolution Imaging Spectroradiometer (MODIS) along with simulations developed to test various scenarios on grassland NPP were used to quantitatively investigate changes in grasslands and the underlying mechanisms. The main objectives of this study were: (1) to analyze the variability in grassland coverage in China's five major pastoral areas; (2) to evaluate the spatiotemporal distribution of grassland NPP; and (3) to assess the relative roles of natural and anthropogenic influences on the spatiotemporal changes in degraded grasslands. This study will provide a method for evaluating the effectiveness of ecological restoration programs, thus providing better recommendations on the implementation of government policies on the restoration of degraded grasslands in the future.
Materials and Methods
Study area
China's five major pastoral regions are located in northwest China and the Qinghai-Tibet Plateau, in the ranges from 26°05′–53 33′N to 73 40′–135 02′E, and including Xinjiang Uygur Autonomous Region, Tibet Autonomous Region, the Inner Mongolia Autonomous Region, and Qinghai and Gansu province (Fig. 1). Due to their geographical location, west wind circulation, and other factors, drought conditions prevail in the study area, with generally less than 400 mm of precipitation and the well-known large temperature difference between day and night. Meanwhile, the climate conditions exhibit high spatial heterogeneity due to differences in altitude and topography. For example, high mountains are usually characterized by high precipitation and low temperatures. These regions are dominated by grassland of different types (Table 1), and the largest grassland is located in Inner Mongolia (86.67 million hectares), followed by Xinjiang (49.94 million hectares).
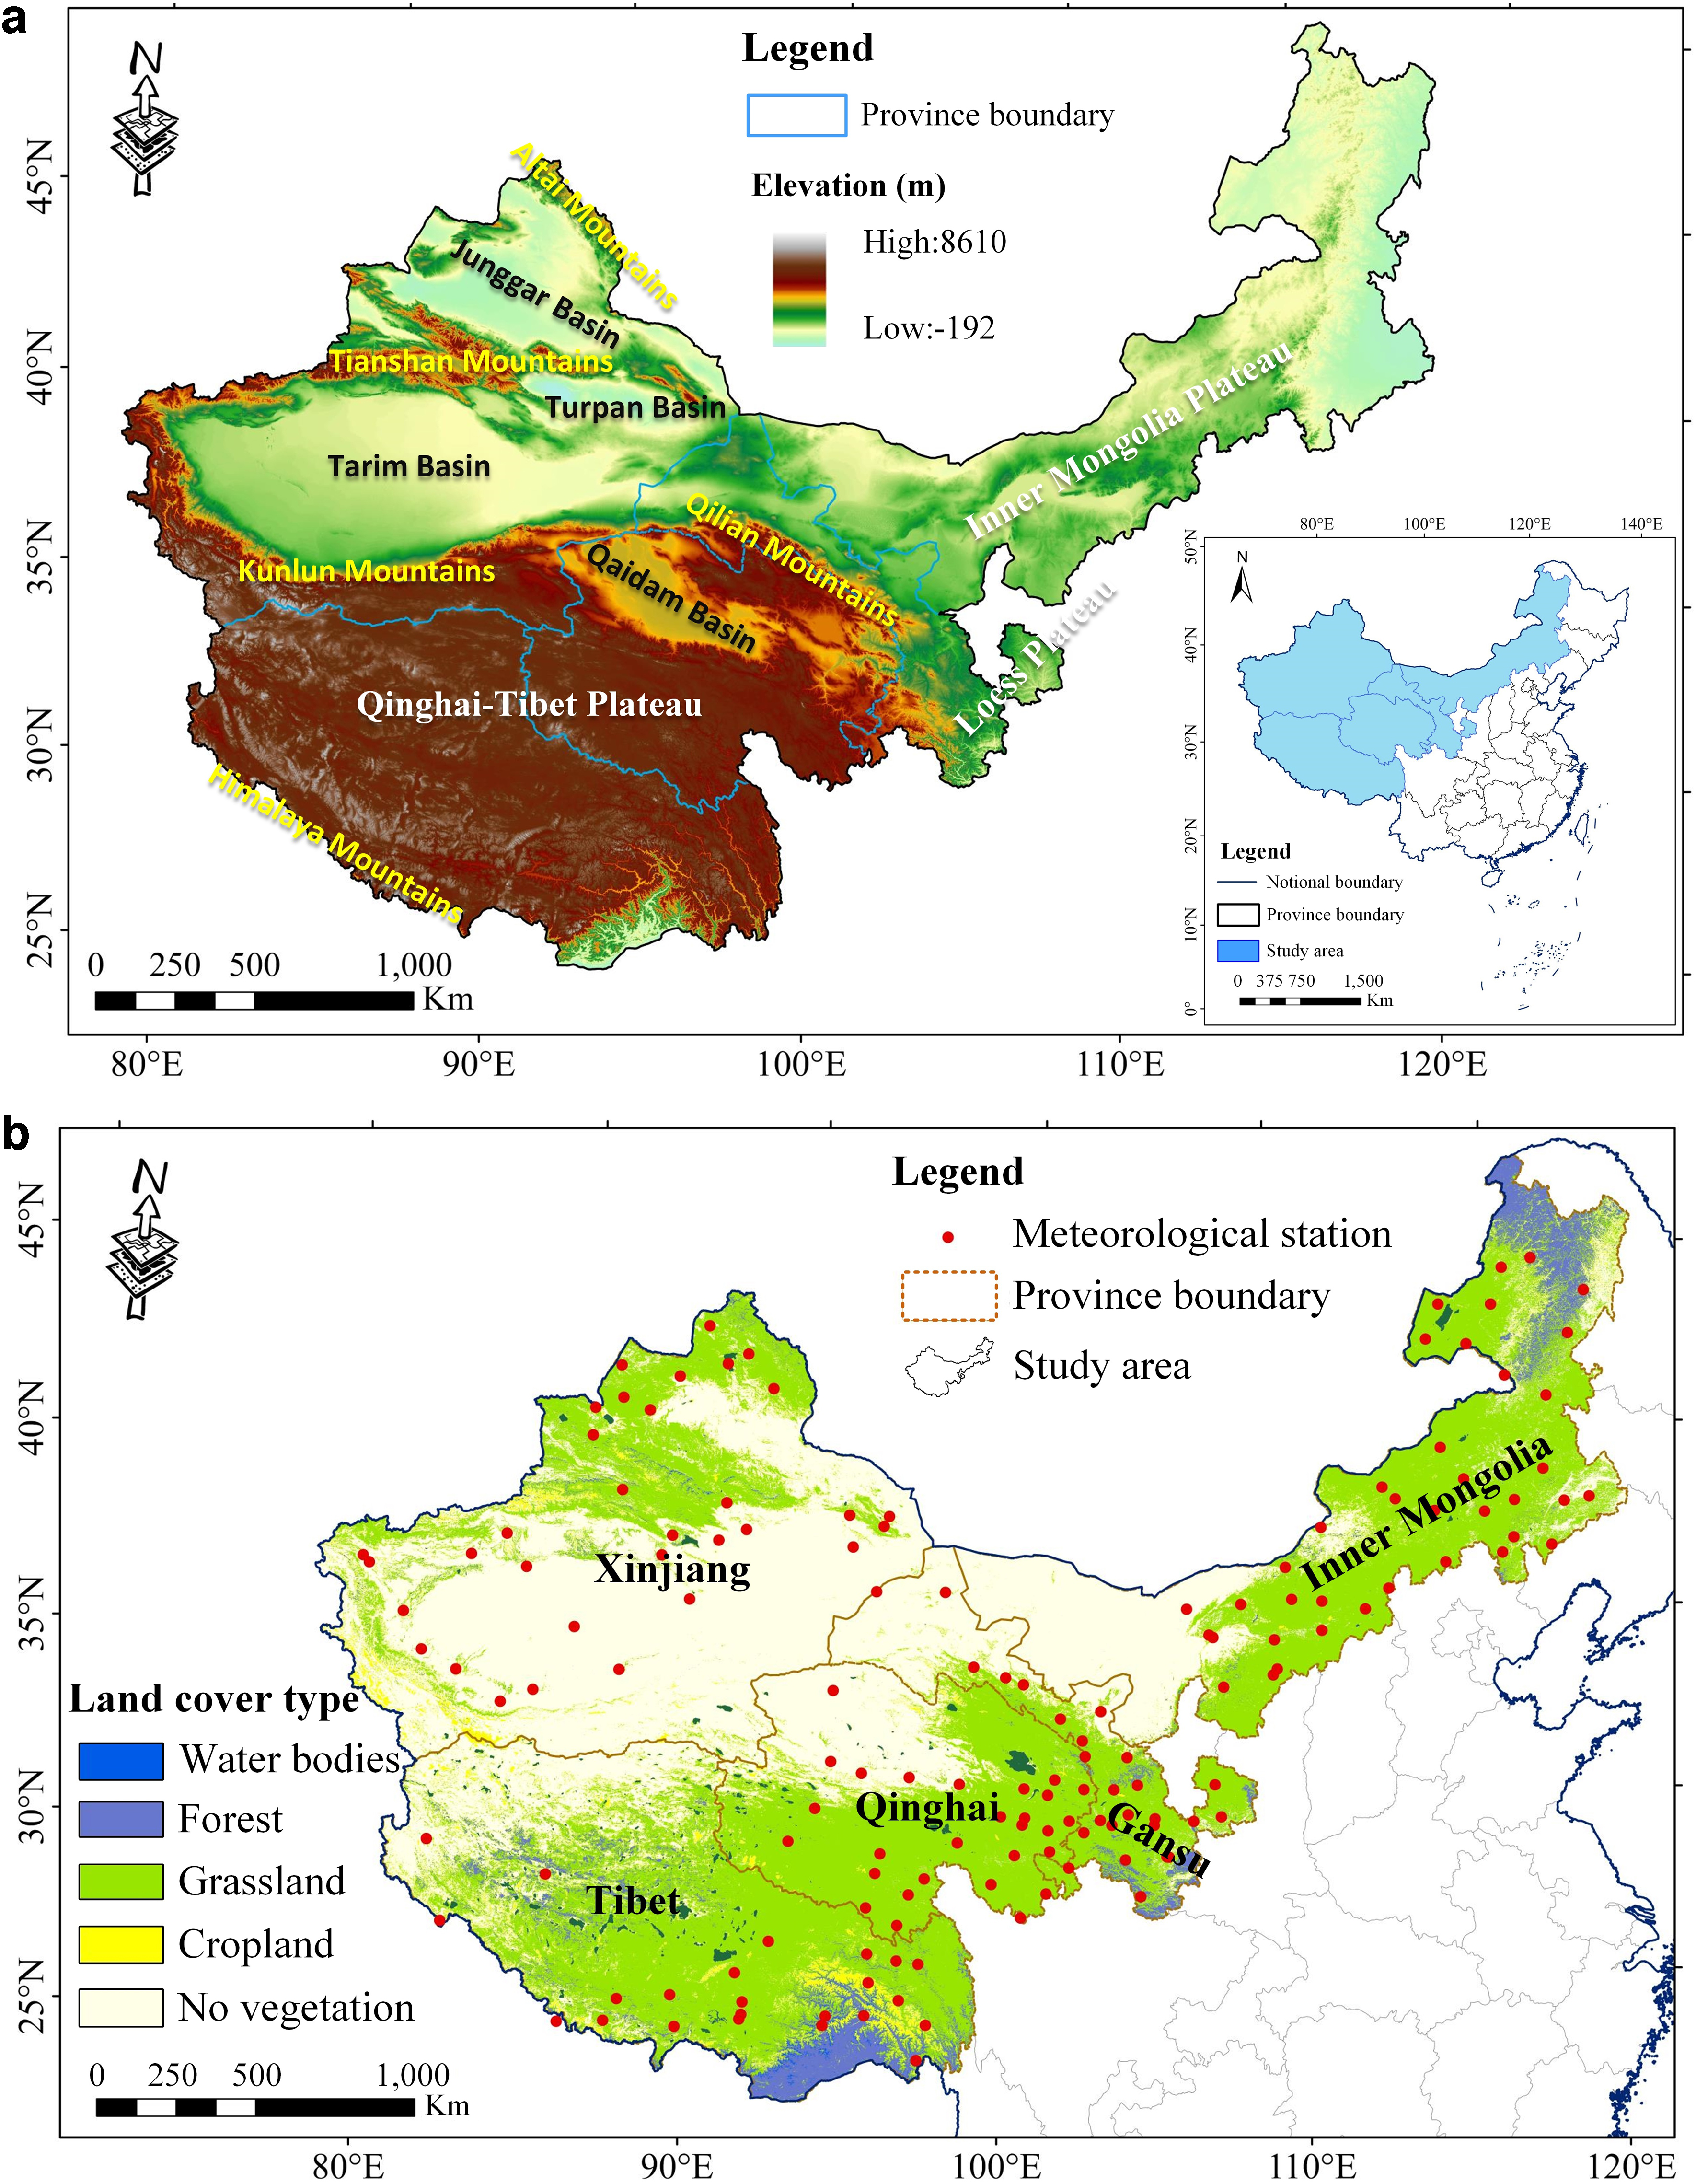
Geographical location of the study area and the topography
The Grassland Types of Each Pastoral Area
Data collection and preprocessing
Annual land cover data
The MODIS land cover product (MCD12Q1) from 2001 to 2014 with a spatial resolution of 500 m was applied to determine land cover types and grassland types. This dataset identified 17 land cover classes, which were defined according to the International Geosphere Biosphere Program (IGBP). In our article, the grids with constant class numbers 6–10 (with shrubland cover, savanna cover, and grassland cover) were selected as areas with single grassland land-cover types (Yang et al., 2016; Chen et al., 2019). To improve accuracy, the original MCD12Q1 data were used to generate the grassland mask image. Then, the following processes were conducted: format conversion, projection coordinate conversion, resampling to 1 km spatial resolution, and clipping based on the boundary of the study area.
Meteorological data
Meteorological data from 2000 to 2014 for 149 stations were obtained from the China Meteorological Data Sharing Service (http://data.cma.cn). The data included monthly average precipitation, temperature, total solar radiation, as well as the longitude, latitude, and elevation of each meteorological station. After screening and eliminating suspicious or missing records, the monthly mean temperature and cumulated monthly precipitation were interpolated using thin plate smoothing splines in ANUSPLIN version 4.3 (Hutchinson, 1995; Xu et al., 2016) and then transformed into raster layers with ArcGIS 10.2 using the same projection format, and same temporal and spatial (1 km) resolutions as the land cover data. To improve the interpolation accuracy, we set the Digital Elevation Model data as an independent covariate in the ANUSPLIN process.
Statistical data
Livestock numbers of the five pastoral provinces were obtained from the National Bureau of Statistics (www.stats.gov.cn/tjsj/ndsj/). A number of large animals (including cattle, buffalo, sheep, and goats) for each province at the end of each year (2000–2014) were used to measure the intensity of human activities.
Methods
Estimation of the potential NPP
There are three main types of models for estimating NPP (Zhang et al., 2016), including climate-based models (Lieth, 1972; Lieth, 1977), light-use efficiency model (Potter et al., 1993), and mechanistic ecological process models (Parton et al., 1993). The Thornthwaite Memorial model was utilized in this study to estimate the potential NPP because of its superior performance (Lieth, 1977):
where NPP p is the annual potential NPP (g C/[m2·a]); v is the annual actual evapotranspiration (mm); L is the annual average evapotranspiration (mm); and t and r are the annual average temperature (°C) and the annual cumulated precipitation (mm), respectively. Considering the computational principle, the potential NPP was usually used to represent a hypothetical condition, namely that the change in NPP was caused solely by climate.
Estimation of the actual NPP
The annual NPP data were obtained from the MOD17A3 Version-55 dataset (1 km spatial resolution) to estimate the actual NPP. MOD17A3 NPP was computed using the amount of photosynthetically active radiation (PAR) based on the BIOMEBGC model, and represented the difference between plant photosynthesis (gross primary productivity [GPP]) and autotrophic respiration (Ra), which measures the released portion of the carbon absorbed. This model can be expressed as follows:
GPP can be estimated by the light-use efficiency model based on the remote sensing data.
where
To verify the estimation accuracy of the actual NPP, field-observed biomass data from Xinjiang, the Tibetan Plateau, and Inner Mongolian were used as observed NPP data for comparison (Fig. 2), and a significant correlation between the observed and estimated NPP data was apparent (R2 = 0.548, p < 0.001, n = 145), indicating that the model was capable of accurately estimating NPP.
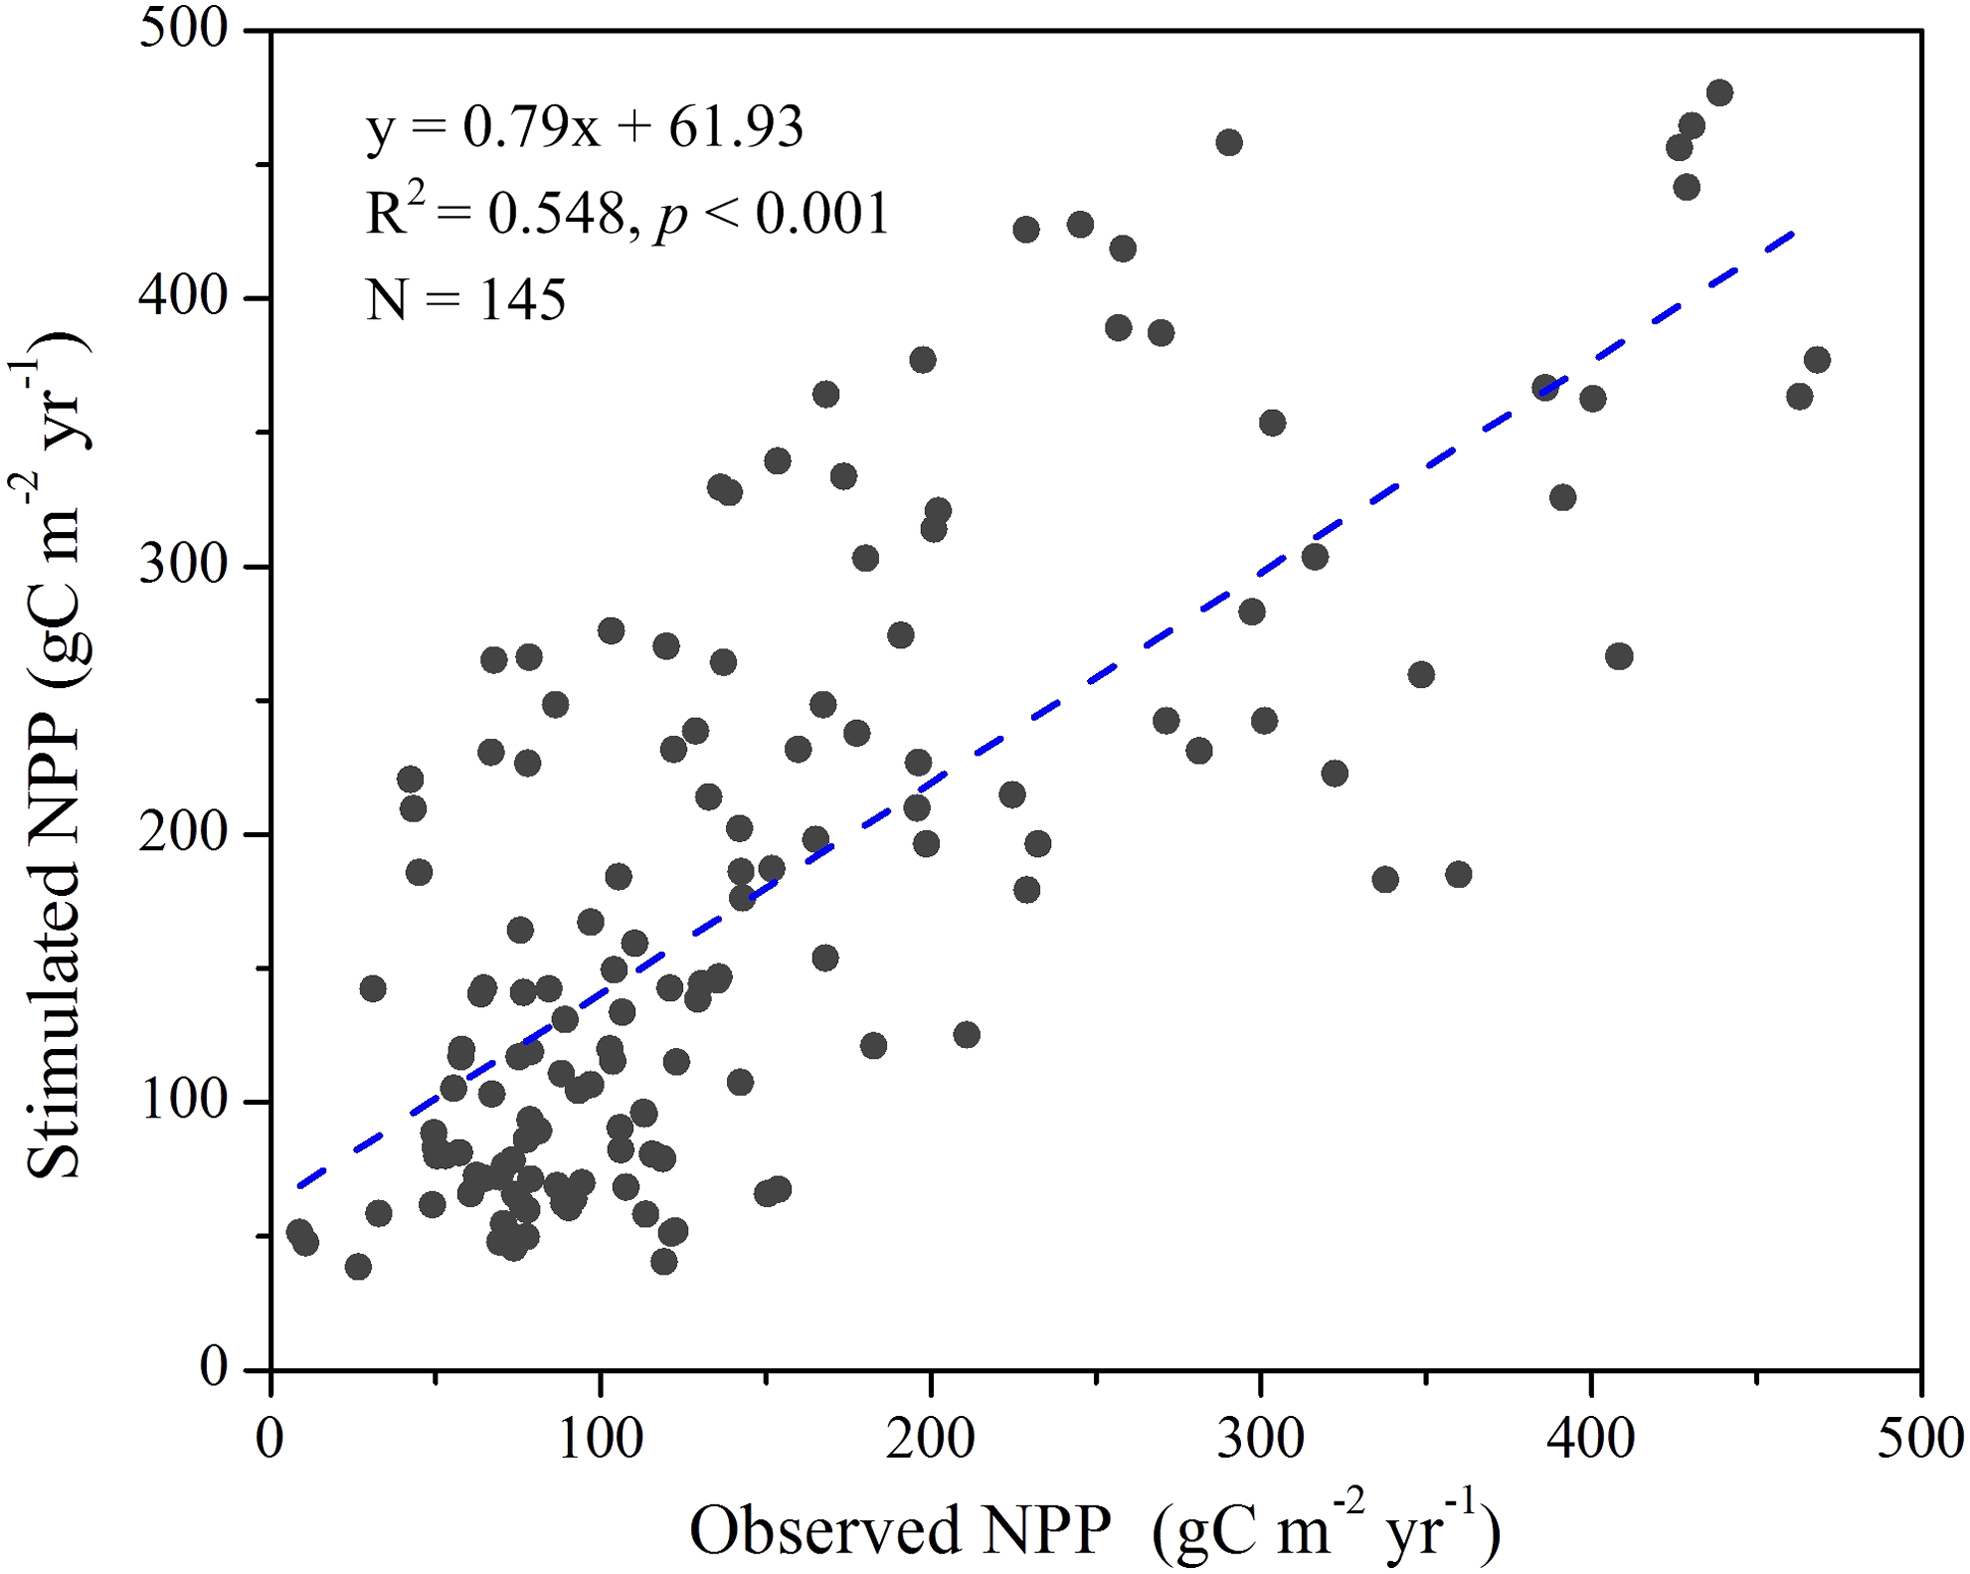
Comparisons of the stimulated NPP with the observed NPP. NPP, net primary productivity.
The difference between potential NPP (NPP
p
) and actual NPP (NPP
a
) was calculated as the human-induced NPP (NPP
h
) to represent the effect of anthropogenic activities on productivity [Eq. (6)] (Haberl et al., 2007; Li et al., 2016).
Thus, positive NPP h values represent a net NPP decrease due to human activities and negative values indicate the opposite.
Analysis of grassland NPP trends
The linear trend of NPP was estimated based on the ordinary least-squares method at the pixel scale from 2000 to 2014 to illustrate the shifts in grassland dynamics over time. The formula is expressed as follows:
where n is the sequential year; and NPP i is the annual NPP value in year i. A positive slope suggests a linear increasing trend in NPP over time and vice versa (Xu et al., 2016).
Scenario design and quantitative assessment method
The relative roles of climate change and human activities in grassland degradation can be quantified by identifying the relationships between NPP dynamics and the degradation status. A positive slope for NPP a (SA) represents increased vegetation cover, or effective mitigation of desertification or vegetation degradation within the study period. The slopes of NPP p (SP) and NPP h (SH) were used to represent the effects of climate change and anthropogenic activities, respectively. When SP was positive, we assumed that the climatic changes benefitted grass growth and halted the advance of desertification and when SP was negative, the changing climate worked against grass growth. Conversely, negative SH values indicated that human activities promoted the growth of grass and vice versa (Xu et al., 2016).
In the case of desertification being mitigated (SA > 0) or exacerbated (SA < 0), there were three possible relative impacts that both climate change and human activities could have on desertification, making for six possible scenarios that can be defined by the slopes of the three types of NPP change (Table 2).
The Six Scenarios to Identify the Relative Roles of Climate and Human Activities in Grassland Degradation or Restoration
Results
Change in grassland cover
Three distinct stages were apparent in the total grassland cover of the study area: a sharp increasing stage before 2007, a rapid decreasing stage between 2007 and 2010, and a slow growth stage from 2010 to 2014 (Fig. 3a). Although there were obvious fluctuations, the total area of grassland still underwent a net increase of 1.30 × 10⁵ km2. Around 3.66 × 10⁵ km2 of grassland was converted from croplands, forests, or barren lands, whereas 1.48 × 10⁵ km2 of grassland had been converted to these types (Fig. 3b). For the total amounts of grassland converted, croplands, forests, and barren lands accounted for 24.81%, 17.15%, and 58.05%, respectively. Additionally, it was intuitively clear that “barren greening,” when areas are converted from “other” land cover to grassland, was more beneficial than when grasslands were converted to “others” over 2001 to 2014.

Temporal dynamics of grassland area
Spatial distribution and variability of annual NPP
From 2000 to 2014, the grassland NPP had a generally decreasing trend from northeast to southwest, and the annual NPP increased significantly from 119.37 to 140.67 g C/(m2·a), with a mean value of 134.76 g C/(m2·a) and a maximum value of 148.44 g C/(m2·a) in 2013 (Fig. 4). The largest NPP values were primarily distributed along the east and northeast margins of Qinghai, in northeast Inner Mongolia, central Gansu, northwest Xinjiang, and southeast Tibet, where the NPP generally exceeded 250.00 g C/(m2·a). Meanwhile, the western regions of Tibet, Qinghai, and Inner Mongolia, which were dominated by desert and barren lands with dry weather conditions, had low NPP values.
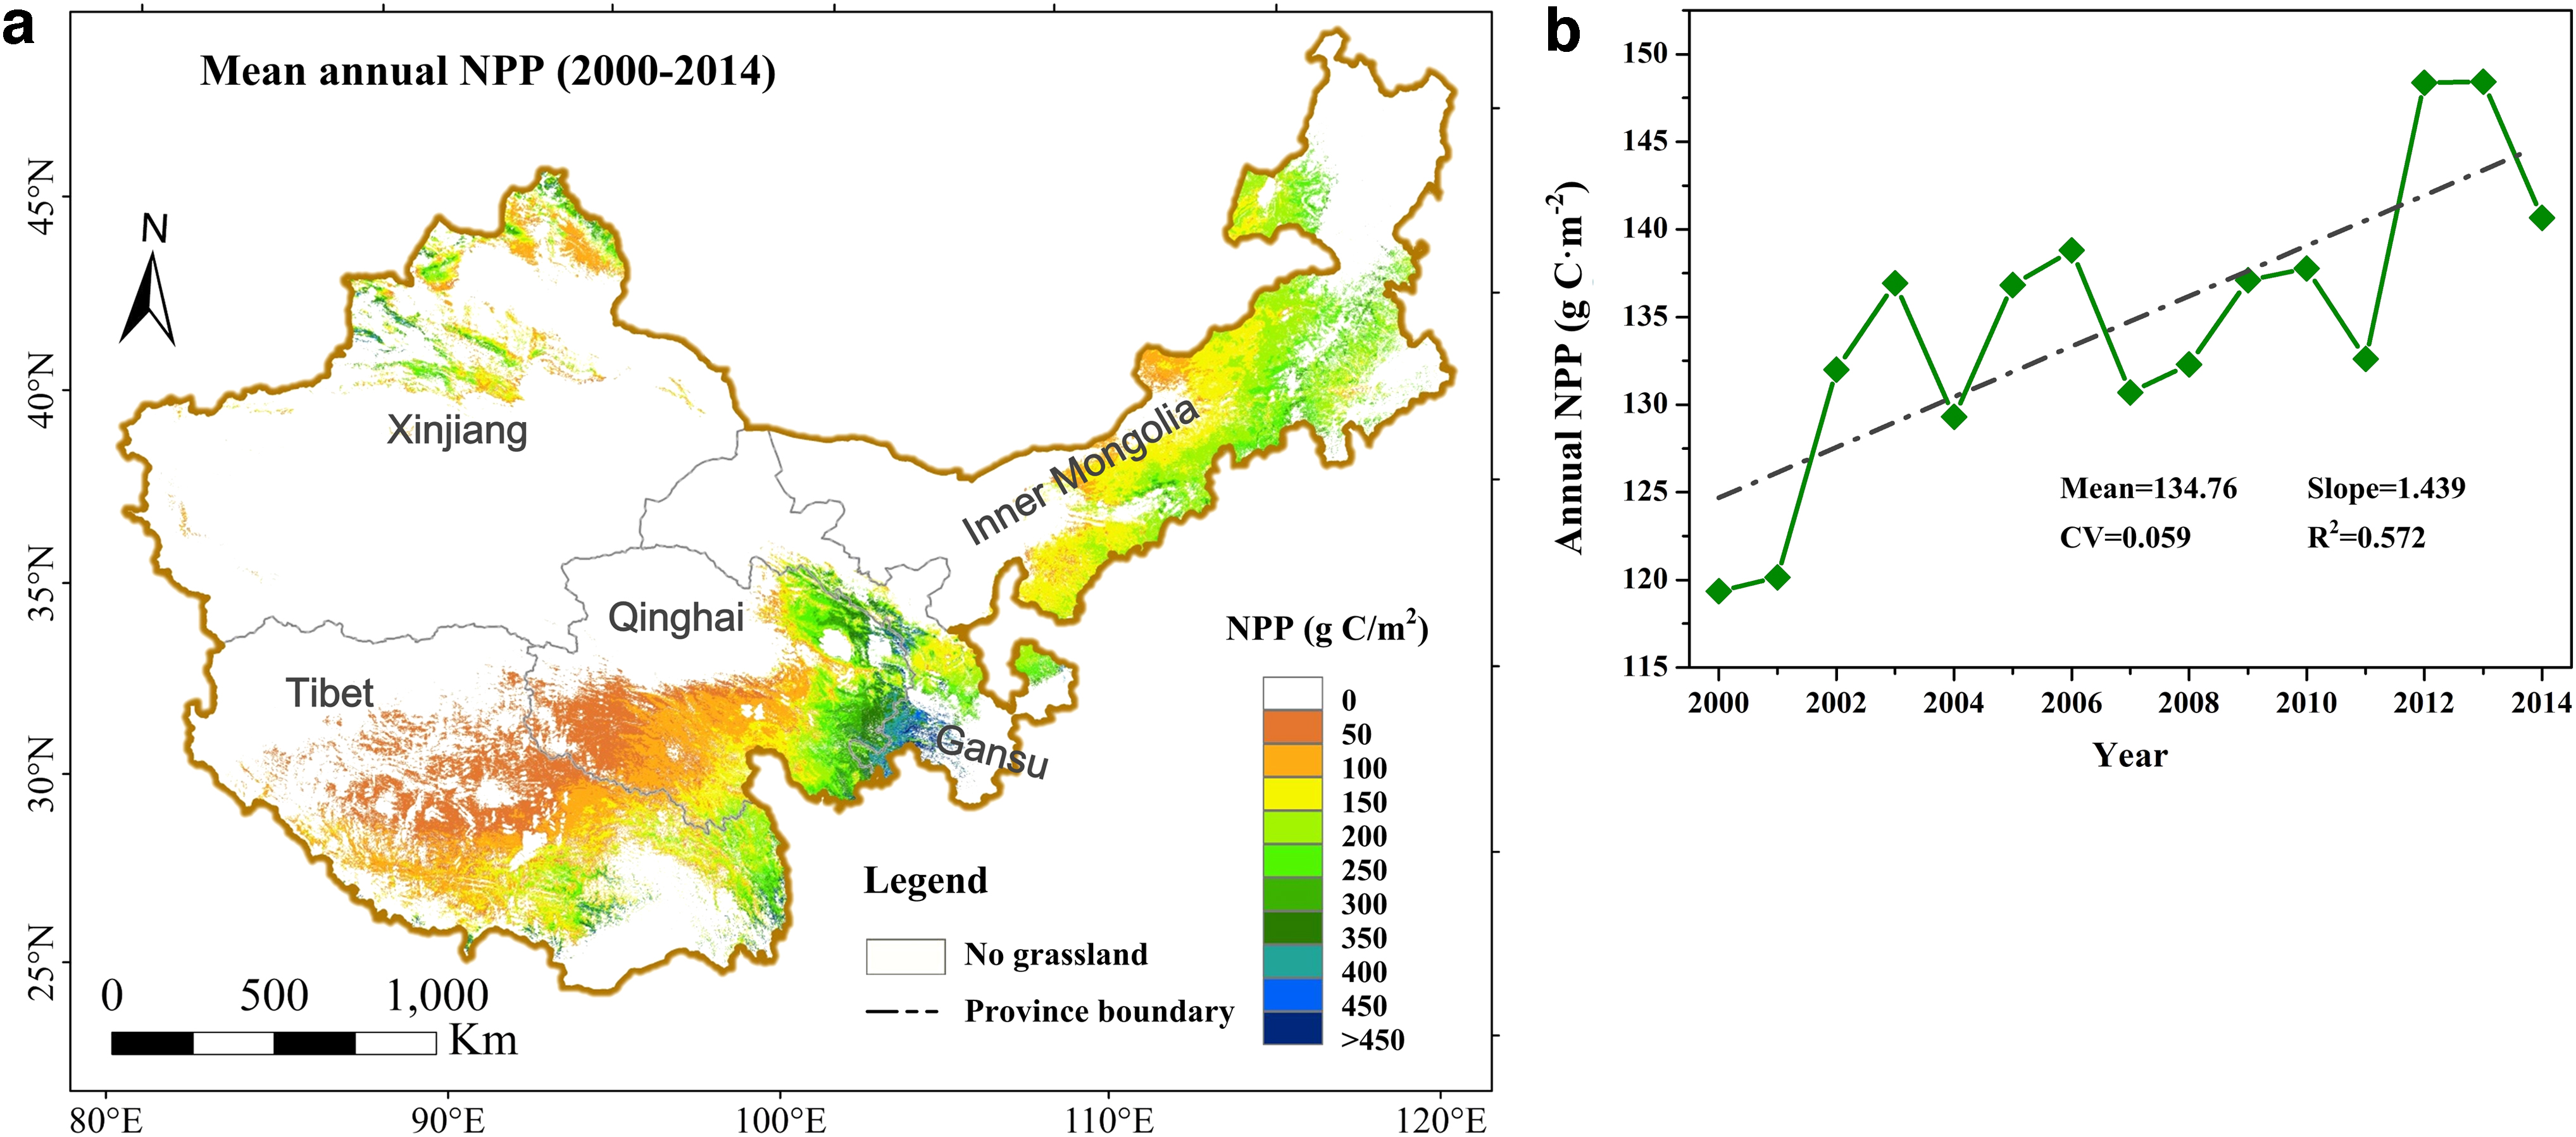
The spatial distribution of mean annual NPP
Spatial distribution of grassland degradation
The overall change in grassland NPP during the study period was increasing (Fig. 5a), and restored grasslands had obviously higher NPP than degraded grasslands, even though the increasing trend was not significant (slope values between 0 and 5). Evidence of grassland improvement was observed throughout Inner Mongolia, Qinghai, and Tibet, and accounted for 85.62% of the study area, while grassland degradation was only observed in 14.38% of the area. The small amount of degraded grassland areas was mainly dispersed across northern Xinjiang, central Inner Mongolia, and southern Tibet. The degradation in these areas was likely caused by farming, overgrazing, or invasion by sandy land.
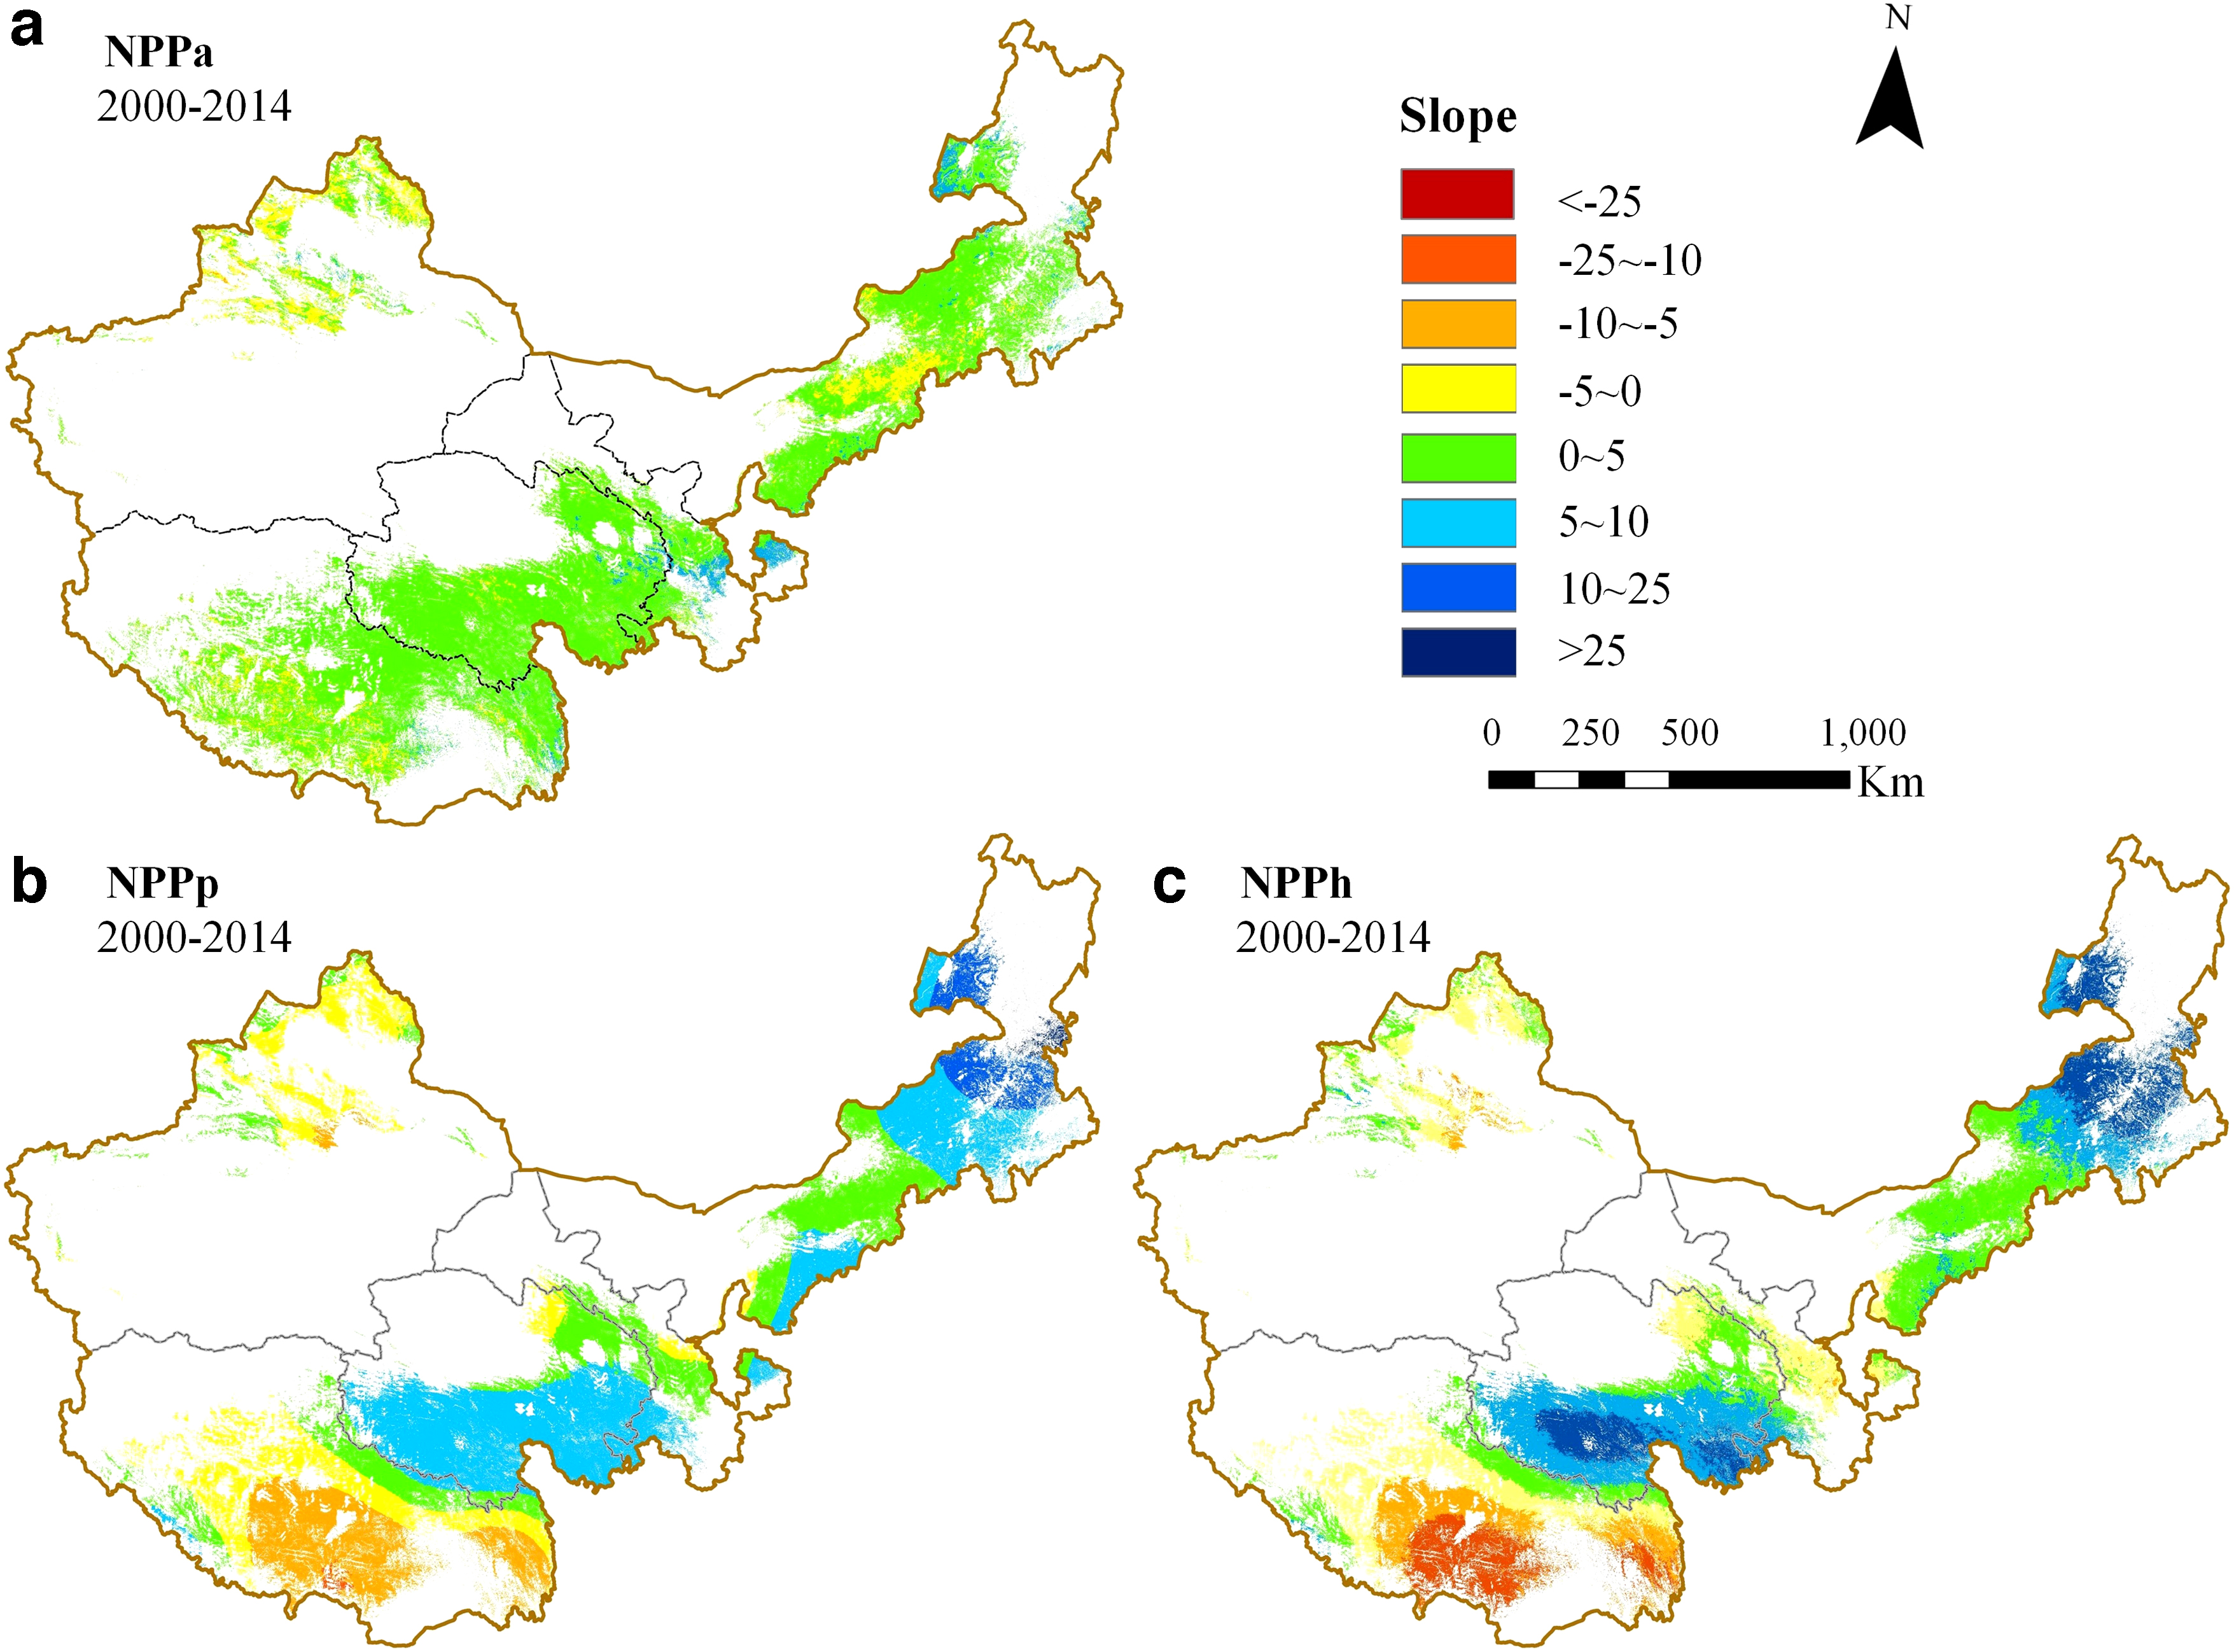
The spatial distribution of slope values for
The change of potential NPP over time (Fig. 5b) showed that the influence of climate on grass growth was spatially heterogeneous. There was a moderate and significant increase (slope values greater than 5) in NPP p in northern Inner Mongolia and south-central Qinghai, but only a slight increasing (slope values between 0 and 5, not significant) trend of NPP p in central Inner Mongolia, the border area of Gansu and Qinghai, and the marginal regions in northeast Tibet. Regions with decreasing NPP p were most common in southern and eastern Tibet, and east of Tianshan and south of Altai, which are characterized by high altitudes and harsh cold weather.
The slope of NPP h reflected the influence of human activities on grassland NPP (Fig. 5c), and showed a similar spatial distribution to NPP p . The largest increases (slope values greater than 10) occurred in northern Inner Mongolia and southern Qinghai, whereas the negative values were primarily distributed in southern and eastern Tibet, on the southern and northern slopes of Tianshan, and across a portion of Gansu and Qinghai.
Comparative analysis of the driving factors
The contributions of factors to grassland degradation/restoration were analyzed (Fig. 6) and a quantitative analysis was conducted (Table 3). Three conclusions became obvious: First, the relative role of the two factors showed obvious spatial heterogeneity. Second, the total pixel analysis showed that nearly 85.63% of the grassland experienced desertification mitigation, indicating that grassland restoration dominated the research area. Third, grassland restoration and degradation were dominated by climate change and human activities, respectively, even though climate and human activities played roughly equivalent roles for the latter.
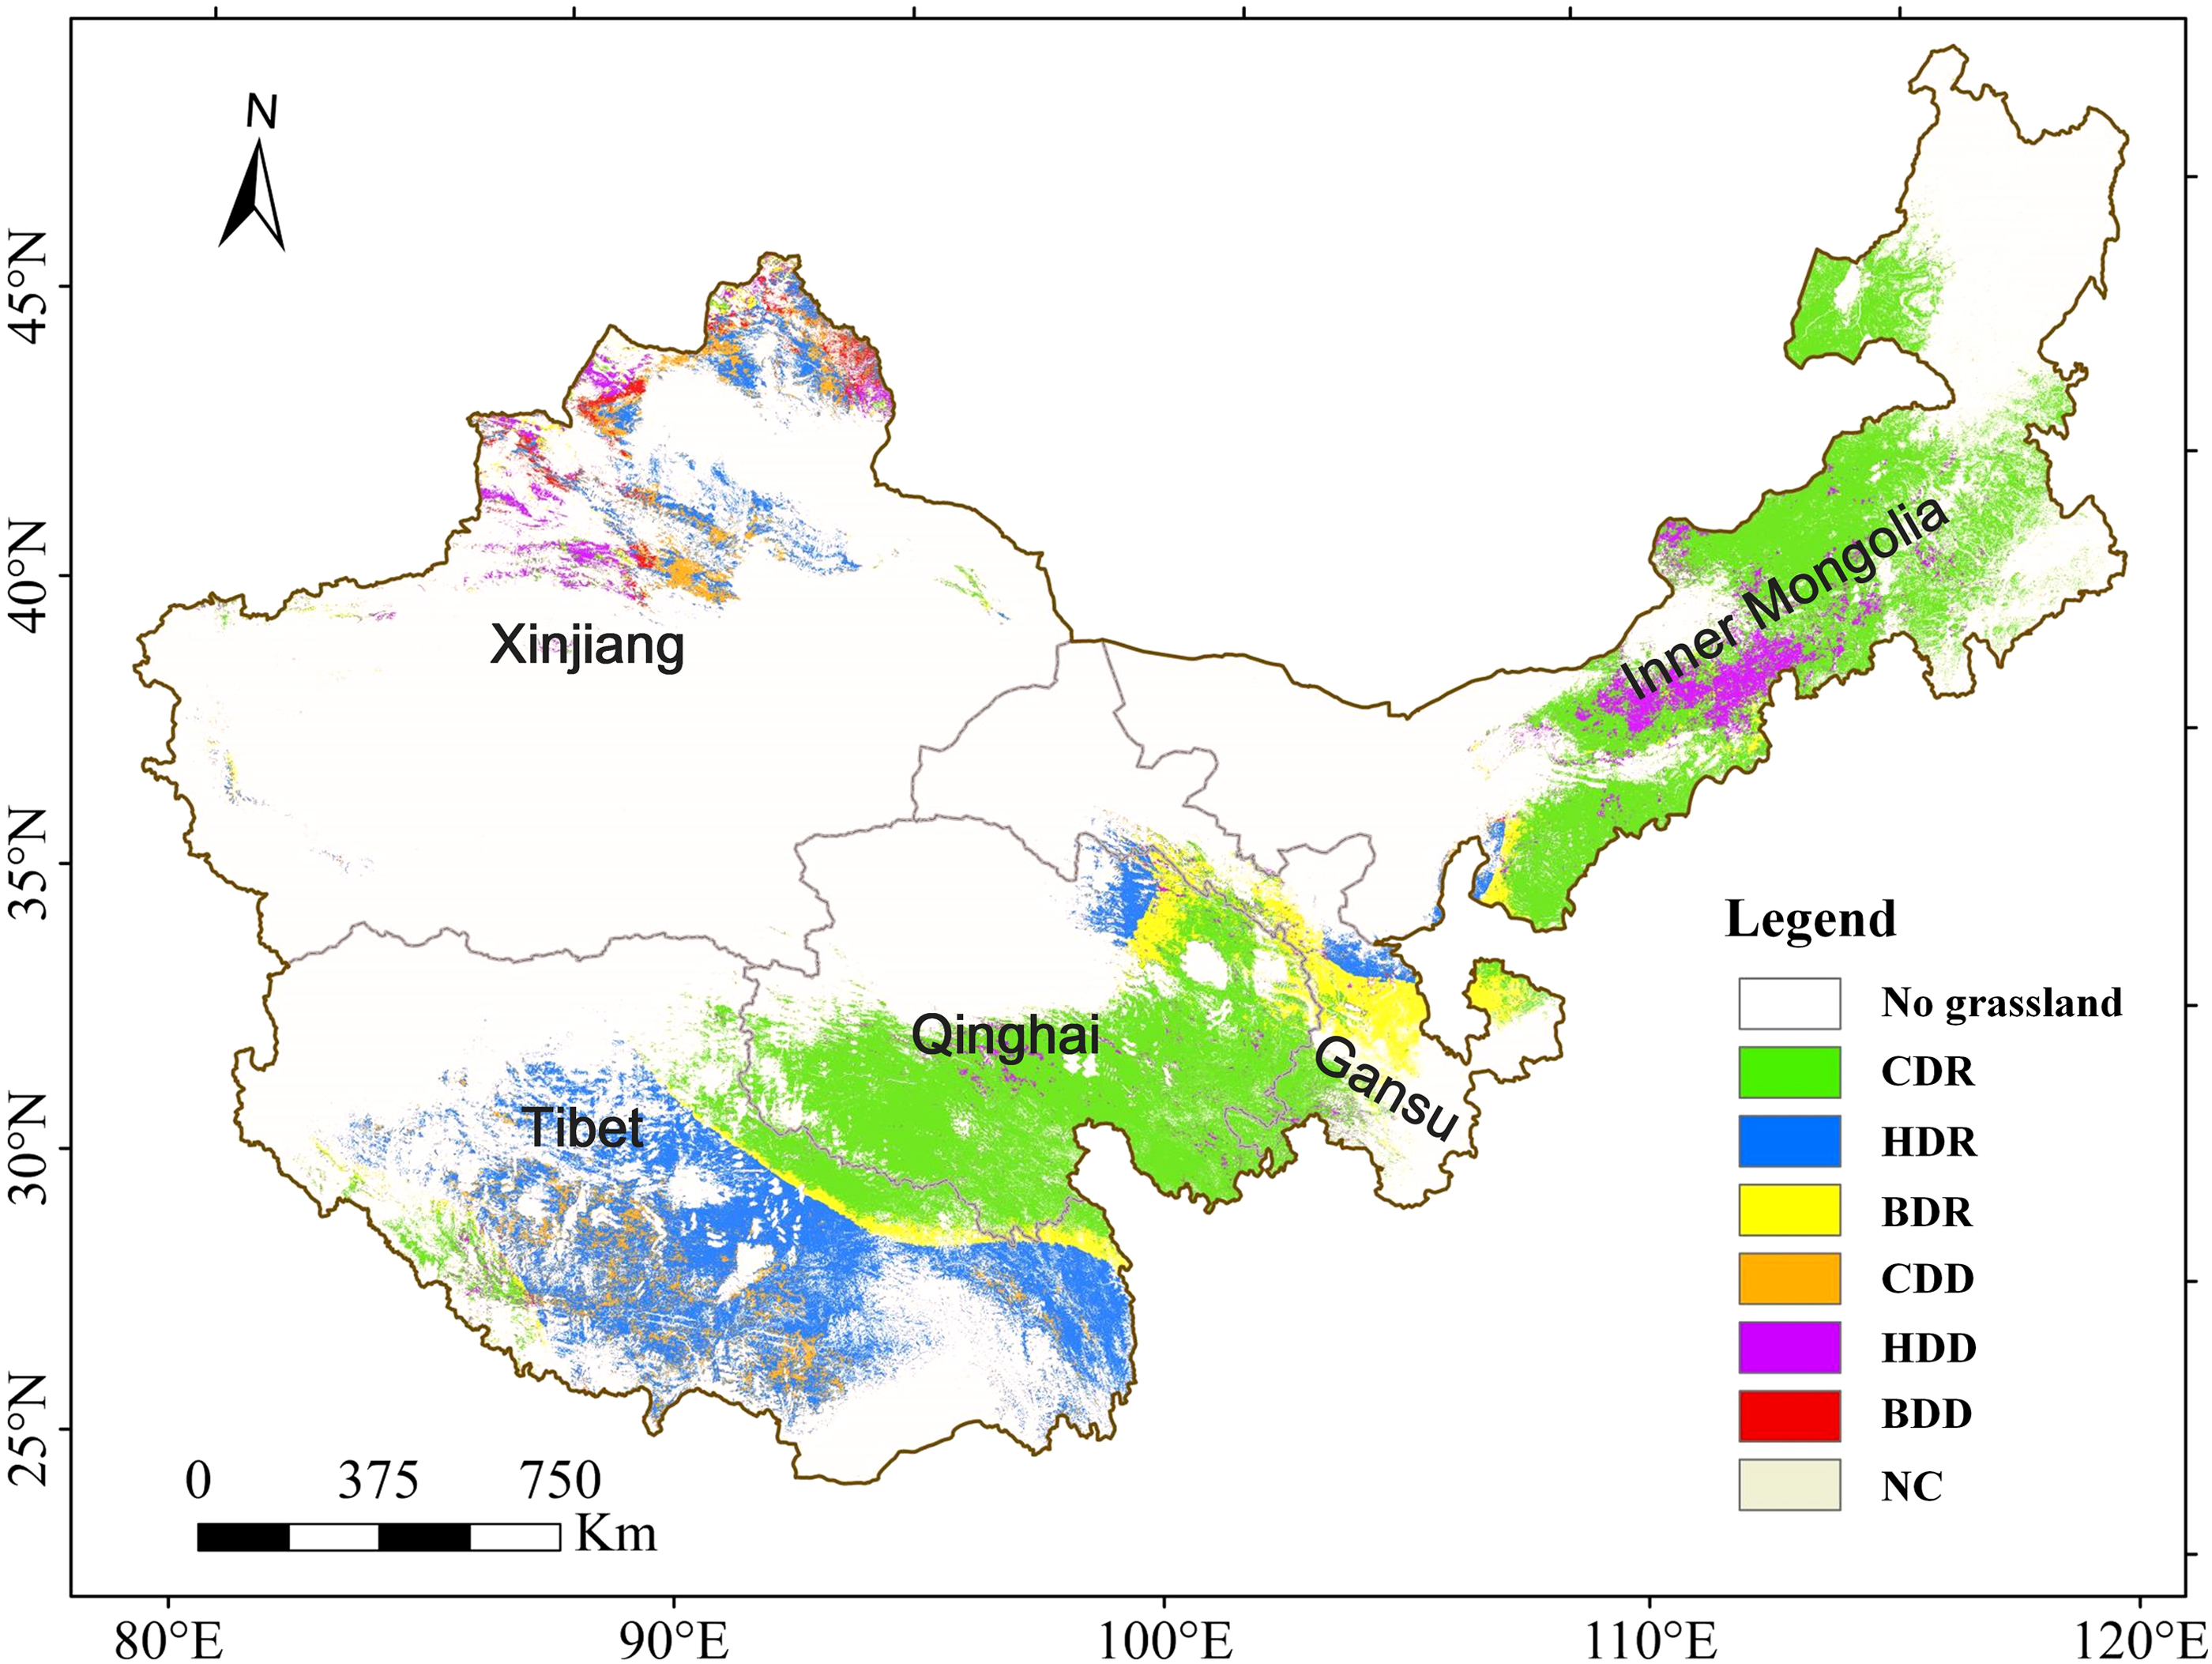
Spatial distributions of the forces driving grassland degradation/restoration in the study area. CDR, the increase in grassland NPP was driven by climate changes; HDR, the increase in grassland NPP was driven by human activities; BDR, the increase in grassland NPP was driven by both factors; CDD, the decrease in grassland NPP was driven by climate changes; HDD, the decrease in grassland NPP was driven by human activities; BDD, the decrease in grassland NPP was driven by both factors; NC, grassland NPP has not changed during 2000–2014.
Percentage and Area of Grassland Degradation/Restoration Caused by Climate Change, Human Activities and an Interaction of the Two Factors During the Periods of 2000–2014
BDD, both climate and human activities dominated grassland degradation; BDR, both climate and human activities dominated grassland restoration; CDD, climate dominated grassland degradation; CDR, climate dominated grassland restoration; HDD, Human activities dominated grassland degradation; HDR, Human activities dominated grassland restoration; NC, grassland NPP has not changed during 2000–2014.
The areas showing grassland restoration driven by climate change (climate dominated grassland restoration [CDR]) were mainly concentrated in regions of Inner Mongolia and Qinghai, and accounted for 54.31% of the grassland area. The mitigation accounting for the other 24.27% was due to human activities (human activities dominated grassland restoration [HDR]), and the remaining 7.05% of the area was affected by the interaction of these two factors (Table 3). Meanwhile, the areas where human activities mainly contributed to grassland restoration mainly occurred in central and eastern Tibet, and were sporadically dispersed across Xinjiang, Gansu, and Qinghai. The areas where climate change and human activities contributed evenly occurred in local regions of Gansu, Qinghai, and Tibet. In contrast, human activities were also responsible for grassland degradation, and were the dominant factor for nearly 96,705 km2 of degraded grassland (6.65% of the total grassland), whereas 89,140 km2 grassland (6.13% of the total grassland area) degradation was driven by climate change and 17,308 km2 of the grassland (1.19% of the total grassland area) degradation was driven by both factors (Table 3). Geographically, the areas where grassland degradation was severe were scattered in Xinjiang, central Inner Mongolia, and some small areas of southern Tibet.
Climate change played a role in promoting grass growth and curbing grassland degradation (Fig. 7a), especially in Inner Mongolia (340,464 km2 and 96.48% of restored grassland area in Inner Mongolia) and Qinghai (335,477 km2 and 90.39% of restored grassland area in Qinghai). Next were Gansu, Tibet, and Xinjiang, where climate was responsible for driving 41.75%, 18.21%, and 13.57% of the grassland restoration, respectively. In contrast, human activities made large contributions to grassland restoration in Tibet (76.04%) and Xinjiang (75.77%), whereas in other areas, human activities accounted for around 10.00% or less. The combined effects of climate change and human activities resulted in 2.42%, 10.65%, 5.75%, 6.00%, and 48.17% of grassland restoration in these five provinces.
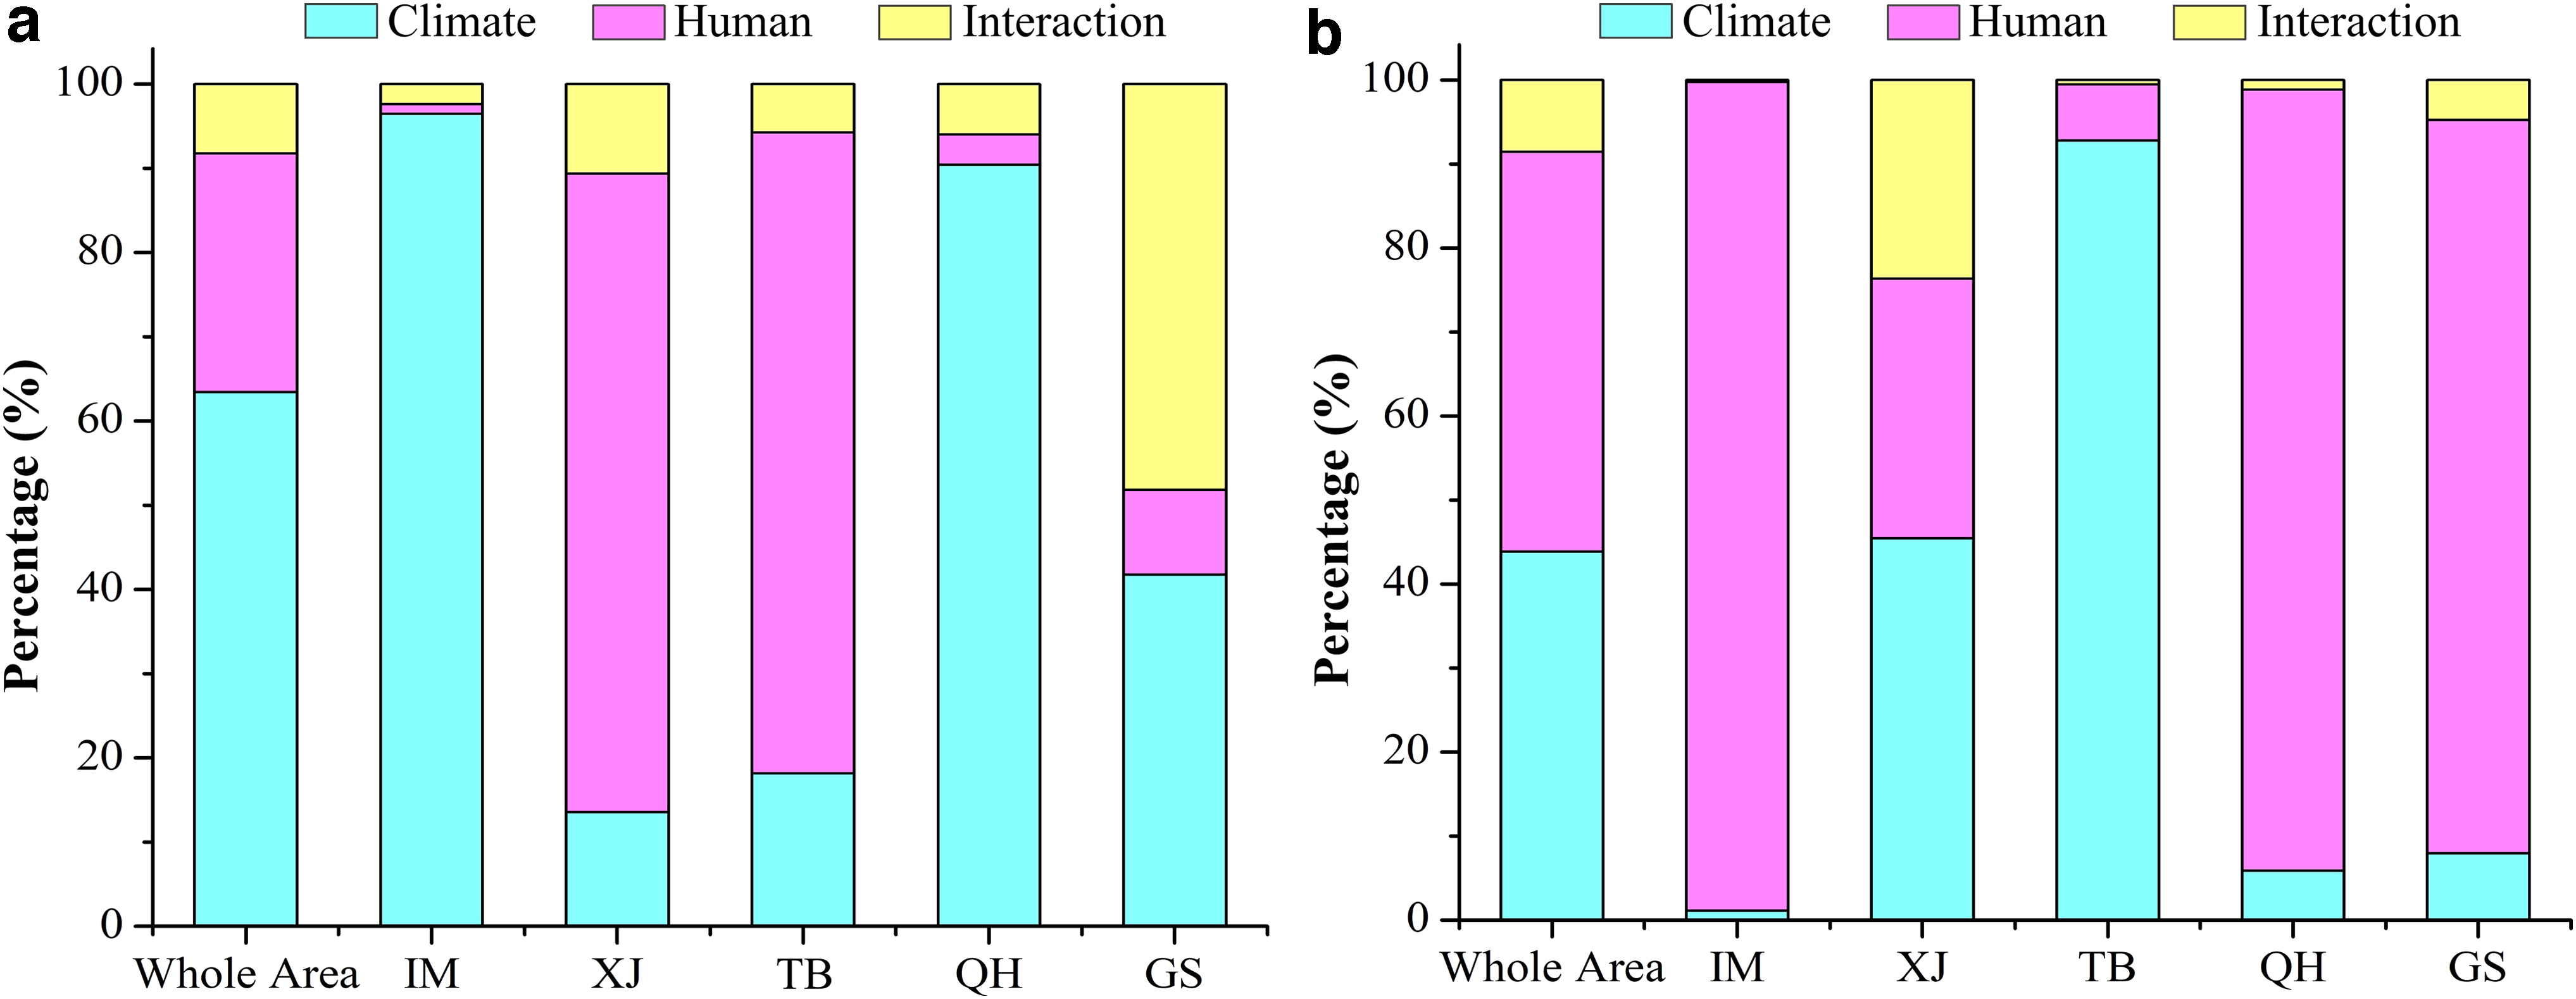
Contributions of climate variation, human activities, and the two factors combined to
The grassland degradation induced by human activities accounted for 98.68%, 30.97%, 6.65%, 93.00%, and 87.29% in Inner Mongolia, Xinjiang, Tibet, Qinghai, and Gansu, respectively (Fig. 7). This indicated that overgrazing or other human activities placed a heavy burden on the grassland ecosystems in these areas. Meanwhile, the degradation due to climate variation affected significant portions of land, especially in Tibet and Xinjiang, which have high attitude zones with fragile ecological environments. Climate variation in these regions has already resulted in the degradation of nearly 55,686 km2 (92.80%) and 31,662 km2 (45.42%) of grassland, respectively. Interestingly, the combined effects of climate change and human activities appeared small when compared with their respective individual impacts.
In summary, the leading factors driving grassland restoration/degradation varied among different regions. Climate, for example, was the main driver of grassland restoration in Inner Mongolia and Qinghai, whereas its influence in Xinjiang and Tibet was small. Conversely, human activities were the driving force of pasture recovery in Xinjiang and Tibet. Similarly, grassland degradation was dominated by human activities in Inner Mongolia, Qinghai, and Gansu, whereas in Tibet it was driven by climate.
Discussion
Effects of climate variation on grassland dynamics
Under the influence of global warming, China's pastoral areas have experienced significant climate change, which drove dynamic change (Pan et al., 2017; Luo et al., 2018). Although recent studies have suggested the climate has shifted from warm and dry to warm and wet in northwest China since the late 1980s (Shi et al., 2007; Qi et al., 2012), the precipitation trends show large spatial variability; that is, the climate became warmer and wetter in parts of northwest China, whereas the rest became warmer and drier (Chen et al., 2014; Li et al., 2016; Zhou et al., 2017). In the current study, precipitation increased in most areas, except in southeastern and western Tibet, east of Tianshan Mountains, eastern Qaidam Basin, and the Tengery desert (Fig. 8a), which was consistent with the trends observed in NPP p (Fig. 5b). The change in temperature showed a similar trend, but with a slightly different distribution. Increases in temperature were mainly concentrated in the Qinghai-Tibet Plateau and the Alashan Ordos area of the Mongolian Plateau. By combining Figs. 6 and 8, it can be seen that grassland restoration corresponded to increasing precipitation and temperature in most regions, except in high-altitude areas like Tibet and the Tianshan Mountains, where NPP increased with the trend toward a warmer and drier climate.

Spatial distribution of the annual total precipitation trends
There was a positive correlation between precipitation and NPP in many regions, especially in Inner Mongolia, Qinghai, and Gansu (Fig. 9a), which was consistent with previous studies (Sun and Du, 2007; Huang et al., 2018). Almost 72% of grassland NPP increased with increased precipitation (Fig. 9a), which was attributed to the impact of soil water replenishment on root activity, plant water status, and photosynthesis (Fay et al., 2008; Mu et al., 2013). However, a negative correlation was clear in central Tibet, although that correlation was more often insignificant (25.23% of all grassland area) than it was significant (2.73%).
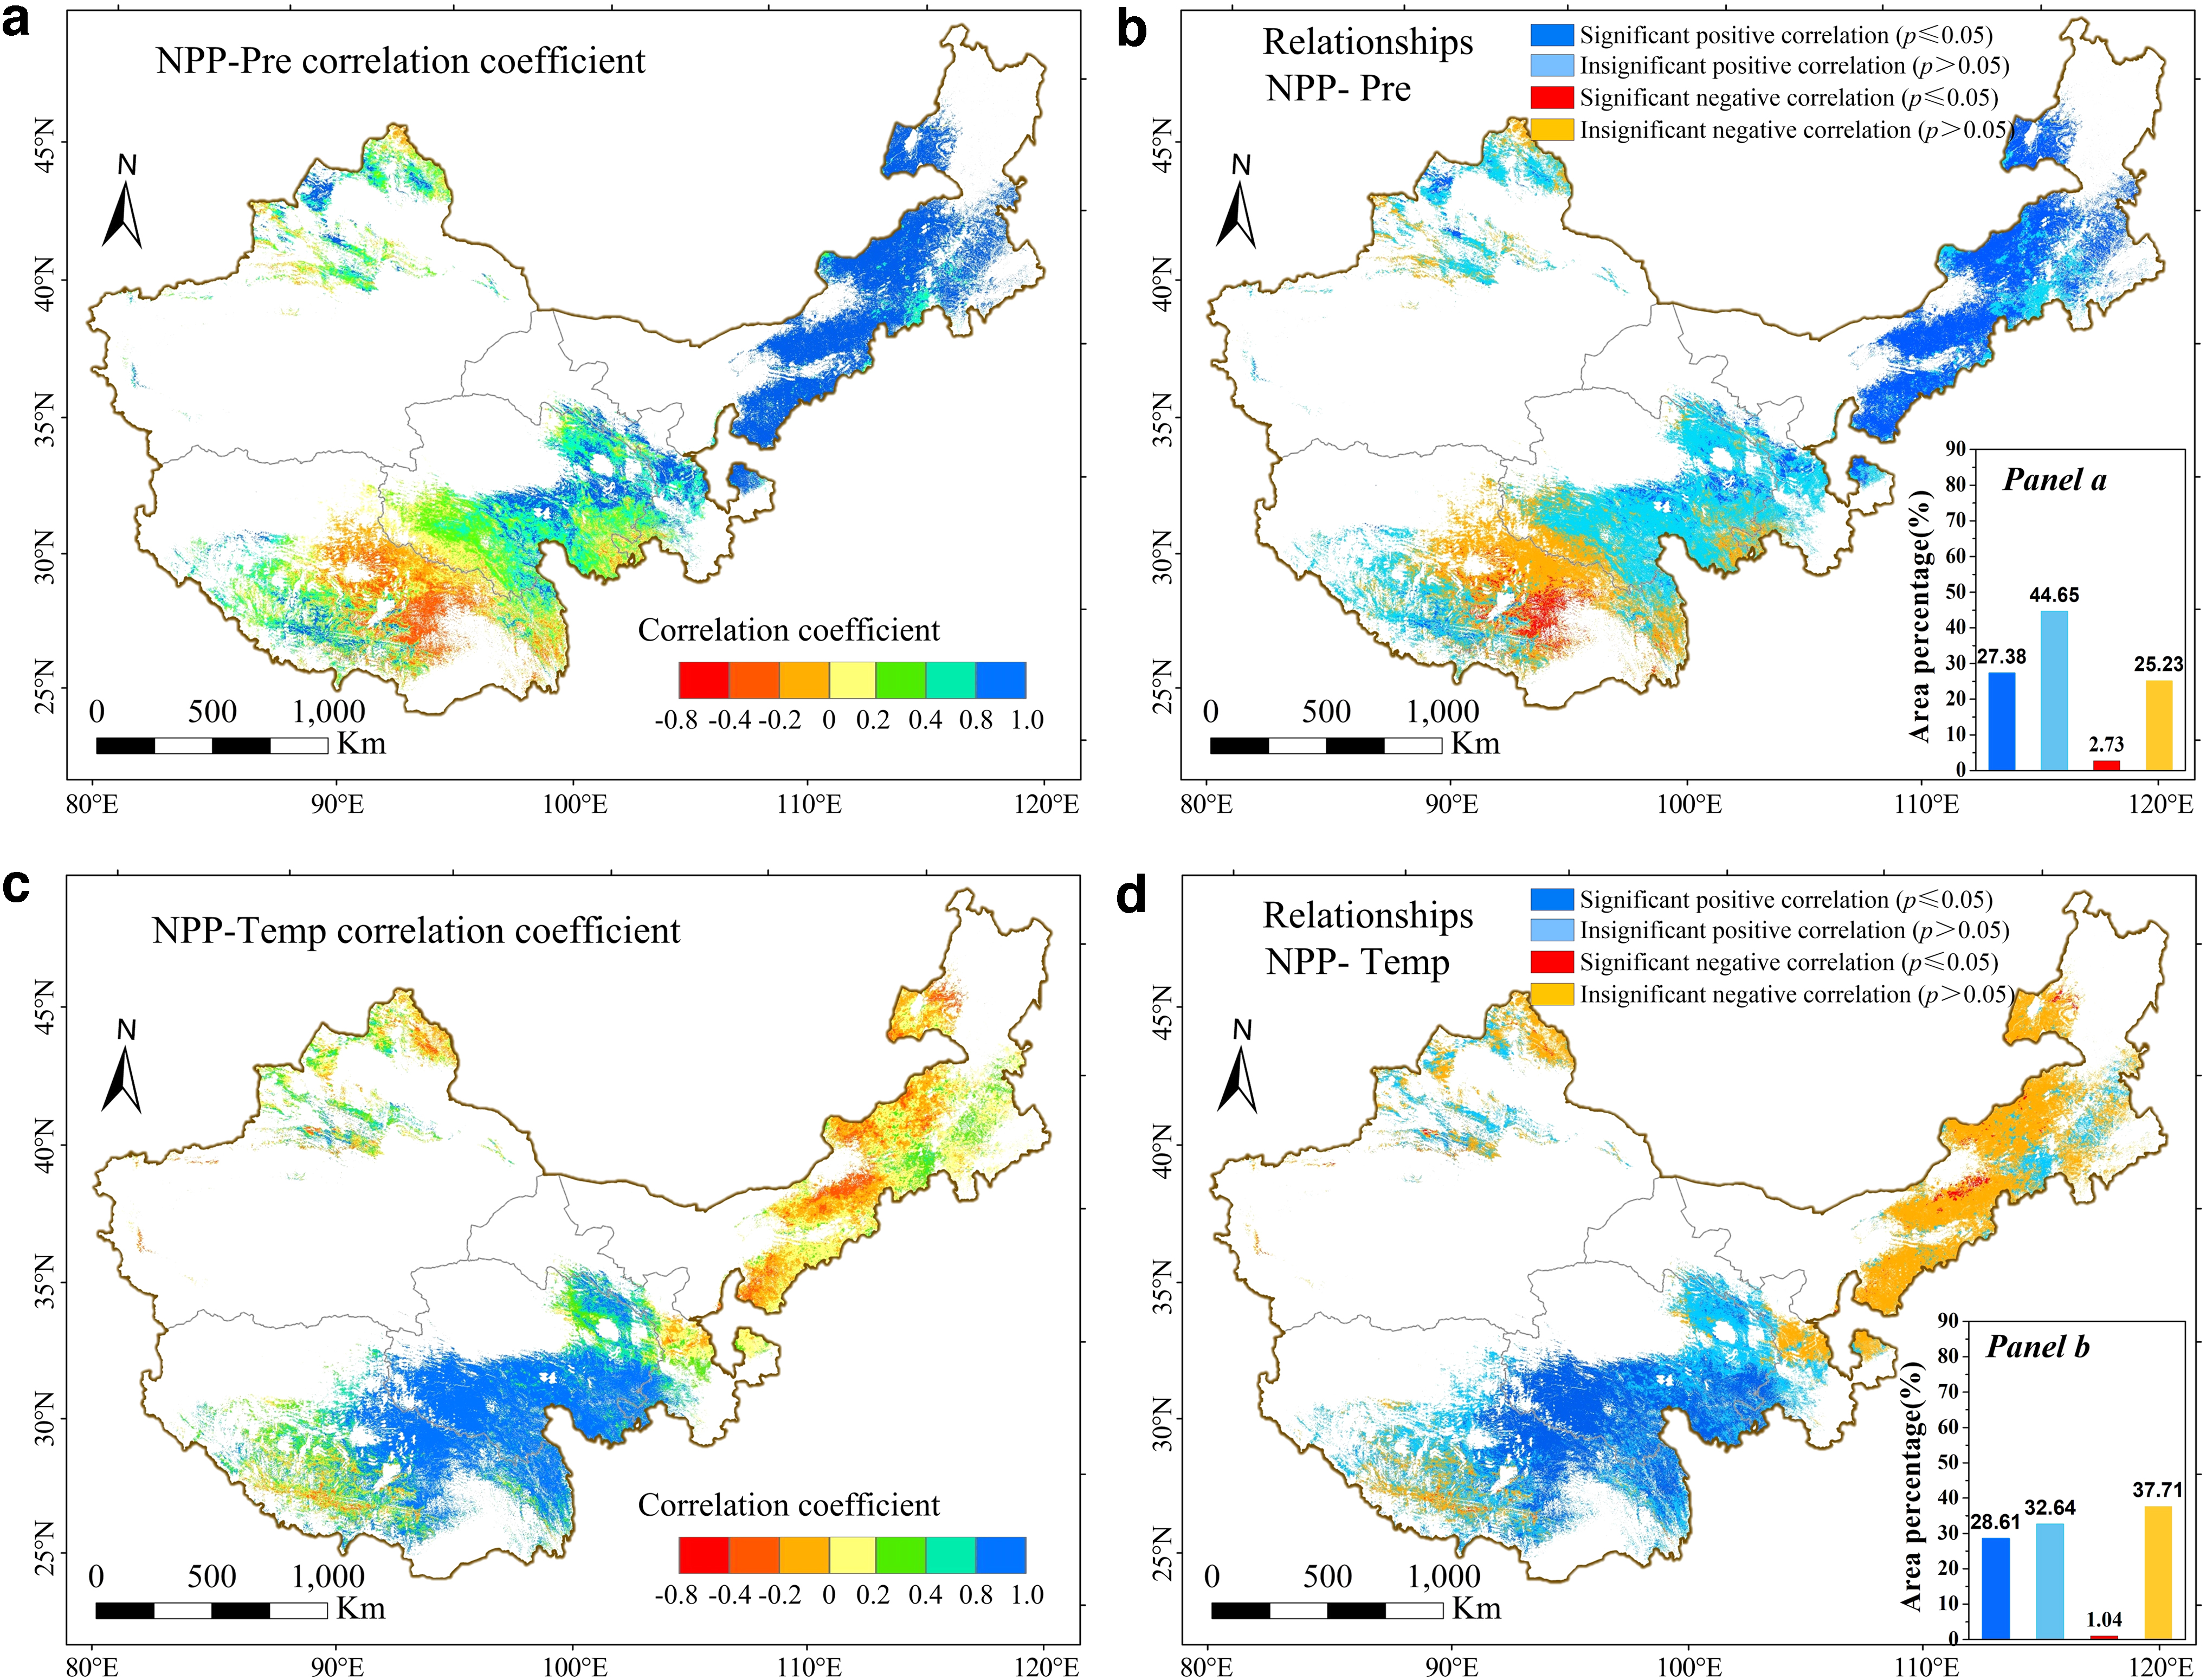
Spatial distributions of the correlation coefficients between grassland NPP and
Insignificant negative correlation between grassland NPP and temperature (37.71%) was mainly found in Inner Mongolia, then the local areas of Gansu and Xinjiang, and some southwest of Tibet (Fig. 9b), whereas the positive correlation was dominated (accounting for 61.25%) and distributed primarily in the northeastern Tibet, across the majority of Qinghai, and in the south-central slope of the Qilian Mountains. However, the positive correlations were only significant in 28.61% of the area, mainly concentrated in the eastern Tibetan plateau, where positive correlations between NPP and precipitation also occurred. It was possible from these findings to verify that temperature replaced precipitation as the most important factor affecting NPP of the Tibetan Plateau, as well as other high-altitude regions (Luo et al., 2018; Zheng et al., 2019). Some possible reasons for this are as follows: First, high altitudes are associated with low temperatures, therefore, increases in temperature can effectively promote the activity of photosynthetic enzymes and enhance the capacity for photosynthesis. Similarly, climate warming can indirectly alter the phenology by extending the growing season (Piao et al., 2007). Second, more precipitation is usually accompanied by reduced solar radiation (Mao et al., 2012) that can lead to anaerobic soil conditions in the plant root zone (Yang et al., 2015), which both inhibits photosynthesis and prevents growth (Luo et al., 2018). Third, excessive precipitation may reduce soil organic matter content through soil erosion or surface runoff in areas with poor soil quality (Chen et al., 2019). Alternatively, aboveground biomass and biodiversity generally decrease as altitude increases (Wang et al., 2004). High species richness may improve the utilization rate of precipitation as complementary niches are filled to include more functional groups that can cope with higher precipitation (Sun and Du, 2007; Yang et al., 2010).
Effects of grazing on grassland dynamics
Human activities, especially overgrazing by domestic livestock and the expansion of cultivation and urbanization, have been shown to exert negative effects on grasslands (Zhou et al., 2014; Zhang et al., 2018b; Niu et al., 2019). Overgrazing has generally been thought to be the primary catalyst for grassland degradation in pastoral areas because it can severely damage the natural vegetation, increase the amount of exposed arable land, and significantly affect aboveground and belowground productivity of grasslands (Li et al., 2016; Vandegehuchte et al., 2017; Chi et al., 2018). To ameliorate grassland degradation, a series of ecological restoration projects, including the Grain to Green Program (GTGP) and Returning Grazing Land to Grassland Program (RGGP), have been implemented since 2000 that aim to alleviate grazing pressure on degraded grasslands using enclosure fencing, grazer exclusion, controlling number of livestock, ecological migration, etc. (Li et al., 2016). At the same time, large-scale policies that give rewards and subsidies for grassland ecological conservation and poverty alleviation for ecological compensation have been implemented aiming to protect the ecological environment while also alleviating poverty and reducing development and to turn confrontations with nature into win/win scenarios (Qiu and Yang, 2019).
The total number of livestock in the study area increased by 11.77% from 2000 to 2014 (Fig. 10), but the livestock numbers varied across the five provinces. Remarkably, Inner Mongolia recorded a strong upward trend, growing from 62.21 million head in 2002 to 89.5 million head to 2008, directly leading to an increase in the total number of livestock. As reported by Lin et al. (2010) and Zhang et al. (2018b), overgrazing in Inner Mongolia has resulted in the degradation or desertification of 13.31% of the total grassland area (Table 3). The trend in Xinjian was different, with the number of livestock increasing at first, but then declining, and the final number saw a reduction by about 5.70 million head. Following this reduction, 35.77% of the grassland of Xinjiang has entered a recovery phase.

Time series of total livestock numbers in the five study regions from 2000 to 2014.
Although many grasslands/vegetation restoration programs and conservation policies have had positive effects such as reducing surface runoff and organic matter loss, increasing aboveground biomass and grass yield, restoring grass, and curbing desertification (Ta et al., 2008; Wang et al., 2009; Xu et al., 2016; Zhang et al., 2016), the effectiveness of the programs has been constrained by interactions among local ecoenvironmentalists, the economic structure, implementation, and supervisory groups (Petursdottir et al., 2013; Souther et al., 2019), thus the effectiveness varied spatially (Dai, 2010; Zhang et al., 2012). Besides, some previous studies have shown that grazing systems and low stocking rates do not negatively affect grassland productivity or the performance of domestic animals (Pan et al., 2017; Chi et al., 2018; Kemp et al., 2018). Grazing by livestock can stimulate grass growth, promote its coevolution, strengthen herbage roots, thus indirectly improving grassland quality and productivity. Livestock, like cattle and sheep, can be selective and choose different grass based on physical condition, and such selectivity can meaningfully sustain high-species richness and diversity in grass communities. Additionally, moderate trampling by livestock can effectively control the populations of grassland dwellers like pika and prairie voles and reduce damage to grasslands. Additionally, dung deposition can serve as an important repository of nutrients in grazing ecosystem, and also an important component of material cycling system. While excluding livestock grazing can increase density and height of grass, it may simultaneously reduce quality and lead to resource wastage. Thus, some researchers have concluded that appropriate grazing levels can benefit grassland quality (Klein et al., 2007; Zhang et al., 2015).
Conclusions
By selecting NPP as a quantitative indicator, the relative influences of climate change and human activities on grassland dynamics in China's five major pastoral areas from 2000 to 2014 were evaluated. Over this time period, the total grassland area experienced variable growth trends with a net increase of 1.30 × 10⁵ km2. Meanwhile, the annual NPP significantly increased from 119.37 to 140.67 g C/m2. Overall, climate was the principal driving force behind grassland restoration, accounting for 85.62% desertification mitigation. A shift toward a warm-wet climate caused a rapid increase in NPP in central and northeastern regions like Inner Mongolia and Qinghai, whereas in high-altitude regions such as the Tibetan Plateau the grassland NPP increase mainly corresponded to a shift toward a warm-dry climate and suitable ecological restoration action. It may be possible to conclude that ecological restoration projects are winning the battle against degradation in some arid and semiarid regions. To a lesser extent, anthropogenic activities and the combination of climate and human activities also drove grassland restoration, accounting for 24.27% and 7.05% of the grassland restoration. In contrast, human activity was the primary factor that led to the degradation of nearly 96,705.50 km2 of grassland, especially in Inner Mongolia. Furthermore, the temperature had a larger influence on NPP than precipitation in high-altitude regions, and some ecological restoration programs, especially those reducing grazing pressure by livestock, effectively restored grassland and curbed desertification at local levels. However, some restoration projects had unexpected results, such as more concentrated degradation, insect outbreak, biodiversity decreases, etc. Therefore, restoration projects should be adjusted and tailored to cope with local changes in the status quo.
Footnotes
Authors' Contributions
Conceptualization, P.J.; supervision, D.C.; methodology, X.Z.; data analysis and software, D.L. and G.A.; article writing, P.J., J.X., and X.Y. All authors have read and agreed to the published version of the article.
Author Disclosure Statement
No competing financial interests exist.
Funding Information
This research was funded by the China Desert Meteorological Science Research Fund (No. Sqj2020008).