
Abstract
Harmful algal blooms (HABs) of Microcystis aeruginosa can pose severe public health hazards due to potent toxins released by this cyanobacterial species. To elucidate the biological mechanism of M. aeruginosa PCC7806 and to identify the best treatment to reduce toxin production, 18 homoserine lactones (HSLs) of different chemical structures were synthesized and used at the concentration of 50 mg/L applied to algal blooms at the early log phase. The effectiveness of treatment was based on physiological responses after cells reached the stationary stage. Results indicated that C3-HSL with phenyl and ether groups, and C6-HSL with oxo groups showed a greater reduction in microcystin content (80–100% reduction). A C4-HSL with a hydroxyl group showed a reduction of at least 25% in all physiological parameters analyzed. Thus, structural changes to the HSLs can influence cell toxin production. The understanding of biological mechanisms can lead to novel approaches and strategies to control cyanobacteria and HABs.
Introduction
One of the greatest problems associated with current concerns with water contamination is the incidence of cyanobacterial blooms. Although eutrophication caused by the excess of nutrients in a water body appears to be the cause of this environmental problem, researchers found that the presence of biofilms and more specifically extracellular polymeric substances (EPS) can aggravate the impact of different strains of cyanobacteria on water quality (Otero and Vincenzini, 2003; Vicente-Garcia et al., 2004; Richert et al., 2005; Foster et al., 2009; Obst et al., 2009; Chu and McLean, 2016).
Microcystin is a cyanotoxin produced by Microcystis aeruginosa. It depletes oxygen from water bodies, and causes severe environmental concern and economic damages where it is found. This toxin can affect aquatic plants and causes serious liver damage in fish and can be detrimental to human health (Paerl and Huisman, 2008; Dittmann et al., 2013; Sun et al., 2013). Other animals that consume from these water bodies can also be affected by toxins produced by M. aeruginosa. M. aeruginosa growth is also favored by warmer temperatures.
Therefore, water contamination and warming conditions could potentially increase the frequency and the scale of events. One of the largest events attributed to harmful algal blooms occurred in 2014, when microcystin concentration increased to 200 μg/mL (Steffen et al., 2014). This was the highest recorded toxin concentration in Lake Erie (Paerl and Huisman, 2008; Steffen et al., 2014).
However, toxin production cannot be explained only by external factors interacting with the water system. In fact, toxin production is likely related to biofilm formation and social behaviors associated with quorum sensing. This cell/cell communication is regulated by the autoinducer homoserine lactones (HSLs) in gram-negative bacteria (Williams, 2007; Jayaraman and Wood, 2008; Ryan and Dow, 2008; Zhai et al., 2012; Chu and McLean, 2016). In fact, Zhai et al. (2012) showed initial evidence of AHL-mediated quorum signaling in M. aeruginosa.
A study using Vibrio fischeri aimed to compare different types of HSLs with naturally found C6-HSL so as to determine their effect on quorum-sensing expression. A substitution of a/the carbonyl group with a different one showed a reduction in quorum sensing; the addition of an oxygen atom prevented autoinduction. One possible explanation is that changes in the chemical structure of HSL can bind to LuxR receptors, generally found next to the luxI gene encoded responsible for responding to quorum sensing (Tsai and Winans, 2010).
Another explanation is that the increase or decrease in the length of acyl groups can promote interaction with amino acid residues in the protein and affect the cell/cell communication (Fuqua et al., 1994; Fuqua et al., 1996; Miller and Bassler, 2001; Shrout and Nerenberg, 2012; Lade et al., 2014).
Modifications in HSL structures appear to affect bacteria interaction and response to external environmental signals and HSLs secreted by other organisms in the biofilm. Moreover, the cyanobacteria must reach sufficient cell density to overcome the threshold concentration, which activates its response to quorum sensing. The addition of HSLs in a cyanobacterial system may amplify the signal within the same bacterium. Thus, autoinduction is affected by external environmental signals and cell density (Fuqua et al., 1994; Lade et al., 2014; Chu and McLean, 2016).
The hypothesis is that M. aeruginosa can react to the presence of HSLs that are not necessarily produced by this type of cyanobacteria. Changes in chemical structures of HSLs can provide a library of autoinducers, which can be used to prevent, disrupt, and increase expression. This study aimed to test 18 HSLs of different chemical structures to determine their effect on M. aeruginosa PCC7806 microcystin expression.
Materials and Methods
The research involves no more than minimal risk to the bacterial strain and it does not require an IRB. All protocols were carried out accordingly to those determined by the Institute of Biosafety Committee at UTSA.
Bacterial strains
M. aeruginosa strain PCC7806 was provided by Dr. Steven Wilhelm of the University of Tennessee. M. aeruginosa PCC7806 was cultured at 20C in BG11 media, and shaking at 100 rpm with 12 h of light exposure from a light bulb of 60 W for 30 days. The pH of the solution was 11.
M. aeruginosa PCC7806 growth procedure
BG11 media consisted of the following: 1.5 g of NaNO3, 0.04 g K2HPO4, 0.075 g MgSO4.7H2O, 0.036 g CaCl2.2H2O, 0.006 g citric acid, 0.006 g ammonium iron (III) citrate, 0.001 g EDTA (disodium salt), 0.02 g Na2CO3, 1.0 mL trace metal mixture, and distilled water to a volume of 1 L. The method is based on ATCC Medium 616 for blue-green algae. The trace metal mixture was prepared in 1.0 L and it consisted of the following: 2.86 g H3BO3, 1.81 g MnCl2.4H2O, 0.222 g ZnSO4.7H2O, 0.39 g NaMoO4.2H2O, 0.079 g CuSO4.5H2O, and 0.0494 g Co(NO3)2.6H2O. The pH was adjusted to 7.1 with 1 M NaOH.
A volume of 23 mL of BG11 media was prepared and transferred to a glass test tube before it was autoclaved. For a total volume of 25 mL, 2 mL of M. aeruginosa PCC7806 in the stationary phase (OD >2) was added to each tube. A total of 20 tubes were tested using a blank (no treatment), acylase, and 17 different HSLs. To avoid contamination and reduction of total volume of samples, 200 μL of the mixed media (bacterium and BG11 media) was transferred to a 96-well plate. Samples were run in triplicate and under the same conditions as used for the glass test tubes. Microcystis growth was monitored daily by absorbance measured at 600 nm. Light exposure was kept constant for 12 h for 30 days at 60 W.
Physiological responses
Cell buoyancy
Microcystis cells were kept without agitation for 2 h allowing cells to float. A volume of 0.6 mL was drawn out of the planktonic cell layer (V1) to measure cell concentration (C1). The remaining 24.4 mL (V2) was mixed to measure cell concentration (C2) separately. The relative buoyancy (B) was calculated using Equation 1.
Microcystin
The Beacon Analytical Systems, Inc. microcystin plate kit was used for the quantitative analysis of microcystins, and consequently, the toxin in water samples. Live algae samples were frozen for 20 min and thawed to room temperature to lyse the cells and release toxins. All samples were kept at room temperature before the microcystin assay.
The protocol consisted of mixing samples with enzyme conjugate (microcystin HRP) and antibody solution (rabbit anti-microcystin antibody solution) in antibody-coated strips. The incubation time was 30 min. Coated strips were washed with 1 × wash solution. Substrate was added to the samples and incubated for an additional 30 min. Stop solution was added, and the absorbance of the coated strips was read at both 450 and 650 nm (background/interference). Microcystin absorbance values were calculated using the difference between each reading. The calibration samples had a range of 0.8–1.3 ppb. Two calibration curves were used, low concentration given by Equation 2 and high concentration given by Equation 3.
EPS extraction
Measurement of physiological responses included polysaccharides and protein content. To determine the concentration of these molecules, EPS material was separated into three parts: S-EPS (soluble extracellular polymeric substance), LB-EPS (loosely bond extracellular polymeric substance), and TB-EPS (tightly-bond extracellular polymeric substances) as described by Xu et al. (2014).
The methodology consisted of centrifuging at 2500 rpm for 15 min to remove the S-EPS. The pellet was resuspended in a 0.05% NaCl solution at a volume similar to the original (about 20 mL) and centrifuged at 5000 rpm for 15 min to collect LB-EPS. The pellet was resuspended in the NaCl solution, as mentioned above, but heated at 60°C for 30 min and centrifuged at 11,000 rpm for 20 min to collect TB-EPS. Each fraction analyzed in terms of polysaccharides and proteins by the appropriate method is detailed below.
Phenol/sulfuric method
A calibration curve was prepared using 1 mg/mL glucose and different volumes (10, 20, 40, 60, and 80 μL). Each sample was mixed with 50 μL of an 80% phenol solution. After mixing, 2 mL of sulfuric acid was added. Samples were allowed to settle for 10 min before measuring their absorbance at 490 nm. The calibration curve is given by Equation 4.
Bradford method
Protein content was determined by the Bradford method (Bradford, 1976). A volume of 800 μL of each sample was mixed with 200 μL of concentrate dye reagent. Samples were not agitated for 5 min before measuring their absorbance at 595 nm. Bovine serum aAlbumin was used as the standard. The calibration curve range was 1–10 μg/mL and given by Equation 5.
Statistical analysis
Statistical significant differences were determined by an unpaired two-sided Student's t-test using Microsoft Excel. A p-value smaller than 0.05 indicated statistical significance. p-Values lower than 0.01 indicated highly significant differences. All experiments were run in triplicate and results were given as mean values with corresponding standard deviations.
Selection of HSLs
Some HSLs can be found naturally, and their main functions and applications have been identified. Table 1 shows the most common HSLs used commercially for their antibiotic properties and to prevent virulence or biofilm formation.
Most Common Homoserine Lactones: Sources, Organisms, and Applications
Adapted from Lade et al. (2014).
HSL, homoserine lactones.
Table 1 comprises different types of HSLs, producing organisms, application, and sources of such HSLs. Most HSLs can be found commercially, and their item number is included in Table 1.
Despite using commercial HSLs from Cayman and Sigma-Aldrich, eight additional amide derivatives were synthesized at the Southwest Research Institute. Starting with D-HSL hydrochloride, a diverse range of commercially available carboxylic acids were purchased and coupled via standard amide coupling conditions in an effort to probe the structure/activity relationship. To this end, we incorporated a range of aromatic and aliphatic groups, including p-coumaroyl, phenoxymethyl, cyclopentyl, diethyl, thiophene (two and three isomers), and norbornene. These synthetic HSLs were then compared with the commercial counterparts, when available.
The treatment using HSLs followed two batches of experiments. During the first batch, the compounds 1–14 were tested. Preliminary results revealed that M. aeruginosa PCC 7806 had a very distinctive microbial growth curve. The log phase would start on day 4 and it will last until day 21. The stationary phase would end on days 28–30. The early log phase was between days 4 and 7. A few tests were conducted to determine the effect of the addition of HSLs to the samples on days 4, 15, and 21.
Changes in microcystin and microscopy revealed that the addition of HSLs was more efficient when added on day 4. Upon results confirming the applicability of HSLs in preventing microcystin and other physiological parameters, a second set of HSLs were synthesized and added at the early log phase of M. aeruginosa growth. Since the second set was designed according to the outcomes from the first set, results were expected to be better than the ones found on the first set.
All the HSLs tested are shown in Table 2.
Homoserine Lactone Structure and Compound References
SwRI, Southwest Research Institute.
From this group of compounds, eight have demonstrated effects on quorum sensing. One compound from Sigma-Aldrich 804258, which contains a bromide, is known to be related to AI-2, an autoinducer that is related to cell/cell communication among gram-negative and gram-positive interspecies (Roy et al., 2010). No study to date has detected AI-2 for M. aeruginosa. The second set included changes in the acyl chain, and the addition of sulfur in different positions.
Results and Discussion
AHL determination from M. aeruginosa PCC7806
M. aeruginosa PCC7806 may produce two types of HSLs: C3-HSL and C4-HSL. Qualitative assays based on Agrobacterium tumefaciens and Chromobacterium violaceum (Chu et al., 2011) confirmed the presence of C4-HSL. HPLC results (Wang et al., 2011) showed two peaks, one at C3-HSL and the other at C4-HSL, C3-HSL being the highest. C3-HSL concentrations were below the limit of detection for the quantitative assay and were only detected using HPLC methods. The research institute involved in this article also confirmed the structure of these compounds by proton NMR. A suggestion for future experiments with M. aeruginosa could take into account the determination of the concentration of HSLs from this assay.
Not all gram-negative bacteria can produce HSLs, but some can respond to exogenous HSLs in the environment without being HSL producers. Hence, these preliminary results were important to the development of this study because they were indicators that M. aeruginosa PCC7806 can produce HSL and therefore should contain the luxI gene. As an HSL producer, it should also respond to the same or other HSLs since it is likely to contain the luxR gene, which is responsible for the quorum-sensing response. Thus, microcystin produced by M. aeruginosa PCC7806 may indicate quorum sensing.
Physiological responses related to buoyancy and microcystin
Once it was established that PCC7806 produces C3-HSL and C4-HSL autoinducers, a group of 18 compounds were added at the early log phase to test the physiological responses of this cyanobacterium. As previously described, physiological responses were determined by microcystin content, buoyancy, polysaccharides, and protein content.
The buoyancy test reflects how much of the cyanobacteria are on the surface of the tube after being incubated without agitation for more than 2 h, simulating stagnate water. The higher the buoyancy (B value), the higher the incidence of M. aeruginosa on the surface. This also reflects that any possible toxins being released in the media will also be found at the surface.
Microcystin is a cyanotoxin produced by M. aeruginosa, which can be easily detected by appropriate tests, such as an Enzyme-Linked Immunosorbent Assay. There are other types of toxins that can be found in algal bloom systems, however, microcystin was the focus of this research since it is the most common toxin to cause serious damage to aquatic life and to humans produced by M. aeruginosa. Figure 1 shows the relationship between buoyancy and microcystin concentration in HSL-treated samples.

Microcystin (ppb) versus buoyancy (B). Each value is the mean ± standard deviation (N = 3). Samples with one of two digits have been shortened to fit the plot. For instance, sample 19 corresponds to sample 16-0206-004-019.
The threshold line corresponds to the average concentration of microcystin on M. aeruginosa PCC7806, where all values below the threshold indicated a decrease in toxin concentration. This concentration is also the maximum value permissible of 1.0 μg/L recommended by the World Health Organization and stated in the EPA report of 2015 to avoid any undesirable impact on water bodies. Some compounds increased microcystin content. HSL 9001737 increased microcystin by up to three times its initial value. The chemical structure of this type of HSL corresponds to C3-HSL with a phenyl group, as seen in Fig. 1, which appears to be the actual structure of HSL from M. aeruginosa PCC7806, and a possible reason for the increase in microcystin content is the overexpression of the quorum-sensing response to this HSL.
As seen in Fig. 1, 70% of treated cells had lower buoyancy values. This indicates that microcystis cells tend to stagnate at the bottom of the water bodies. Buoyancy is an important physiological parameter because it determines where algal cells are located in the water body. High values of buoyancy indicate that there is algal boom on the surface. High values of buoyancy can also lead to the eutrophication of that water body and release of toxins close to the surface. Lower values, however, are beneficial to the aquatic life and, consequently, to humans.
Overall, at least six treatments successfully reduced both buoyancy and microcystin content: HSLs 16-0206-004-015, 10011207, 16-0206-004-25-21, 16-0206-004-25-22, 16-0206-004-25-23, and CDS006294. Of the six treatments, two resulted in the lowest values for both buoyancy and microcystin content: HSLs 16-0206-004-015 (C3-HSL with a phenyl and ether group) and 10011207 (C6-HSL with an oxo group).
This result suggests that the presence of an additional oxygen or even the presence of a phenyl group interrupt or inhibit quorum sensing. Although other compounds also contained the oxo-group, only the compound with six carbons reduced both parameters (buoyancy and microcystin). There was no other compound with an ether and phenyl group attributed to the synthesized 16-0206-004-015. The synthesized compound could potentially be included in the library of HSLs that can be applied to inhibit biofilm formation or, in this case, inhibit toxin release.
Physiological responses related to polysaccharide and protein content
EPS formation is influenced by a combination of environmental factors and cellular activities. Since it functions as a protective barrier, EPS allows the biofilm to resist diverse and extreme conditions. If a microorganism is responding to quorum-sensing queues and it is producing biofilm, it is likely to have rich EPS material involved. EPS composition includes polysaccharides and proteins, among other organic molecules and amino acids. Polysaccharides and proteins are the most abundant and more studied compounds present in the EPS. Polysaccharides and proteins account for about 80–90% of EPS composition (Wang et al., 2008, 2011).
The multistep EPS extraction method of Xu et al. (2014) involves a combination of low-temperature centrifugation, low-pressure concentration, and hot aqueous extraction to achieve a higher yield on different fractions of cyanobacterial EPS.
The polysaccharide and protein content of the three extracted fractions of extracellular polymeric substance (EPS)-dissolved in Solution (S-EPS), Loosely-bound (L-EPS), and Tightly-bound (T-EPS) was determined. Polysaccharides depend on the characteristics of the bacteria. Their function in the EPS is to change the biological and physical properties of the biofilm matrix (Wingender and Flemming, 2010), and polysaccharides are required during biofilm formation (Skillman et al., 1998).
Treated cells were analyzed in the stationary phase in terms of polysaccharides. Figure 2 shows the polysaccharide concentration in the L-EPS.
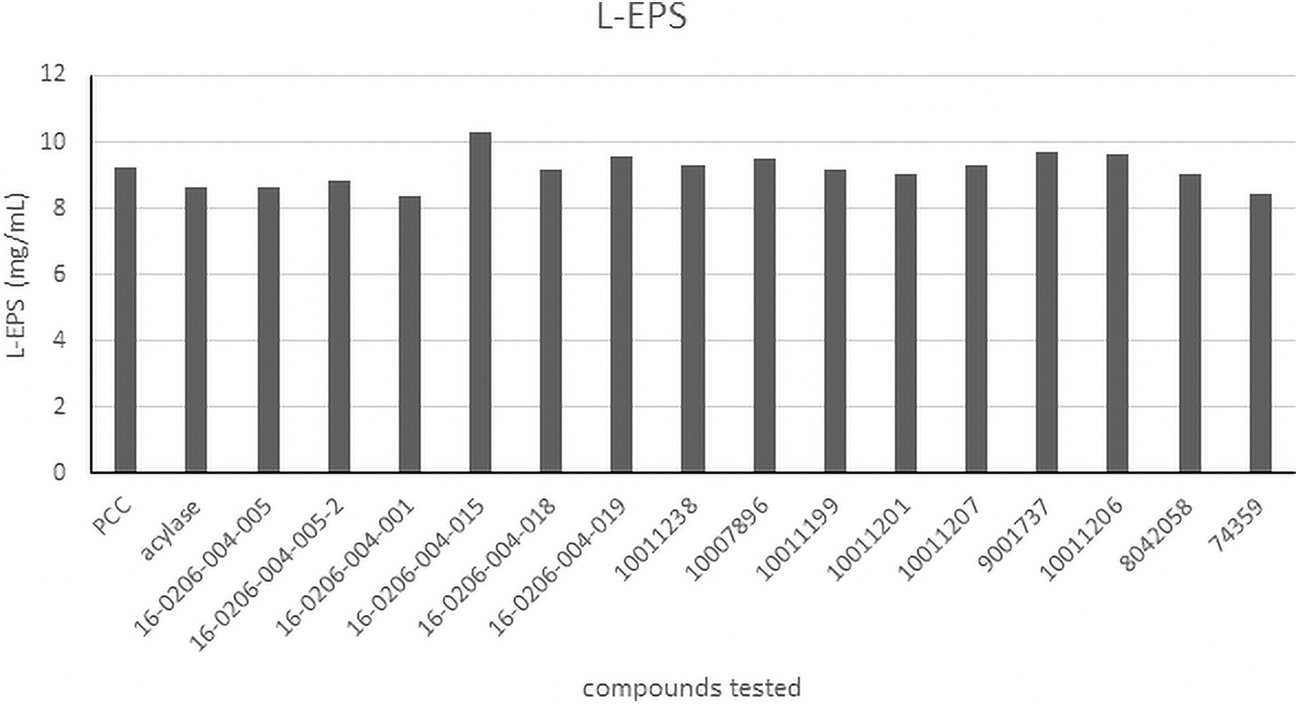
Concentration of polysaccharides from L-EPS. Each bar is the mean ± standard deviation (N = 3). L-EPS, Loosely-bound extracellular polymeric substance.
The histograms for S-EPS and T-EPS (not shown) were right skewed unlike that of L-EPS, which is shown in Fig. 2 in terms of concentration. The HSL that induced the highest polysaccharide content in S-EPS was C3-HSL with a phenyl group (commercially available as C8-HSL) with a concentration greater than 10.12 mg/mL; and for T-EPS, it was C6-HSL with a concentration of 12.15 mg/mL. Figure 2 shows that most compounds had a polysaccharide concentration between 9.12 and 9.84 mg/mL. The highest value was 10.32 mg/mL for C2-HSL with the ether and phenyl groups (HSL 16-0206-004-015).
Both S-EPS and L-EPS had the highest polysaccharide content being produced by the same treatment type. The HSL 16-0206-004-015 was also responsible for reduction of microcystin concentration and buoyancy. It is possible that the treatment with HSL 16-0206-004-015 was responsible for disrupting quorum sensing and preventing EPS formation. When compared with polysaccharides from PCC 7806, the treatment using HSL 16-0206-004-015 showed a reduction in polysaccharides, but not significantly different to indicate any major changes in physiological responses.
Only two HSLs were significantly different (p < 0.05): 16-0206-004-005 (C4-HSL) and 16-0206-004-001 (C3-HSL). Although these treatments significantly reduce polysaccharide content and microbial growth, they did not have any impact on microcystin and buoyancy. Nonetheless, both treatments had similar chemical structures as the ones found in M. aeruginosa PCC7806.
The protein in biofilms aid in stabilizing the EPS matrix and are also sources of carbon and energy (Jahn and Nielsen, 1998). They are most likely to be found in the T-EPS due to these properties. Figure 3 shows the concentration of proteins with the most significant difference.
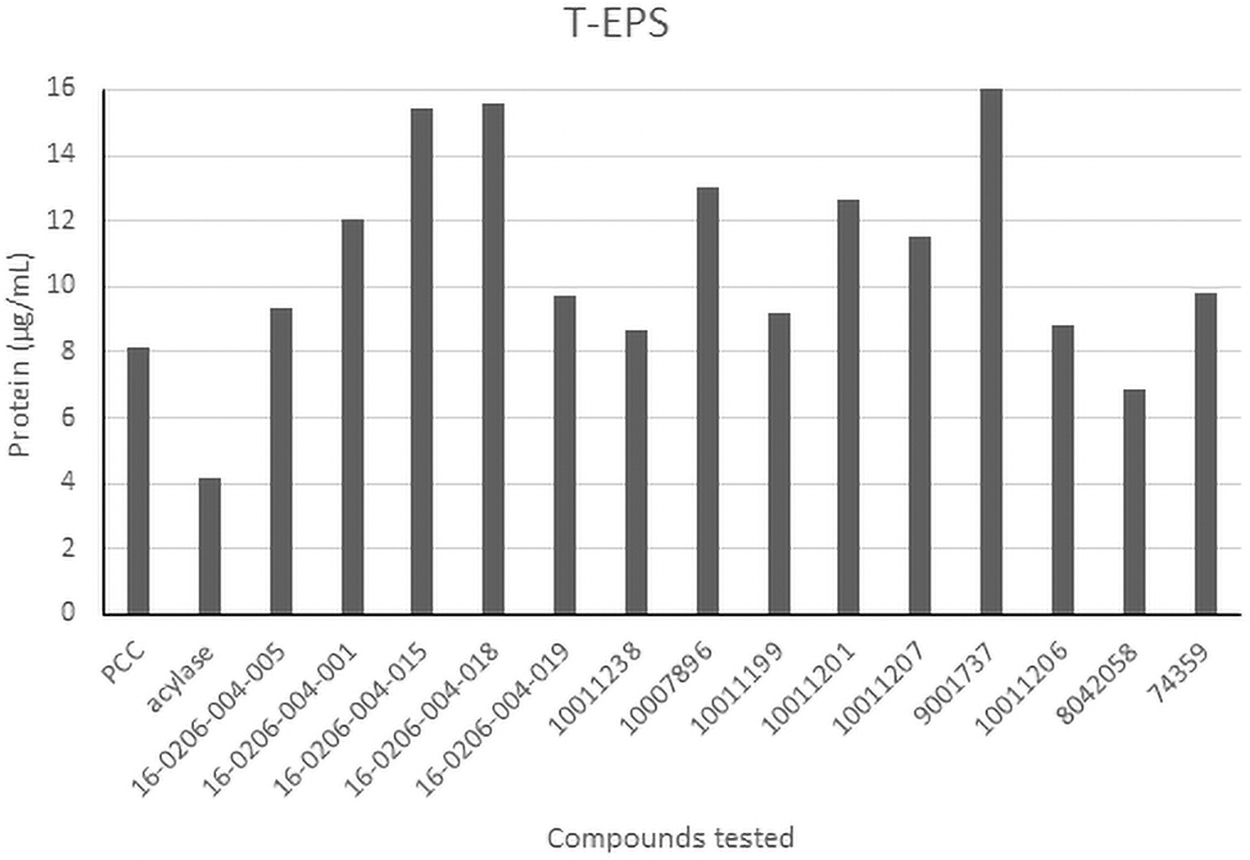
Concentration of proteins for T-EPS. T-EPS, Tightly-bound extracellular polymeric substance.
Unlike the data for polysaccharides, all histograms for protein content were right skewed, which indicates that most treatments do not affect the protein content, and therefore, the protein content from the EPS material cannot be extracted easily. Only C4-HSL showed a higher protein content for S-EPS and L-EPS. For T-EPS, 7 compounds increased the protein content above 10 μg/mL: C3-HSL, C6-HSL, C10-HSL, and their variations. Of these compounds, only C6-HSL and C10-HSL were commercially available.
As seen in Table 1, these compounds are broadly used in virulence regulation and biofilm inhibition. If it is the case, then the synthesized compounds can also be applied for biofilm inhibition. When comparing these HSLs with the ones that reduced other physiological responses, both 16-0206-004-015 (C3-HSL) and 11001207 (C6-HSL) were the most effective treatments to inhibit physiological responses such as buoyancy and microcystin concentration.
Overall, the shorter the carbon chains, the higher the microcystin content without significant changes in the chemical structure. If there is additional oxygen to the n-acyl structure, microcystin is reduced. For instance, the HSL compound 16-0206-004-015 had the highest reduction. Longer chains do not influence the amount of microcystin. The addition of other chemical groups can even increase the toxin content for longer chains. Overall, chains with 4–6 carbons and additional groups appeared to demonstrate better inhibition of microcystin production and reduce buoyancy.
The proposal expected such a result for C6-HSL, which has been confirmed. However, those compounds that were similar to the ones found for M. aeruginosa PCC7806 doubled the concentration of microcystin production. Figure 4 shows the results of microcystin and buoyancy after the second batch of HSL treatment.

Microcystin (ppb) versus buoyancy (B) tested with the second set of HSLs. Each value is the mean ± standard deviation (N = 3). HSL, homoserine lactone.
The second set of HSLs was highly inhibitory, with both microcystin and buoyancy values close to zero. The position of S in the structure influenced the buoyancy of these treated cells. The change was not significant enough to determine which HSL was more successful. However, it is clear that the second batch is capable of preventing microcystin production/release.
Results based on structural changes in HSLs
In general, results showed that HSLs with simple acyl chains increased the microcystin content independent of the number of carbons. Other structures that neither increased toxin nor showed major changes on other physiological responses were HSLs with simple rings, hydroxyl groups, and double bonds. The oxo group with a greater impact was six carbons. The groups that showed lower microcystin values were C3-HSL with phenyl and ether group and C3-HSL with bromide. Between both compounds, the one with a phenyl and ether group, 16-0206-004-015, reduced microcystin content the most. The optimal treatment was found with the second batch of HSL treatment. In this case, C6-HSL with phenyl group and sulfide.
These results summarize changes in the structure and number of carbons in the acyl group and the effect on physiological responses. At least five samples showed a significant reduction in the toxin, which was the aim of this study. In this sense, both 16-0206-004-21 and 16-0206-004-015 are the most suitable. This was also true when all physiological responses were compared. The HSL compound that increased all parameters was 9001737, a C3-HSL with a phenyl group (commercially available as C8-HSL).
Conclusion
The purpose of this study was to examine how xenobiotics, such as HSLs, synthetic and natural, affect the quorum-sensing response of M. aeruginosa PCC7806. This study showed that cyanobacterial cells can respond to external HSLs. This suggests the presence of exogenous HSLs, other than those produced by a certain organism, can affect the quorum-sensing response. Consequently, external HSLs could directly impact bioluminescence, virulence, biofilm formation, or even toxin production. This confirms the availability of naturally found HSLs, which are commercially available, to prevent biofilm formation in various industries.
Of the HSLs studied, the optimum chain length was C3 to C6 in the acyl group. The number of total carbons on this specific HSL may vary according to the structural changes of each compound. The addition of phenyl groups, oxo groups, and ether groups had a significant impact on microcystin reduction. An HSL with a bromide showed lower microcystin content and it suggests that M. aeruginosa PCC7806 may be able to respond to AI-2 compounds as well. In summary, structural changes in the HSL compounds influence M. aeruginosa PCC7806 physiological responses. At least two samples showed a significant reduction in the toxin: 16-0206-004-015 and 16-0206-004-021.
This research focused on the physiological responses of cyanobacterial cells in the presence of different HSL compounds. This work demonstrated the potential for using synthetic HSLs and specific structural changes to prevent or inhibit quorum sensing. The concentration used was meant to disrupt bloom formation, and future studies will investigate smaller concentrations to check on the effectiveness of the treatment directly on microcystin. The BG11 media contain a high-level nutrition. Future studies will investigate other media such as CT.
Footnotes
Author Disclosure Statement
No competing financial interests exist.
Funding Information
This work was supported by the NSF (1438622) and CONNECT program.