
Abstract
Interest in anaerobic co-digestion of fats, oils, and greases (FOG) has increased recently, resulting in research efforts to enhance stability of these systems and increase biogas production. Ammonia inhibition has been well-established for anaerobic digestion of municipal sludge from wastewater treatment plants. However, the inhibitory effects that occur in the presence of FOG are typically overshadowed by long chain fatty acid inhibition from the FOG. The effects of ammonia itself have not been separated and thoroughly studied in the presence and absence of FOG. This study investigated ammonia inhibition in batch anaerobic digesters inoculated from mono-substrate and co-substrate anaerobic digesters in the presence and absence of noninhibitory concentrations of FOG. Above a 1,700 mg/L total ammonia nitrogen (TAN) threshold, both inocula exhibited decreased methane production rates and increased lag phase times. Below this threshold, the mono-digester inoculum was more sensitive to ammonia than the co-digester inoculum. TAN inhibitory effects were mitigated by the presence of ammonia-tolerant microbes such as Syntrophomonas spp. and Methanoculleus spp., which were both more prevalent in the co-digester inoculum. The co-digester inoculum also had a twofold increase in methanogens compared with the mono-digester inoculum, making it more resistant to organic acid accumulation and decreased rates of methane production. Finally, the presence of FOG increased the inhibitory effects of ammonia for both digesters tested in this experiment, suggesting that ammonia sensitivity is increased with increased metabolic activity. This increased sensitivity to ammonia in the presence of FOG could have direct implications on the intensification of FOG co-digestion systems for increased methane production.
Introduction
Anaerobic digestion (AD) has gained importance as a renewable energy technology, because of the biogas produced through the biological treatment of wastewater-derived biosolids. The energy production potential of AD can be further improved by co-digestion of high-energy waste streams (Long et al., 2012; Fisgativa et al., 2017). In recent years, the AD of FOG, has gained considerable attention for its potential to be a source of renewable energy. For example, FOG collected from the food service industry has been cited to increase biogas production by 30% or more when added directly to an anaerobic digester receiving only municipal sludge and could meet >50% of a wastewater treatment plant's electricity demand through on-site generation (Suto et al., 2006; Davidsson et al., 2008; Kabouris et al., 2008; Long et al., 2012).
Despite these reported benefits, the anaerobic co-digestion of FOG has a wide array of operational challenges including the inhibition of pertinent microbes (Hanaki et al., 1981; Koster and Cramer, 1987; Shea, 2010). Most inhibition caused by ammonia is reported in terms of a decrease in methanogenic activity indicating that methanogens are the most sensitive microbes to ammonia inhibition (Yenigun and Demirel, 2013). However, several important bacterial groups have shown sensitivity to ammonia as well, including syntrophic acetate oxidizing bacteria (SAOB) (Wang et al., 2015). In addition, bacteria belonging to Bacteroidales, Spirochaetales, Anaerolineales, and Synergistales have also been shown to be sensitive to ammonia accumulation (Poirier et al., 2017; Yang et al., 2018).
These inhibitory effects experienced by microbes during the AD process are caused by a build-up of chemicals, including ammonia, that originate from the nonfatty acid components of FOG such as food particles, as FOG is not a pure substrate (Wang et al., 2016). Ammonia is a naturally occurring compound within an anaerobic digester and ensures buffering capacity necessary for methanogenic activity (Liu and Sung, 2002). However, undesirably high concentrations of ammonia can occur due to the breakdown of proteins present in the substrate that can lead to process upset (Wang et al., 2016). Total ammonia nitrogen (TAN), which includes ammonia (NH3) and the ammonium ion (
The most widely accepted mechanism explaining ammonia inhibition states that elevated ammonia levels result in a change in intracellular pH, a depletion of intracellular potassium, an increase in maintenance energy requirement, as well as inhibition of specific enzymatic reactions (McCarty and McKinney, 1961; Sung and Liu, 2003; Yenigun and Demirel, 2013; Wang et al., 2016). The range at which this inhibition occurs and to what degree varies greatly depending on inoculum, operational parameters, co-substrates, and other factors (Chen et al., 2008; Rajagopal et al., 2013). In general, ammonia inhibiting concentrations range from 1.7 to 18 g/L TAN (Chen et al., 2008; Rajagopal et al., 2013; Yenigun and Demirel, 2013; Yang et al., 2018).
Previous studies have shown that an increase in ammonia concentration can cause a shift in the dominant pathway for methane production. Methane production can occur through three unique pathways. The first two, acetoclastic methanogenesis and syntrophic acetate oxidation, utilize acetate as the main precursor, whereas the third, hydrogenotrophic methanogenesis, utilizes hydrogen and carbon dioxide (Fournier and Gogarten, 2008). The acetoclastic pathway is performed primarily by Methanosarcina spp. or Methanosaetaceae spp., whereas hydrogenotrophic methanogenesis is primarily performed by Methanomicrobiales spp., Methanobacteriales spp., or Methanococcales spp. with the help of SAOBs (Gerardi, 2003; Karakashev et al., 2006; Fournier and Gogarten, 2008; Henze et al., 2008).
At high ammonia concentrations under mesophilic conditions, there is contradicting evidence as to which of these pathways becomes dominant. Some work demonstrates a shift from acetoclastic to hydrogenotrophic methanogenesis at high ammonia concentrations specifically due to an enrichment of SAOBs in digesters fed cattle manure and stillage (Westerholm et al., 2012). Other work attributes this shift to the idea that hydrogenotrophic methanogens are more robust in terms of ammonia inhibition (Koster and Lettinga, 1984; Westerholm et al., 2012; Zamanzadeh et al., 2017). On the other hand, the retention of acetoclastic methanogenesis as the dominant pathway under ammonia stress has also been observed (Wiegant and Zeeman, 1986; Fotidis et al., 2013; Dai et al., 2016; Yang et al., 2018).
Although these trends in the inhibitory effects of ammonia have been previously observed, they have not been thoroughly studied in FOG co-digestion systems. Ammonia accumulation has been observed in FOG studies that alter the organic loading rate to intensify the process (Kabouris et al., 2008; Park and Li, 2012), but typically inhibition during FOG co-digestion is attributed to long chain fatty acid (LCFA) accumulation (Sousa et al., 2009; Long et al., 2012; Amha et al., 2017). Thus, this study intentionally introduces FOG at noninhibitory levels to examine how co-digestion itself, which raises the metabolic activity of the anaerobic digester microbiome, affects the sensitivity of the microbiome to ammonia inhibition.
Thus, the objectives of this research are to investigate the following: (1) the effects of ammonia inhibition in the presence and absence of FOG and (2) explore the differences in the microbiome structure between a mono-digester and a FOG co-digester and their effect on sensitivity to ammonia inhibition. To the best of the author's knowledge, this is one of the first studies to isolate the inhibitory effects of ammonia during FOG co-digestion.
Materials and Methods
Seed anaerobic digestate and FOG source
Seed anaerobic digestate was collected from two full-scale mesophilic wastewater reclamation facilities: the City of Corvallis Wastewater Reclamation Plant (Corvallis, OR), which receives only municipal sludge, and from the City of Gresham Wastewater Treatment Plant (Gresham, OR), which receives both municipal sludge and FOG.
The FOG used in this study was collected from the FOG receiving station at the City of Gresham Wastewater Treatment Plant and consists of a mixture of grease trap waste from restaurants, fast food, and commercial kitchens, as well as fat from a milk processing plant in the greater Portland, OR area. The FOG had an average total solids (TS) and volatile solids (VS) content of 101.1 ± 1.6 g TS/L and 98.3 ± 1.6 g VS/L, which resulted in an average VS/TS ratio of 0.97 ± 0.00. Batch anaerobic digesters were inoculated with anaerobic digestate from either facility within 2 h of its collection. The collected FOG was stored at 4°C before its use.
Experimental set-up
Four separate experiments were run to assess the effect of ammonia on the inhibition of AD with two different inoculum with and without FOG amendments in batch anaerobic digesters. The four experiments were: Corvallis inoculum with no FOG added, Corvallis inoculum with FOG added, Gresham inoculum with no FOG added, and Gresham inoculum with FOG added (Table 1).
Initial Conditions for All Batch Anaerobic Digesters Tested in This Study
Different NH4Cl solutions were used to ensure that all digesters had equivalent final volumes. The day 0 values presented are an average of all replicates for that condition. Each condition was run in quintuplet.
FOG, fats, oils, and greases; TS, total solids; VS, volatile solids.
Batch anaerobic digesters consisted of 125 mL Wheaton bottles with butyl rubber stoppers. All batch anaerobic digesters contained 100 mL of anaerobic digestate inoculum (from either the Gresham or Corvallis facilities) and 5.5 mL of an NH4Cl solution (a 10, 20, and 30 g/L solution was used for the +500, +1,000, and +1,500 mg/L
Immediately after inoculation, the batch anaerobic digesters were sparged with N2 for 5 min to ensure that the headspace was anaerobic. Batch anaerobic digesters were incubated at 37°C on a shaker table at ∼120 rpm and each condition was evaluated in quintuplets (n = 5). The FOG/no-FOG experiments were run for a total of 28 days.
Analytical methods
Biogas production from the batch anaerobic digesters was measured using positive displacement with a glass, gas-tight syringe. Methane content was determined using an HP-5890 GC thermal conductivity detector with argon carrier gas at a flow rate of 20 mL/min with a packed column (Supelco 15′ × 1/8′ SS support 60/80 Carboxen 1000). The method was isothermal at 220°C.
Sludge samples were collected three times each week. TS and VS were determined at the beginning and end of each experiment according to EPA Method 1684 (U.S. EPA: Office of Water, 2001). Once a week, pH was measured on the homogenous sludge using a Thermo Orion 9156BNWP pH meter. The homogenous sludge was then centrifuged for 5 min at 13,000 rpm. The supernatant was stored at −20°C before further analyses for dissolved TAN and organic acid (OA) concentrations.
Dissolved TAN concentrations were measured using a 2-phenylphenol method as previously described (Rhine et al., 1998). Organic nitrogen was not considered in this study as this assay only measures
OA concentrations (specifically acetate, propionate, and butyrate) were determined using a Dionex 500X high-performance liquid chromatograph (HPLC) equipped with an AD20 UV absorbance detector, a HiChrom Prevail 5 μm OA column (250 × 4.6 mm). The HPLC ran in isocratic mode for 35 min per sample with a 0.06 M phosphate eluent at a flow rate of 1 mL/min for the first 8 min followed by a 1.5 mL/min flow rate for the following 27 min. Absorbance was measured at 210 nm.
Gompertz equation modeling
Batch reactor gas production data were modeled using the modified Gompertz equation [Eq. (1)] where M is the normalized cumulative methane production (mL/g VS) at incubation time t (day), L is the lag-phase time (day), and P is the methane production potential (mL) (Lay et al., 1998; Sung and Liu, 2003). For each batch reactor, given M and t, the model parameters P, L, and Rm were fit using the function curve_fit from the Python package scipy.optimize, which employs a nonlinear least squares method.

DNA extraction and sequence processing
DNA was extracted from aliquots of sludge at the beginning of each experiment (three samples total). In addition, to better represent each of the experimental samples, additional anaerobic digestate sludge samples were collected for DNA extraction from the full-scale facilities multiple times over the course of a year (six additional samples). DNA was not extracted from each of the batch reactors immediately after inoculation, as there was no reason to expect the microbial community in the inoculum to have been altered owing to the experimental set-up.
For each sample, DNA was extracted from 500 μL of homogenous anaerobic digestate sludge. Before extraction, each anaerobic digestate sample was washed with a 1 mM sodium bicarbonate solution three times. Washed homogenous sludge was then dewatered by centrifugation (11,000 rpm for 1 min) and DNA was extracted using the Qiagen DNeasy PowerSoil DNA Extraction Kit (Qiagen, Venlo, the Netherlands) according to manufacturer instructions. Total DNA concentration and quality was quantified using a NanoDrop One (Thermo Fisher Scientific, Waltham, MA). The DNA was further cleaned and concentrated using a Monarch PCR and DNA Cleanup Kit (New England Biolabs, Ipswich, MA).
The hypervariable V4 and V3 regions of the 16S gene were amplified for both Bacteria and Archaea domains, respectively. The V4 region of the bacterial 16S rRNA gene was amplified with the primer pair 515F and 806R (Apprill et al., 2015; Parada et al., 2016). This primer set has been validated and used in the standard protocol of the Earth Microbiome Project (EMP) (www.earthmicrobiome.org/emp-standard-protocols/16s/). The PCR was performed as follows: an initial denaturation at 94°C for 3 min, followed by 35 cycles of 94°C for 45 s, 62°C for 60 s, and 72°C for 90 s, with a final extension at 72°C for 10 min.
For Archaea, the V3 region was amplified with the primer set Ar0787 and Ar1059 (Yu et al., 2005; Fischer et al., 2019). The PCR was performed as follows: initial denaturation at 95°C for 5 min, followed by 30 cycles at 95°C for 15 s, 56°C for 30 s, 72°C for 30 s, with a final extension at 72°C for 5 min. After amplicon PCR for both domains, a second PCR was performed to add Illumina adapters and barcodes using the Nextera XT Index Kit (Illumina, San Diego, CA). This PCR was performed as follows: initial denaturation at 95°C for 3 min, followed by eight cycles at 95°C for 30 s, 55°C for 30 s, 72°C for 30 s, with a final extension at 72°C for 5 min.
The DNA libraries were checked for size and concentration using an Agilent TapeStation 4200 (Agilent Technologies, Santa Clara, CA). After library preparation, samples were quantified by quantitative polymerase chain reaction (qPCR) and pooled proportionally into Archaea and Bacteria pools which were then paired-end sequenced (2x300) on an Illumina MiSeq V3 Platform according to manufacturer instructions (Illumina, Inc.)
The obtained reads were processed using the DADA2 microbiome pipeline (available at https://github.com/benjjneb/dada2). In brief, sequence reads were filtered with an expected error threshold of 2 for forward reads and 4 for reverse reads. For the archaeal domain, the forward and reverse reads were truncated to a length of 250 bp. The bacterial domain forward and reverse reads had 20 bp trimmed from the start of each read and were then truncated to a length of 250 bp. The raw Illumina sequence data obtained were submitted to the National Centre for Biotechnology Information's (NCBI) sequence read archive database. The sequence data for the Gresham inocula are under bio-project number PRJNA699040 and the data for the Corvallis inocula are under bio-project number PRJNA699092.
Filtered reads were de-replicated and de-noised using DADA2 default parameters. After building the amplicon sequence variant (ASV) table and removing chimeras, taxonomy was assigned using the Ribosomal Database Project classifier (V2.2) (Wang et al., 2007) implemented in DADA2 and trained against the SILVA 132 Database (Quast et al., 2013). Ordination plots were created using abundance data rarefied to even depths. The adonis function in the vegan package was used to determine statistical significance of the microbial community differences between the two inoculum.
Direct comparisons of the microbial relative abundance between the samples were performed at the genus level and were calculated as a percentage of the total community for each sample. The Results and Discussion section focuses on the most abundant organisms within each inocula. Within the bacterial domain, relative abundance is reported for the top 15 genus between the Corvallis and Gresham samples, whereas the archaeal domain relative abundance data are presented for all ASVs with a relative abundance >1%.
Quantitative polymerase chain reaction (qPCR)
qPCR was performed in triplicate according to the protocol established by Morris et al. (2014), using the primers designed by Luton et al. (2002). The final qPCR mix per 20 μL reaction was as follows: 1X SsoAdvanced Universal SYBR Green Supermix (Bio-Rad Laboratories, Hercules, CA), template DNA (0.2–1 ng), 750 nM mcrF and mcrR, and nuclease-free water to bring the final reaction volume up to 20 μL.
Each qPCR run included a no-template control and was performed in the Bio-Rad CFX Connect Real-Time PCR Detection System (Bio-Rad Laboratories, Hercules, CA) using the following program: initial denaturation at 95°C for 10 min, 45 cycles of 95°C for 30 s and 58.5°C for 1 min, and a final extension of 7 min at 72°C, followed by a melt curve to check for product specificity. Starting quantity amounts and threshold cycle values were calculated using the accompanying Bio-Rad CFX Manager software.
qPCR standards used in all runs were created using pooled mcrA clones (Integrated DNA Technologies, Coralville, IA). Five clones were chosen from the accession numbers from Morris et al. (2014). Their nucleotide sequences can be found in GenBank® under accession numbers HM800534, HM800536, HM800549, HM800574, and HM800611.
Results and Discussion
Comparison of microbial community between Gresham and Corvallis anaerobic digesters
The microbial communities within the two full-scale anaerobic digesters were significantly different, as observed in PCoA plots and adonis results for both the bacteria and archaea (p = 0.006 for bacteria and 0.011 for archaea) (Supplementary Fig. S1). Both domains show a clear division between the Gresham and Corvallis communities on the x-axis, which represents the bulk of the data (71.4% for bacteria and 94.3% for archaea). The Corvallis community clusters more closely with itself over both domains, whereas the Gresham community shows more spread over the y-axis for the different time points analyzed, indicating greater community shifts over time.
The phylogenetic classifications of bacteria are depicted in Fig. 1. The most abundant phyla in both digesters were Proteobacteria (34.5% ± 4.1% in Corvallis and 26.4% ± 2.3% in Gresham) and Bacteroidetes (25% ± 2.9% in Corvallis and 32% ± 4.1% in Gresham). The relevant genera that were more prevalent in the Corvallis inoculum include Arcobacter, an acetate-oxidizing bacteria (Supaphol et al., 2011; Vandamme et al., 1991), and Flavobacterium, which are commonly seen in activated sludge (Nierychlo et al., 2020).

Relative abundances of the top 15 most prevalent bacterial genera in the inoculum used for each experiment from the Corvallis and Gresham treatment facilities.
Most of the prevalent genera in the Gresham inoculum appear to be related to FOG co-digestion including Acidovorax, Blvii28_Wastewater sludge group (also known as Acetobacteroides), Sphaerochaeta, and Syntrophomonas, which have all been shown to be fermentative bacteria (Nierychlo et al., 2020). Acidovorax have been identified as acetate-utilizing denitrifiers in activated sludge capable of using hydrogen as an energy source and nitrate as a terminal electron acceptor (Nierychlo et al., 2020).
Members of Acetobacteroides are strict anaerobic fermenters that can degrade carbohydrates such as glucose, mannose, and lactose (Su et al., 2014). Sphaerochaeta are carbohydrate fermenters known to convert carbohydrates into acetate, formate, and ethanol (Esquivel-Elizondo et al., 2016). These organisms have also been identified as key players in supporting continued methane production at TAN levels ∼2,000 mg NH3-N/L (Esquivel-Elizondo et al., 2016). Syntrophomonas are known LCFA oxidizers and can oxidize butyrate as well, facilitating a syntrophic metabolism with methanogens (McInerney et al., 1981).
Concerning the archaeal domain, at the genus level, Corvallis and Gresham inoculum contain a similar percentage of acetoclastic methanogens in the form of Methanosaeta spp. (Fig. 2) (Carr et al., 2018). In addition, in the Corvallis inoculum, hydrogenotrophic methanogens were the predominant group, owing to the large enrichment of Methanolinea spp. in addition to a significant presence of Methanospirillum spp., and Methanoculleus spp., although both were more prevalent in the Gresham inoculum (Fig. 2) (Ferry et al., 1974; Imachi et al., 2008; Manzoor et al., 2016). Aside from the main methanogenesis pathways, the Gresham inoculum had a greater abundance of methanogens that utilize methylated compounds and alcohols, including Methanofastidiosum spp. and Methanomassiliicoccus spp. (Fig. 2) (Vanwonterghem et al., 2016; Nierychlo et al., 2020).
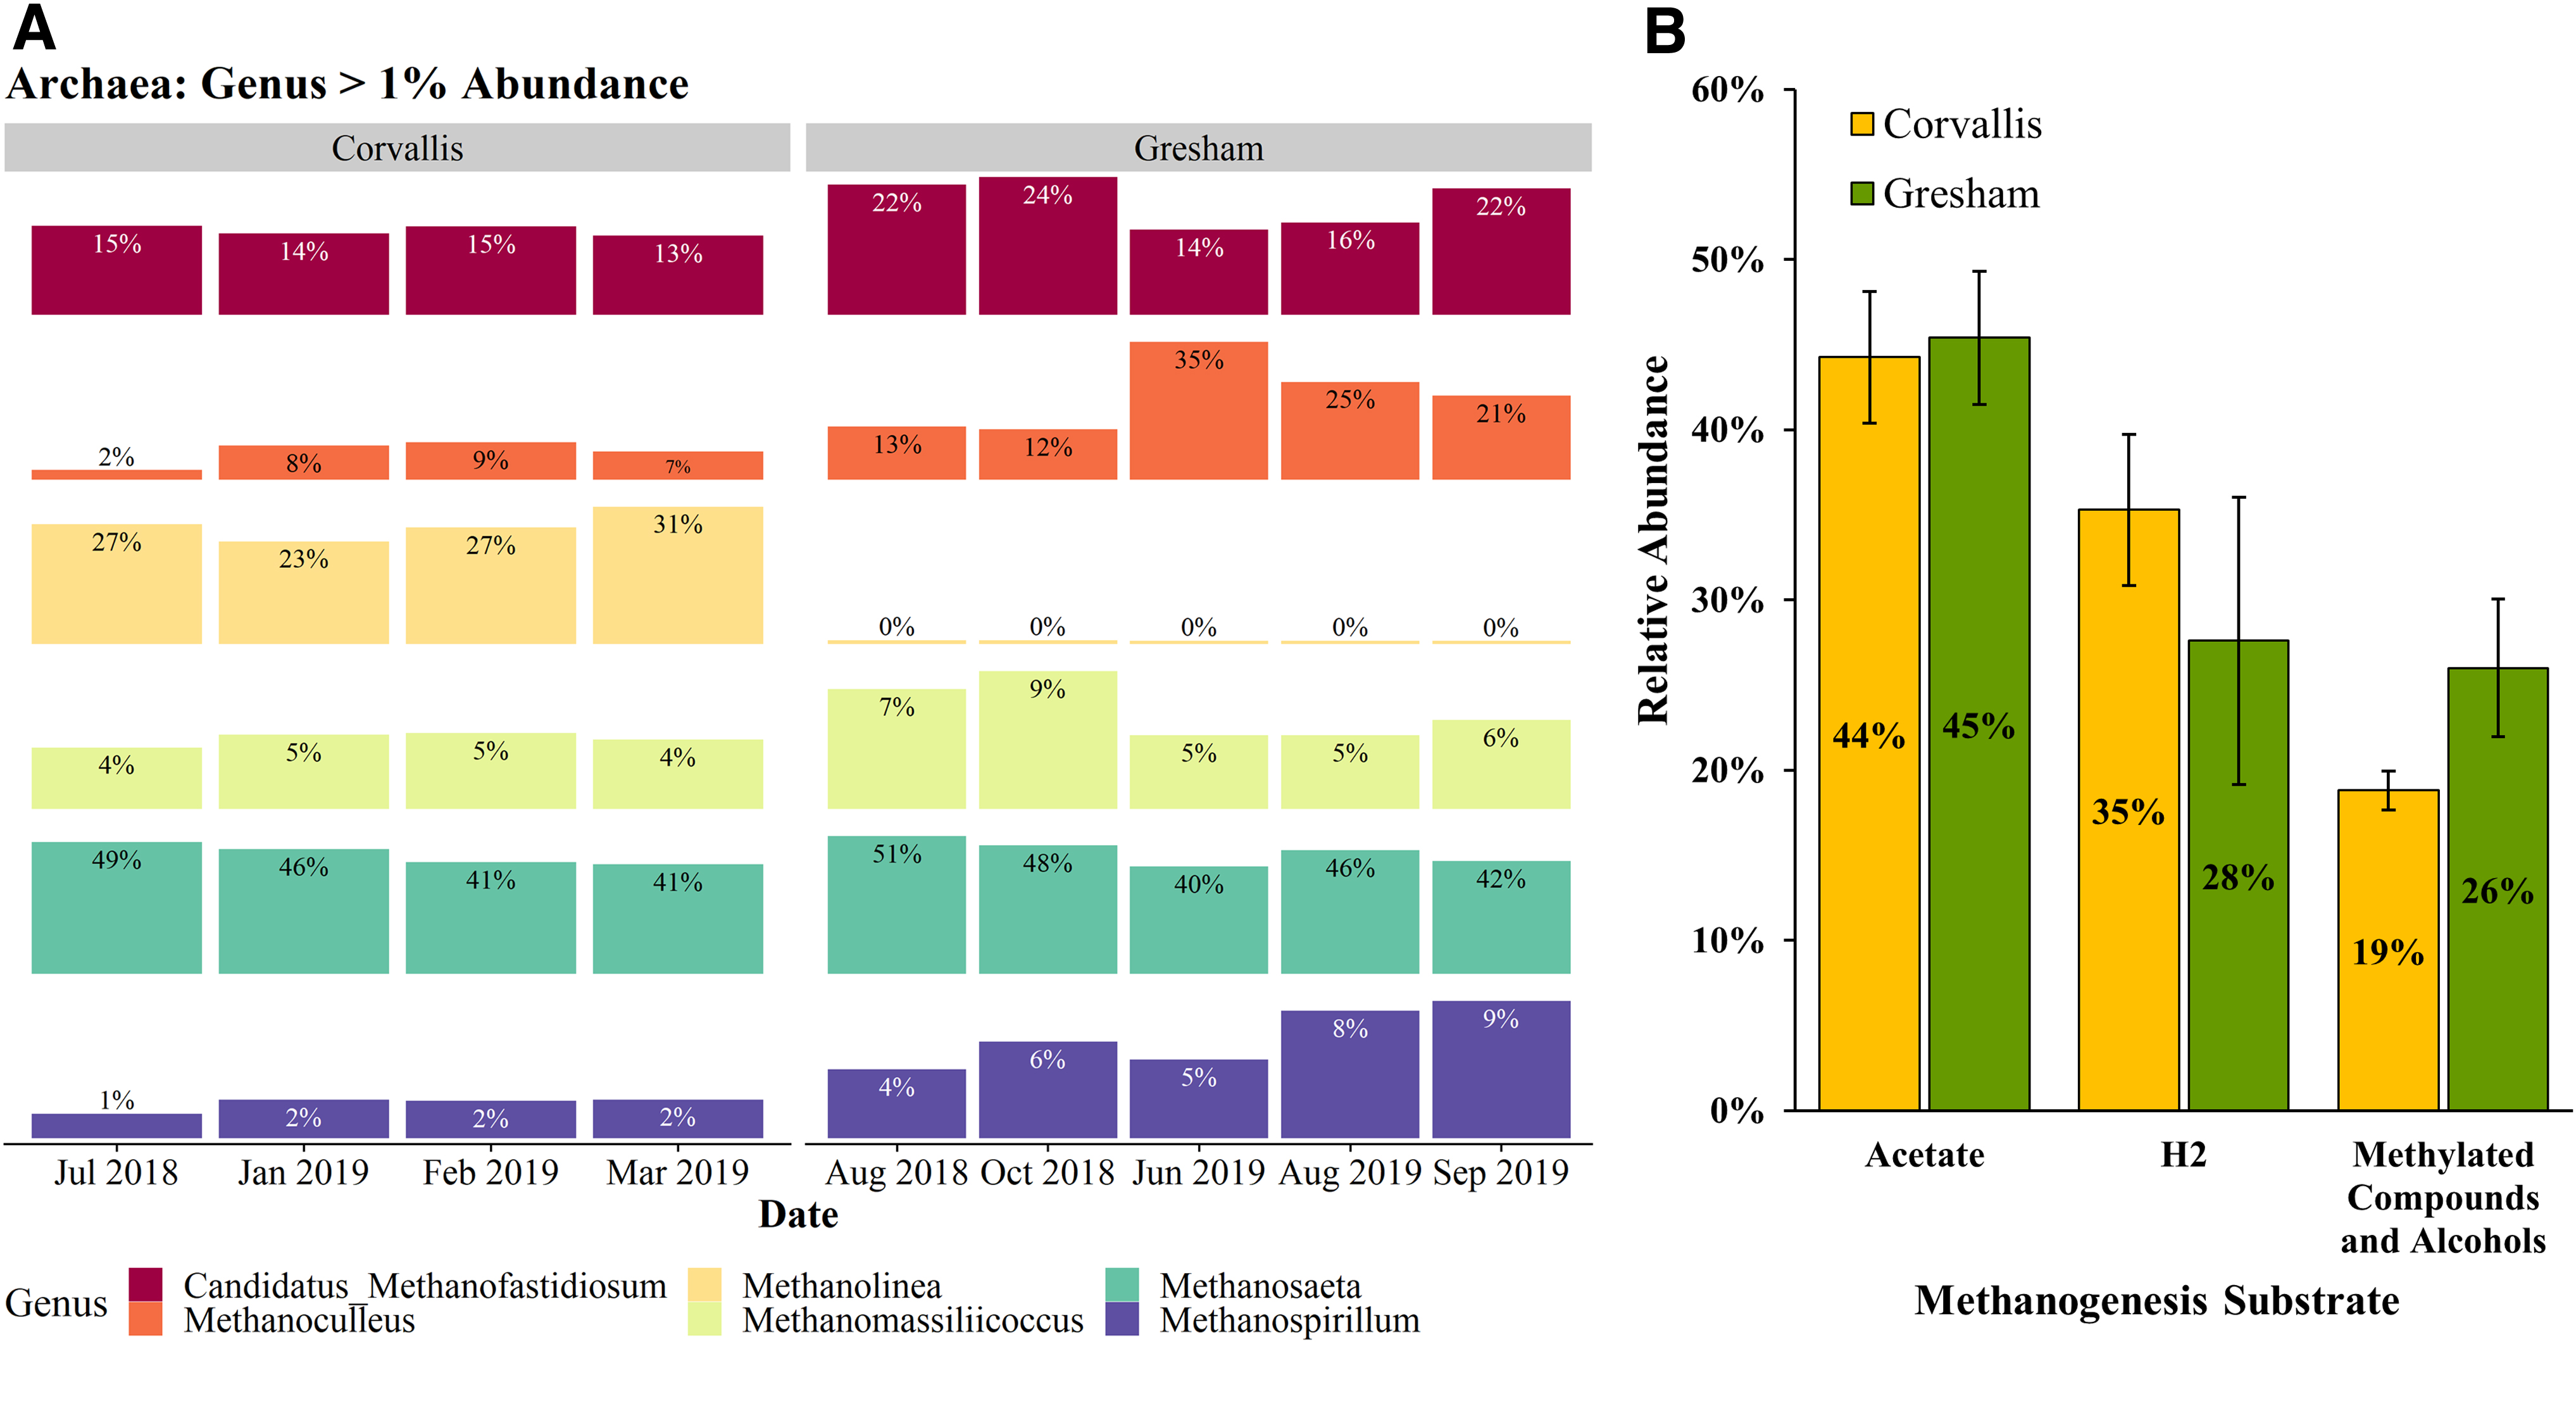
The decrease in abundance of hydrogenotrophic methanogens, along with the enrichment of methanogens that utilize methylated compounds and alcohols in the Gresham inoculum, suggests a possible difference in fermentation pathways between the two anaerobic digesters. For instance, Sphaerochaeta sp., an alcohol producing fermenter, is enriched threefold in the Gresham inoculum compared with Corvallis (Fig. 1). It has been previously shown that certain fermentation products (e.g., alcohols) are indicators that alternative pathways are being used for pyruvate metabolism that compete with the pyruvate:ferredoxin oxidoreductase, which typically results in less hydrogen production during acidogenesis (Angenent et al., 2004). An increase in alcohol production and decrease in hydrogen production during FOG co-digestion due to the enrichment of Sphaerochaeta spp. would explain the observed differences in methanogenic pathways.
Effect of different ammonia concentrations on FOG and no-FOG experiments
To determine how substrate and microbial community compositions affected the sensitivity of the anaerobic digesters to ammonia, batch experiments were run at varying ammonia compositions with and without FOG amendments for both Gresham and Corvallis inocula. The ammonia species of interest is TAN in these experiments. The pH for all conditions tested stayed between 6.5 and 7.7, a range that is in the optimal range for methanogens (Appels et al., 2008). The free ammonia was calculated and remained <100 ppm for all conditions tested (Supplementary Figs. S3–S5), which is well below previous reported inhibitory concentrations of 100–150 ppm NH3 determined in a FOG co-digestion study (Amha et al., 2017).
In addition, to ensure that all important intermediates and by-products were measured throughout the duration of these experiments, a carbon mass balance was completed (Supplementary Fig. S8). The carbon balance includes the VS content of the sludge on the first and last day of each experiment as well as the total CH4 and CO2 produced throughout the duration of each experiment. VS content was converted to mol C as previously described (Adams et al., 1951). For the Corvallis experiments, the carbon accounted for in the FOG and no-FOG experiments ranged from 93% to 147% and in the Gresham experiments, the values ranged from 97% to 126%. Given the uncertainty in these calculations, these results indicate that the carbon in these systems has been adequately accounted for.
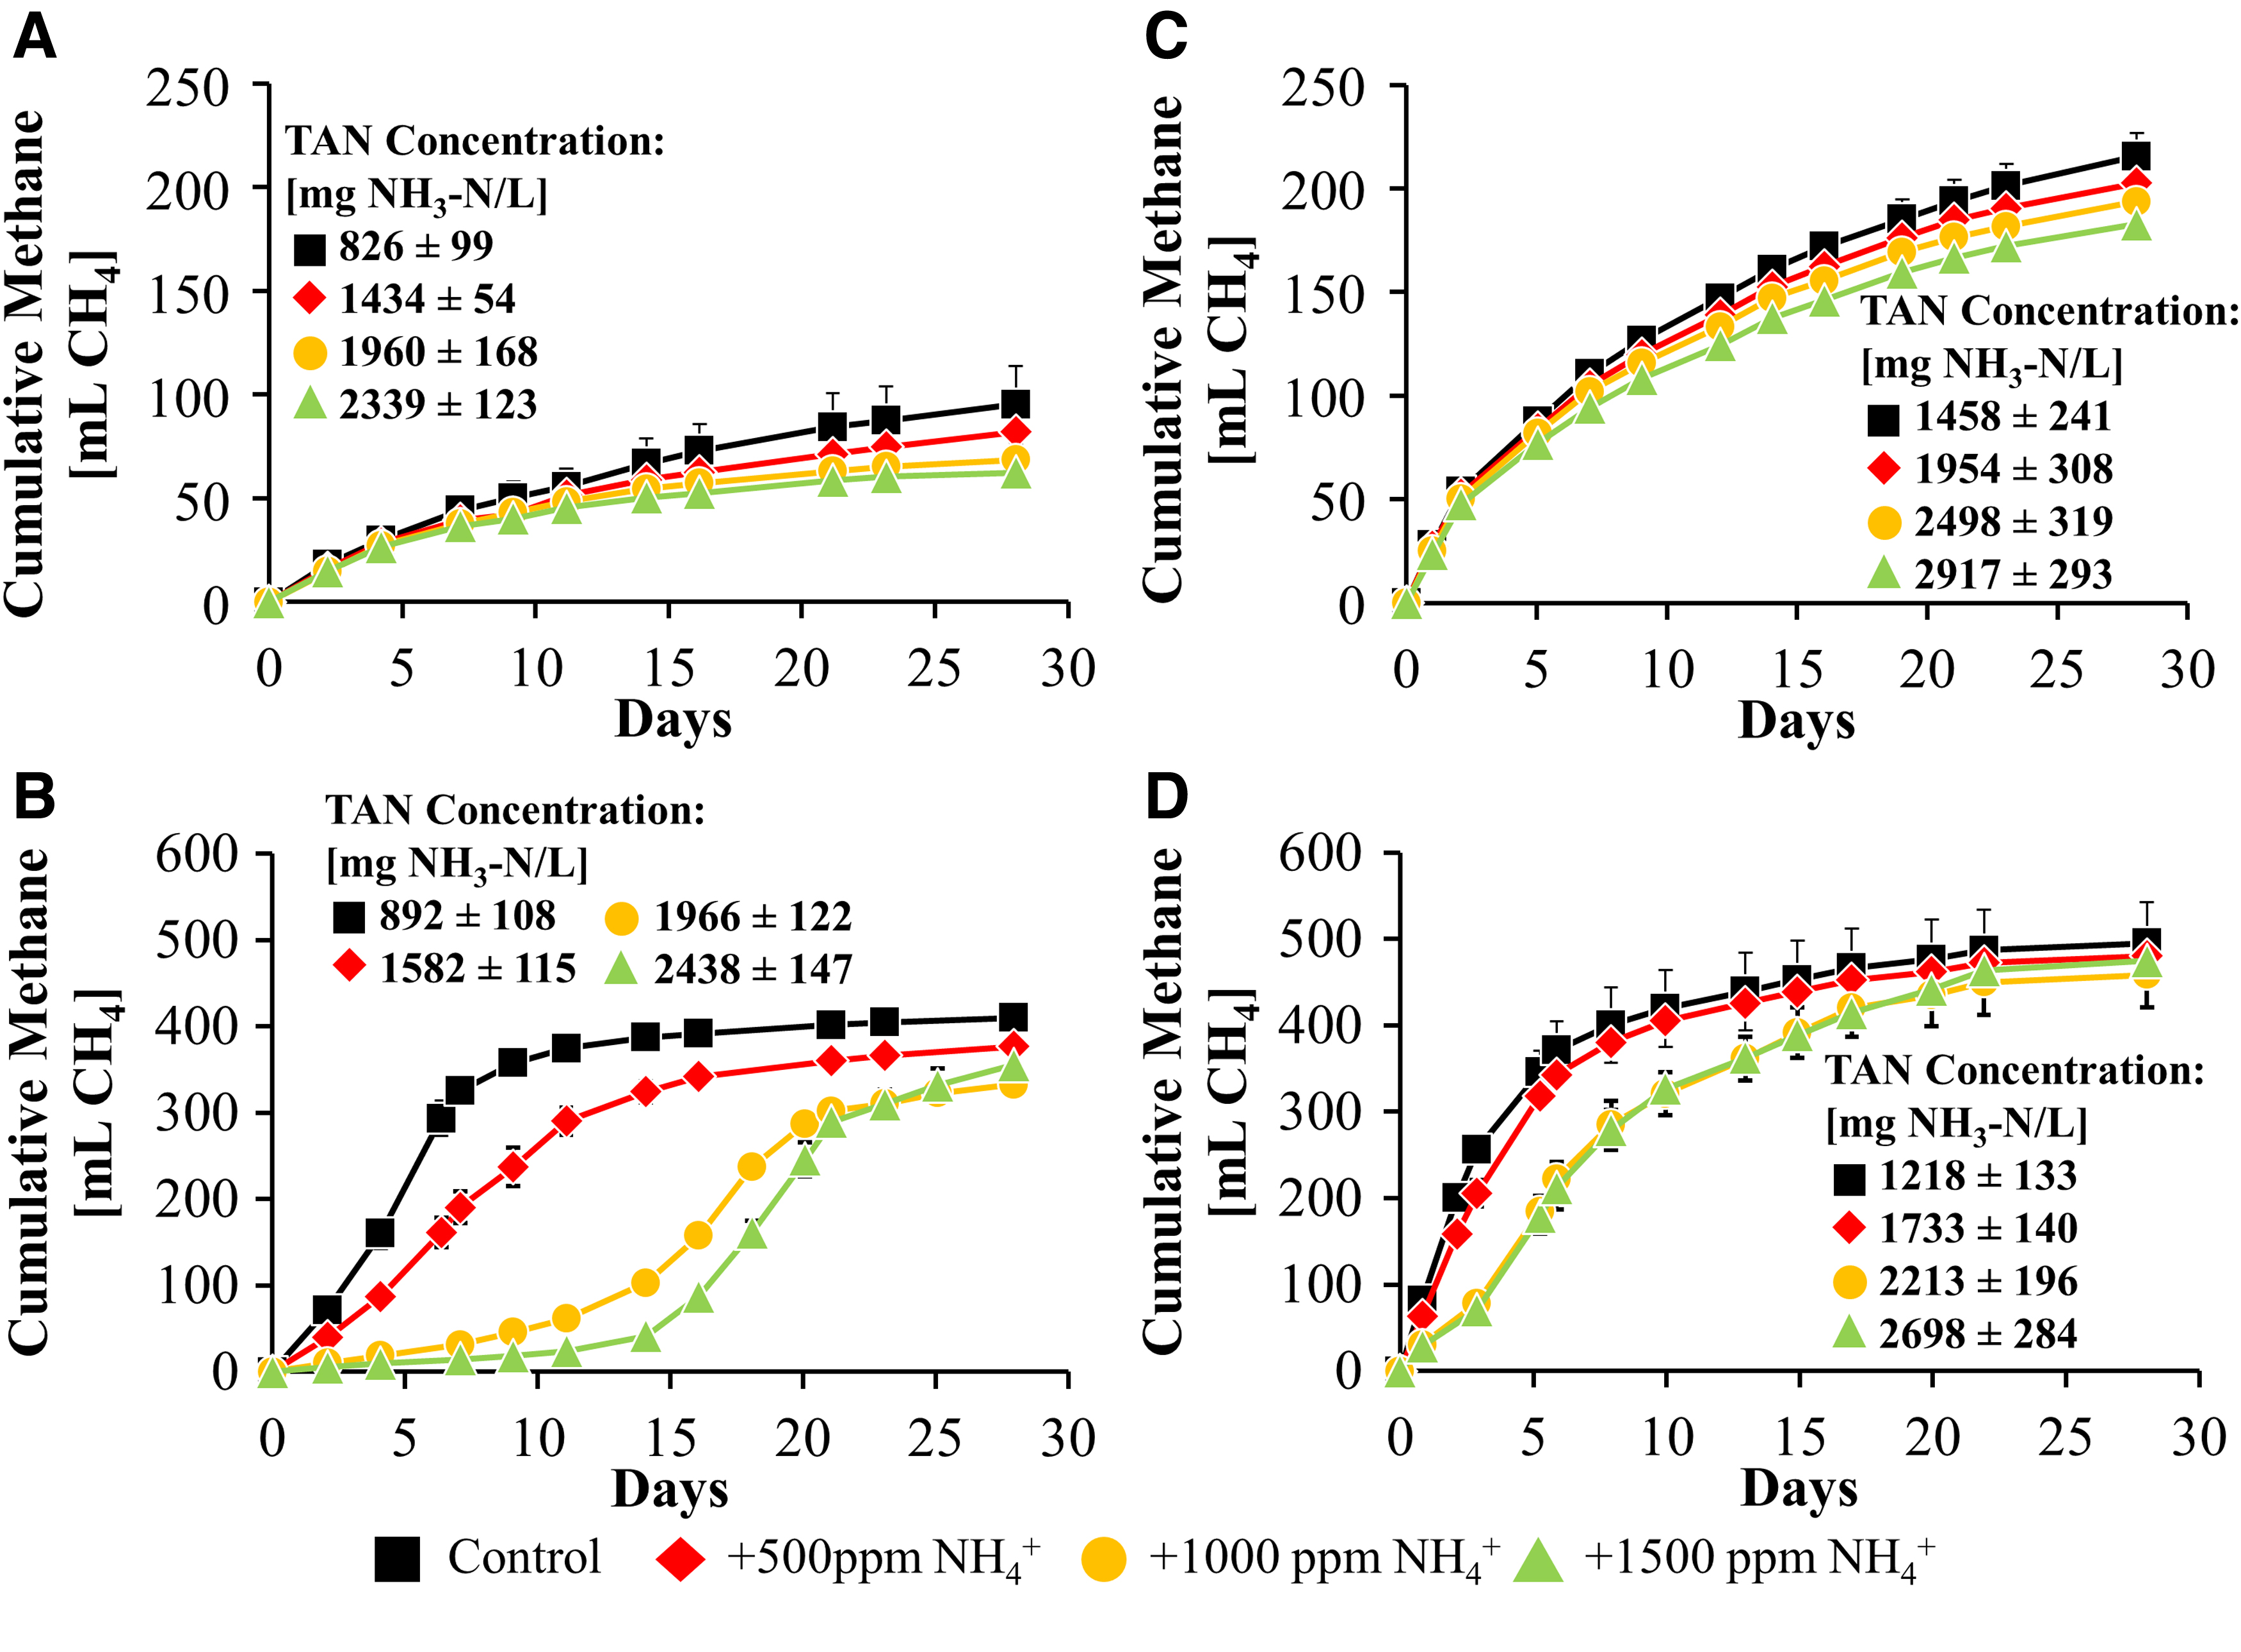
For both inocula, cumulative methane production was greatest when FOG was fed as a co-substrate with the Gresham inoculum producing more methane than the Corvallis inoculum under all conditions tested (Figs. 3 and 4). A comparison of the no-FOG controls in the absence of TAN also shows greater methane production in the Gresham inoculum compared with the Corvallis inoculum and may be due to residual FOG found in the Gresham inoculum (Supplementary Fig. S7).
Cumulative methane for batch anaerobic digesters not amended with FOG with Corvallis inoculum
Gompertz model best-fit parameters for total methane produced
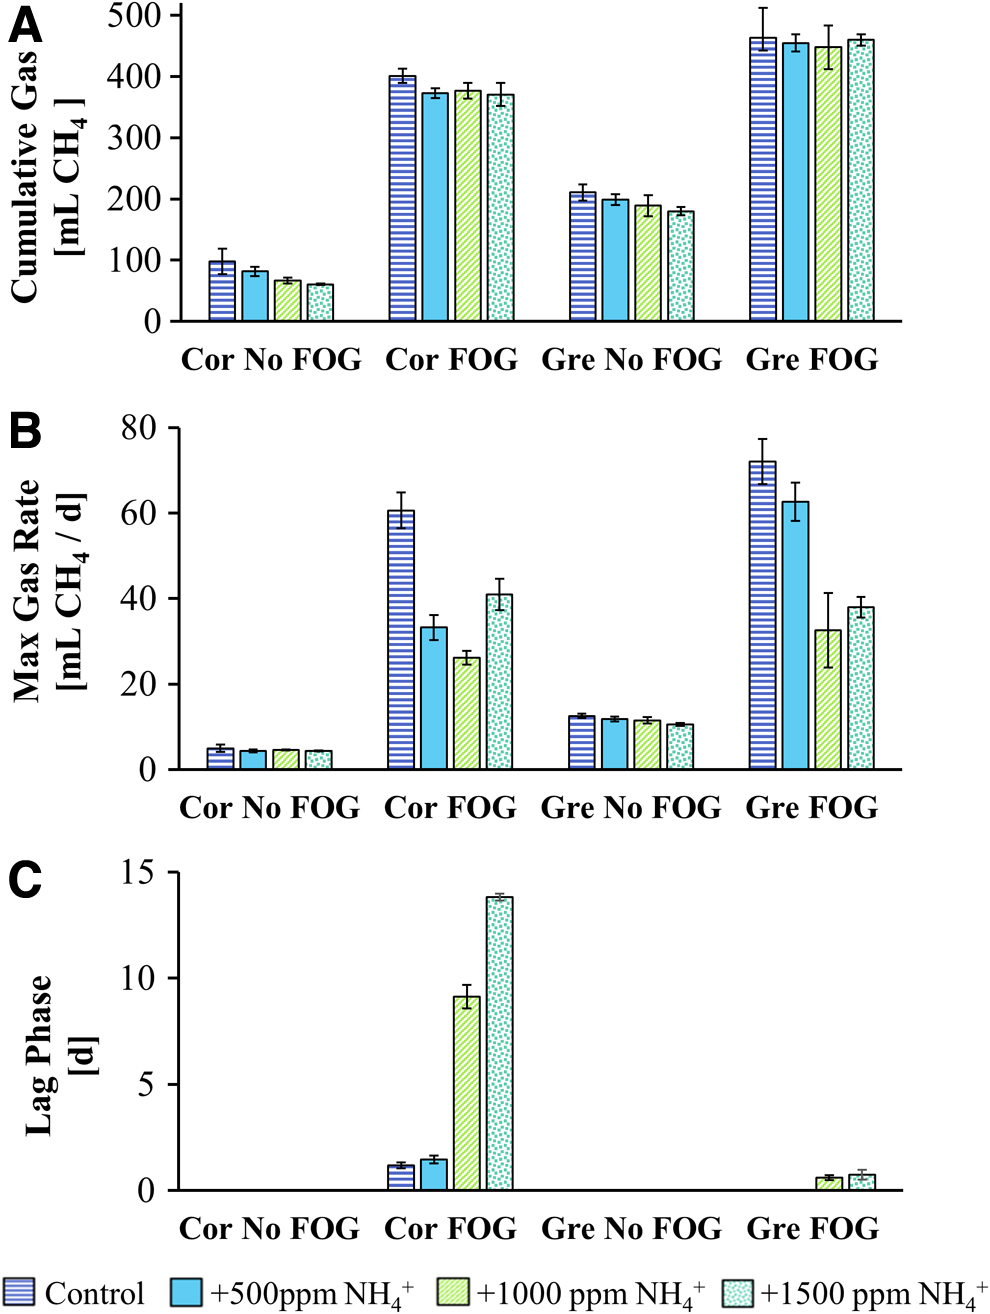
Under all conditions tested, the Corvallis inoculum was more sensitive to TAN than the Gresham inoculum. In addition, the presence of FOG increased the TAN sensitivity of both the Corvallis and Gresham inocula. This increase in sensitivity to ammonia correlated with an increase in baseline metabolic activity due to the presence of FOG. The presence of FOG increased the maximum gas production rates roughly 12-fold in the Corvallis inoculum (from 5 to 60.6 mL CH4/day) and roughly 6-fold in the Gresham inoculum (from 12.5 to 72 mL CH4/day) (Fig. 4). Thus, regardless of the microbiome composition, increased metabolic activity because of the presence of FOG resulted in a higher level of sensitivity to ammonia inhibition.
When FOG was added, the Corvallis inoculum exhibited greater inhibition with each incremental addition of TAN. At lower TAN concentrations this was observed as a decrease in methane production rates, whereas at higher concentrations an increase in lag phase was also observed. This is in contrast with the Gresham inoculum which exhibited a clear delineation between the two lowest and the two highest TAN concentrations (Figs. 3 and 4).
Interestingly, the Corvallis inoculum amended with FOG and exposed to high TAN (+1,000–1,500 ppm
The Gresham inoculum followed a similar pattern with a slight increase in lag phase duration observed when amended with FOG at high TAN concentrations. However, this lag phase was much shorter and was not observed at the lower TAN concentrations. In addition, the Gresham inocula consistently had higher maximum methane production rates than the Corvallis inocula for all TAN conditions tested (Fig. 4). This suggests that while the presence of FOG does increase the sensitivity of the Gresham inocula to TAN, it is still more tolerant to TAN than the Corvallis inocula.
These differences in TAN sensitivity can be linked to the differences in the structure of each inoculum's microbial community. Within the bacterial domain, the Gresham inoculum has an increased abundance of fermentative bacteria likely because of the FOG co-digestion performed at the Gresham facility. In particular, Syntrophomonas spp. (3.0% ± 0.6% in Gresham and 0.5% ± 0.6% in Corvallis) have been previously shown to have elevated TAN tolerance based on its observed enrichment in anaerobic digesters adapted to TAN levels >2,000 ppm (Esquivel-Elizondo et al., 2016). Within the archaeal domain, both the Gresham and Corvallis inoculum are dominated by acetoclastic methanogens at 44% and 45%, respectively (Fig. 2). In addition, the Corvallis inoculum had a greater prevalence of hydrogenotrophic methanogens than Gresham at 35% and 28%, respectively.
It has been previously shown that at TAN concentrations >1,700 mg/L, a more negative effect on acetoclastic methanogens occurs compared with hydrogenotrophic methanogens, which appeared to be more sensitive at TAN concentrations <1,700 mg/L (Koster and Lettinga, 1984). This would explain the large decrease in methanogenesis in both systems, which are dominated by acetoclastic methanogens, at TAN concentrations >1,700 mg/L (Fig. 3).
Similarly, this would also account for why the Corvallis inoculum, which had a greater abundance of hydrogenotrophic methanogens, was more sensitive to TAN concentrations <1,700 mg/L. The Gresham inoculum was less affected by TAN concentrations >1,700 mg/L, potentially due to its higher prevalence of Methanoculleus spp., which rely on syntrophic acetate oxidizers and have been reported to be the prevailing species in ammonia-enriched processes (Manzoor et al., 2016). This ammonia-tolerant syntrophic relationship would also help explain why the Gresham inoculum was less sensitive to lower concentrations of ammonia.
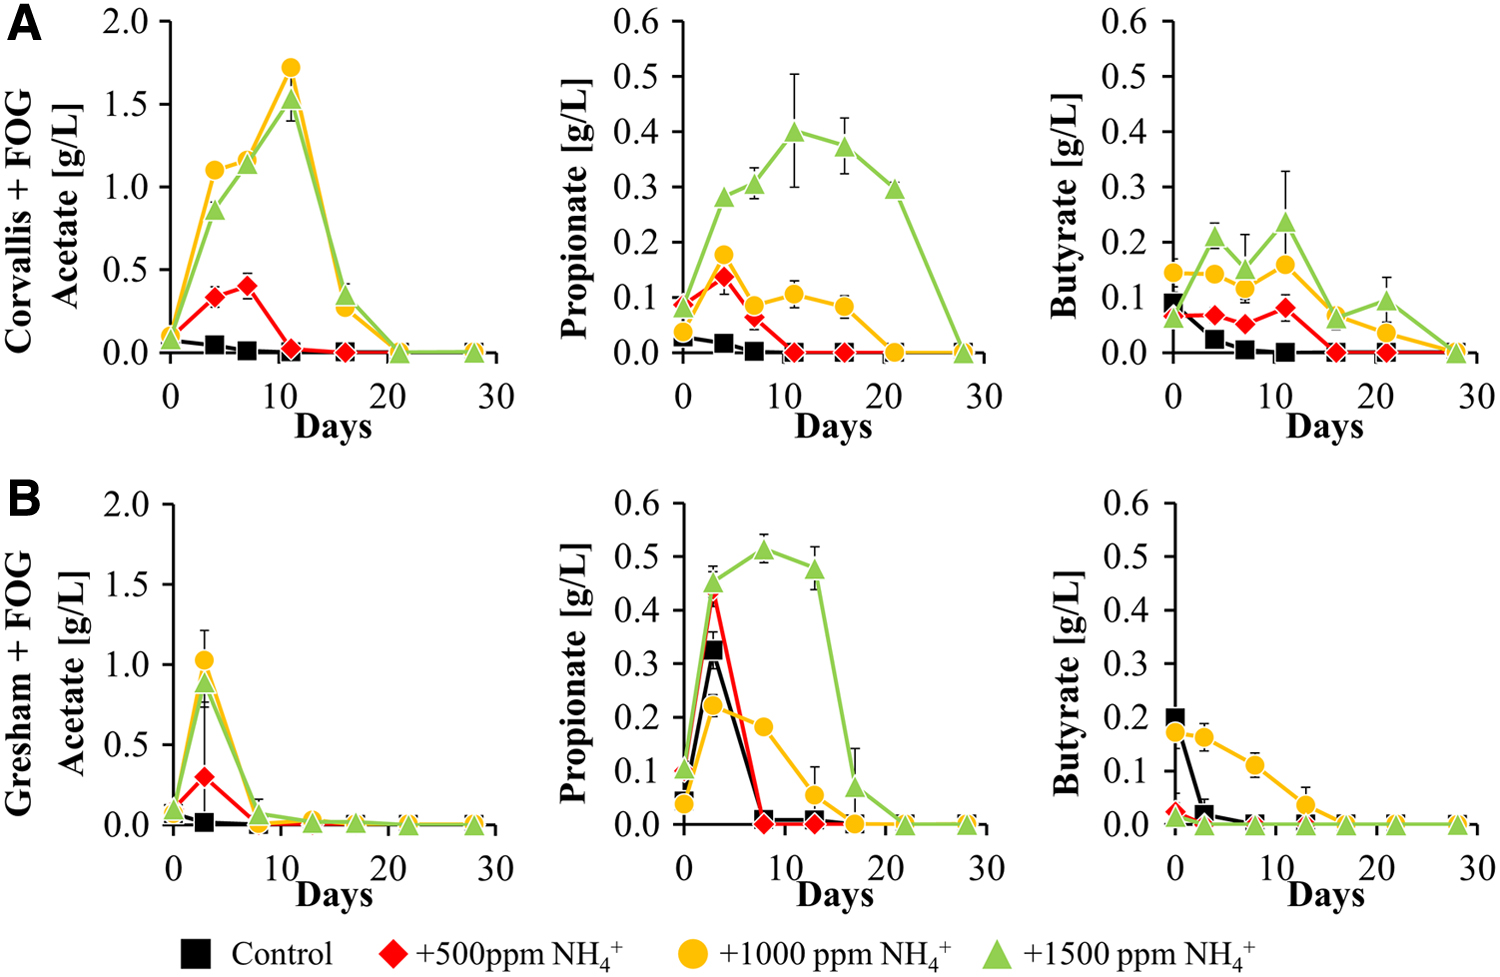
When looking at the key OAs in the AD process (acetate, propionate, and butyrate), there are noteworthy differences in which OAs build-up and the length of time the microbial community takes to utilize those OAs. In experiments where no FOG was added, there was no considerable build-up of OAs and all conditions retain individual OA concentrations <0.05 g/L of acetate, propionate, and butyrate (Supplementary Fig. S2). In experiments where FOG was added as a co-substrate, both the Corvallis and Gresham inoculum exhibit accumulation of all three OAs measured (Fig. 5 and Supplementary Fig. S6).
Organic acid concentrations measured in batch anaerobic digesters amended with FOG seeded with Corvallis inoculum
The Corvallis inoculum saw the largest build-up of acetate in the highest TAN conditions (1.72 and 1.54 g/L for the +1,000 ppm
These results support the idea that the acetoclastic methanogens are more sensitive to TAN inhibition at higher TAN doses (+1,000 and +1,500) in both the Gresham and Corvallis inocula. At the lower dose of TAN (+500) both inoculum experience a lower accumulation of acetate, whereas the control shows almost immeasurable amounts of acetate because the acetoclastic pathway is less affected at these TAN levels (Koster and Lettinga, 1984; Yenigun and Demirel, 2013).
Both inoculum experience elevated levels of propionate as the TAN increases, although the Gresham microbiome is able to utilize the propionate much faster than that of Corvallis. The operating conditions at the Gresham facility have enriched for bacteria that ferment carbohydrates, glucose, mannose, lactose, and LCFAs allowing the Gresham microbiome to work through the propionate and butyrate faster than the Corvallis microbiome. The Gresham microbiome is also able to utilize the acetate more quickly and does not see as great of a build-up compared with the Corvallis results. This is likely due to the greater abundance of methanogens in the Gresham inoculum compared with Corvallis (Fig. 6), which accounts for the faster rate of acetate utilization observed.

Concentration of the mcrA gene in the inoculum used for each experiment from the Corvallis and Gresham treatment facilities. Error bars are 95% confidence intervals for triplicate samples. WWTP, wastewater treatment plant.
Conclusions
This work demonstrated that the microbial community found in a representative mono-substrate anaerobic digester was more sensitive to ammonia inhibition than the microbial community found in a representative FOG co-digestion anaerobic digester. Sequence analyses revealed that the mono-substrate inoculum had a greater relative abundance of the more ammonia-sensitive hydrogenotrophic methanogens and a lesser relative abundance of ammonia-tolerant microbes (e.g., Syntrophomonas spp.) compared with that found in the FOG co-digestion inoculum. In addition, the mono-substrate inoculum had a lower concentration of methanogens compared with the FOG co-digestion inoculum, which resulted in greater build-up of OAs during FOG co-digestion that were utilized at slower rates.
The greater relative abundance of ammonia-tolerant microbes and absolute abundance of methanogens in FOG co-digestion inoculum can be attributed to the higher organic loading rates and ammonia concentrations typically found during FOG co-digestion. This suggests that proper adaptation to FOG co-digestion can result in a more ammonia-tolerant microbial community.
However, this work also demonstrated for the first time that even ammonia-tolerant microbial communities, such as those found in FOG co-digestion inoculum, have increased sensitivity to ammonia when noninhibitory concentrations of FOG are present. This work is the first to separate ammonia inhibition from LCFA inhibition and demonstrate that ammonia inhibition is linked to metabolic activity. This is an important finding as researchers and practitioners look for ways to increase energy production from anaerobic co-digestion by intensifying the organic carbon loading rates. Thus, intensifying FOG loading rates has the potential to create a negative feedback loop by both increasing the accumulated ammonia in the digester (from FOG hydrolysis) and increasing the sensitivity of the microbiome to the ammonia (through increased metabolic activity).
Footnotes
Acknowledgments
The authors thank all of the undergraduates involved in data collection efforts: Jackson Schleicher, Heidi Reed, Mia Cowan, Ana Aranda, Yvette Smith, and Gloria Ruiz-Orozco. The authors also thank Mark Dasenko at the Center for Genome Research and Biocomputing for his assistance with sequence library prep. The authors are especially grateful to the staff of the City of Corvallis Wastewater Reclamation Plant and the staff at Jacobs Engineering, Inc., who run the City of Gresham Wastewater Reclamation Plant for their assistance with sampling.
Author Disclosure Statement
No competing financial interests exist.
Funding Information
This study was supported by the NSF CAREER Grant No. 1847654.
References
Supplementary Material
Please find the following supplemental material available below.
For Open Access articles published under a Creative Commons License, all supplemental material carries the same license as the article it is associated with.
For non-Open Access articles published, all supplemental material carries a non-exclusive license, and permission requests for re-use of supplemental material or any part of supplemental material shall be sent directly to the copyright owner as specified in the copyright notice associated with the article.