
Abstract
The degradation of phenanthrene (PHE) by Fe2+-activated persulfate (PS) has been investigated. The effects of different concentrations of Fe2+ and PS on the degradation of PHE have been explored, and the degradation mechanisms have been studied. The results indicate that when the initial concentration of PHE was 0.3 mM, the best PHE degradation conditions were found using PS and Fe2+ concentrations of 10 and 5 mM, respectively. The degradation rate, mineralization rate, PS consumption rate, and oxidant efficiency were 89%, 54%, 97%, and 5.49, respectively. The degradation of PHE followed a pseudo-first-order kinetic model, and the reaction rate constant (k) was in the range of 0.0029–0.0768 h−1. Free radical quenching studies have revealed that SO4−
Introduction
Polycyclic aromatic hydrocarbons (PAHs) are mainly generated by human activities, such as the incomplete combustion of fossil fuels, vehicle exhaust emissions, and illegal emissions from chemical plants (Ranc et al., 2016; Yu et al., 2018). The PAHs are one of the most significant organic pollutants due to their high ecotoxicity, long-term persistence, carcinogenicity, mutagenicity, and significant toxicity to humans (Saichek and Reddy, 2003; Haritash and Kaushik, 2009; Song et al., 2019).
There are several remediation methods for PAH pollution, such as thermal desorption, solvent extraction, photocatalytic degradation, electrokinetic remediation, biological and phytoremediation, and chemical oxidation (Cao et al., 2008; Zhou et al., 2019). Among the remediation technologies mentioned earlier, the cost of physical methods is high and they can easily cause secondary pollution; bioremediation technology is low cost and relatively environmentally friendly, but its remediation cycle is long and its remediation efficiency is low (Kuppusamy et al., 2017; Sakshi et al., 2019; Zhou et al., 2019). Chemical oxidation technology is one of the most promising strategies due to its good performance in treating various recalcitrant pollutants (including PAHs) and its high efficiency in removing target contaminants over a short period of time (Matzek and Carter, 2016; Peluffo et al., 2018).
Therefore, chemical oxidation technology has been increasingly used in the remediation of PAH pollution (Jiang et al., 2013; Peluffo et al., 2016). Commonly used oxidants include Fenton's reagent, ozone, permanganate, and peroxide (Ferrarese et al., 2008; Mora et al., 2014; Bajagain et al., 2018). Over the past decade, persulfate (PS), as a strong and relatively stable oxidant (E = 2.01 V) (Usman et al., 2012), has been widely studied because of its high stability, high aqueous solubility, wide pH range, high redox potential, long persistence, relatively low cost, and environmental friendliness (Zhao et al., 2013; Medina et al., 2018; Zhou et al., 2018). In addition, when compared with other oxidants, the degradation of PAHs via PS oxidation is not limited by the number of aromatic rings (Liao et al., 2018; Gou et al., 2020).
Liao et al. (2014) studied the total removal efficiency of PAHs by using different chemical oxidants on the addition of nutrients and showed that the total removal efficiency of PAHs via chemical oxidation and nutrient addition followed the order of activated PS > potassium permanganate > modified Fenton's reagent > Fenton's reagent. Zhao et al. (2013) evaluated several different oxidants for the removal of PAHs from contaminated soil at industrial coking sites by using a simulated device. The removal of PAHs using Fe2+-activated PS reached 92%. A modified Fenton's reagent can remove 80% of PAHs, whereas the efficiencies of both hydrogen dioxide and Fenton's reagent for the removal of PAHs were lower than 60%.
The oxidation reaction rate of PS is limited by the production of highly reactive sulfate radicals (SO4−·). PS is stable at room temperature and can be activated via heat, ultraviolet (UV) light, transition metals, or other means to form SO4−· (Tsitonaki et al., 2010; Long et al., 2014).
Wu et al. (2016) compared the effectiveness of different activation methods (heat, hydrogen peroxide, base, and Fe2+) for PS on the removal of total petroleum hydrocarbon (TPH) found in soil and demonstrated that using Fe2+ to activate PS was the best method for TPH removal (44% within 8 h). Gou et al. (2020) studied the influence of different PS dosages (1%, 3%, 6%, and 10% w/w) and various activation methods (native iron, H2O2, alkaline, and ferrous iron) on the removal of PAHs. It was found that Fe2+-activated PS exhibits the best effect and the removal efficiency of total PAHs was in the range of 43–54%. The experimental results of Qiu et al. (2020) showed that Fe2+-activated PS oxidation is an environmentally friendly and low-cost method that can effectively reduce total microbes (TMs) and antibiotic-resistant microbes (ARMs). The use of 60/30 μM Fe2+/PS showed a high removal efficiency toward TMs (99.8% and 99.9%) and ARMs (99.6% and 99.9%) in sewage treatment plant wastewater (Beilun Yandong wastewater treatment plant in Ningbo, Zhejiang Province, China) and bay water (Meishan Bay in Ningbo, Zhejiang Province, China). Therefore, Fe2+ was selected to activate PS in this experiment.
Although the activation of PS using Fe2+ has been widely used in the remediation of PAH pollution, research on its mechanism is relatively limited. In addition, the dosage of Fe2+ and PS is key to the removal of PAHs by using the Fe2+/PS system. A small amount of Fe2+ cannot activate PS to produce enough SO4−
Therefore, in this study, phenanthrene (PHE), one of the most abundant PAHs detected in contaminated sites (Yu et al., 2018), was selected as the target pollutant in this study. This study aims at: (1) investigating the relationship between the degradation rate of PHE and different concentrations of Fe2+ and PS, and the degradation kinetics of PHE; (2) investigating the types of active free radicals in the reaction process by using molecular probes to clarify the possible reaction mechanism; and (3) identifying the intermediates produced in the reaction and proposing a possible degradation pathway for PHE.
Materials and Methods
Chemicals
Sodium persulfate (Na2S2O8), ferrous sulfate heptahydrate (FeSO4·7H2O), sodium thiosulfate (Na2S2O3), potassium iodide (KI), sodium bicarbonate (NaHCO3), phenanthrene (C14H10), and catechol (C6H6O2) were purchased from Xilong Chemical Co. Ltd. All reagents were analytically pure. Acetone (C3H6O), n-hexane (C6H14), ethyl ether (C2H5OC2H5), methanol (CH3OH), absolute ethanol (CH3CH2OH), and tert-butyl alcohol (C4H10O) were purchased from Nanjing Chemical Reagent Co., Ltd., which were chromatographically pure.
Experimental methods
Degradation of PHE using Fe2+/PS system
Sixty microliters of a 50 mM acetone solution of PHE was added to a 40 mL brown glass bottle. After complete evaporation of the acetone, (1) 10 mL of different concentrations (i.e., 5, 10, 20, or 40 mM) of PS solution was added to the brown glass bottle and then 5 mM FeSO4 was added to the PS solution. (2) 10 mL of 10 mM PS solution was added to the brown glass bottle and different concentrations (i.e., 0, 2.5, 5, 10, or 20 mM) of FeSO4 were added to the PS solution. The brown glass bottle was stored at 25°C with shaking at 150 rpm. After 3, 6, 12, 24, 48, and 72 h, 0.5 mL of 100 mM Na2S2O3 was added to the solution to terminate the oxidation reaction. The residual PHE, PS, and Fe2+ concentrations in the solution were determined. Ten milliliters of deionized water was added without PS or Fe2+ as the control sample. All experiments were carried out in 40 mL brown glass bottles and performed in triplicate with destructive sampling, and the results were averaged.
Determination of PHE, PS, and Fe2+ concentration
At the end of the reaction, 10 mL of n-hexane was added to the bottle and shaken for 10 min, after which 2 mL of the upper organic phase was removed, filtered through a 0.22 μm organic filter membrane (Tianjin Keyilong Co., Ltd.), and placed into a 2 mL liquid phase injection bottle. The PHE concentration was measured by using high-performance liquid chromatography (HPLC) following the method described by Xu et al. (2019).
The HPLC setting parameters: Chromatographic column, C18 reversed-phase column; column temperature, 30°C; mobile phase, methanol/water = 85/15 (v/v); flow rate, 1.00 mL/min; injection volume, 1 μL; UV detection wavelength, 254 nm, sampling time, 8 min; average retention time of PHE, 6.328 min.
The concentration of PS was determined by using a spectrophotometric method previously reported by Liang et al. (2008). One hundred microliters of the solution to be tested was taken in a 25 mL colorimetric tube, and 10 mL of a mixed solution of NaHCO3/KI (0.4 g NaHCO3 and 8 g KI/100 mL) was added to the tube for the oscillating reaction for 15 min. The absorbance of the reaction solution was measured at 352 nm by using a spectrophotometer (722S; Shanghai Chengguang Instrument Co., Ltd.). The role of NaHCO3 in the mixture was to prevent I− from being converted into I2, which affects the accuracy of the PS measurements (Liang et al., 2008).
The Fe2+ concentration was determined by using o-phenanthroline spectrophotometry (Han et al., 2015). One hundred microliters of the solution to be tested was added to a 25 mL colorimetric tube, 0.8 mL of acetic acid-sodium acetate buffer solution (pH = 4.6), and 0.8 mL of o-phenanthroline solution (mass concentration 0.1%) added, diluted to 10 mL with deionized water, shaken, and reacted for 10 min. The absorbance of the reaction mixture was determined at 512 nm by using a spectrophotometer (722S; Shanghai Chengguang Instrument Co., Ltd.). The concentration of PHE, PS and Fe2+ were obtained according to Supplementary Figure S1.
Identification of active free radicals
The types of free radicals produced in the solution were qualitatively determined on the addition of an excessive amount of a free radical quencher, such as ethanol (EtOH) and tert-butyl alcohol (TBA). Under the optimal degradation conditions, three groups of experiments were set up: control, EtOH, and TBA. A mixture of n (quenching agent)/n (oxidant) = 500/1, PHE, and Fe2+ was added into a brown glass bottle, 2.92 mL of EtOH was added to the EtOH group, 4.77 mL of TBA was added to the TBA group, and the control group did not have any quenching agent. Deionized water was then added to ensure that the total volume of the reaction solution was 10 mL, and the resulting mixture was shaken. Finally, PS was added and the samples were then placed in a shaker at 25°C and 150 rpm to start the reaction. At the corresponding time points (3, 6, 12, 24, 48, and 72 h), 0.5 mL of terminator (100 mM Na2S2O3) was added to the solution to terminate the oxidation reaction and the residual concentration of PHE in the solution was determined via extraction.
Determination of dissolved organic carbon in solution
Under the optimal degradation conditions, the dissolved organic carbon (DOC) content during the degradation of PHE was studied to analyze the degree of mineralization of PHE. The experiment was also carried out in a 40 mL brown glass bottle, and the procedure was the same as the PHE degradation process mentioned earlier. After the reaction was started, the bottles were removed at the corresponding time points (3, 6, 12, 24, 48, and 72 h), 0.5 mL of terminator (100 mM Na2S2O3) was added, and the samples were used to determine the DOC content.
Determination of DOC in the solution: After termination of the reaction, 10 mL of the reaction solution in the brown glass bottle was transferred to a 50 mL centrifuge tube, centrifuged at 4000 rpm for 5 min, and finally filtered through a 0.22 μm aqueous membrane to prevent tiny PHE particles from entering the aqueous solution and affecting the determination of the DOC content. The solution was then placed into an injection bottle for testing.
The DOC content was determined by using a total organic carbon (TOC)/total nitrogen analyzer (Multi N/C 3100; Jena Analytical Instruments Co. Ltd., Germany). Before the test, two drops of 2 M HCl were added to the sample.
Determination of intermediate products of PHE oxidation
The intermediate products of PHE oxidation were determined by using gas chromatography-mass spectrometry (GC-MS, Clarus SQ8; PerkinElmer, Waltham, MA). After the reaction was terminated, 10 mL of dichloromethane was added to a brown glass bottle, shaken, and vibrated on a vortex oscillator for 5 min. After standing and layering, the dichloromethane layer was transferred to a glass bottle and 10 mL of fresh dichloromethane was added to the aqueous solution and extracted three times in total. Five grams of anhydrous sodium sulfate was added after mixing the three dichloromethane layers. After dehydration, the dichloromethane solution was transferred to a 100 mL flask, evaporated to 2 mL, filtered through a 0.22 μm organic filter membrane, and finally placed into a GC-MS injection bottle for determination. The settings used for the GC-MS parameters have been previously reported by Liao et al. (2014).
Results and Discussion
The effect of Fe2+ and PS concentration on the degradation of PHE
The effect of the Fe2+ concentration on the degradation of PHE was explored by using an initial PHE concentration of 0.3 mM and PS concentration of 10 mM. The concentration of PHE in the experiment was the theoretical concentration since the solubility of PHE in water is very low (1.18 mg/L at 20°C). Besides, we assumed that the solubility of PHE in water maintained a dynamic equilibrium, so its dissolution process was ignored.
The results are presented in Fig. 1a. The degradation rate of PHE was 32% after 72 h without the addition of Fe2+, which was due to the fact that the S2O82− anion in PS exhibits oxidizing properties and can directly react with PHE. Song et al. (2019) used electron paramagnetic resonance (EPR) spectroscopy to identify the free radicals in the reaction and found that without the addition of an activator, the EPR spectrum of PS also shows the presence of peaks corresponding to SO4−· and ·OH, which proved that PS can decompose to produce SO4−
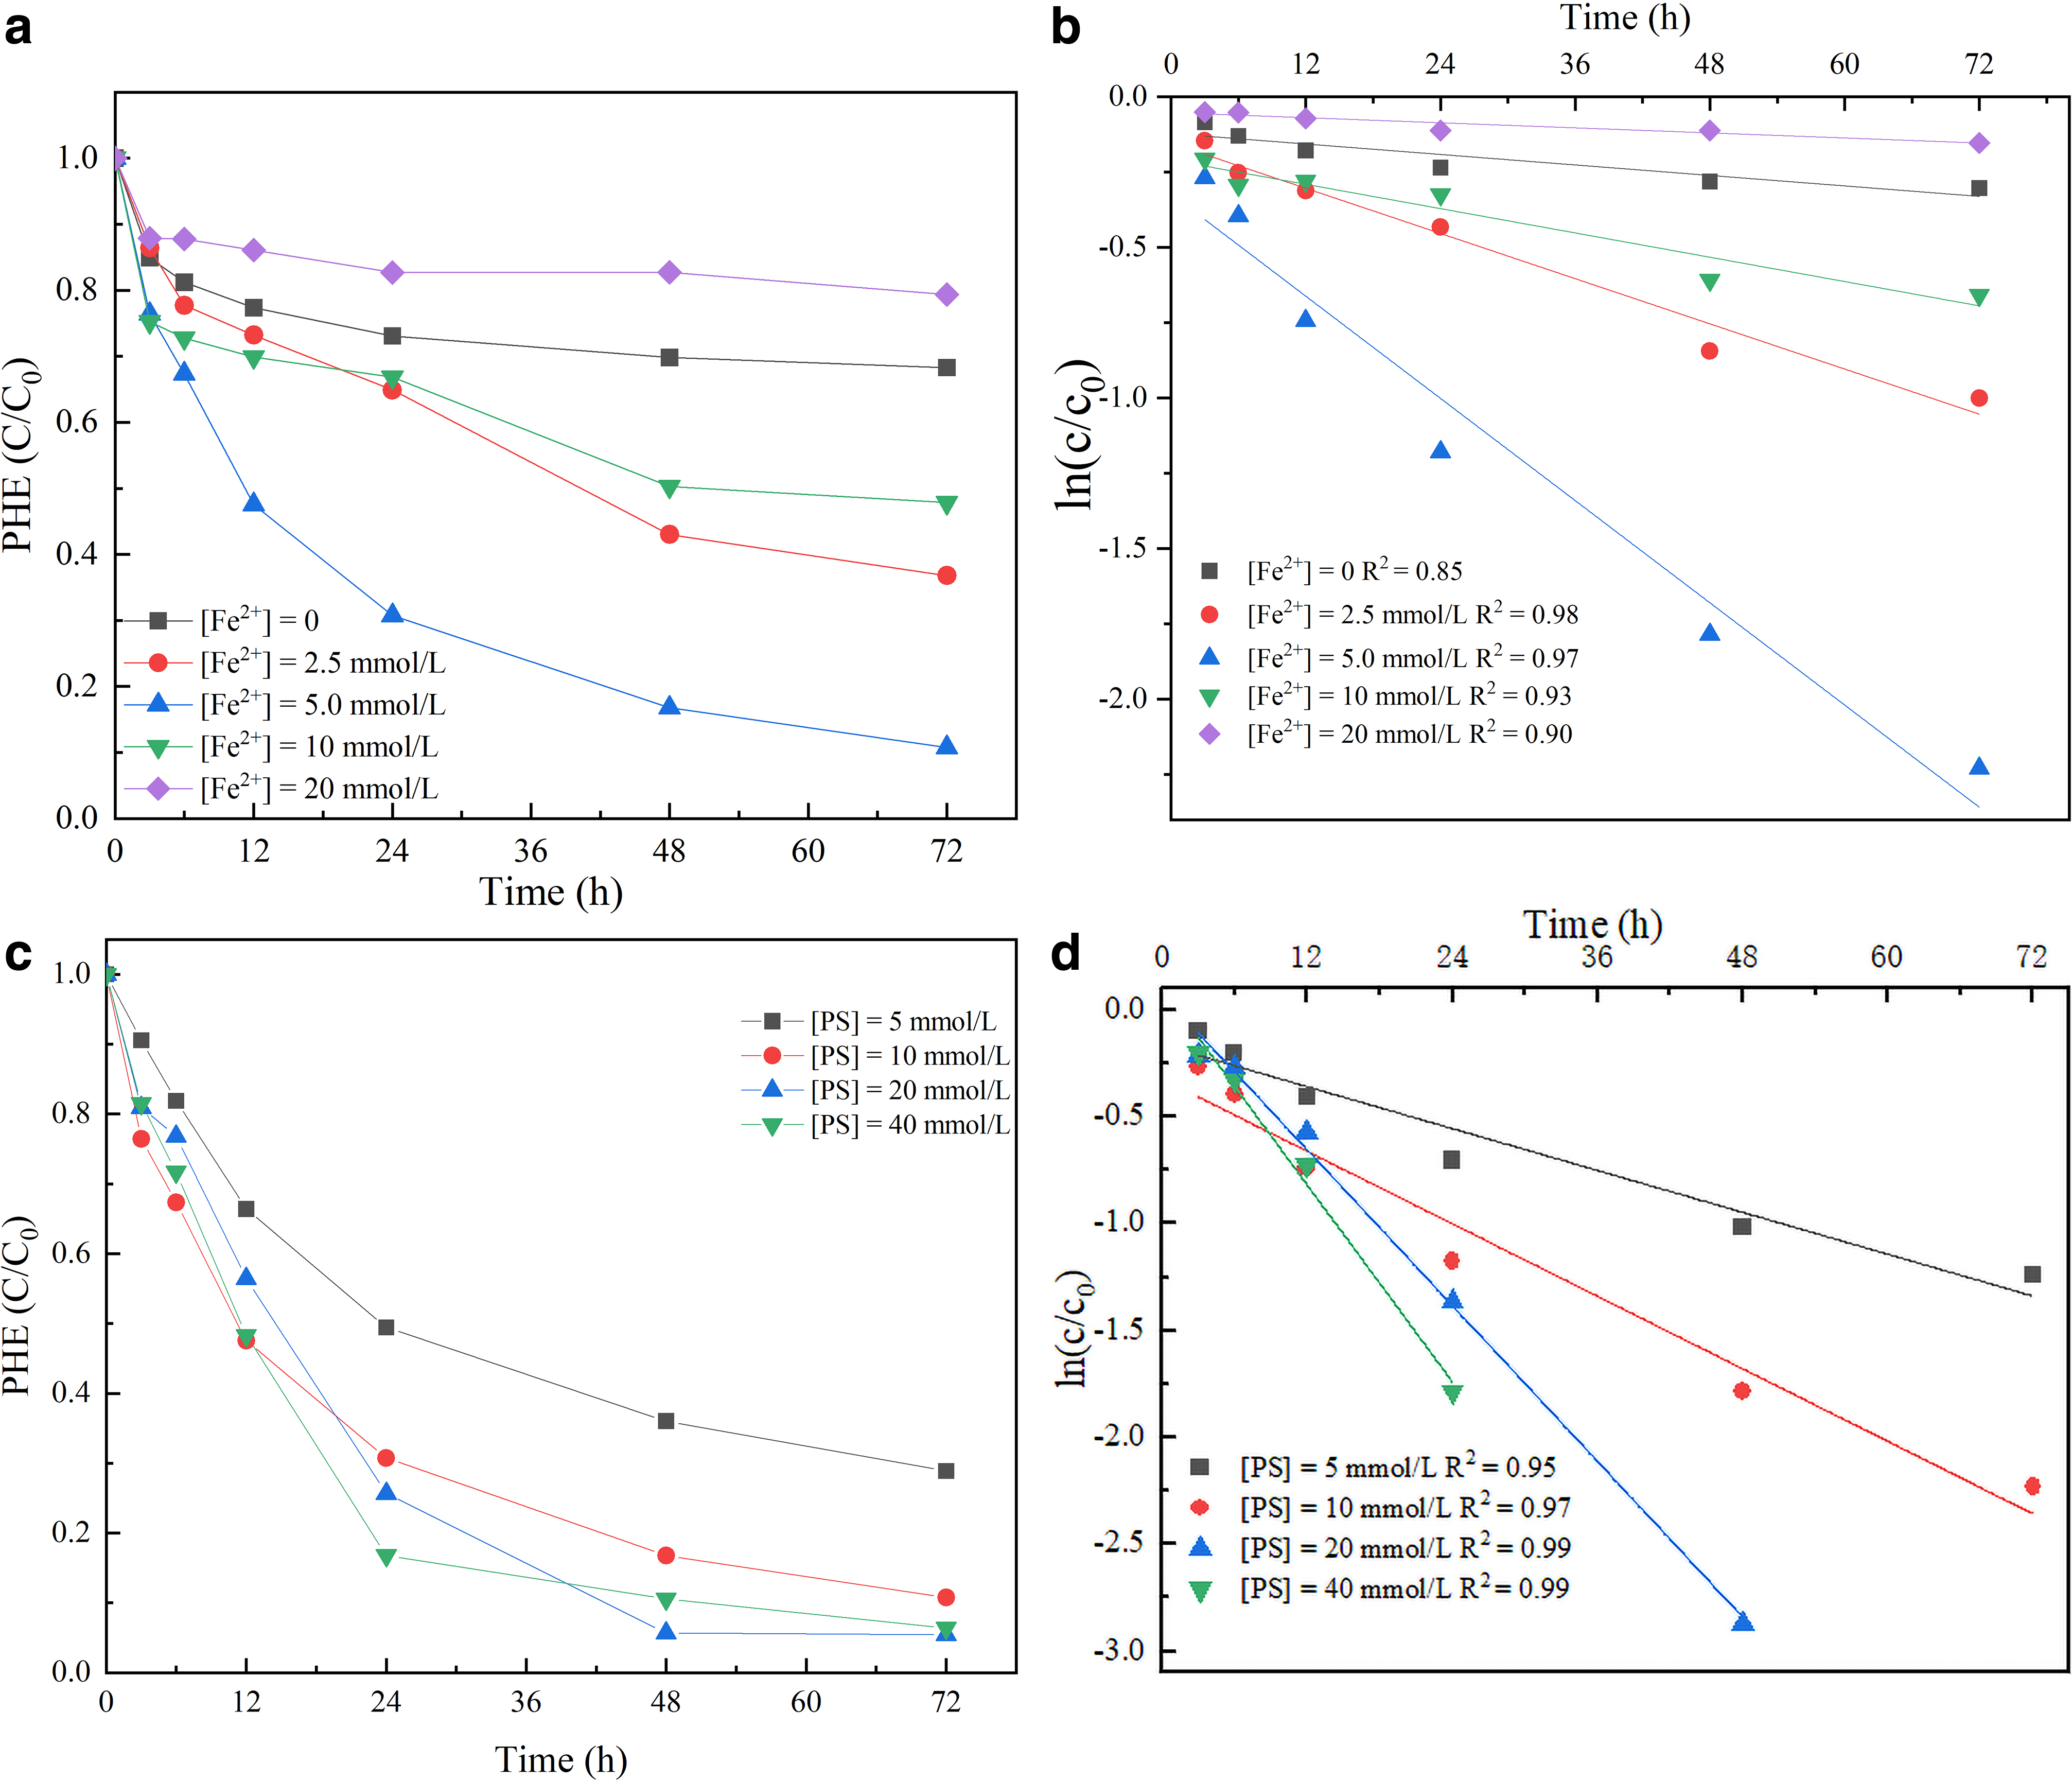
When the concentration of Fe2+ was increased from 5 to 10 mM, the degradation rate of PHE decreased from 89% to 52%, indicating that a high concentration of Fe2+ will compete to consume SO4−
Liang et al. (2004) also reported similar conclusions in their study on the degradation of trichloroethylene by using the Fe2+/PS system. Using a certain amount of Na2S2O8, the degradation rate first increased and then decreased on increasing the Fe2+ dosage, indicating that when Fe2+ was added in excess, Fe2+ reacts with the sulfate radicals in the system and the excess Fe2+ becomes an inhibitor of SO4−
According to the fitting results, the degradation of PHE followed a pseudo-first-order kinetic model, as described in Eq. (3). This can also be expressed by using Eq. (4):
where c0 is the initial PHE concentration, and ct is the concentration of PHE at reaction time t (hour). k is the pseudo-first-order rate constant, which can be calculated by plotting ln(ct/c0) as a function of time (t) through linear regression. Apparently, k is closely related to the oxidant concentration and Fe2+ concentration.
Figure 1b shows that at a PS concentration of 10 mM, the SO4−
The effect of the PS concentration on PHE degradation is shown in Fig. 1c. When the concentration of PS was increased from 5 to 10 mM, the degradation rate of PHE increased from 71% to 89% after 72 h. The results indicate that as the PS concentration increased, more SO4−
Similar phenomena have been described in other studies. Xu and Li (2010) studied the degradation of Orange G by using PS and found that when the concentration of PS was >4 mM, the removal rate of Orange G remained at ∼81%. Liang et al. (2014) also proved that when using a fixed concentration of Fe2+, an increase in the PS concentration did not promote an increase in the removal rate of 2,4-dichlorophenoxyacetic acid (2,4-D). Xu et al. (2019) used Fe2+-activated PS to degrade benzo[a]pyrene in soil (concentration of benzo[a]pyrene = 0.7 mg/kg) and found that in the PS concentration range of 1–40 mM, 20 mM PS had the highest degradation efficiency of benzo[a]pyrene in soil, reaching 99%. Ferrarese et al. (2008) used 1.67 mmol/g soil, 3.33 mmol/g soil, and 6.67 mmol/g soil of PS to treat PAHs and the total PAH removal rate was ∼88, 76, and 82%, respectively. This shows that the removal rate of pollutants does not always increase with an increase in the dosage of the oxidizing agent used.
In Fig. 1d, it can be seen that when the concentration of Fe2+ was 5 mM, increasing the concentration of PS from 5 to 40 mM led the degradation rate of PHE to increase due to the increase in SO4−
Oxidation efficiency of PS on PHE
The changes in the PS and Fe2+ concentration with time during the degradation of PHE using different concentrations of Fe2+ are displayed in Fig. 2. Figure 2a shows that the PS decomposition rate was only 9% after 72 h of reaction in the absence of Fe2+. When the Fe2+ concentration was increased from 0 to 20 mM, the decomposition rate of PS continued to increase. After 72 h, the decomposition rate of PS increased from 9.3% to 99%. These results demonstrate that Fe2+ can rapidly activate PS and decompose to produce SO4−

Variation in the
When the concentration of Fe2+ exceeds 5 mM, the degradation ratio of PHE decreases with an increase in the Fe2+ concentration. This indicates that the SO4−
Figure 2b shows that the concentration of Fe2+ changed rapidly during the degradation of PHE on activation by Fe2+ and the concentration of Fe2+ was low after 3 h. The reaction rate constants of Fe2+ and SO4−
In addition, for the experimental group using an initial Fe2+ concentration of 20 mM, the concentration of Fe2+ was still high after 72 h [C(Fe2+) = 7.18 mM], whereas the PS was almost completely decomposed. At this time, the degradation rate of PHE was 21%, which was lower than that of the control group without Fe2+ (32%) (Fig. 1a), which fully proved that the competitive consumption of SO4−
The changes in the PS concentration with time during the degradation of PHE using different concentrations of PS are shown in Fig. 3. When the PS concentration was 5 and 10 mM, the PS was exhausted after 72 h, and the corresponding PHE degradation rates were 71% and 89%, respectively. This indicates that an increase in the PS concentration produces more SO4−
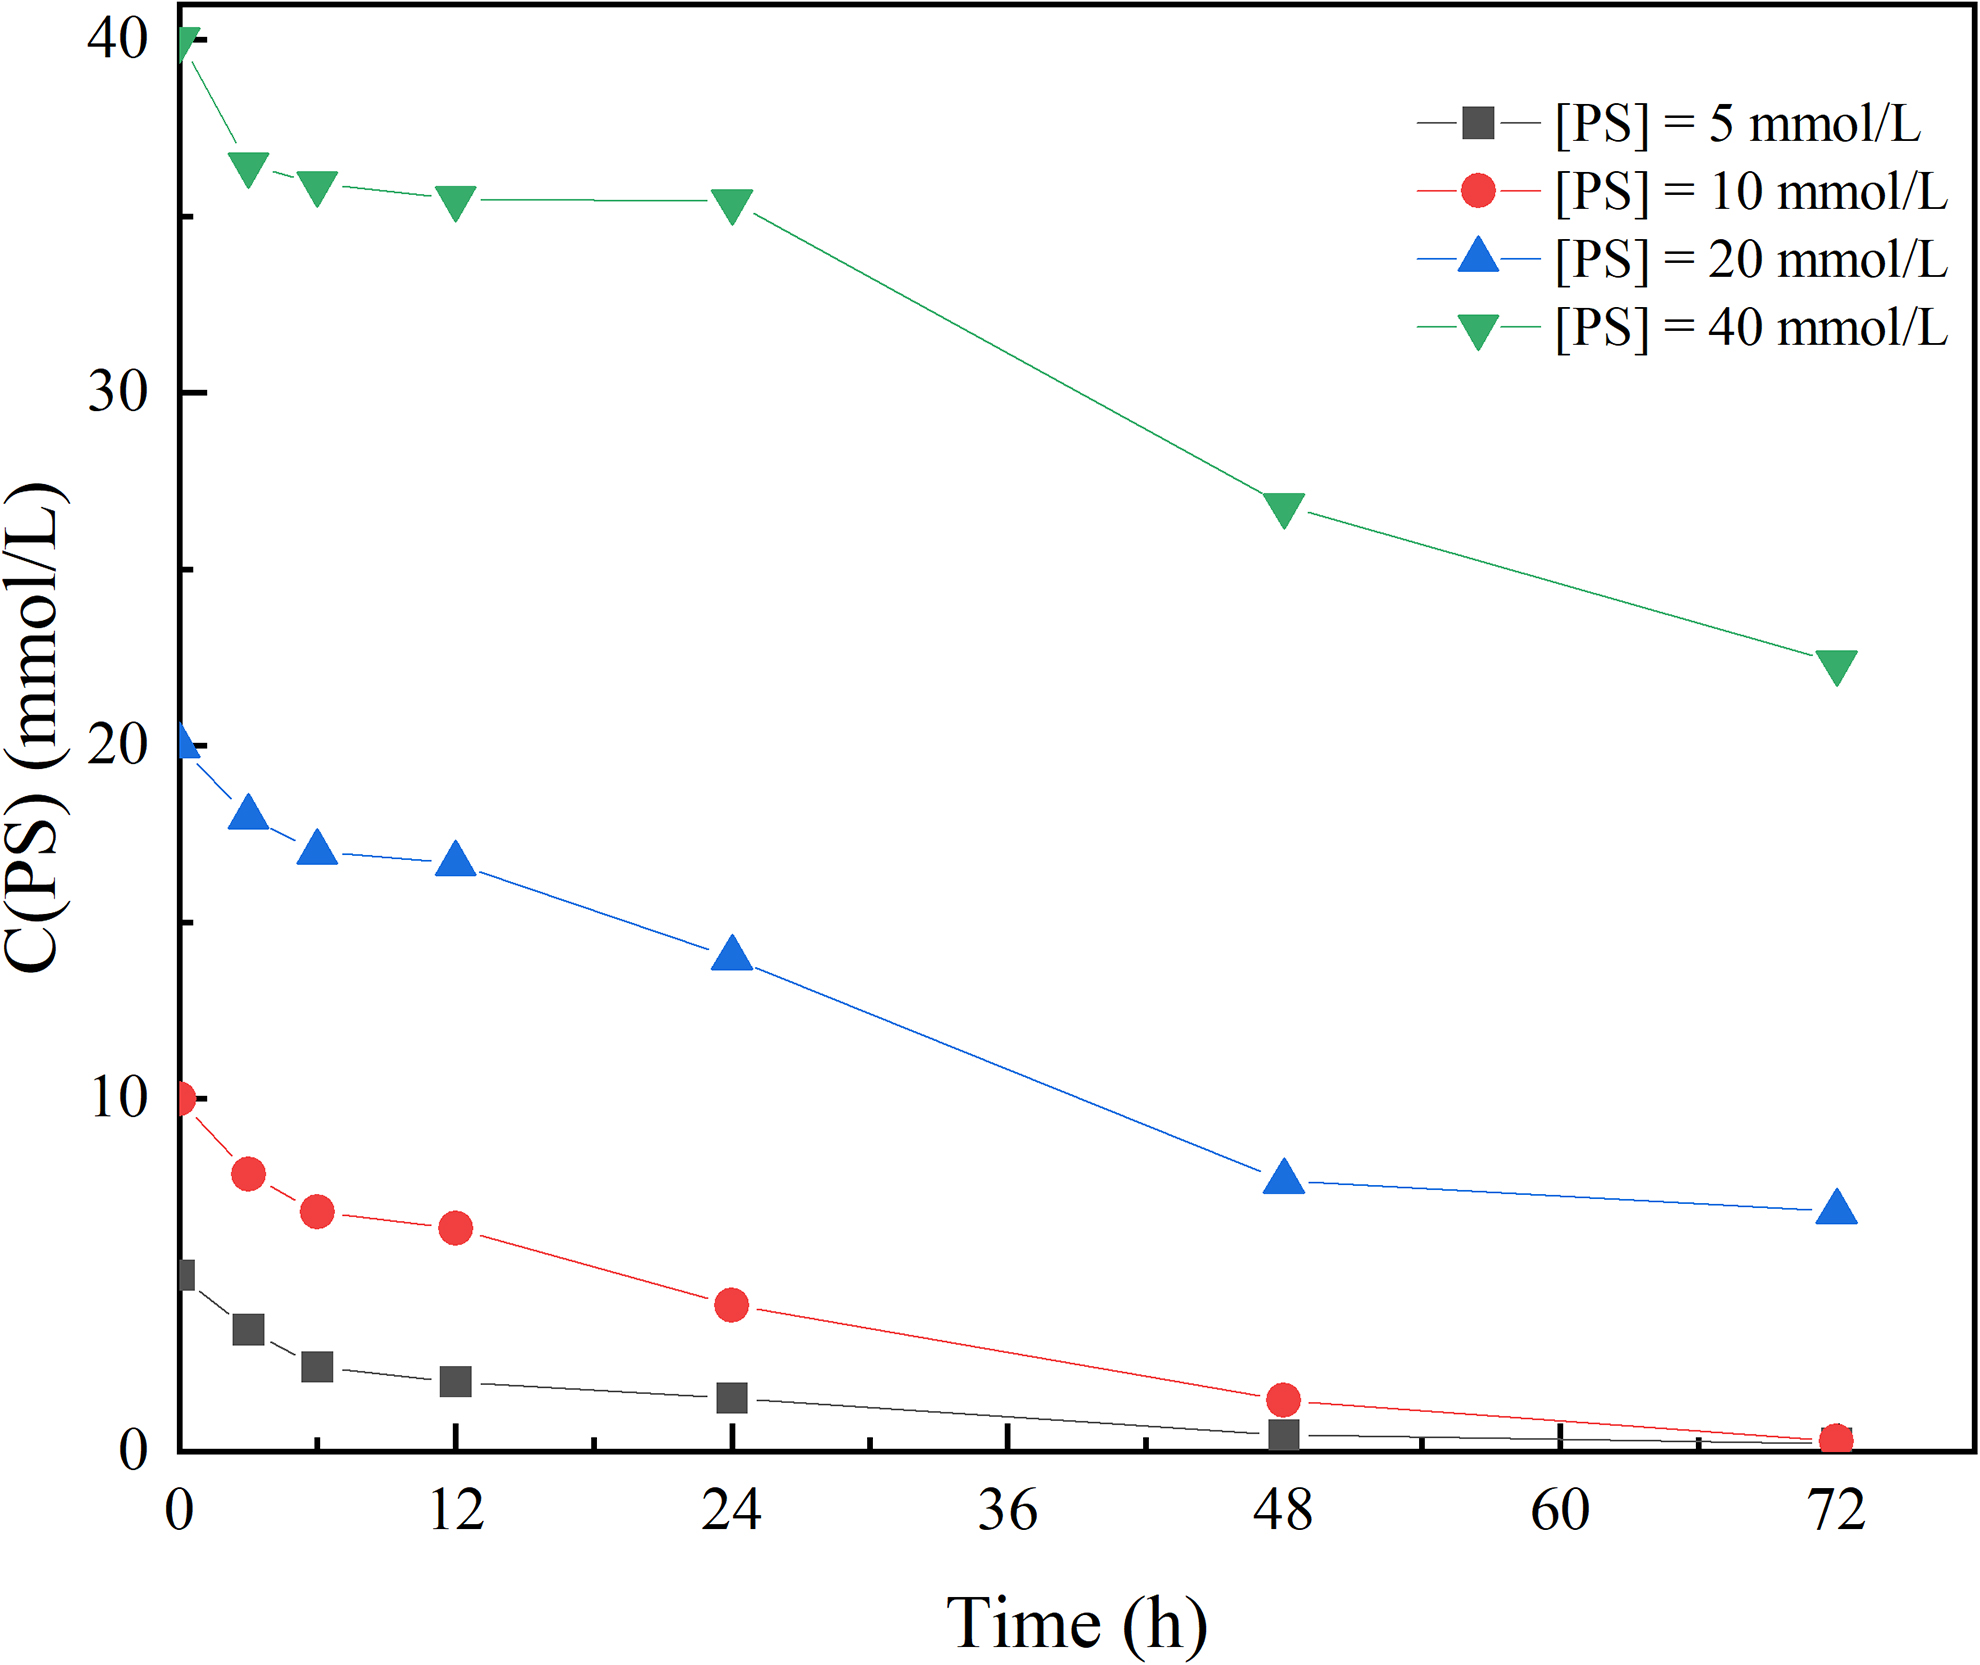
Variation in the PS concentration during the degradation of PHE ([PS]0 = 5–40 mM; [Fe2+]0 = 5 mM; [PHE]0 = 0.3 mM).
In addition, Fig. 3 shows that the decomposition rate of PS was relatively slow within 3–24 h and it then increased between 24 and 48 h, which may be attributed to the following reasons: (1) After the PS reaction, the concentration of H+ in the solution increases and the pH value decreases, which inhibits the hydrolysis and precipitation of Fe2+, slightly enhancing the concentration of Fe2+ in the solution, which increases the decomposition of PS (Supplementary Fig. S2); (2) quinones will be produced during the oxidation of PHE, which can promote the transformation of Fe3+ into Fe2+ and the increase in the concentration of Fe2+ promotes the decomposition of PS (Peluffo et al., 2016); and (3) the reaction of Fe3+ with S2O82− can also promote the conversion of Fe3+ to Fe2+, along with the generation of S2O8−
The oxidant efficiency (OE) was calculated based on Eq. (7) (Li et al., 2013; Gao et al., 2020).
where CPHE0 and CPHEt represent the concentration of PHE in the solution at t = 0 and t, respectively, and Oxidant0 and Oxidantt represent the concentration of oxidant in solution at t = 0 and t, respectively. The OE value presents the PHE removed per reacted oxidant.
A higher OE represents a higher oxidant consumption efficiency. When the Fe2+ concentration changes, the OE increases with time. After 72 h, the OE values observed at Fe2+ concentrations of 2.5 and 5 mM were the same and higher than those observed at Fe2+ concentrations of 10 and 20 mM (Supplementary Fig. S3a). When the concentration of PS was changed, the OE observed at low concentrations of PS was higher within 72 h. When 5 mM of PS was added, the OE increased with time. When the concentration of oxidant was ≥10 mM, the OE conversion time first increased and then decreased, reaching a maximum at 12 h (Supplementary Fig. S3b).
Therefore, considering the PHE removal rate and OE observed at the different PS and Fe2+ concentrations studied, we thought that the optimal combination was as follows: c(PS) = 10 mM, C(Fe2+) = 5 mM, n (Fe2+)/n (PS) = 1/2.
Identification of the active free radicals
SO4−
What is the dominant free radical in the Fe2+/PS system is controversial. Yu et al. (2018) reported that
However, SO4−
Figure 4 shows that the degradation of PHE was significantly inhibited on the addition of EtOH and TBA. After adding EtOH, the degradation rate of PHE was decreased to 19%, which was significantly lower than that of the control group (89%), indicating that 70% of PHE oxidation can be attributed to SO4−
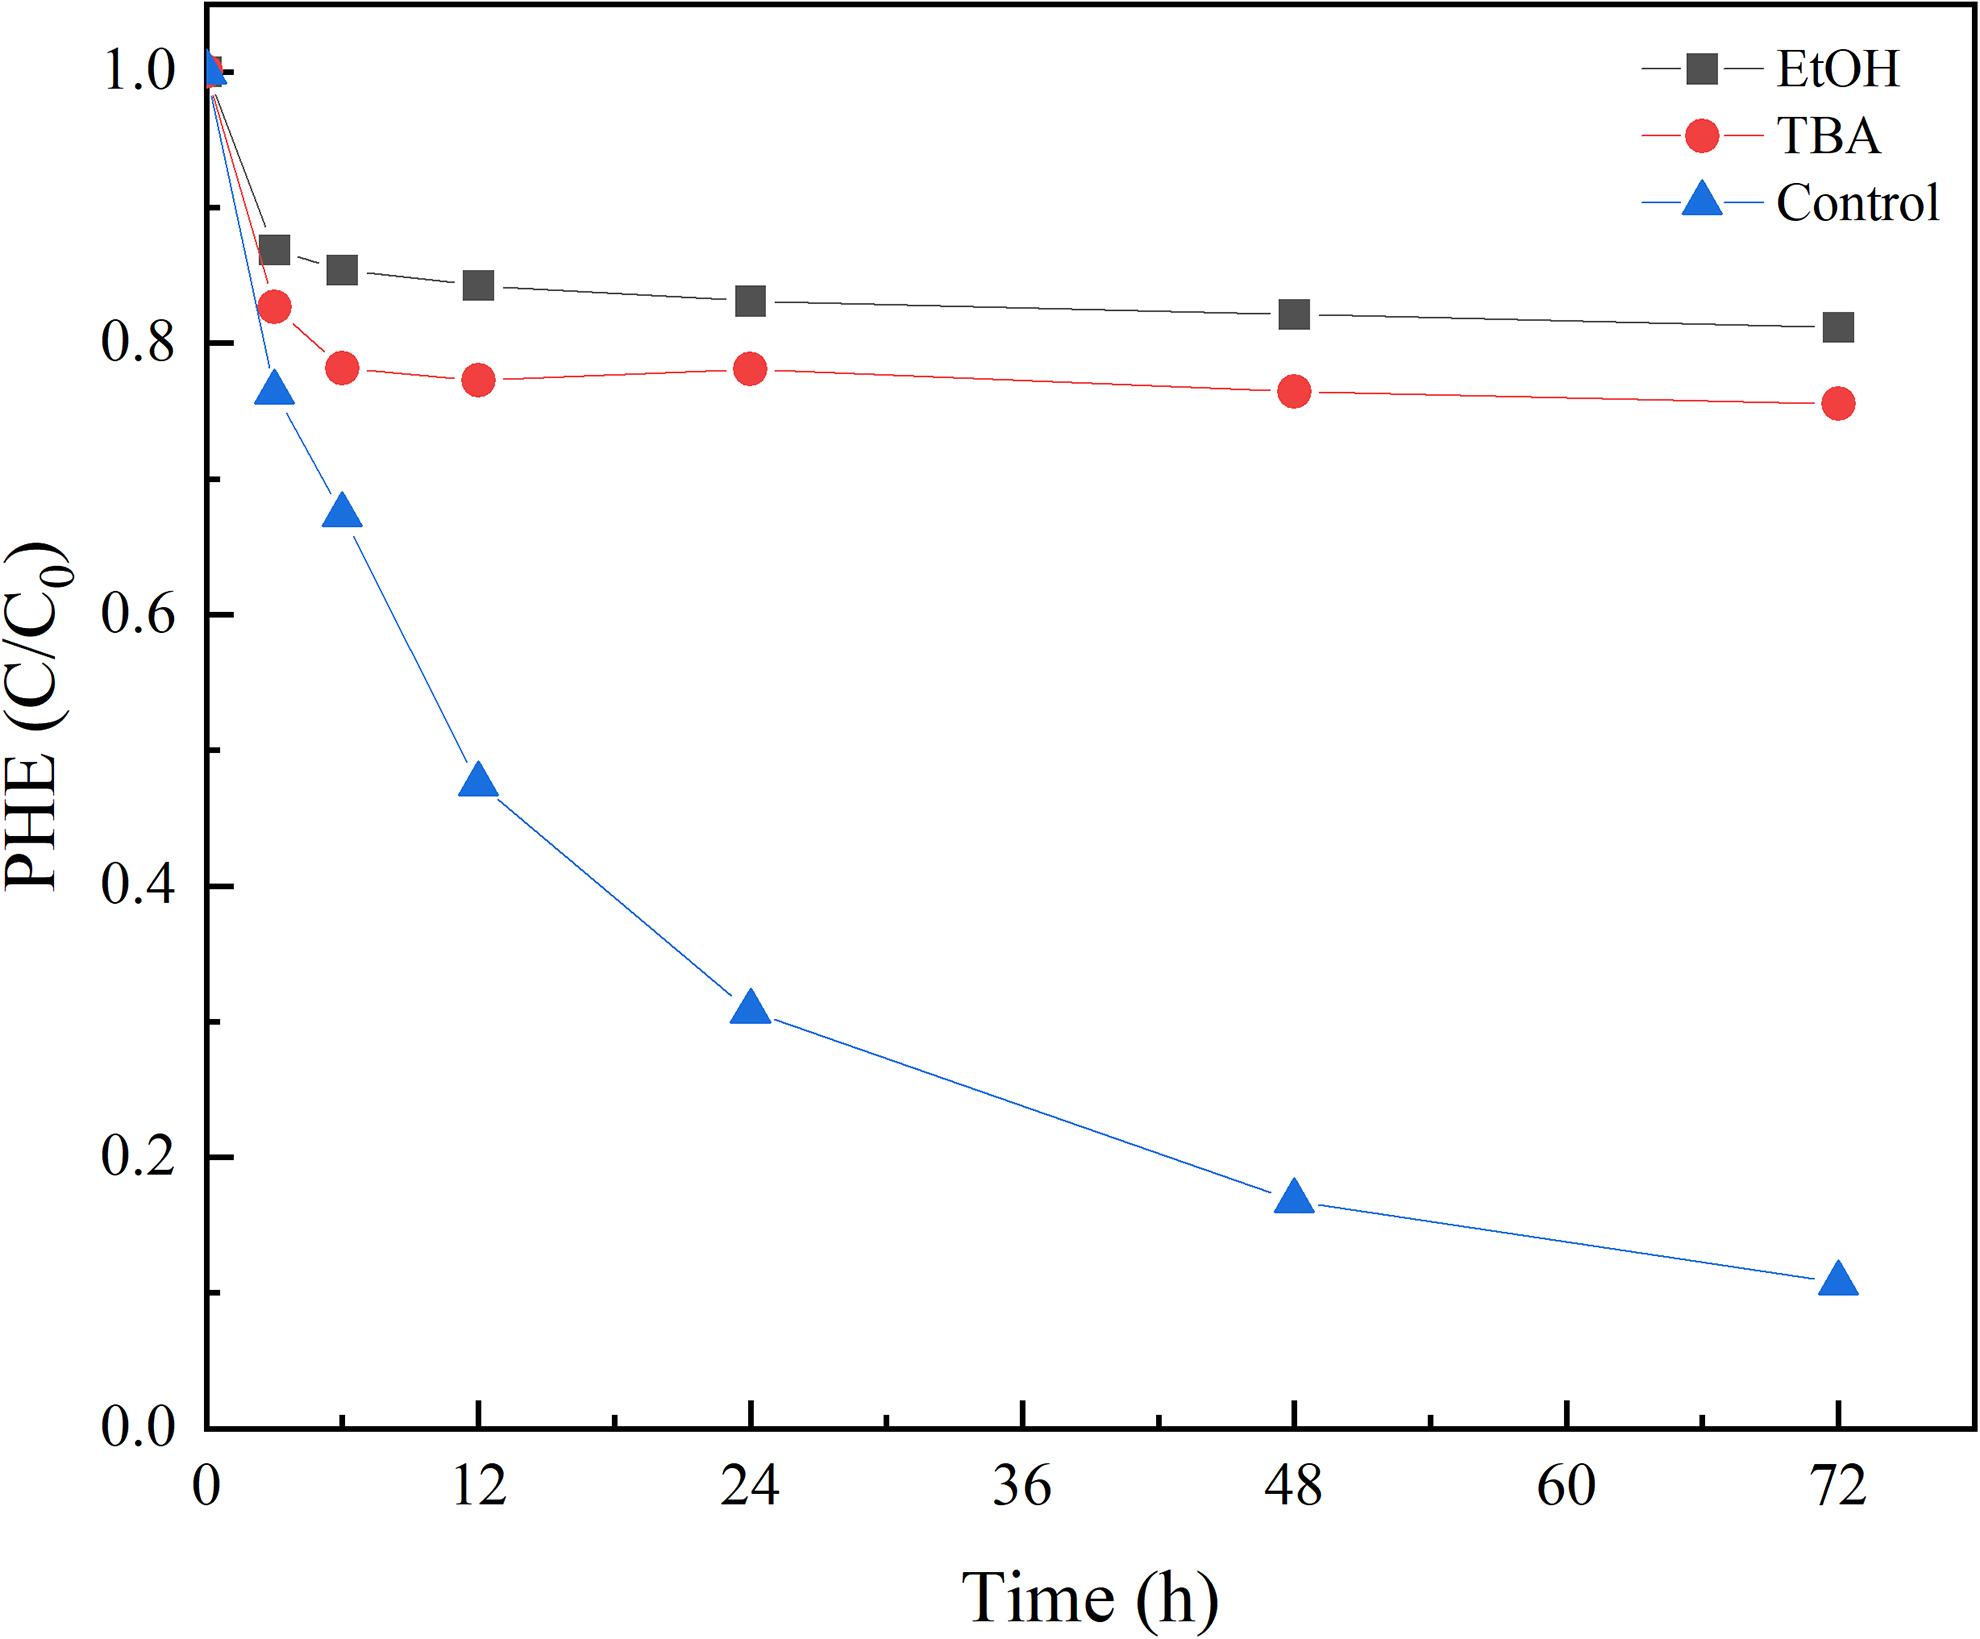
The effect of EtOH and TBA on the degradation of PHE ([PS]0 = 10 mM; [Fe2+]0 = 5 mM; [PHE]0 = 0.3 mM). EtOH, ethanol; TBA, tert-butyl alcohol.
DOC content
Under the action of PS, PHE produces a series of intermediate products until it is completely mineralized into CO2. Therefore, the DOC content in the solution reflects the mineralization of PHE. In addition, the DOC content can also reflect the bioavailability of PHE.
Figure 5 shows that in the absence of PS the DOC content in the solution was 1.13 mg·C/L. At this time, the DOC content in the solution was determined by the solubility of PHE and the initial DOC value was very close to the solubility of PHE in water (1.18 mg/L at 20°C). When PS was added, PHE was rapidly degraded to form a series of water-soluble oxygenated PAHs. The DOC content in the solution was determined based on the solubility of PHE and the amount of the oxidized intermediates.
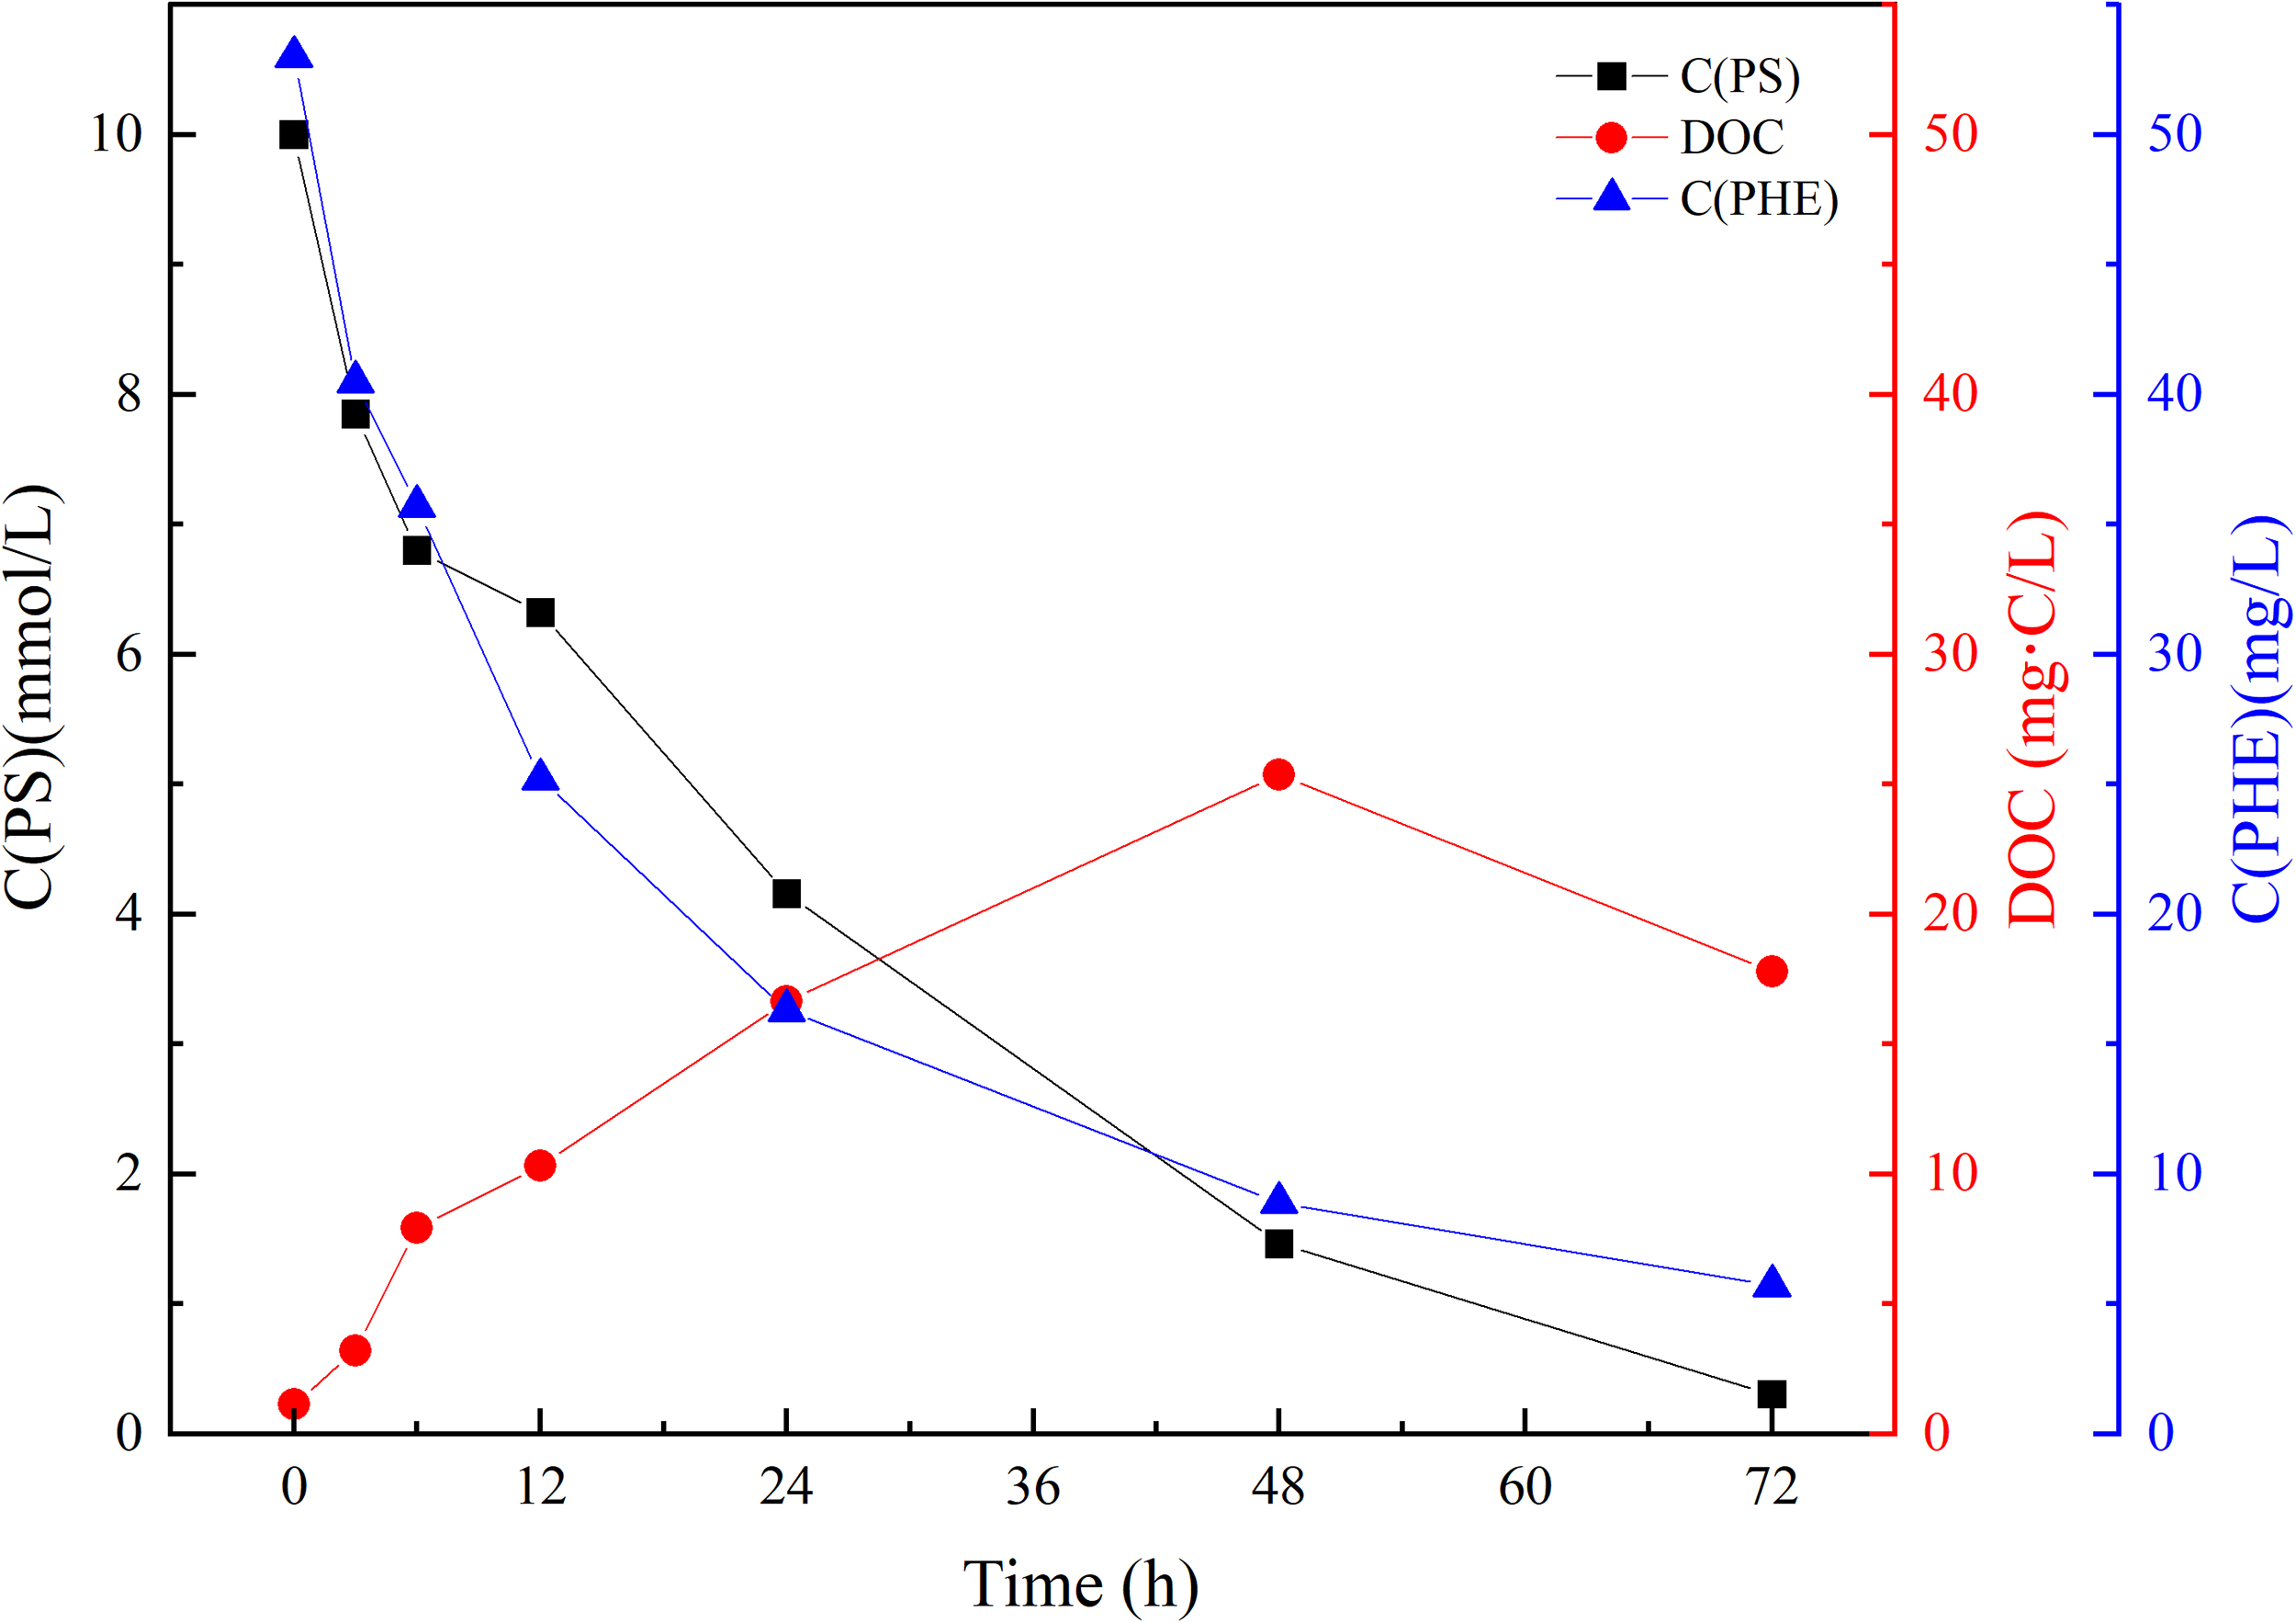
Changes in the residual concentration of PHE, DOC, and PS in the solution with time ([PS]0 = 10 mM; [Fe2+]0 = 5 mM; [PHE]0 = 0.3 mM). DOC, dissolved organic carbon.
During the initial stage of the reaction, the DOC content in the solution continuously increases. As the concentration of PS gradually decreased, the degradation rate of PHE decreased, and the growth rate of DOC gradually reduced. At 48 h, the DOC content reached a maximum value of 25.36 mg·C/L, indicating that the intermediate products were accumulated during the degradation process. After 48 h, the DOC content showed a decreasing trend, indicating that some organic matter in the solution was mineralized to CO2, but after 72 h of reaction (the PS residual content was <0.3 mM), the DOC content in the solution remained at 17.8 mg·C/L. At this time, the remaining concentration of PHE was 5.7 mg/L and theoretically, its corresponding DOC content was 5.38 mg·C/L.
If the effects of the oxidized intermediates (water-soluble organic matter) on the solubilization of PHE were not considered, the TOC in the system can be considered as the sum of the PHE organic carbon (5.38 mg·C/L) and DOC (17.8 mg·C/L), namely 23.18 mg·C/L. However, the measured DOC contains a small amount of dissolved PHE, which will cause the calculated TOC value to be larger. Therefore, according to Eq. (10), the calculated mineralization rate was slightly lower.
where TOC and TOC0 are the TOC content of the solution at the beginning and end of the reaction (mg·C/L). Based on the TOC, 0.3 mM of PHE in the initial solution corresponding to a TOC of 50.02 mg·C/L leads to a mineralization rate of PHE of 54%.
After 72 h of reaction, the removal rate of PHE reached 89%, but the mineralization rate was only 54%, which indicates that the free radicals mainly react with the parent compound (PHE), but less with its intermediate products. This is because (1) SO4−· can selectively oxidize π-electron non-aromatic compounds or aromatic compounds (Wang and Wang, 2018) and (2) when compared with PHE, the concentration of intermediate products is lower and the reaction rate of SO4−
Xu and Li (2010) showed that the removal rate of orange G reached 99% after 30 min, but the TOC removal rate reached 90% after 10 h. Liu et al. (2014) also reported that the removal rate of rhodamine reached 96% after 60 min, but the TOC only decreased by 34%. By comparing the removal rate and mineralization rate of pollutants in such studies, it was observed that SO4−
Identification of the oxidized intermediates of PHE
Depending on the change in the DOC content in the solution, PHE was not fully mineralized under the PS oxidation conditions and intermediate products were present in the solution. To further determine the type of intermediate products, the oxidized intermediates of PHE were qualitatively analyzed by using GC-MS. Figure 6 shows the mass spectra of the intermediate products of the PHE oxidation reaction. On comparison with the GC-MS standard library National Institute of Standards and Technology, it was found that the intermediate products mainly include anisole, 2-methylnaphthalene, and dibutyl phthalate. These intermediates are still slightly toxic, which can harm the parent molecule and the environment (Titaley et al., 2020; Wang et al., 2021).
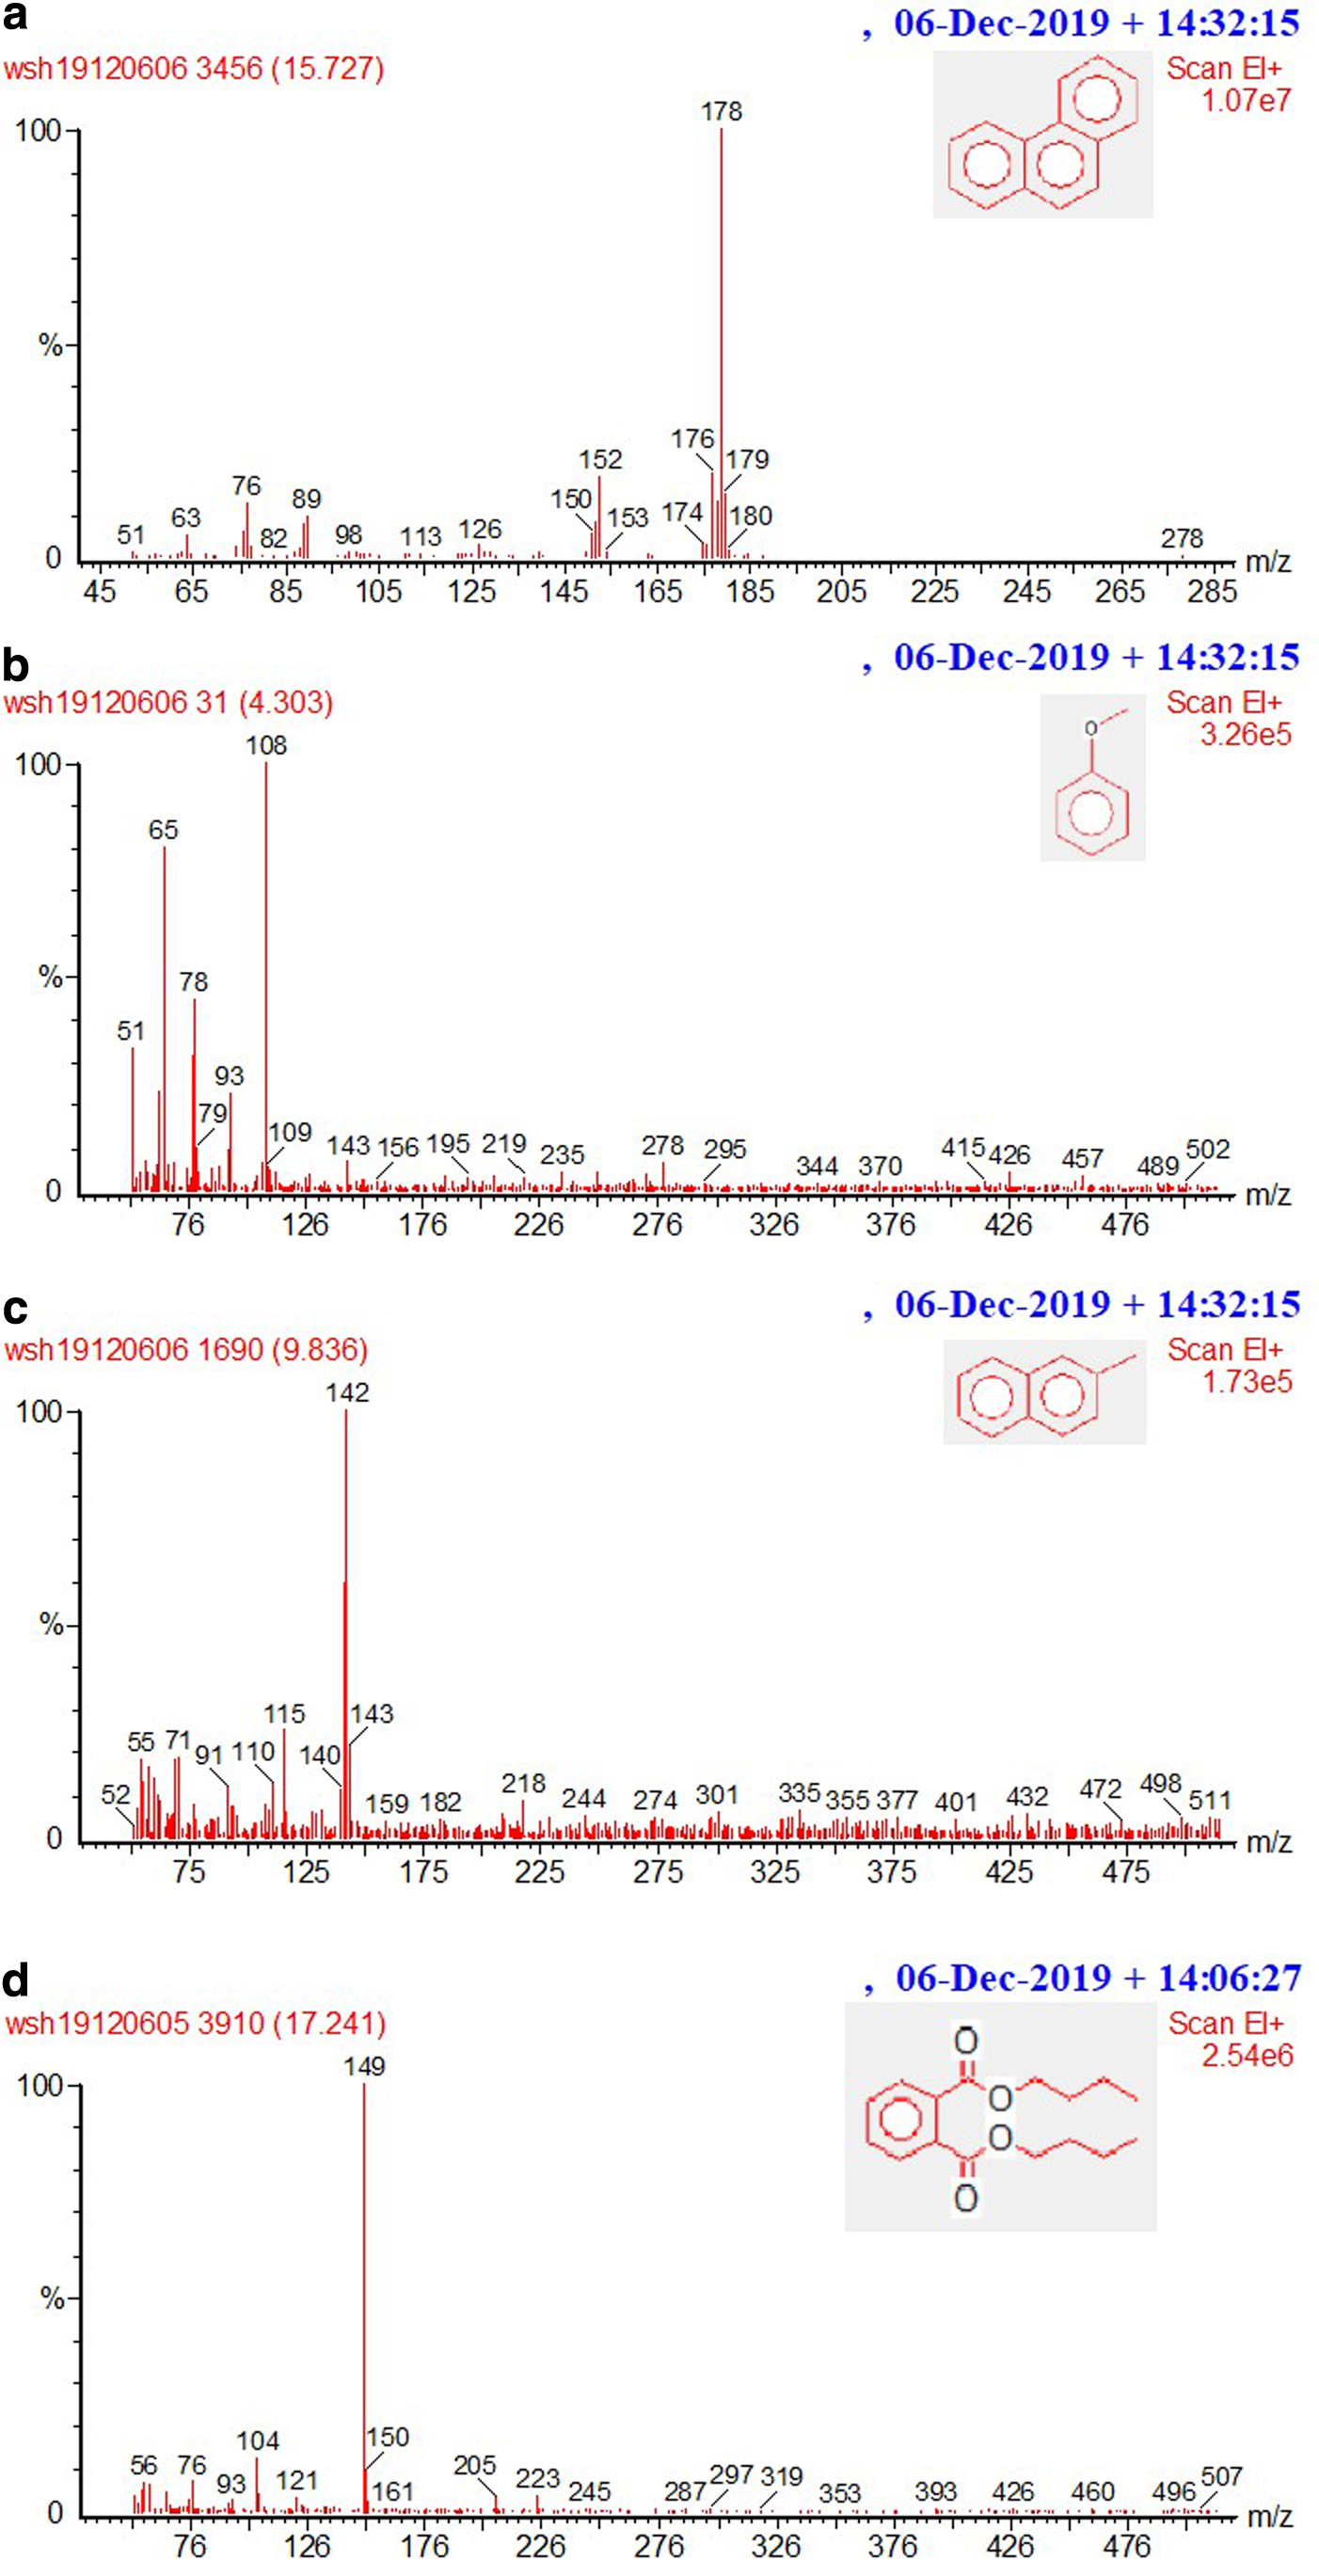
Mass spectra obtained for the oxidized intermediates formed during the degraction of PHE
Different oxidants have different mechanisms for the oxidization of PAHs and form different intermediate products, therefore the possible degradation pathway for PHE under the action of Fe2+/PS was proposed based on the intermediate products identified by using GC-MS. Wheland indicated that the electron distribution of PAHs determines the energy for separation of the π-electrons in the system and thus, determined the position with the strongest reactivity in the molecule (Kulik et al., 2006; Luo et al., 2019). Dewer's reactivity number (Nu) has been used to characterize the positioning energy; the smaller the value of Nu, the smaller the activation energy, and the greater the addition reaction rate.
For PHE, the reaction activity was higher at C9 and C10. Therefore, the C9 and C10 sites in the central ring of PHE are more vulnerable to attack during the oxidation reaction under the action of SO4−
Similarly, the C2 and C3 positions of PHE can be hydrogenated to produce 2,3-phenanthraquinone. Naphthoic acid is usually produced after the oxidation and ring opening of 2,3-phenanthraquinone. Therefore, it was speculated that the 2-methylnaphthalene identified in this experiment was linked to the formation of naphthoic acid. Afterward, these monocyclic or bicyclic substances undergo hydroxylation reactions, oxidization, and ring opening to generate small-molecule organic acids, which are mineralized into CO2 and H2O. Unfortunately, some of these products were not detected because of their instability and rapid conversion, or very low concentrations.
Conclusions
The degradation rate of PHE is significantly affected by changes in the concentrations of PS and Fe2+, but the degradation rate of PHE does not always increase on increasing the concentration of Fe2+ and PS. The final experimental results showed that when the initial concentration of PHE was 0.3 mM, c(PS) = 10 mM, and C(Fe2+) = 5 mM, the degradation rate of PHE was highest (89%), the mineralization rate was 54%, and the OE of PS was 5.49. Consequently, 32.64–36.48 mol of PS removed 1 mol of PHE. At different concentrations of PS and Fe2+, the degradation of PHE followed a pseudo-first-order kinetic model. The active free radicals have been identified by using molecular probe experiments. According to our experimental results, SO4−
Footnotes
Authors' Contributions
Y.S.: Conception and design of the work; Acquisition, analysis, and interpretation of data for the work; Drafting the work and revising it critically. J.Z.: Analysis and interpretation of data for the work; Revising it critically for important intellectual content. D.L.: Conception and design of the work; Interpretation of data for the work; Revising it critically for important intellectual content; Final approval of the version to be published. N.L.: Analysis and interpretation of data for the work. Y.L.: Acquisition of data for the work. Y.Z.: Acquisition of data for the work.
Author Disclosure Statement
No competing financial interests exist.
Funding Information
Financial support was received from the National Natural Science Foundation of China (No. 51974314, No. 51778612).
References
Supplementary Material
Please find the following supplemental material available below.
For Open Access articles published under a Creative Commons License, all supplemental material carries the same license as the article it is associated with.
For non-Open Access articles published, all supplemental material carries a non-exclusive license, and permission requests for re-use of supplemental material or any part of supplemental material shall be sent directly to the copyright owner as specified in the copyright notice associated with the article.