
Abstract
The Urban Heat Island (UHI) phenomenon can be harmful during the summer season jeopardizing the safety of some vulnerable population classes. Typically, the study of the UHI requires long data acquisitions using weather stations widely distributed within the cities. To this aim, recent research proposed multicriteria approaches aimed at quantifying the hazard of the summer absolute maximum Urban Heat Island Intensity (UHII), in urban districts. On the contrary, these approaches are time consuming and involve a large number of parameters. This article proposes a simplified multiparametric approach based on the three principal parameters involved in the UHI (albedo, greenery, and anthropogenic heat) obtained by a refined remote sensing data acquisition. In comparison with other approaches, the proposed method is simpler and quick to apply while maintaining good precision. Moreover, a calibration is achieved by exploiting the real absolute max UHII of a set of 41 European urban districts and a validation is obtained by a comparison with another multiparametric approach already validated in literature. Both the approaches are applied to 96 urban districts of Berlin. The results show that the simplified procedure keep an average error less than 1°C but improving in applicability.

Introduction
Over the past decades, global warming has been in the spotlight since it is threatening human well-being and environment health (McMichael et al., 2006; Singh and Purohit, 2014). However, just in the past few years, it has been noted that overheating consequences can be exacerbated or mitigated by human activities (Weng et al., 2004; Al-Ghussain, 2019). Indeed, it has been amply demonstrated that anthropogenic actions altered natural land covers that directly affects the albedo, heat conductivity, and moisture of a specific zone (Apollonio et al., 2016; Capolupo et al., 2018; Boccia et al., 2020), causing the increment or the decrement of air and surface temperatures in such area. Specifically, the phenomenon of the Urban Heat Island (UHI), regarding higher air temperatures within urban districts compared with the surrounding rural environments, raised concern in the scientific world (Santamouris, 2020). In the related literature, the parameters influencing the Urban Heat Island Intensity (UHII) have been widely studied (Oke, 1991) and identified in the following: (1) meteorological variables; (2) urban morphological features; (3) building materials; (4) anthropogenic heat; and (5) city canyons. The detection of the main triggering factors and the prediction of the phenomenon are essential to identify the optimal strategies to be adopted to contrast their main effects on human well-being and comfort, such as the increase in mortality rate (Pantavou et al., 2011) and cardiovascular illness (Heaviside et al., 2016), and, to reduce cooling energy consumption during summertime (Santamouris, 2015).
Conventionally, to measure the UHII in situ, automatic weather stations are required (Oke et al., 2017). Anyway, this information is not always available because weather stations are patchy distributed within the cities and, consequently, large areas may be without coverage. To overcome this constraint, numerical simulations-based approaches, which simultaneously include several parameters (e.g., meteorological data, urban surface characteristics, and climate conditions), may be adopted. Nevertheless, also numerical simulations have limitations because the numerous input parameters of the models need to be measured or estimated (Cantelli et al., 2015).
To this aim, a recent research proposed a new multiparametric index IUHII aimed at quantifying the hazard of the absolute maximum UHII in urban districts during the summer season by taking into account all the parameters influencing the phenomenon based on open-source data (Sangiorgio et al., 2020). This IUHII is based on 11 parameters including meteorological variables, characteristics of the city, anthropogenic heat, and city canyons. The advantage in comparison with the other approaches is the possibility to consider numerous qualitative and quantitative aspects in the analysis, involving a multicriteria-based procedure for the calibration. In this approach, fundamental parameters such as albedo and greenery are evaluated by an image analysis, which breaks down satellite image to individuate urban district materials (asphalt, water, white plaster, red brick, etc.) and presence of greenery. On the contrary, the existing index-based approaches are time consuming and based on manual and slow calculations.
A widely used effective and fast approach to extract albedo and greenery is offered by remote sensing (RS) techniques. In the related literature, RS tools have been recognized as the most effective instrument to compute the urban surface characteristics contributing to UHI phenomenon (Chen et al., 2006; Mirzaei et al., 2020). In recent years, specific algorithms have been defined to compute the albedo from each satellite mission (Caprioli and Tarantino, 2001; Tarantino and Figorito, 2012; Sarzana et al., 2020). In addition, the use of RS techniques allows to overcome time-consuming analysis by processing a large amount of geospatial information and using cloud-based platforms handling geo-big data at large scale. Among them, Google Earth Engine (GEE), recently released by Google to process RS data, is a cloud free environment that enables parallelized processing of a huge amount of information belonging to various data sources (Gorelick et al., 2017). In addition, its excellent computational power, owing to the application of many processors, minimizes sensed data processing time. Thus, GEE has strongly improved the RS world to evaluate albedo and greenery on a large scale.
This article proposes a simplified index to evaluate the absolute maximum UHII by combining the multicriteria approach (Sangiorgio et al., 2020) with RS techniques to obtain a fast and easy procedure (Caprioli and Tarantino, 2001; Tarantino and Figorito, 2012; Sarzana et al., 2020). The index is evaluated considering the three most important parameters in the UHII generation: albedo, greenery, and anthropogenic heat. The resulting approach allows large-scale data acquisition exploiting cloud-based platforms and large-scale geo-big data analysis to identify albedo and greenery in urban districts (Chen et al., 2006; Wang et al., 2008; Mirzaei et al., 2020). In comparison with previous studies, the main novelty of such approach regards a significant increase in usefulness and applicability of the new index, thanks to the synergy of a multiparametric approach with geo-big data analysis (that allows examining 100 processors in parallel). In addition, the proposed index maintains high accuracy even if it is simplified in comparison with approaches that contemplate numerous parameters.
The article is organized as follows. Overview of the Methodological Approach to Achieve the Index section proposes an overview of the methodological approach and The Definition of the Index and Data Acquisition Process section presents the simplified index and the RS data acquisition procedure. Moreover, Calibration section shows the calibration of the Index and Application and Comparison section shows its application and comparison. Finally, Conclusions section draws conclusions of this research work.
Overview of the Methodological Approach to Achieve the Index
This research is achieved in two phases (Fig. 1): (1) the calibration of the proposed index; and (2) the application and validation of the index performed by comparison with the multiparametric index IUHII of Sangiorgio et al. (2020).

The two phases of the proposed methodology to define, calibrate, and compare the proposed index.
In the first phase, the proposed index is calibrated. In this phase an analytic hierarchy process (AHP) is used to analyze and structure the problem in its basic components (macrocriteria, criteria, and intensity ranges) and define the index. Successively, data acquisition is performed to acquire albedo, greenery, and anthropogenic heat through an RS approach. Once the dataset is realized, an optimization procedure (Sangiorgio et al., 2019; Sangiorgio and Parisi, 2020) is used to calibrate the index exploiting the effective UHII data acquired in 41 urban districts of 32 different European cities (obtained from an exhaustive bibliographic analysis). In addition, the calibration exploits a Jackknife approach to perform a resampling of the input data and achieve a statistical graph of the absolute and relative error of the Index.
In the second phase, both the proposed simplified indices exploiting the RS tools and the multiparametric index of Sangiorgio et al. (2020) are applied to 96 urban districts of Berlin. A comparison is carried out by evaluating the differences of the forecasted absolute max UHII for every urban district using different approaches. In addition, the effectiveness of the proposed calibration is tested with both the satellite data from Landsat 5 and Landsat 8.
Definition of the Index and Data Acquisition Process
In this section, the index is defined and discussed using the AHP. In addition, the proposed data acquisition procedure to include RS tools in the index evaluation is described in detail. In particular, a specific focus in this work is dedicated to data acquisition of the Characteristics of the City in terms of Albedo and Greenery with a satellite image analysis.
The AHP to define the index
The proposed index is based on two macrocriteria and three criteria i (with i = 1,…,3) that are the principal parameters involved in the generation of the absolute max UHII (Sangiorgio et al., 2020). For each criterion, a set of intensity ranges j (with j = 1, …, ni) is defined to characterize its intensity levels. The three criteria and related intensity ranges are structured in a hierarchical flowchart as given in Fig. 2 and described in the following.
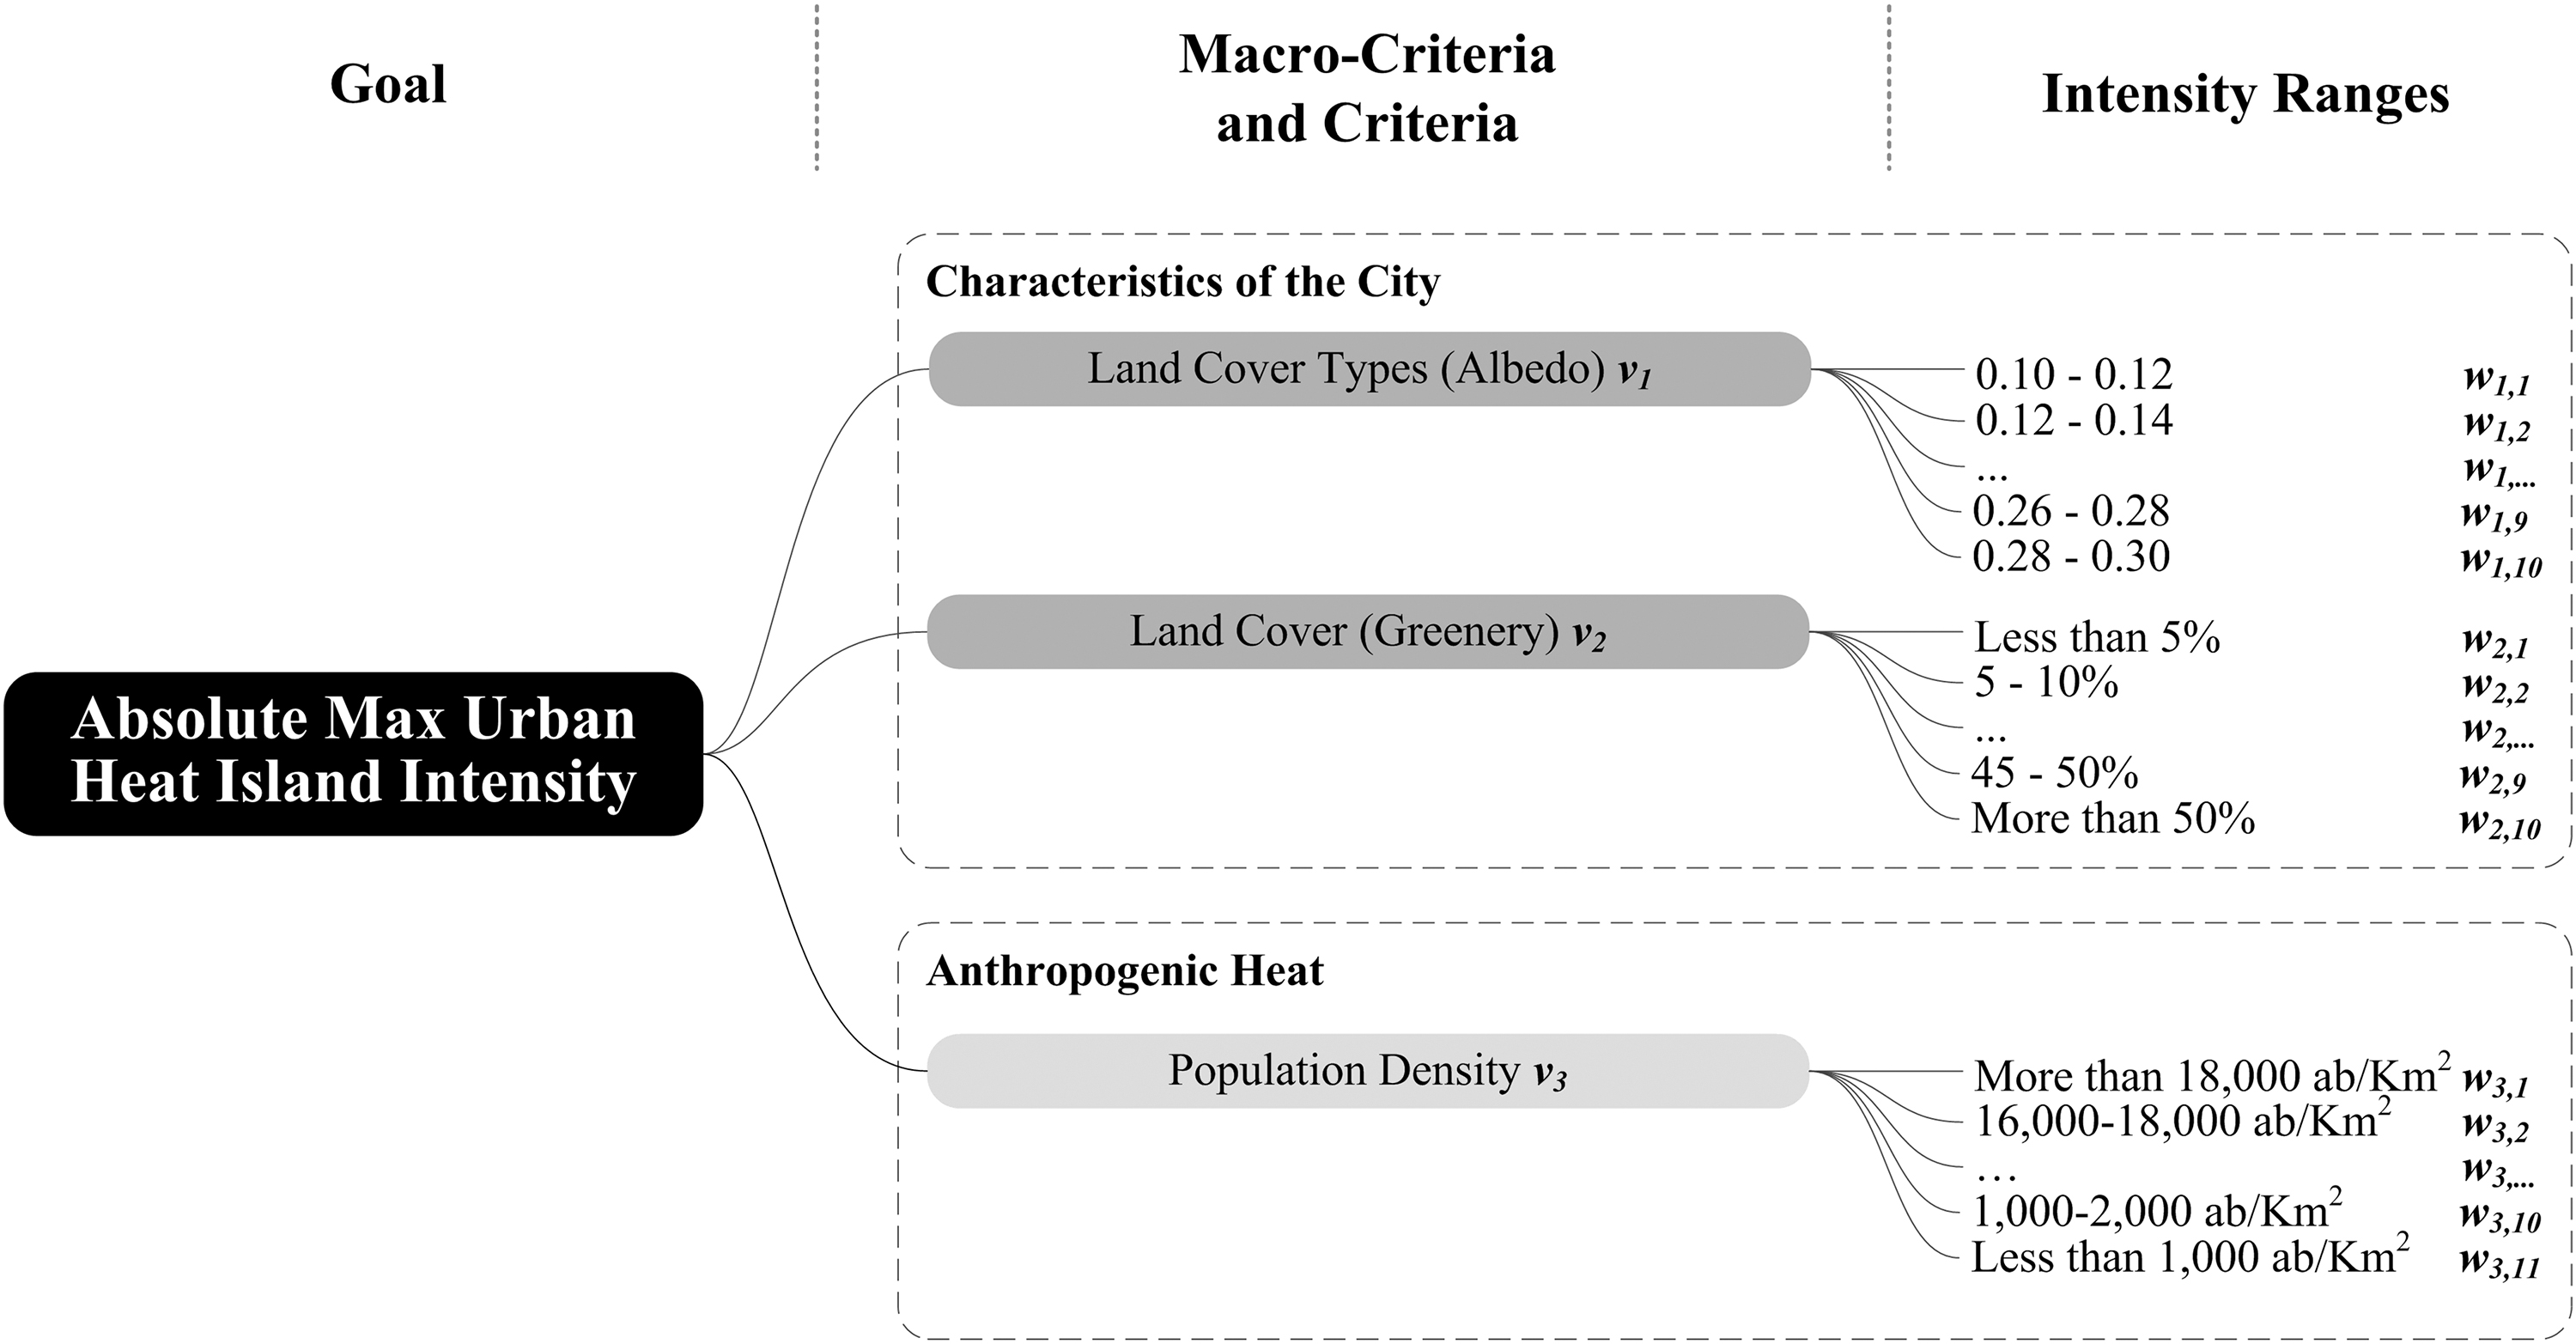
Structure of the problem: weight criteria and intensity ranges to define the index able to quantify the potential absolute max UHII in urban district (Sangiorgio et al., 2020). UHII, Urban Heat Island Intensity.
The first macrocriterion regards the Characteristics of the City in the UHII accounting the first and second criteria:
Land Cover Types (Albedo) (i = 1) including 10 intensity ranges (n1 = 10); Land Cover (Greenery) (i = 2) to consider the phenomenon of evapotranspiration through 10 ranges (n2 = 10). The other macrocriterion is the anthropogenic heat. The anthropogenic heat can be evaluated by considering the linear dependence between anthropogenic heat and population density according to Merkin (2004): Population Density (i = 3) including 11 related ranges (n3 = 11).
Once the criteria are defined, the simplified index (
where vi and wij are the weights associated to the criterion i and to the intensity ranges j, respectively.
Note that the relation between every single intensity ranges and the associate weights wij in the UHII development have already been investigated in literature (Sangiorgio et al., 2020). Such relation remains valid also for the proposed RS-based index because the obtained values of weights do not depend on the data acquisition procedure. The weights wij are given in Table 1.
Tabulated Weight Obtained by Applying Analytic Hierarchy Processes Step 2
However, the weight vi representing the influence of every parameter in the phenomenon needs to be calibrated to get the simplified index.
Data acquisition
This section explains the process of data acquisition that is used for calibration in the Calibration section. To perform the calibration, this work exploits and reports the effective UHII data acquired for 41 urban districts of 35 different cities in the European continent.
In addition, characteristics of the city and anthropogenic heat data are extracted for the 41 investigated urban districts.
UHII extraction from bibliographic analysis
This study exploits published experimental data (acquired with fixed weather stations) on the max UHI magnitude of 35 different cities in 11 different countries of the European continent. The obtained data of specific urban districts, related geographic coordinates, and related UHII measured are given in Fig. 3. For every urban district, a specific identification code Ud = 1,…,41 is assigned. In particular, the acquired information is collected from 15 scientific articles published in peer review journals, books, and research reports as reported in the following: Russia (Varentsov et al., 2018), the Netherlands (Van Hove et al., 2011), Italy (Petralli et al., 2006; Giovannini et al., 2011; Busato et al., 2014; Milelli, 2016; Guattari et al., 2018; Marando et al., 2019), United Kingdom (Kolokotroni and Giridharan, 2008), Spain (Santamouris, 2016), Scotland (Krüger and Emmanuel, 2013), Turkey (Tayanc and Toros, 1997), Romania (Cheval et al., 2009) Poland (Fortuniak et al., 2006), and France (Lemonsu and Masson, 2002).
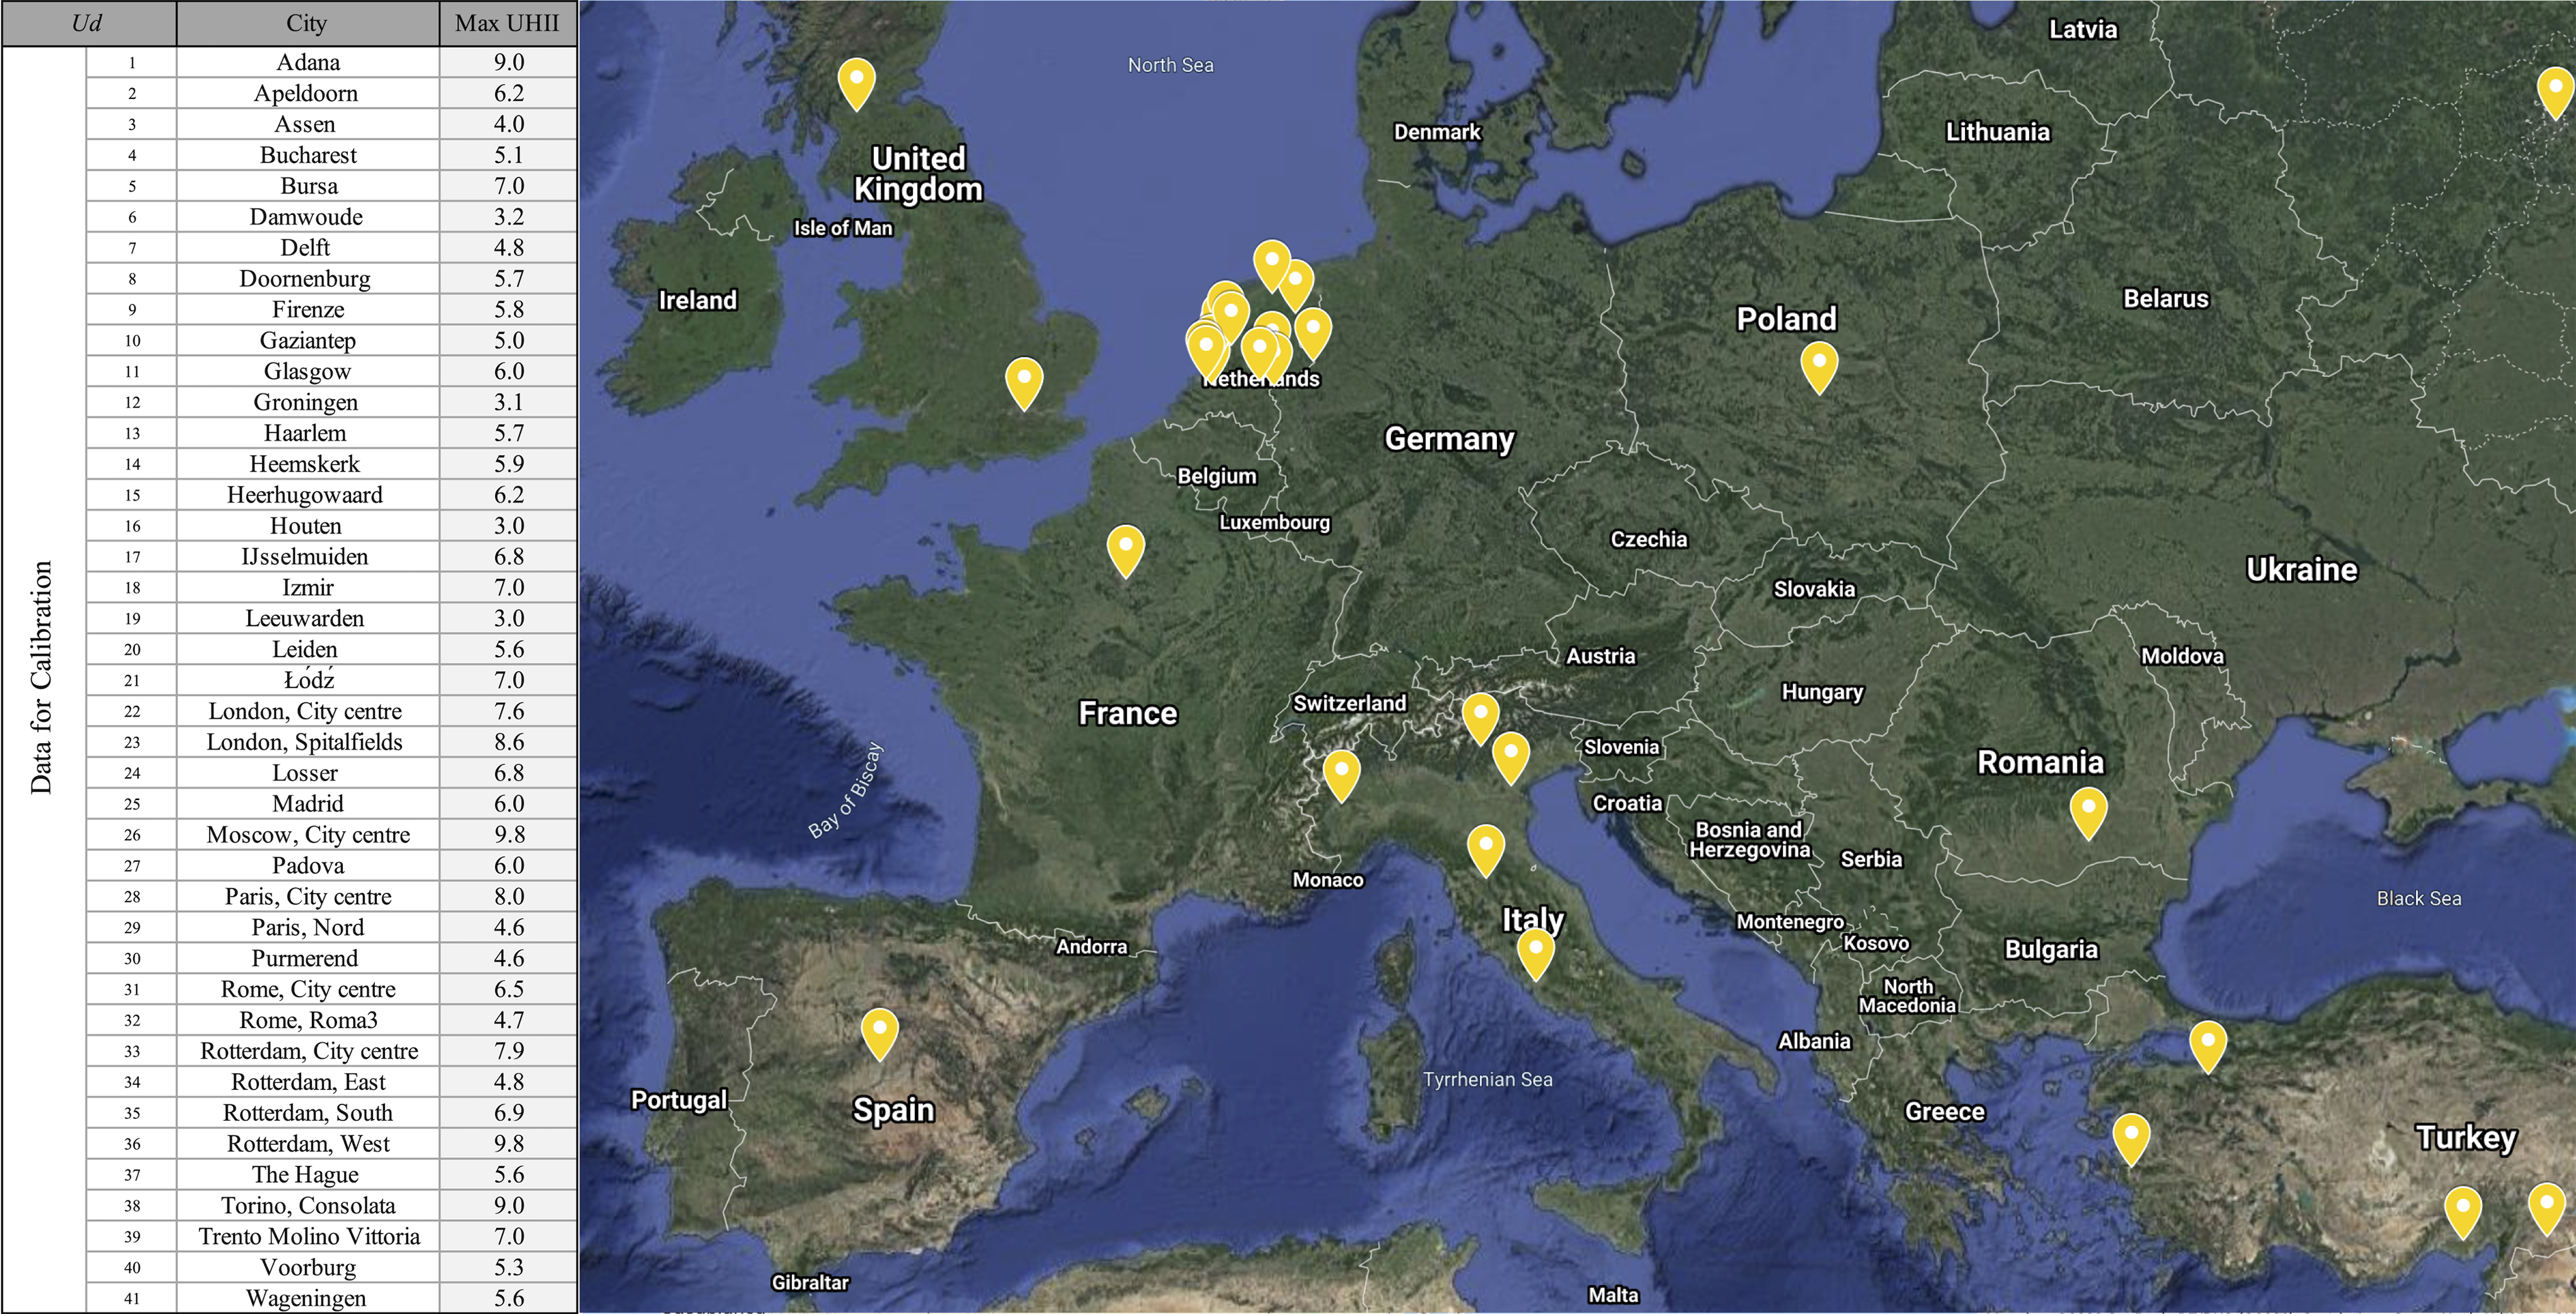
UHIIs extracted from a literature review.
Characteristics of the city—satellite image analysis approach
This subsection describes in detail the RS approach used to individuate data albedo and greenery in the investigated urban districts by analyzing an area within 500 m from the relative weather stations. This analysis is carried out by following four steps: (i) construction of the Landsat images and database and exploiting Landsat mission; (ii) adoption of a cloud masking procedure to exclude the cloud pixels from the analysis; (iii) calculation of greenery; and (iv) calculation of albedo. Note that all the four steps are implemented in GEE environment through JavaScript API.
(i) The first step consists of extract Landsat images of the 41 urban districts. In particular, Landsat mission 5 provides data of 39 urban districts, whereas data regarding the remaining 2 districts are extracted from Landsat mission 8. Table 2 shows for every urban district, the obtained information including Landsat Mission, Acquisition period, Sensor Type, Data ID, and Cloud Cover (%) at the time of acquisition. All collected images are provided in the Universal Transverse Mercator projection and the World Geodetic System (WGS84) datum. In particular, the considered acquisition period for the RS data is consistent with the effective UHII data obtained for the investigated 41 urban districts. The processing phase is implemented directly in the GEE platform speeding up the overall data acquisition procedure (Gorelick et al., 2017). Indeed, in such cloud-based platforms, handling geo-big data, it is possible to download both raw and preprocessed data by drastically reducing the processing time (Kumar and Mutanga, 2018).
Selected Landsat Data Description
OLI, Operational Land Imager; TIRS, Thermal Infrared Sensors; TM, Thematic Mapper.
(ii) Once the database is constructed, cloud masking procedure is carried out by adopting proper filters suitable for making the clouds transparent and excluding the corresponding pixels during the processing phase. To meet such purpose, the methodology proposed by Mateo-Garcia et al. (2018), based on the information provided by the quality assessment band, is applied. No additional orthorectification steps need to be applied because the accuracy provided by the process is considered satisfactory. This implies that the further processing steps (Greenery and Albedo evaluation) are directly calculated on images resultant from cloud cover masking procedure.
(iii) Green areas percentage (Greenery) can be quickly extracted by applying the vegetation indices (VIs) approach. Indeed, as suggested by Anchang et al. (2016), it is the most efficient classification method to handle a large volume of geospatial data and to extract greenery at large scale. Among the several VIs, the SwirTirRed index (STRed index) (Capolupo et al., 2020a, 2020c) is applied because it is considered one of the most efficient and effective index as demonstrated in Capolupo et al. (2020b). STRed index is implemented in GEE environment according to the following Equation (2):
where SWIR1 is the short wavelength infrared with wavelength in the range 1.57–1.65, R is the red band, and TIR1 is the thermal infrared band.
(iv) The last RS step consists of the albedo evaluation for each urban district. This evaluation is obtained by programming a proper code in the GEE platform and exploiting the following equation proposed by Allen et al. (2002) [Eq. (3)]:
where B, R, and NIR are the blue, red, and near infraRed bands, respectively, and SWIR2 is the short wavelength infrared with wavelength in the range 2.11–2.29. In addition, note that Top of Atmosphere corrected bands is used. To sum up, the RS approach is given in Fig. 4.
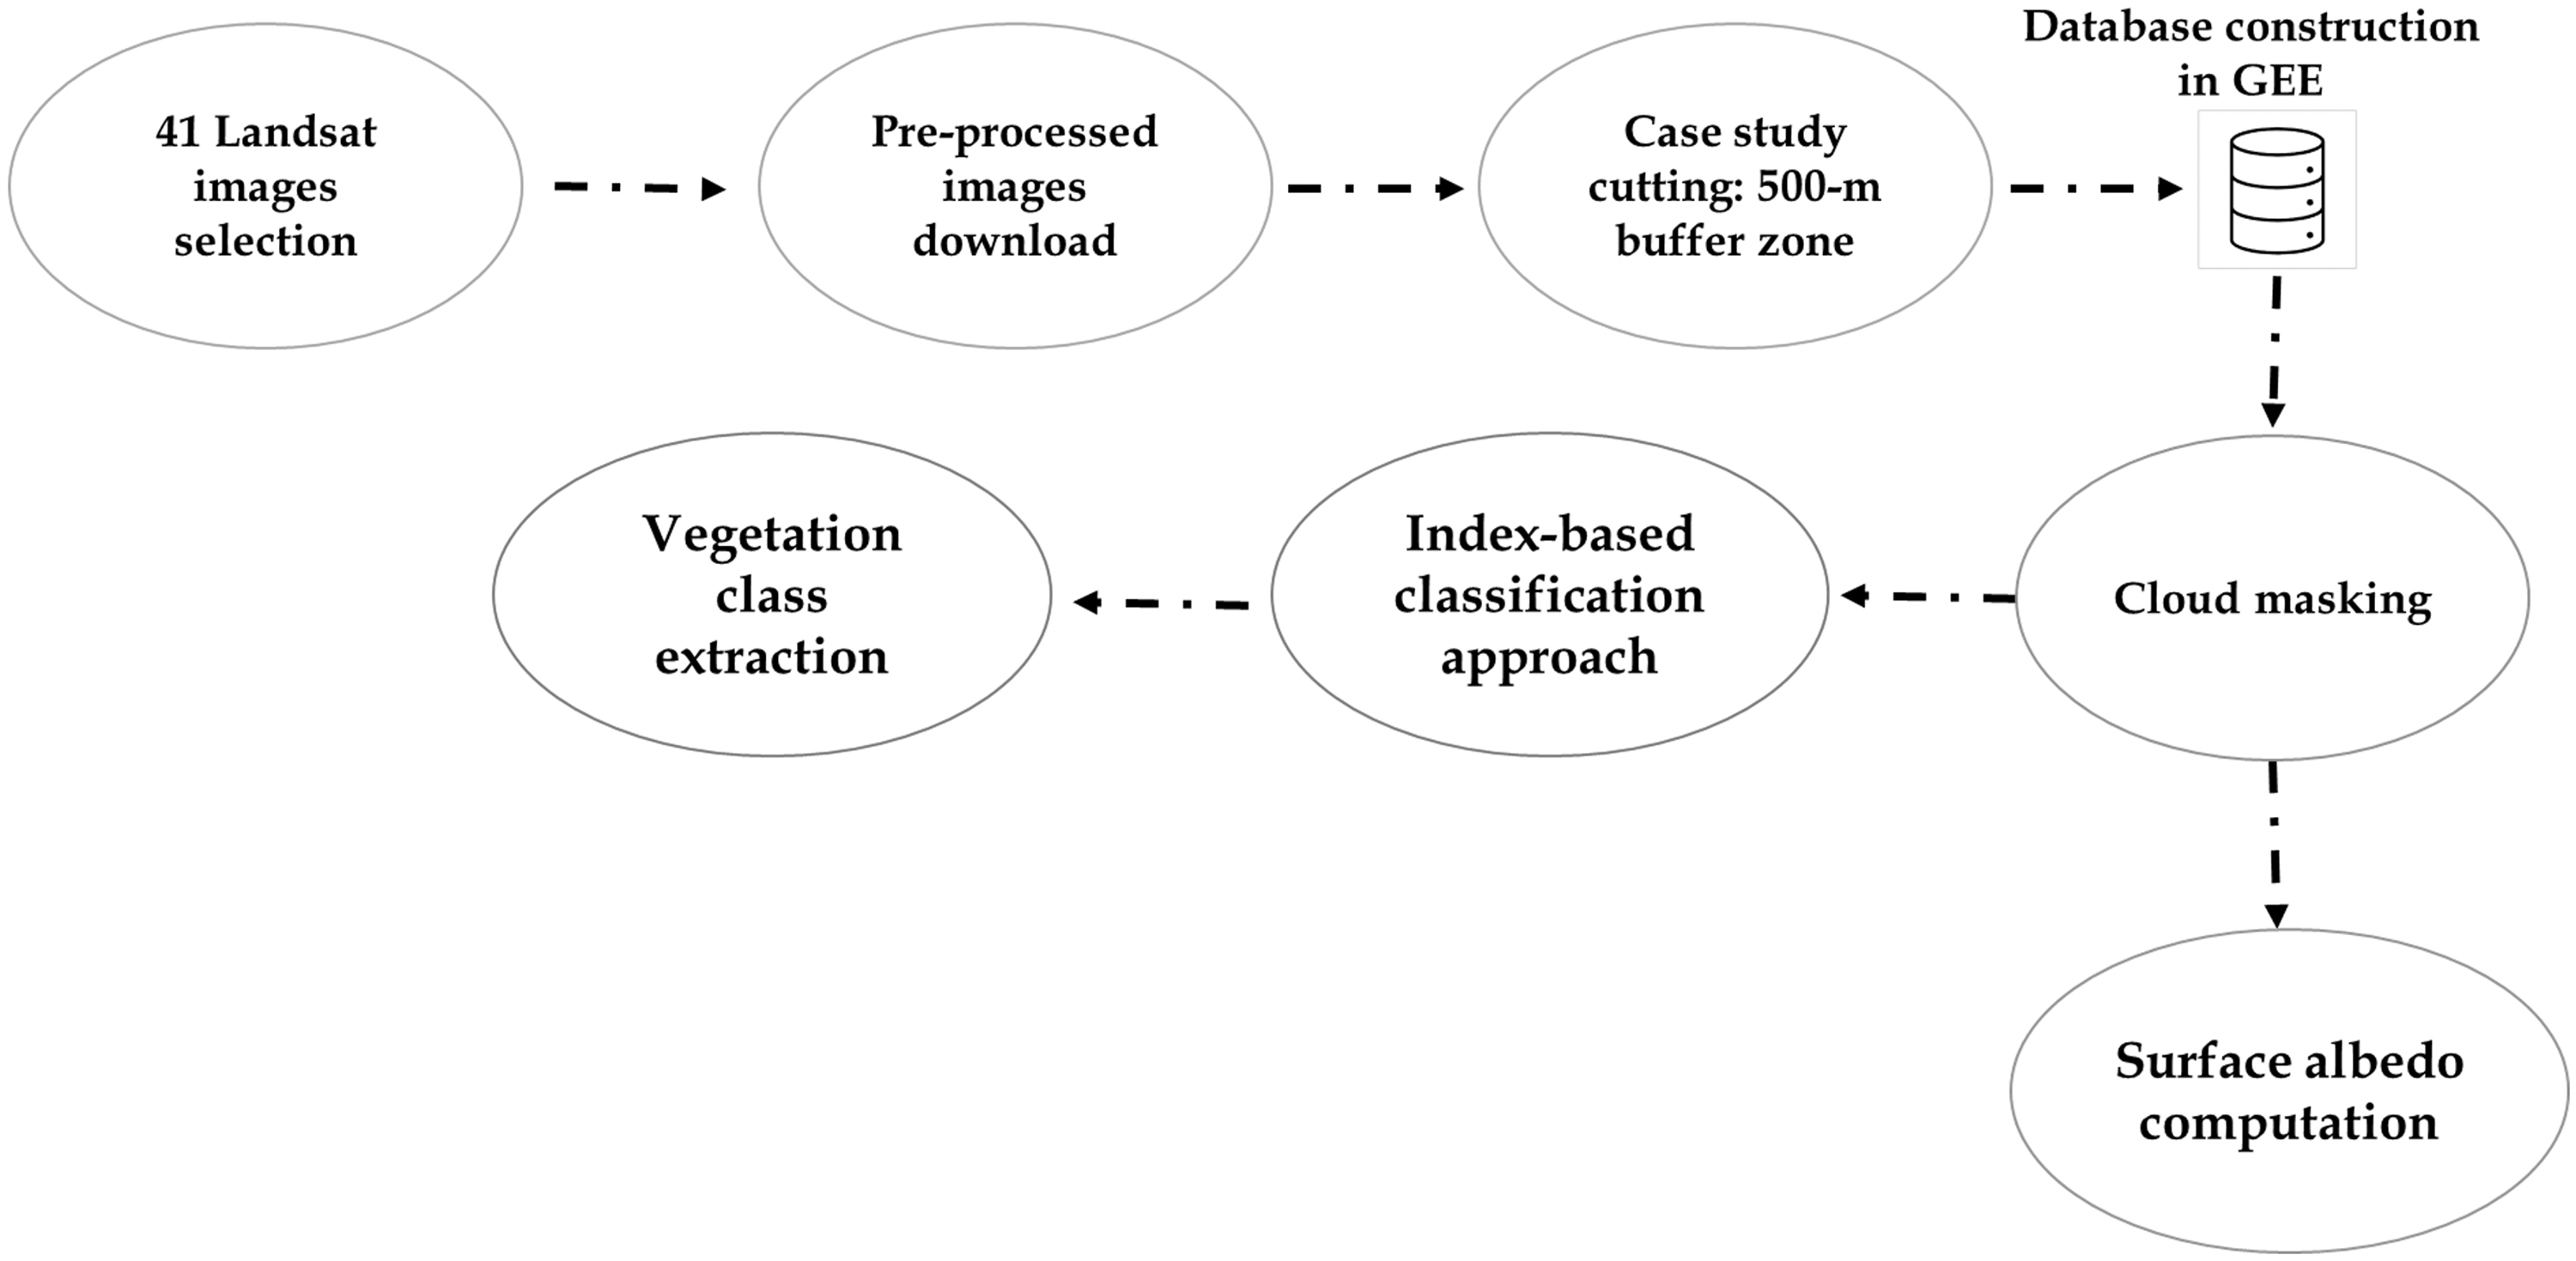
Flowchart of RS approach. GEE, Google Earth Engine; RS, remote sensing.
Anthropogenic heat
The anthropogenic heat is represented by the single criterion “population density.” Data regarding the population density can be obtained by exploiting the Eurostat (2018), and integrating some missing data of small Netherland cities by a specific search on local websites. The complete dataset for calibration is given in Supplementary Table S1.
Calibration
In this section, the simplified index is calibrated to enable its application with a refined RS data acquisition. Starting from the index defined in Overview of the Methodological Approach to Achieve the Index section, a mathematical programming (MP) problem is formulated to obtain calibrated weights by an optimization procedure by exploiting the effective UHII data acquired in 41 urban districts.
MP and calibration
To obtain the weights vi and calibrate the index defined in Equation (1), K = 41 urban districts (Ud = 1,…,K) are considered in eight cities of the European continent. The index of
where j are the alternatives associated with the Ud-th urban district.
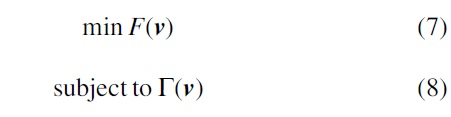
Subsequently, it is possible to define the function F(
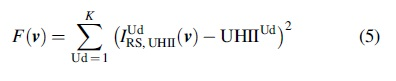
To calibrate vector
F(
Constraints [Equations (7) and (8)] are set to avoid negative or null values of the weights.
Now, to calculate vector
Calibration results
A generalized reduced gradient method (Lasdon et al., 1974) is applied to solve the MP problem by using a multistart of a population of 1,000 and a convergence of 0.001. The MP solution outcomes the calibrated weights given in Fig. 5. In addition, the results of the calibration of the simplified index (working with RS data acquisition: satellite image analysis approach) is compared with the calibration of the approach of Sangiorgio et al. (2020). In particular, Fig. 5 in the left part shows a pie chart regarding the influence of every criterion (or parameters) expressed in percentage calibrated by using RS data (satellite image analysis approach) and in the right the pie chart regarding the calibration of Sangiorgio et al. (2020). Note that the simplified approach is achieved by involving the three most important parameters of the approach of Sangiorgio et al. (2020).
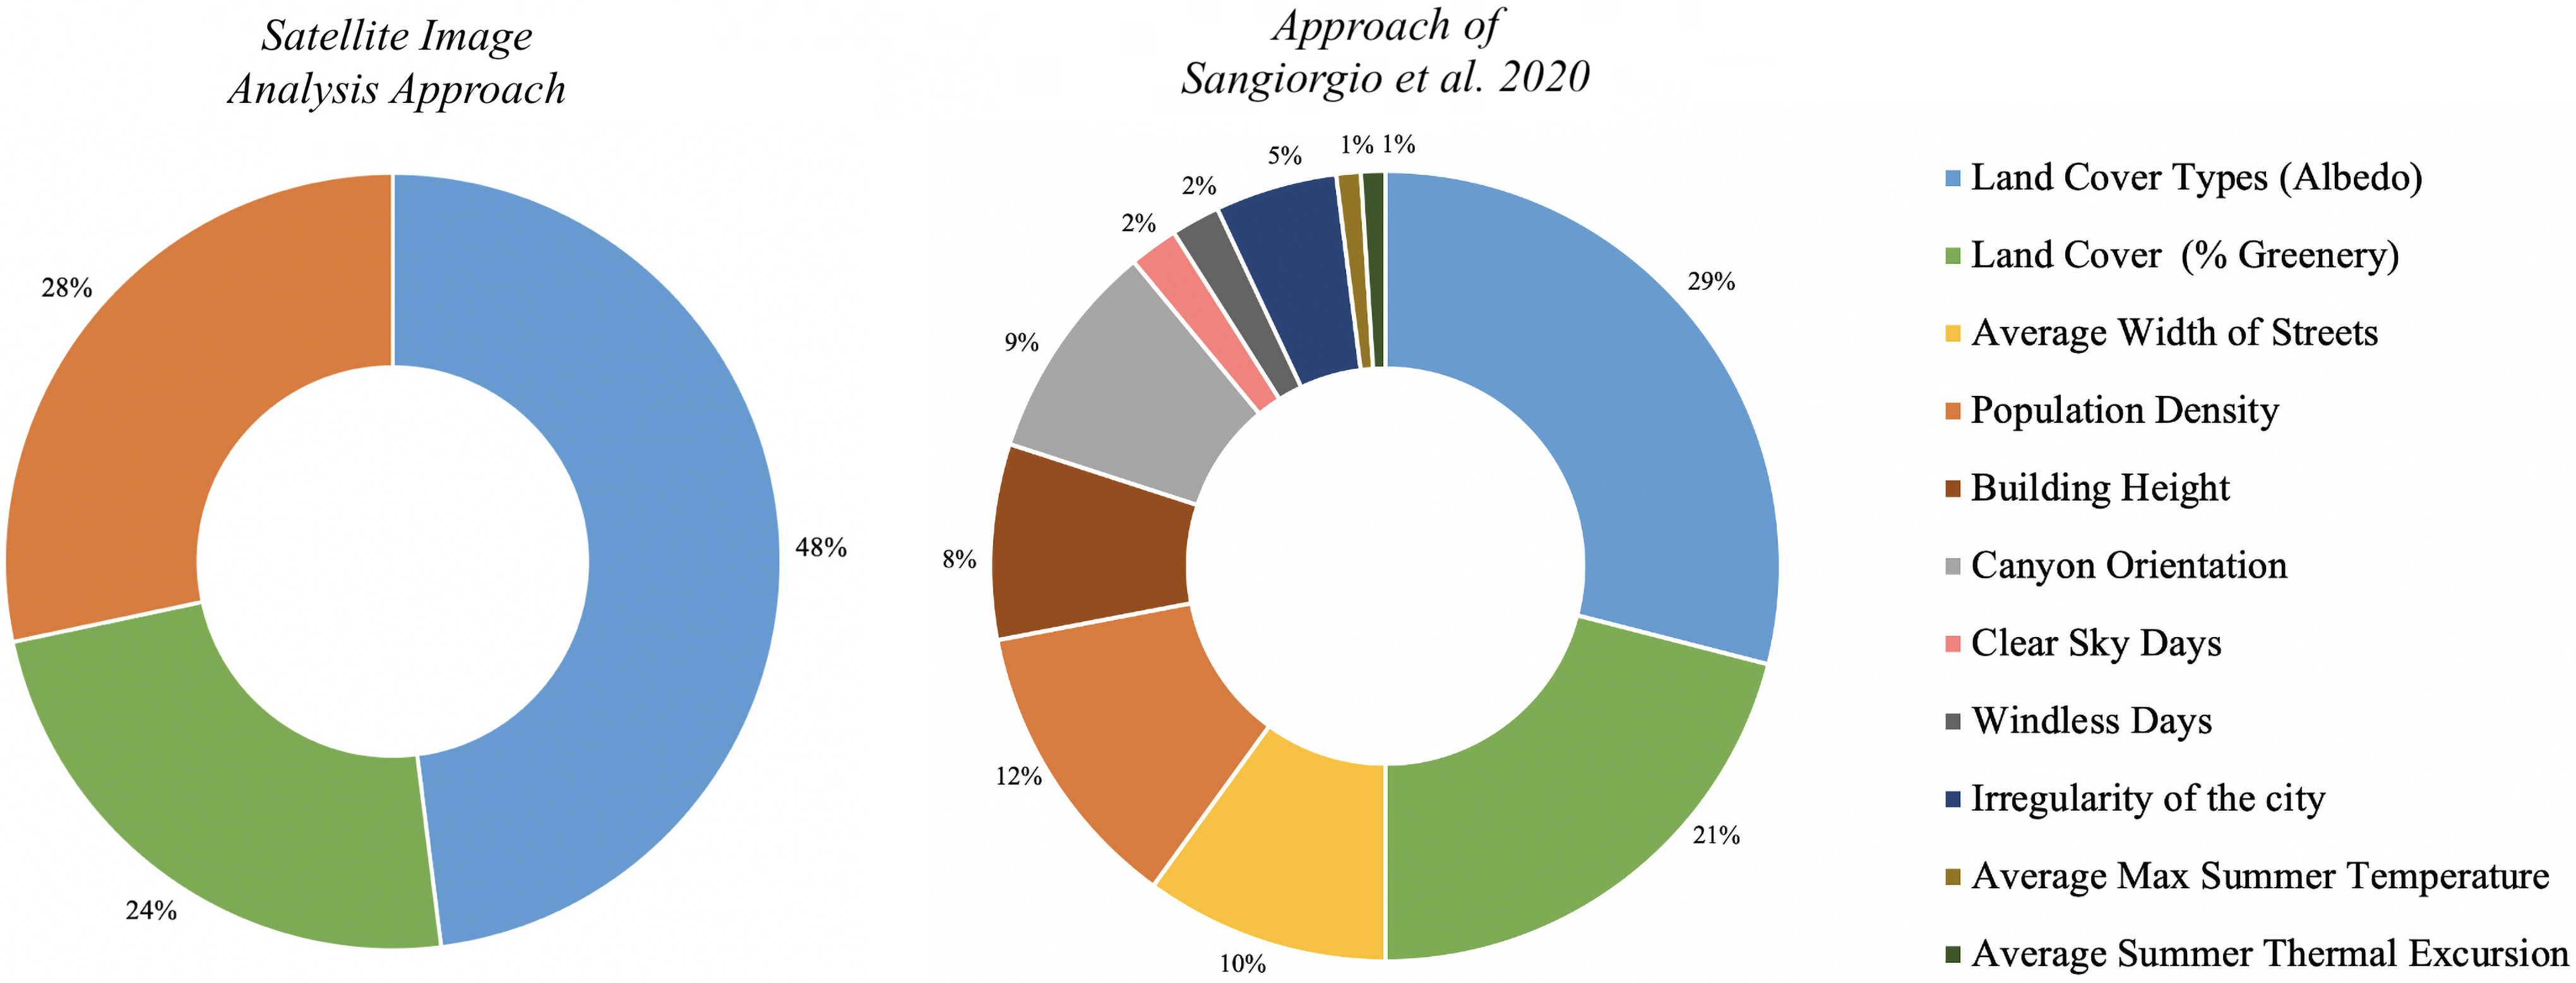
Calibrated weights, influence of each parameter in the UHII and comparison with an existing multiparametric approach of Sangiorgio et al. (2020).
Absolute and relative error
To explicitly validate the proposed calibration, a second analysis is performed to identify the Absolute Error and the Mean Relative Error of the proposed index in comparison with the approach of Sangiorgio et al. (2020). In particular, the values obtained with index IRS,UHII is compared with the effective absolute max UHII obtained from the bibliography (RS data acquisition methods and Sangiorgio et al., 2020). To this aim, a Jackknife approach is used to perform a resampling of the input data and verify both the reliability and the robustness of the index by displaying statistical graphs. In particular, a one-by-one removal of the 41 urban districts is performed and every removal the MP problem is solved to verify that the solution does not change significantly.
Figure 6 shows the statistical graph (boxplot) of the Absolute Error and Mean Relative Error obtained for the two approaches. More in detail, the boxes represent the distribution of the error (°C for the Absolute Error and % for the Relative Error) and the black horizontal line inside the boxes denotes the median of the sample. Although the box contains all results within the 25th and 75th percentile of the population, the vertical line contains all results that are not considered outliers. The Mean Relative Error is represented in the same graph by the symbol “ × .”
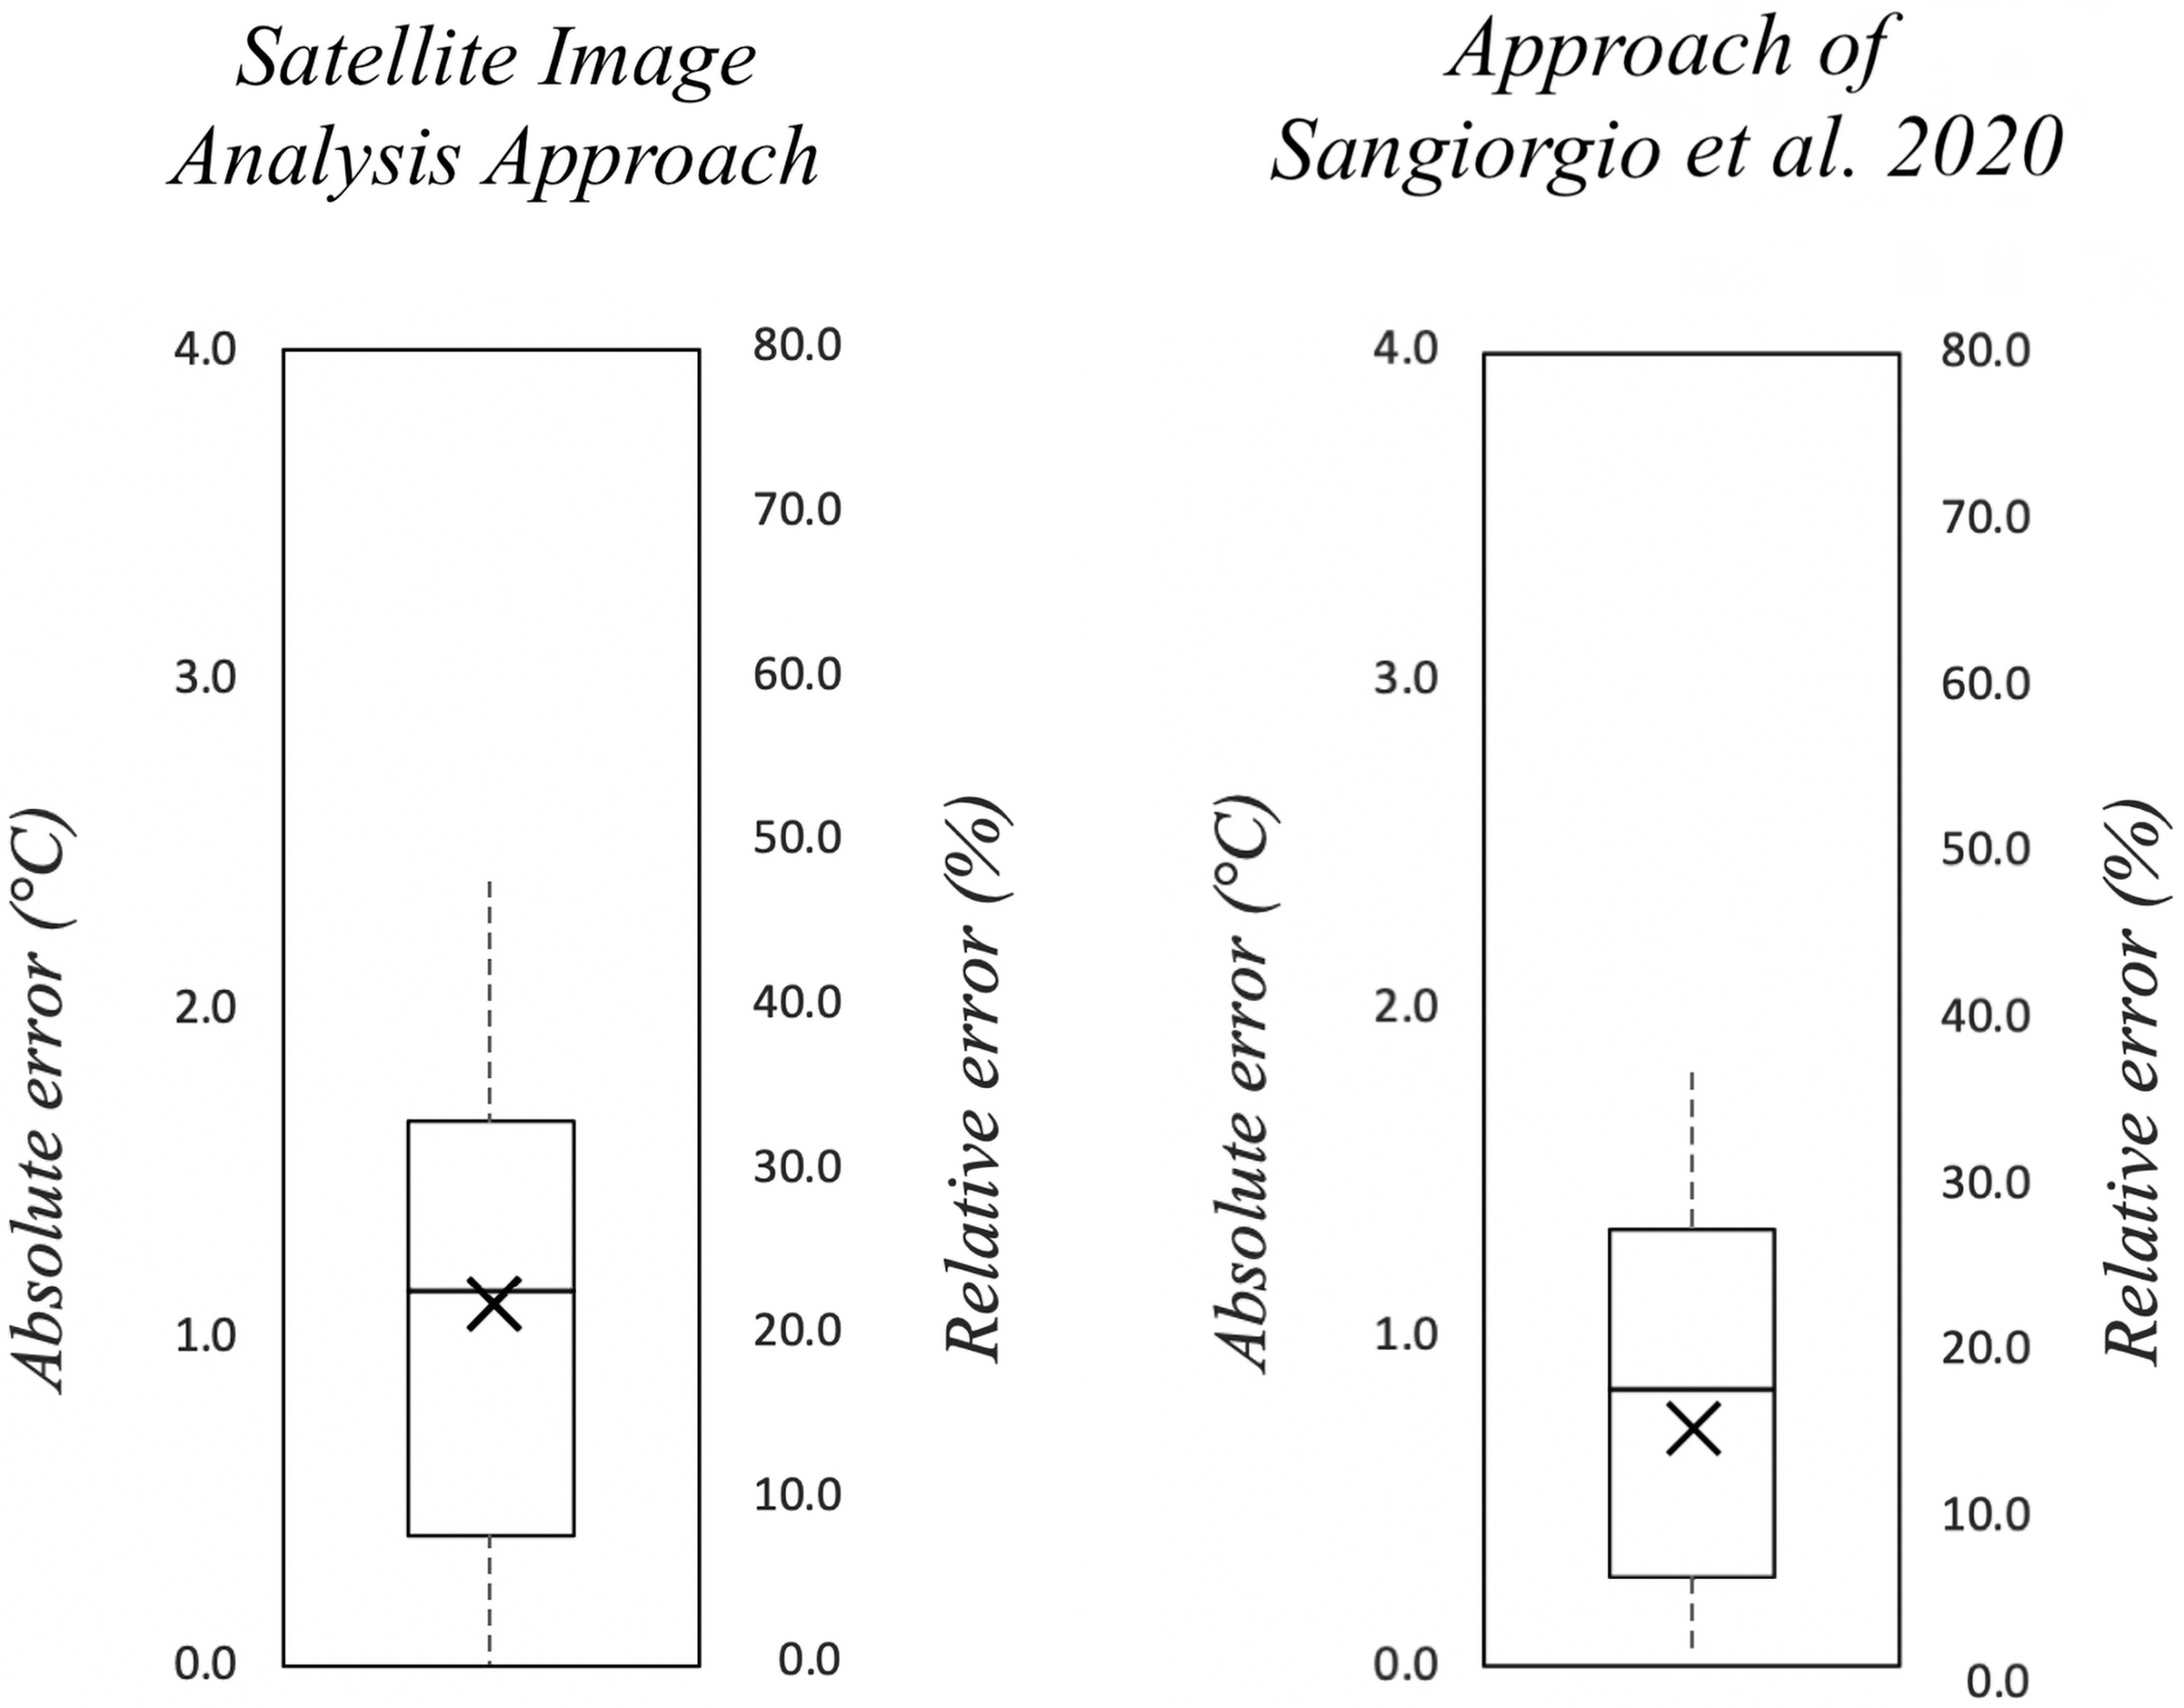
Boxplot of the absolute error and mean relative error obtained for the two approaches.
This additional analysis demonstrates that the proposed index is able to quantify the potential absolute max UHII with an average accuracy of ∼1.2°C (mean absolute error <1.2°C). In addition, in >70% of the investigated urban district the relative error is <10%. On the contrary, in the urban district where the absolute max UHII is small, often there is a higher error (>15%) even if the absolute error remains ∼1°C. The mean relative error is ∼20% and 15% for the simplified index and Sangiorgio's approach, respectively. The proposed approach provides accuracy only slightly lower but ensures greater ease of use and applicability.
In addition, such error and can be considered acceptable to the effective application of the proposed index as it is similar to the reliability that characterizes the UHII measurements with standard fixed station. Indeed, the conventional approach to measure UHII can be affected by an inaccuracy owing to the choice of the rural station measurement to be compared with the city station measurement as discussed by Oke (1991).
Application and Comparison
To verify the effectiveness of the proposed approach, the index is applied to the case study of Berlin. Moreover, a comparison of the two different approaches is performed to show the differences of the two methods.
The index application: the case of Berlin
The resulting indexes are able to forecast the absolute max UHII in the urban districts by using the input data including characteristics of the city (in terms of albedo and greenery) and anthropogenic heat.
To provide an example, there are no exhaustive studies on the heat island effect for the whole city of Berlin in related literature. To this reason, the proposed index can be very useful to study the magnitude of the phenomenon in the city exploiting an RS data analysis.
The collection procedure allows to easily achieve the input data of all the 96 urban districts of the city of Berlin as given in Supplementary Tables S2 and S3. Note that, data are acquired by considering an area within 500 m centroid of considered districts. In addition, Supplementary Tables S2 and S3 show the two datasets regarding the districts of Berlin, one obtained with the procedure of Sangiorgio et al. (2020) and one with the proposed RS procedure, respectively. Note that the RS procedure is applied with both the data of Landsat 5, acquired on July 2, 2011 and Landsat 8, taken on June 24, 2019, to identify any differences in the applicability of the method with the different satellites (comparison described in the next subsection).
Figure 7 shows the application of the proposed index (exploiting data from Landsat 8) to generate an intensity map (and show the magnitude of the phenomenon) of the city of Berlin for the Absolute Max UHII. The central areas of Berlin (urban districts of Mitte or Friedrichshain) are the most subject to suffer the UHI caused by an intensely developed urban fabric. The only few exceptions, as an example, the urban district of Hellersdorf may be subject to high-absolute max UHII because of the high housing density and lower presence of green. On the contrary, in most districts of Berlin, there is lot of greenery between parks and urban woods that are able to mitigate the effects of the phenomenon. These results are in line with the study of Menberg et al. (2013) that investigates the distribution of the surface air temperature in Berlin.
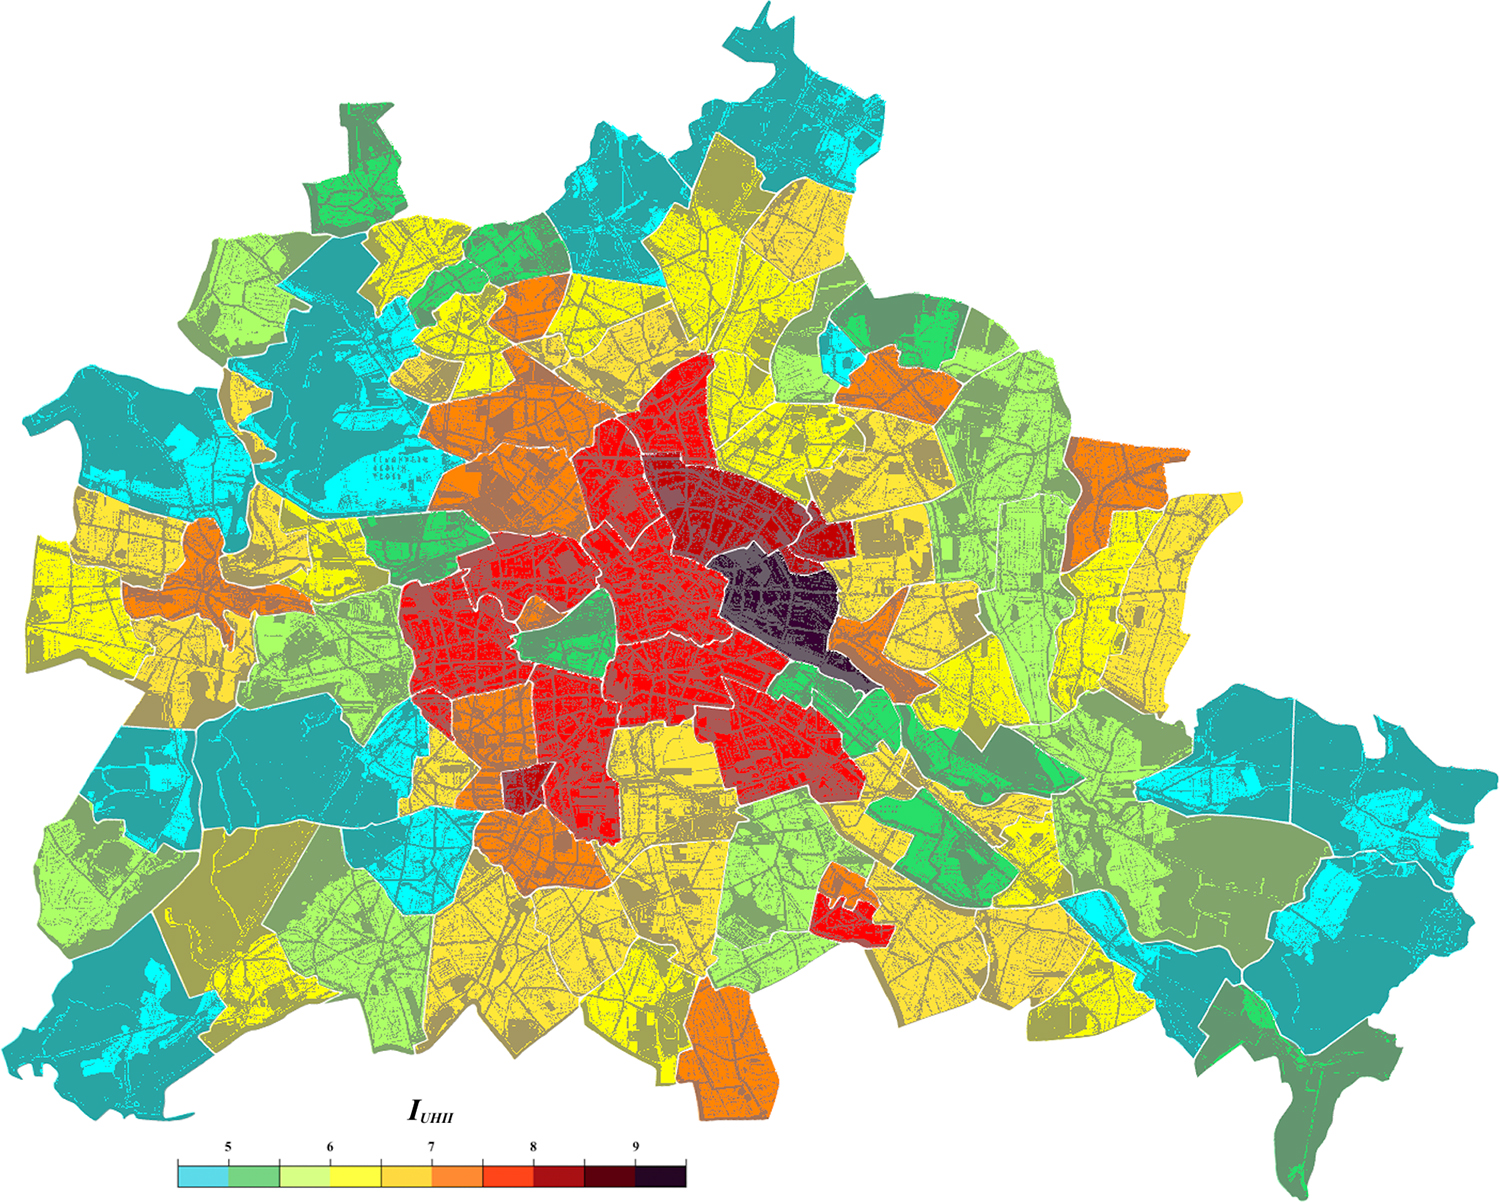
Example of the application of the IRS,UHII (RS data from Landsat 8) to create an intensity map of the city districts of Berlin.
The comparison of different approaches
To show the differences of the two approaches and investigate the contribution of diverse satellite data, the intensity map of Berlin is evaluated by the index applied with: (1) the approach of Sangiorgio et al. (2020); (2) the simplified index exploiting satellite image analysis approach using Landsat 5; (3) and the simplified index exploiting satellite image analysis approach using Landsat 8. Figure 8 shows the different intensity maps obtained with the two approaches and the three different datasets.
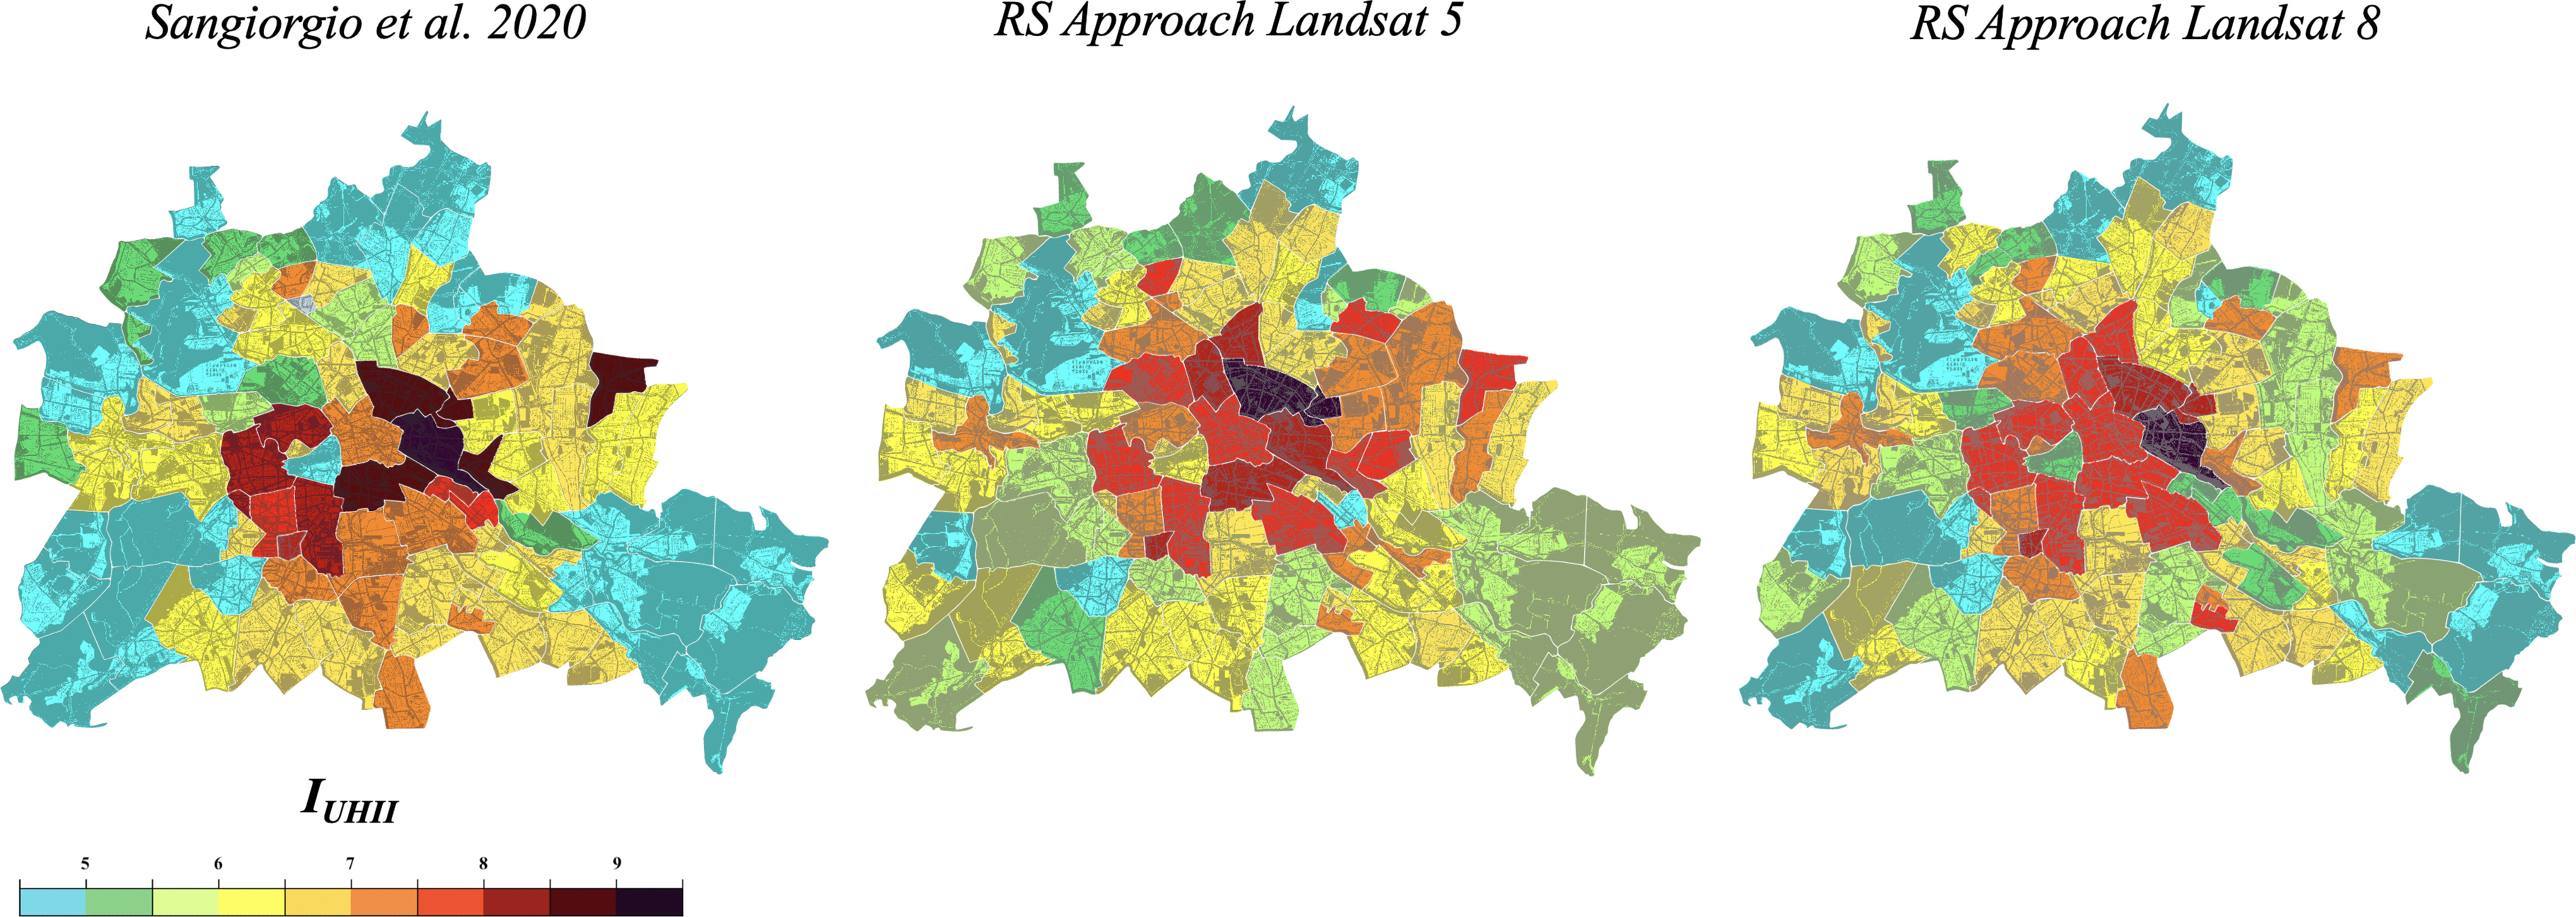
Example of the application of the IRS,UHII and comparison with Sangiorgio et al. (2020), Landsat 5, and Landsat 8 to create a intensity map of the city districts of Berlin.
Moreover, Fig. 9 emphasizes the differences of the various intensity maps showing pair comparisons of the three maps obtained. For every pair comparison, a boxplot representing the differences of the estimated absolute max UHII for all the city urban districts ΔUHII is given.
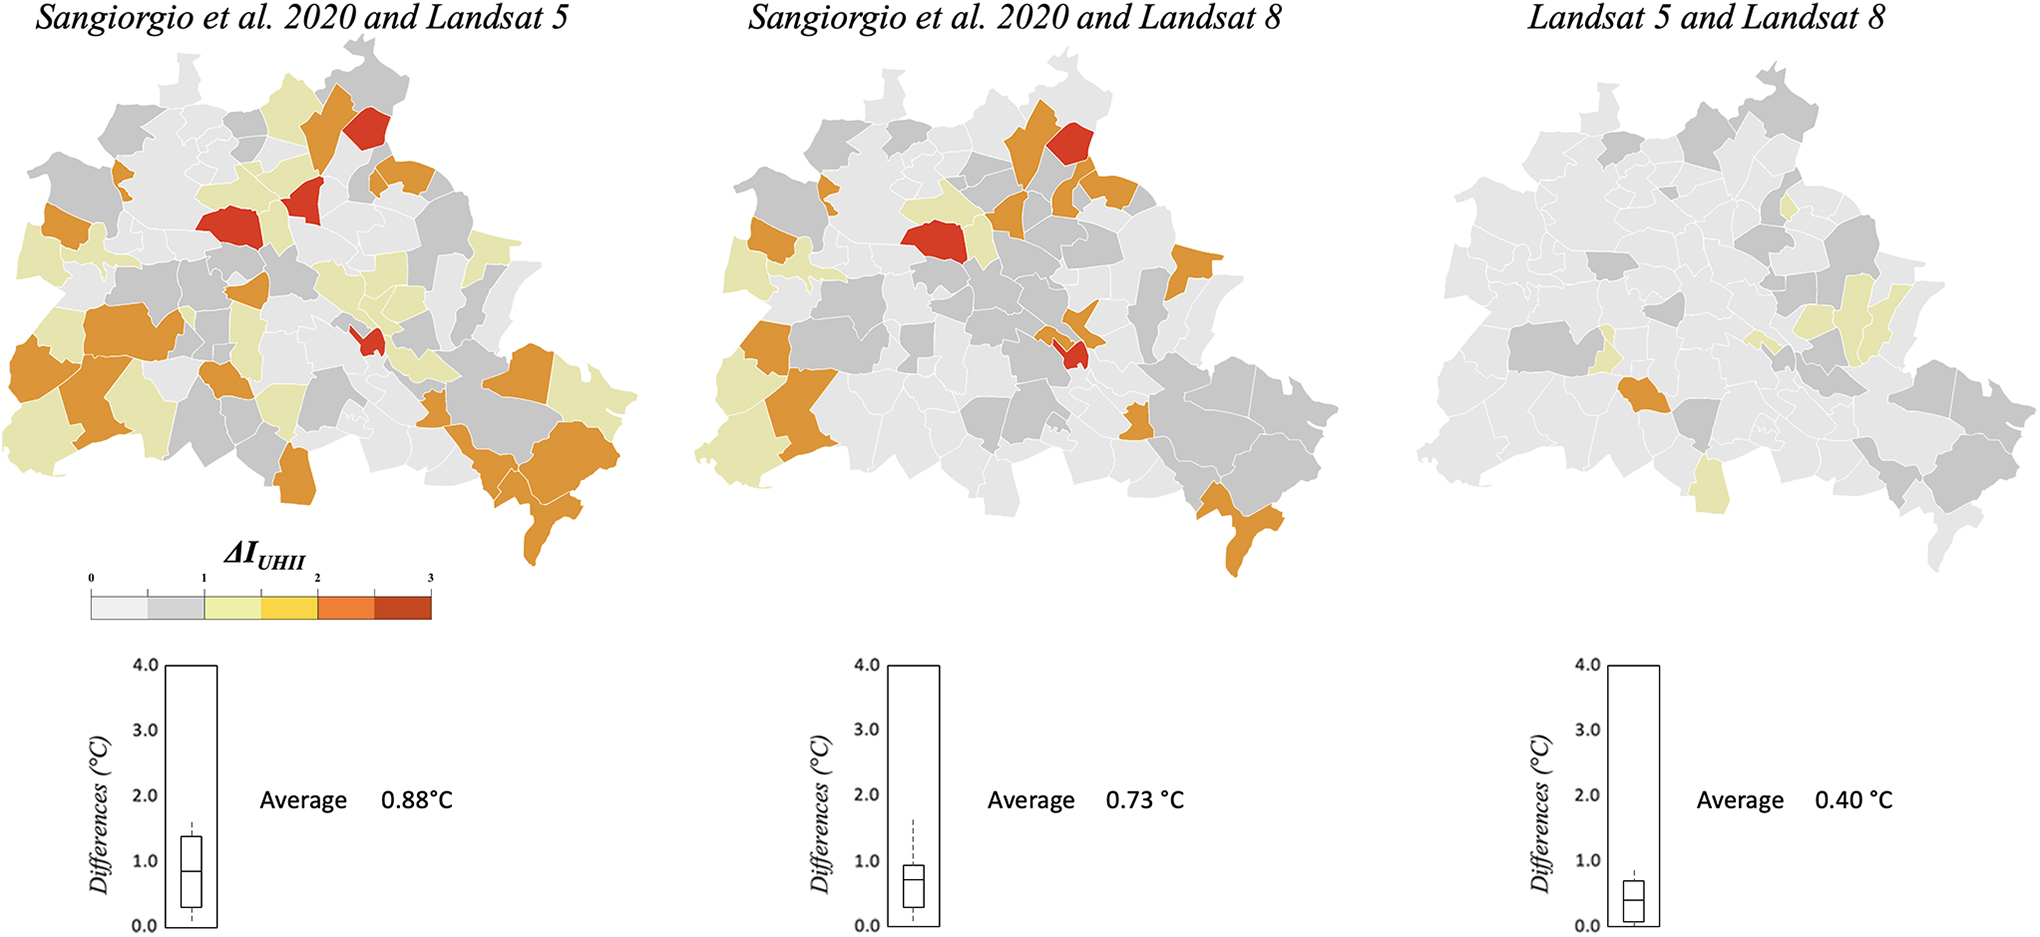
Pair comparisons of the intensity maps of Berlin and boxplot of the ΔUHII evaluated for every urban district.
The approach of Sangiorgio et al. (2020) allows achieving good results for the estimation of both the high- and low-absolute max UHII. On the contrary, this approach is time consuming and involves a large number of parameters in comparison with the simplified RS approach.
The satellite image analysis approach using Landsat 5 is accurate for districts with medium and high UHII but provides a slight overestimation of the districts with low UHII.
On the contrary, Landsat 8 is very accurate for districts with low UHII and slightly underestimates districts with high UHII.
However, the average differences among the three approaches are far below 1°C, confirming that both the approaches and the three data acquisition methods are effective. Specifically, such an outcome provides relevant contribution in detecting the UHI in specific historical periods, owing to the reliability of Landsat data (in both the considered missions 5 and 8). Indeed, Landsat is the only satellite platform providing free continuous information from 1973. Thus, the Landsat-based RS approach allows extracting information in a specific temporal period. Consequently, by using this approach it is possible to carry out multi-temporal analysis suitable for investigating UHI evolution over the time.
Conclusions
The proposed work presents a simplified index that allows to evaluate the potential absolute max UHII in urban districts by exploiting satellite image analysis to identify the albedo, greenery, and population density.
The novelty of the proposed approach is twofold.
First, in comparison with previous approaches, such as the index of Sangiorgio et al. (2020), the proposed method is simplified, automated, and applicable at a large scale. Indeed, the proposed index can exploit a structured RS evaluation to acquire albedo and greenery with a cloud-based platform handling geo-big data at large scale. The integration of such data acquisition approach in the index provides the great advantage of processing the big data by using in parallel 100 processors, speeding up the overall data acquisition procedure.
Second, the RS-based procedure provides relevant contribution in detecting the UHI in specific historical periods owing to the reliability of Landsat providing free continuous information from 1973. Thus, the Landsat-based RS approach allows extracting information in a specific temporal period and simultaneously carrying out multi-temporal analysis suitable for investigating UHI evolution over the time.
The proposed index could be a useful tool to quantify the potential UHII in any phase of an urban development, from the project phase to the construction maintenance and management phases. The index could also be used to evaluate local mitigation strategies and the effectiveness of retrofit interventions to improve the energy performances of buildings. Beyond this, researchers can also use this index to obtain maps of intensity at different scales: urban, regional, and national.
Future research will evaluate the vulnerability index and exposure index to the UHII phenomenon to obtain an overall risk index of the phenomenon. In addition, the proposed index will be integrated in Spatial Decision Support Systems for the large-scale risk assessment useful to set effective mitigation strategies.
Footnotes
Authors' Contributions
Conceptualization: V.S., F.F., and M.S.; methodology: V.S. and A.C.; validation, V.S.; formal analysis: V.S. and A.C.; data curation: V.S. and A.C.; writing—original draft preparation: V.S.; writing—review and editing: V.S., F.F., E.T., and M.S.; visualization: V.S.; supervision: F.F., E.T., and M.S. All authors have read and agreed to the published version of the article.
Author Disclosure Statement
No competing financial interests exist.
Funding Information
No funding was received for this article. The funders had no role in the design of the study; in the collection, analyses, or interpretation of data; in the writing of the article, or in the decision to publish the results.
References
Supplementary Material
Please find the following supplemental material available below.
For Open Access articles published under a Creative Commons License, all supplemental material carries the same license as the article it is associated with.
For non-Open Access articles published, all supplemental material carries a non-exclusive license, and permission requests for re-use of supplemental material or any part of supplemental material shall be sent directly to the copyright owner as specified in the copyright notice associated with the article.