
Abstract
The environmental problem of volatile organic compounds (VOCs) pollution in industrial parks is becoming increasingly serious. Rapid and large-scale monitoring of the overall pollution in the area and identification of pollution sources are keys to efficient pollution control. However, traditional detection methods cannot achieve rapid detection, let alone accurately pinpoint the source of pollution. In this study, an online VOC mobile monitoring system based on time-of-flight mass spectrometry was used to monitor an industrial park and successfully obtain the VOC distribution image of the industrial park. Two polluted areas (A and B) were pinpointed by examining the image, and the ΣVOCs concentration ranges were 74–421 μg/m3 and 51–577 μg/m3. Eight abnormal sites with concentration peaks exceeding the standard were found, and the pollution source of one abnormal site was analyzed. The correlation between the pollution source factor of the abnormal site and the emission enterprise was as high as 0.91, and the pollution source of the abnormal site was identified. To explore whether it was affected by other surrounding enterprises, a positive matrix factorization model was further used to analyze the receptor data of abnormal site. Three pollution sources were analyzed and compared with enterprise emission sources. Combined with the location of the abnormal site and emission sources, we found that the abnormal sites were not only affected by the emission sources of surrounding enterprises but also by the emission sources of enterprises in the northeast. This approach offers rapid and large-scale monitoring of the overall pollution in an area and quickly pinpointed the location of the pollution sources. This method solves the shortcomings of traditional methods that cannot identify the location of pollution source and provides an effective technical means for the rapid detection of the pollution distribution in industrial parks for efficient screening of pollution sources.
Introduction
Industrial parks are a primary mechanism of China's industrial development. They play an important supporting role in economic development. In recent decades, with the rapid development of industrial parks, the volatile organic compounds (VOCs) emitted by industry have become a main source of VOC emission in China. Liang et al. (2020) reported that from 2011 to 2019, China's annual VOC emissions increased from 8,777 kilotons to 12,446 kilotons (Ye et al., 2020). This growth in emissions is mainly due to China's rapid economic development. In addition, in the development process of domestic industrial parks, there have been problems such as poor environmental management, chaotic layouts, and lagging environmental protection infrastructure, thus resulting in increasingly serious environmental pollution problems in these industrial parks.
Industrial VOC emissions in China are still severe (Ji et al., 2020; Wang et al., 2021) (Zhang et al., 2014; Wu et al., 2015). VOCs can have low concentrations, strong activities, wide varieties, and complex compositions. They are precursors of atmospheric particulate matter and ozone pollution (Kesselmeier et al., 2002) and pose a potential threat to human health. If the human body is exposed to a high concentration of VOCs for a long time, then there is a risk of gene mutations or carcinogenesis (Guo et al., 2004). In 2021, the Chinese government clearly and thoroughly implemented the blue sky protection campaign to require a reduction in VOC emissions and focus on the treatment of ozone pollution in summer and autumn (MEPC, 2021).
VOC pollution in industrial parks is the focus of treatment. However, due to the complex and easy diffusion of VOCs in industrial parks, accurate and efficient identification of pollution sources is difficult for VOC pollution control in industrial parks. Therefore, there is an urgent need for technical approaches suitable for large-scale rapid detection of VOCs and rapid and accurate identification of pollution sources in industrial parks.
The monitoring of VOC emissions in industrial parks and the accurate identification of pollution sources are prerequisites for effective industrial park governance. Currently, the traditional off-line VOC detection methods have primarily used gas chromatography or gas chromatography mass spectrometry (Wang and Austin, 2006; Wang and Fu, 2007; Herberger et al., 2010; Han et al., 2019), but due to the low efficiency and large time-consumption requirements of these methods, on-site rapid detection capabilities are limited. Methods that are different from traditional off-line detection methods, like proton-transfer-reaction mass spectrometry (PTR-MS) (Lindinger et al., 1998; Tani et al., 2003) and single-photon ionization mass spectrometry (SPI-MS) (Guo-Bin et al., 2011; Hua et al., 2011; Gao et al., 2013; Lei et al., 2018) have been widely used in the field rapid detection of VOC because of their rapid response (Gouw and Warneke, 2007; Jin et al., 2007; Liu et al., 2020; Chu et al., 2021).
Yu et al. (2020) made a comprehensive comparison between PTR-MS and SPI-MS. The changes of most of the VOCs detected by the two were consistent. SPI-MS has a higher sensitivity to alkanes, aromatic hydrocarbons, and other similar VOCs. In addition, the use of vacuum ultraviolet SPI source technology and time-of-flight mass spectrometry (TOF MS) technology leads to a fast online response, as well as an easy and full spectral analysis. The use of SPI-MS for mobile monitoring has become popular. Xu et al. (2020) used mobile SPI-MS for pollution assessment in sudden environmental accidents, and Gao et al. (2021) used mobile SPI-MS to detect VOCs pollution in chemical industry parks and analyze its ozone formation potential. Xue et al. (2020) used mobile SPI-MS to observe the distribution of urban VOCs pollution and conduct preliminary pollution source screening.
Positive matrix factorization (PMF) is a receptor model that uses the least squares method to calculate the primary pollution sources and their contribution rates (Paatero and Tapper, 1994). It is currently widely used for the source apportionment of particulate matter and VOCs (Liao et al., 2017; Hsu et al., 2018; Wang et al., 2018; Javed et al., 2019; Cao et al., 2020). For example, Sun used the PMF and conditional probability function methods to identify the emission sources of chemical companies (Sun and Xie, 2020), and Zheng used PMF to study the composition, source, and health risks of VOCs in a typical petrochemical industrial park in the middle reaches of the Yangtze River (Zheng et al., 2019). However, most of the current source analysis methods are fixed-point or offline methods, which are inefficient and generally unable to pinpoint the location of the pollution source.
In this study, an online vehicle underway mobile monitoring system based on the SPI-MS technology was used to monitor the VOCs in an industrial park in a mobile way. The distribution of the VOCs in the area can be quickly obtained, and the VOC distribution image in the area can be produced. In the image, the polluted areas and abnormal sites can be found according to geographic locations. In addition, PMF can be used to analyze the VOC components of the abnormal sites and the components of the suspected pollution sources to obtain the contribution values from the pollution sources. Their geographic locations can then be analyzed to finally identify the pollution sources of the abnormal sites and provide support for the efficient and accurate prevention and control of VOC pollution in industrial parks.
Materials and Methods
As there were no animals, human subjects and case studies in this study, the institutional review board (IRB) reviews were waived based on the institutional policy.
Vehicle underway mobile monitoring system
In this study, the online VOCs vehicle underway mobile monitoring system based on TOF MS was provided by the Guangzhou Hexin Instrument Co., Ltd. (Guangzhou, Guangdong, China). The system was primarily composed of a SPI time-of-flight mass spectrometer (SPI-MS 2000; Guangzhou Hexin Instrument Co., Ltd., Guangzhou, Guangdong, China), the monitoring vehicle, an atmospheric sampling tube, an uninterruptible power supply (UPS) system, a gas dilution device (Sabio 2010), and other key equipment. The sampling tube was set in the middle of the top of the vehicle, the height of the sampling port was about 3.3 m, and the exhaust outlet of the vehicle was located at the rear of the vehicle (about 30 cm above the ground). The sampling port was located in the front of the vehicle and is significantly higher than the exhaust. Therefore, the interference of automobile exhaust gas sampling can be avoided, as shown in Fig. 1a.

Vehicle underway mobile monitoring system
An SPI-MS 2000 was the core equipment of the online vehicle underway mobile monitoring system. This instrument is primarily composed of a membrane sampling system, a SPI source, a TOF mass analyzer, and other devices that can complete the VOC detection in seconds. Due to the single-photon ionization source, only molecular ions are generated after the molecules are ionized, and there exist nearly no fragment ions. VOCs can be qualitatively and quantitatively analyzed using the m/z and the intensity of the molecular ions.
In this study, the sampling flow of the instrument was 1 L/min, the temperature of the sampling tube was 40°C, the UV lamp voltage of the ion source was −1,200 V, the TOF accelerating voltage was −1,150 V, the reflection voltage was 350 V, the ion detector voltage was −1,700 V, the instrument detection speed was 5 s/data point (sampling period was 5s), and the vehicle's moving speed was 20 km/h. The spatial resolution of the movement was 27.8 m.
The monitored area and the movement route
A high-tech industrial park near the northwest of the Pearl River Delta region of Guangdong Province (112°40'43”–112°54'36”, 23°13'13”–23°56'45”) covers an area of about 83.64 km2. There were more than 280 industrial enterprises in the park, consisting of businesses in the electronics industry, biopharmaceutical industry, new material industry, metal processing industry, packaging and printing industry, light industry manufacturing industry, and so on. The local environmental protection agencies (EPAs) plan to investigate the distribution of VOC pollution and emissions in the area. Therefore, the online underway mobile monitoring system monitored the VOCs in the area from April 2, 2018, to April 12, 2018.
Since the goal was to obtain the overall distribution of VOCs in the park, the system movement route was based on the principle of covering the target area as much as possible. Therefore, the design of movement was similar to a “grid.” The monitored area was divided into area A, area B, and area C, as shown in Fig. 2.

The monitored area and the movement route.
Analysis method for the monitoring data
List of VOCs monitored
A list of VOCs detectable by SPI-MS is shown in Table 1. There are 77 different VOCs based on Photochemical Assessment Monitoring Stations (PAMS) and TO-15 standards of the EPA; organic sulfur gases are also listed. Single mass spectrometry cannot distinguish between substances of the same molecular weight, and thus there are 38 mass spectral signal peaks in total. The mass-to-charge ratio (m/z) ranges from 48 to 261, and the sum of the concentrations of various components is represented by ΣVOCs. To ensure the accuracy of the detection result, calibration was performed at five different concentrations from 0 nmol/mol to 50 nmol/mol by the PAMS gas (Air Liquide China Holding Co., Ltd., Shanghai, China), TO-15 gas (Air Liquide China Holding Co., Ltd.), and organic sulfur gas (Dalian Special Gases Co., Ltd., Dalian, Liaoning, China) standards.
List of Detected Volatile Organic Compounds, the Correlation of Calibration Curve, the Minimum Detection Limit, and the RSD of Detection Results Between Different Instruments
VOC, volatile organic compound; MDL, method detection limit.
The results show that the calibration curve correlation of all VOCs was 0.951–0.999, except for the calibration curve correlation of n-nonane (0.892). The 50 nmol/mol organic sulfur standard gas, 50 nmol/mol PAMS gas, and 50 nmol/mol TO-15 gas were used to test the RSD of the response values between six instruments (SPI-MS 2000) to verify the accuracy of the test results. The results showed that the relative standard deviation (RSD) between the six instruments was 5.9–17.9%. The concentration response values of 5.0 nmol/mol organic sulfur standard gas, 5.0 nmol/mol PAMS gas, and 5.0 nmol/mol TO-15 gas were tested to calculate the minimum detection limit of SPI-MS 2000. The list of detected VOCs, the correlation of the calibration curve, the minimum detection limit, and the RSD of detection results between different instruments are shown in Table 1.
Analysis of the polluted area and the abnormal site monitoring data
The online VOCs vehicle underway mobile monitoring system obtained the VOC concentration data and geographic location after mobile monitoring according to the moving route, and then produced an overall ΣVOCs distribution image of the area. The image was analyzed, and various relevant local emission standards in Guangdong Province were used as references for the emission limit of 2,000 μg/m3, as shown in Table 2. When the ΣVOCs concentration of the monitored site exceeded 2,000 μg/m3, the site was defined as an abnormal site. The area where the abnormal site was located was defined as the polluted area.
Local Emission Standards in Guangdong Province
Analysis method for the identification of pollution sources at abnormal sites
PMF is one of the most widely used VOC source analysis methods. It uses the least square method to analyze the errors of the chemical components in the pollutants to obtain the primary pollution sources and their contribution values. The error of each chemical composition is obtained using the principle of weight calculation (Cai et al., 2010; Gao et al., 2014), and the basic equation is as follows:
Here, Xij is the concentration of substance j in sample I; p is the number of factors (i.e., the number of sources); gik is the spectrum of the factor (i.e., the relative contribution of I sample in the k-th factor (source)); fkj is the contribution of the source (i.e., the content of substance j in the k-factor composition spectrum); and eij is the residual of material j in sample i during PMF calculation. The elements in matrices g and f are positive values; both are non-negative constraints. To obtain the optimal factor analysis results, the model defines an objective function Q, and then minimizes the objective function Q according to the sample residual e and uncertainty u. The pollution source contribution value g (relative value) and pollution source composition spectrum f (relative concentration value of chemical composition) can be determined at the same time. The formula is as follows:
Here, n is the number of species, m is the number of samples, and uij is the standard deviation or uncertainty of the i-th chemical component in the j-th sample. When using the PMF 5.0 model for analysis, the missing data are eliminated if the concentration is less than or equal to the method detection limit (MDL) provided, and the uncertainty is calculated using a fixed fraction (5/6) of the MDL. The uncertainty calculation method for substances with concentrations higher than the detection limit is as follows:
Here, Unc is the species uncertainty, ErrorFaction is the error coefficient, Concentration is the pollutant concentration, and MDL is the species detection limit.
Results and Discussion
Data analysis of the monitored area
The mobile monitoring data in the A, B, and C areas were counted, and the ΣVOCs distribution image of the industrial park was produced. As shown in Fig. 3, the abnormal sites were primarily concentrated in areas A and B, and there did not exist an abnormal site in area C. As shown in Area A in Fig. 4, the average concentration (sampling period average) of the ΣVOCs monitored using the system in area A ranged from 74 μg/m3 to 421 μg/m3, which was lower than the local standard limit. However, its peak value ranged from 1,302 μg/m3 to 8,010 μg/m3, of which the peak value on 3 days was higher than the standard limit. The peak value of the ΣVOCs jumped between 6 and 22 times on different days, of which the jump multiple reached 22 times on April 9th.

Distribution of the VOCs in the monitored area. VOC, volatile organic compound.

Box plots of the monitoring data in the polluted areas.
As shown in area B in Fig. 4, the average concentration of the ΣVOCs in area B was between 51 μg/m3 and 577 μg/m3, which was also lower than the limits of the local standards, with peak values ranging from 358 μg/m3 to 44,563 μg/m3. There were 3 days with peak values greater than the local standard limit, but the peak concentration was much higher than the peak in area A. The peak value of the ΣVOCs jumped 7–77 times on different days, reaching 77 times. Obviously, there existed abnormal emission sources in areas A and B, and further analysis of the monitoring data is required.
Analysis of the abnormal sites and their pollution sources
Refer to the emission standards in Table 2 to screen the abnormal sites in the polluted area. During the monitoring period, a total of eight sites with abnormal peak concentrations of ΣVOCs were found, and there were two sites in area A (site b and site c) that had peak concentrations of 3,311 and 6,508 μg/m3, respectively. In area B, site d, site e, site f, site g, site h, and site j had peak concentrations of 4,427, 5,749, 6,351, 10,206, 3,931, and 44,562 μg/m3, respectively.
According to the distribution of abnormal sites, eight enterprises were selected as emission sources, and the concentration and composition of VOCs emitted by them were monitored, thus leading to the source spectrum. The eight enterprises were E-1, E-2, E-3, E-4, E-4, E-5, E-6, E-7, and E-8. The location of the abnormal site, the location of the enterprises within 3 km around the abnormal sites, and the enterprises with emission source profiles are shown in Fig. 5.

The location distribution of the abnormal sites, enterprises within 3 km around the abnormal site and enterprises with emission source profiles (for the list of enterprises, see the Appendix Table A1).
The online VOCs vehicle underway mobile monitoring system has a high-time resolution of 5 s/data, and the system can quickly monitor the instantaneous emission of the enterprise. To identify the pollution source of abnormal sites, the system monitored each abnormal site for more than 25 min and obtained no less than 300 monitoring data. Abnormal site c was selected as an example for pollution source identification and analysis, and the main average concentration of main components of site c and the source spectrum of eight enterprises were compared. Figure 6 shows that the main components of abnormal site c were xylene, toluene, n-heptane, pentane and butene; they were closest to E-7. However, correlation analysis was further used to find the correlation between these components due to the similar components of each emission source.

Comparison between the average concentration of the components at site c and the components of the source spectrum.
The correlation between the component of site c and eight source spectrums was analyzed. The results are shown in Table 3. Abnormal site c was significantly correlated with source spectrum E-5, E-6, and E-7, among which the correlation with E-7 was the highest (correlation coefficient of 0.91). Therefore, enterprise E-7 was the most likely pollution source of abnormal site c.
Correlation Coefficient Between Abnormal Site c and Each Source Spectrum (r)
Significant correlation (p < 0.05).
Significant correlation (p < 0.01).
Bold values indicate the correlation coefficient with a p-value of less than 0.01.
The correlation coefficient may be affected by one or two high values, which in turn affects the analysis results. Thus, we analyzed the ratio of the substances with the second highest concentration (n-heptane) and the third highest concentration (toluene) value in site c. The ratio of n-heptane and toluene in each source spectrum was analyzed using the same method, and the ratio of site c and the ratio of the source spectrum were compared. The results are shown in Table 4. The ratio of n-heptane/toluene in abnormal site c was 1.22, which was the same as that in enterprise E-7 and quite different from other source spectra. These data support the results of the correlation analysis from the side, that is, Enterprise E-7 is most likely the pollution source of abnormal site c.
Comparison Between the Ratio of the Second and Third Highest Substances in Site c and the Ratio of the Two Substances in the Source Spectrum
Bold values indicate the closest ratio between site c and source spectrums.
There are more than 20 enterprises within 3 km of site c, and thus there should be more than one source of site c. The correlation analysis between the components of abnormal sites and the source spectrum may affect the source identification results. Due to the sufficient amount of monitoring data at site c, the PMF receptor model was selected to further analyze the source of the abnormal site c. The source spectrum of abnormal site c was obtained through analysis, and the composition of each source was thus obtained. The source spectrum of site c was compared with the source spectrum of eight enterprises to determine whether there were other corresponding pollution sources.
Among the 305 piece of monitoring data at site c, the components with a detection rate of more than 60% were put into the PMF model as the main components, and 22 components were screened. There are four enterprises within 1 km of abnormal site c. According to the source spectrum and the requirements of the PMF analysis results, all residuals are between +3 and −3 and are normally distributed. The number of factors is greater than 2 but less than 18; Q (robust)/Q (true) <2, and only the converged solution was investigated. Thus, the number of sources was determined to be 3 or 4. The two different results were also compared and the two profiles of the resolved factors were similar to the results of four-factor analysis.
Thus, the factors were finally determined to be 3, and Q (robust)/Q (true) was 0.54. The time series comparison and scatter plot of simulation and observation results of main components are shown in Fig. 7. Most of the simulation results were relatively good; the simulation results were not ideal due to the high concentration of xylene.
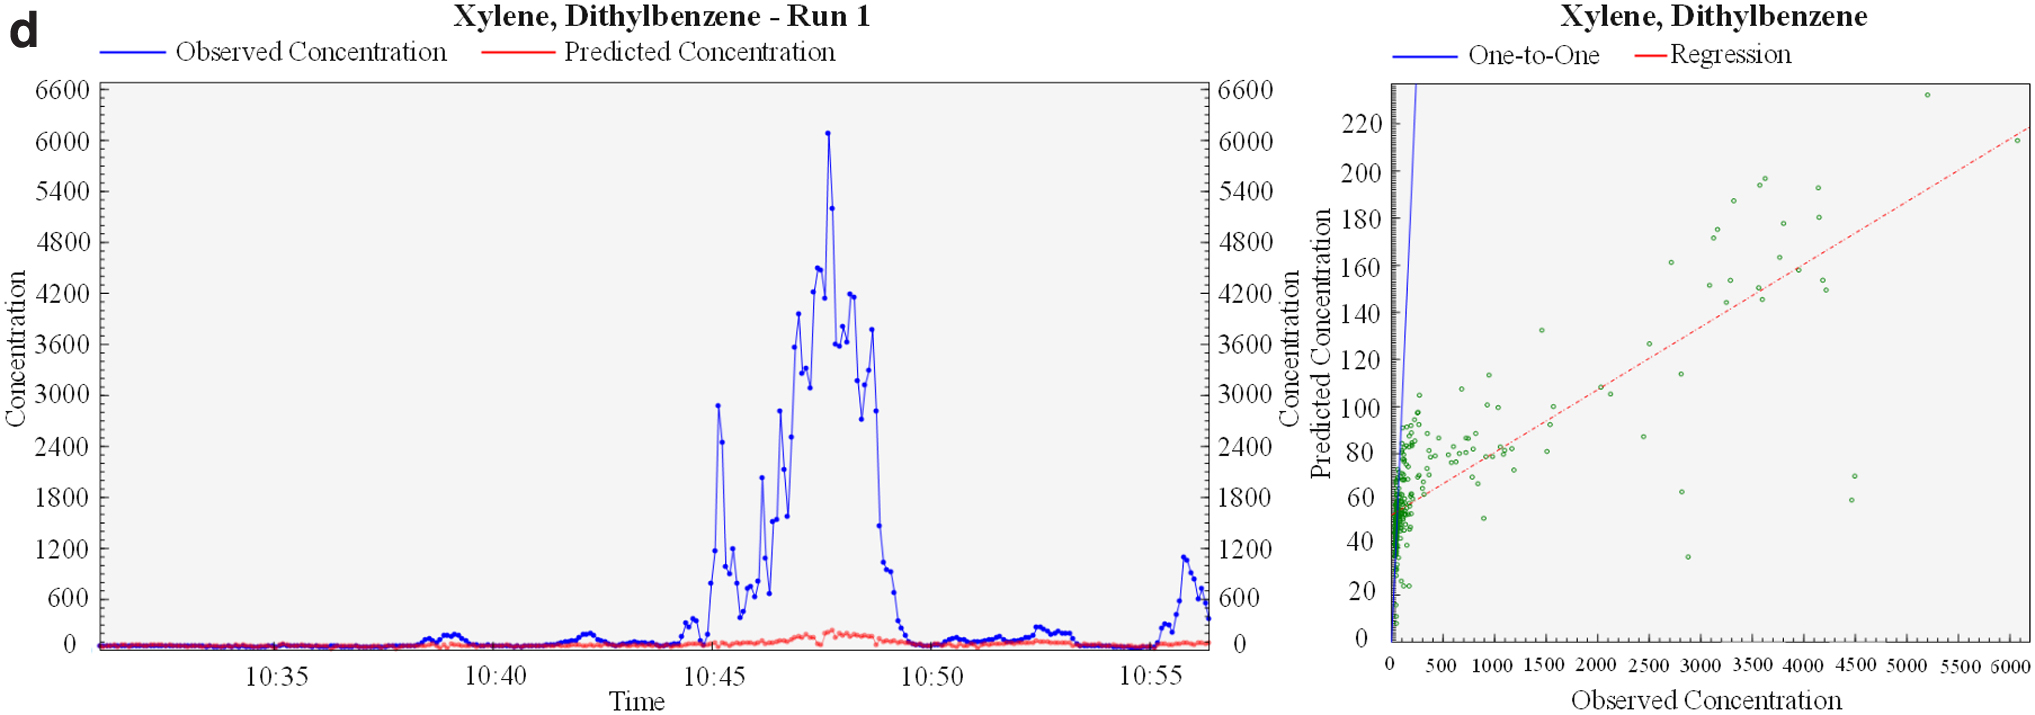
Comparisons of time series and scatter plot of VOCs concentrations between measured and calculated from the PMF for
The source spectrum of site c obtained by PMF source analysis is shown in Fig. 8. Factor 1 was mainly alkanes and xylenes, factor 2 was mainly alkanes, and factor 3 had high concentrations of xylene, diethylbenzene, toluene, and n-heptane. The correlation analysis between the source spectrum obtained (site c) by source analysis and the source spectrum of enterprise emission is shown in Table 5. The correlation between factor 1 and the source spectrum of enterprises was poor; factor 1 was mainly composed of alkanes and xylene, which are common VOCs in the air. Alkanes are inactive, and xylene is a common solvent source.

Profiles of the resolved factors from the PMF.
Correlation Coefficient Between Resolved Factors and Emission Sources
Bold values indicate highly-ranked correlation coefficient among the strong correlation between factors and the emission sources.
Therefore, factor 1 could be the background source. Factor 2 had a good correlation with the source spectrum of the E-5 enterprise, the source spectrum of the E-6 enterprise, and the source spectrum of the E-7 enterprise. They were all near site c. Factor 2 was mainly olefins, which are relatively active and should be fresh emissions; thus, the source of factor 2 was the emission of nearby enterprises. Factor 3 had a good correlation with the source spectrum of the E-3 enterprise and E-8 enterprise. They were far away from site c in the northeast, but they were similar to the composition of factor 3, thus indicating that they were also affected by transmission.
Therefore, the PMF source analysis results of site c show that the VOCs concentration of site c is affected not only by the emission of nearby enterprises, but also by the transmission of enterprises in the northeast.
Conclusion
In this study, an online mobile VOC monitoring system based on TOF MS was used to monitor VOCs in an industrial park and obtain high temporal resolution VOC distributions. A total of eight abnormal sites with peaks exceeding the standard were found through the image. The correlation between the abnormal site c and the source spectrum of the emission enterprises was analyzed. The correlation between the abnormal site c and the E-7 enterprise was as high as 0.91, which confirms enterprise E-7 as the pollution source. To accurately identify the pollution source of the abnormal site, the PMF model was further used to analyze the receptor data of the abnormal site, and three pollution sources were obtained through analysis.
These sources were then compared with the emission source of the enterprise and combined with the geographical location of the abnormal site and the emission source. The abnormal site was not only affected by the emission sources of the surrounding enterprises but also by the emission sources of the enterprises in the northeast. This fully verifies the functions of the system for rapid monitoring and pollution source identification. Based on the advantages of a high-temporal-resolution online detection of the mobile monitoring system combined with PMF, this method could quickly monitor large-scale areas in the area and dynamically and accurately identify pollution sources and reflect the pollution sources of the abnormal sites in real time.
This study provides an effective technical means for the rapid detection of VOCs pollution distributions and the efficient screening of pollution sources in industrial parks. It offers important data for efficient and precise prevention and control of VOCs pollution in industrial parks and also helps with the blue sky protection campaign.
Footnotes
Author's Contributions
Z.M., G.T., and W.G. carried out the concepts, design, definition of intellectual content, literature search, data acquisition, data analysis, and article preparation. M.L., R.W., and H.N. provided assistance for data acquisition, data analysis, and statistical analysis. Z.M., M.L., and G.T. carried out article editing. M.L. and Z.H. performed article review. All authors have read and approved the content of the article.
Author Disclosure Statement
No competing financial interests exist.
Funding Information
This work was supported by the Special Fund Project for Science and Technology Innovation Strategy of Guangdong Province [2019B121205004].
Appendix
List of the Enterprises Within 3 km Around the Abnormal Sites and the Enterprises with Emission Source Profiles
| Serial number | Name of the enterprise | Industrial category |
|---|---|---|
| 1 | Jiabangcai Chemical Co., Ltd. | Chemical industry |
| 2 | Judubang Chemical Industry Co., Ltd. | Chemical industry |
| 3 | Rufeng Automobile Sales and Repair Center | Auto repair industry |
| 4 | Yi Home Furniture Customization Co., Ltd. | Furniture manufacturing industry |
| 5 | Feng hardware products Co., Ltd. | Metal products industry |
| 6 | Hope LU Power Co., Ltd. | Energy and Power industry |
| 7 | Hete Composite Materials Technology Research Institute | Energy and Power industry |
| 8 | Xiong Lighting Products Co., Ltd. | Lighting Manufacturing |
| 9 | Chen Industrial Waterborne Paint Co., Ltd. | Chemical industry |
| 10 | Yong Metal industry Co., Ltd. | Metal products industry |
| 11 | Jiarun Chemical Co., Ltd. | Chemical industry |
| 12 | Da Furniture Manufacturing Co., Ltd. | Furniture manufacturing |
| 13 | Mei Printing & Packaging Co., Ltd. | Packaging and printing industry |
| 14 | Yanchang Gas Station | Gas station |
| 15 | Jintian Copper Co., Ltd. | Metal products industry |
| 16 | Heng Aluminum Products Co., Ltd. | Metal products industry |
| 17 | Hong Food Co., Ltd. | Food processing industry |
| 18 | Yong Cement Factory | Cement Products industry |
| 19 | Shihua Gas Station | Gas station |
| 20 | Tai Cement Products Factory | Cement Products industry |
| 21 | Balon Logistics Co., Ltd. | Logistics transportation industry |
| 22 | Oudis Industries Co., Ltd. | Other industries |
| 23 | Dahua Biopharmaceutical Co., Ltd. | Pharmaceutical manufacturing industry |
| 24 | Hengxin Material Technology Co., Ltd. | Cement Products industry |
| 25 | Shenghua Industrial Park | Other industries |
| 26 | Xingpeng Logistics Co., Ltd. | Logistics transportation industry |
| 27 | Yihua Stainless Steel Aluminum Co., Ltd. | Metal products industry |
| 28 | Baida New Material Industrial Park | Other industries |
| 29 | Wang High-tech Development Zone | Other industries |
| 30 | Zhong Chemical Co., Ltd. | Chemical industry |
| 31 | Hongqing Industrial Co., Ltd. | Leather industry and shoe-making industry |
| 32 | Sanle Construction Industrial Park | Decoration building materials manufacturing industry |
| 33 | Lisi Power Technology Co., Ltd. | Energy and Power industry |
| 34 | Wo Silicone Technology Co., Ltd. | Synthetic Rubber industry |
| 35 | Maxi Electric Technology Co., Ltd. | Energy and Power industry |
| 36 | Dongyang Aluminum Co., Ltd. | Metal products industry |
| 37 | Fushitong Elevator Industrial Park | Elevator manufacturing industry |
| 38 | Deshibao Chemical Building Materials Co., Ltd. | Chemical industry |
| 39 | Aoxue International Logistics Warehouse Co., Ltd. | Logistics transportation industry |
| 40 | Rongshibao Electronic Technology Co., Ltd. | Electronic product manufacturing industry |
| 41 | Huansheng Biotechnology Co., Ltd. | Food processing industry |
| 42 | Guanhua Food Co., Ltd. | Food processing industry |
| 43 | Dali Food Co., Ltd. | Food processing industry |
| 44 | Buer food oil Co., Ltd. | Food processing industry |
| 45 | Yibao Food Co., Ltd. | Food processing industry |
| 46 | Huatai Biotechnology Co., Ltd. | Other industries |
| 47 | Dengbao Food Co., Ltd. | Food processing industry |
| 48 | Dimai New Materials Co., Ltd. | Energy and Power industry |
| 49 | Fuhai Food Co., Ltd. | Food processing industry |
| 50 | Oudiming Optoelectronics Technology Co., Ltd. | Lighting Manufacturing industry |
| 51 | Weipinghui Logistics Park | Logistics transportation industry |
| E-1 | Bangli Building Materials Industry Co., Ltd | Decoration building materials manufacturing industry |
| E-2 | Futian Chemical Industry Co., Ltd | Chemical industry |
| E-3 | Yalu Industrial City Management Co., Ltd | Metal products industry |
| E-4 | Zhongya Aluminum Co., Ltd | Metal products industry |
| E-5 | Fuyong Aluminum Co., Ltd | Metal products industry |
| E-6 | Huifeng Industrial Co., Ltd | Energy and Power industry |
| E-7 | Xingaoli Decoration Material Co., Ltd | Energy and Power industry |
| E-8 | Biguiyuan Modern Home Furnishing Co., Ltd | Furniture manufacturing industry |