
Abstract
This study examines the influence of chlorine disinfectant type, water use frequency (stagnation time), and water heater temperature on the growth and persistence of microbes, including nontuberculous mycobacteria (NTM), in water heater storage tanks and downstream plumbing. The experimental setup consists of four 50-gallon electric water heater tanks at two different locations that provide different types of secondary disinfectant (chloramine and free chlorine). The water heaters were operated at two different temperature settings (45°C ± 3°C and 60°C ± 3°C), and with two different use patterns (once per 24 h and three times per 24 h), which allowed for sampling at three different stagnation times: overnight, 16-h stagnation, and 3-h stagnation. Microbial analyses were conducted on water samples collected at the tank effluent and the shower head to compare the water quality in the tank before the stagnation period and in the piping downstream of the tank after the stagnation period. The results indicated that culturable NTM was not detected under any of the conditions studied in the free chlorine disinfectant system. In the chloramine system, higher water use frequency (equivalent to 180 gallons/day) and higher water heater temperature (60°C ± 3°C) decreased the number of heterotrophic bacteria in the tank and the piping downstream to the tank but failed to control NTM. For both heterotrophic plate count and NTM, the piping downstream was not more microbially active than the tank.
Introduction
Hot water plumbing systems have been identified as a reservoir for microbes, particularly opportunistic pathogens (OPs), such as Legionella pneumophila (Borella et al., 2004; Buse and Ashbolt, 2011; Bédard et al., 2015) and nontuberculous mycobacteria (NTM) (Falkinham III, 2013, 2016). Mycobacterium avium and Mycobacterium intracellular are grouped together as the M. avium complex (MAC), which is a sub-species of NTM (Falkinham, 2002; Somoskovi et al., 2002). The NTM are ubiquitous in the environment, with the heaviest concentrations found in soil and water sources.
They have a predilection for biofilm adherence (Schulze-Röbbecke et al., 1992; Torvinen et al., 2004; Steed and Falkinham III, 2006) and have a lipid rich, hydrophobic cell wall, which contributes to disinfectant and antibiotic resistance (Jarlier and Nikaido, 1994; Ryan and Ray, 2004; Falkinham III, 2007). They are also reported to be resistant to high temperature and relatively resistant to low pH (Kirschner Jr. et al., 1992; Bodmer et al., 2000). The hydrophobicity of NTM results in preferential aerosolization from waters (Parker et al., 1983), which, if inhaled, could lead to adverse health issues such as pulmonary diseases, skin and joint infections among others (Wallace Jr., 1987; Falkinham, 2002; Katoch, 2004).
Reports on source waters, treatment systems, distribution systems, building water supplies, and building water supply systems such as shower heads all indicate that mycobacteria occur frequently and with increasing concentration as water moves from treatment plant effluent to points of use (Torvinen et al., 2004; Wang et al., 2012a; King et al., 2016; Lu et al., 2016; Liu et al., 2019).
It has been hypothesized that conditions that support NTM growth are also conducive to MAC growth. Concentrations of these OPs in hot water systems are driven by some of the same conditions such as long residence times, high surface area, low disinfectant residual (Rhoads et al., 2015a, 2017; Proctor et al., 2017; Haig et al., 2018; Hozalski et al., 2020; Ley et al., 2020), variable flow patterns and configurations, and favorable temperature conditions (Brazeau and Edwards, 2013; Lu et al., 2017), and they may be impacted differently by some other conditions such as the type of building supply disinfectant.
There is a growing concern of OPs in building water systems, as exposures to concentrations of OPs can lead to serious health issues (Rhoads et al., 2014; Dowdell et al., 2019; Rasheduzzaman et al., 2019; Buse et al., 2020). Some of the concerns related to NTM exposures are NTM infections and associated pulmonary illnesses that have been reported to be of particular concern for elderly and immune compromised individuals (Wei et al., 2009; Hoefsloot et al., 2013; Wassilew et al., 2016). Despite the increase in awareness of the importance of OPs (Brazeau and Edwards, 2013; Baron et al., 2014; Ley et al., 2020; Martin et al., 2020), there is a lack of a general intervention or control strategies for OPs in building water systems.
Past studies have reported factors such as water heater temperature set points and water use frequencies (Brazeau and Edwards, 2013; Rhoads et al., 2015b; Proctor et al., 2017; Ji et al., 2018; Singh et al., 2020) as measures to control OPs in hot water plumbing systems.
A water heater set point of at least of 60°C has been identified as appropriate for the control of OPs by the Department of Veterans Affairs VA (2014), and some recent studies identified 55°C to 59°C as an effective temperature range for hot water at the point of use to reduce the probability of detectable Legionella pneumophilla (Bédard et al., 2015; Rasheduzzaman et al., 2020) and elimination of NTM in water heaters (Falkinham, 2015; Lande et al., 2015).
Although elevated temperature set points have been observed to control OPs (Proctor et al., 2017; Ji et al., 2018; Papagianeli et al., 2020), they also pose an issue with increased energy usage and scalding risk. Such hot temperatures are also difficult to maintain throughout the system, which may result in areas with temperatures that are conducive to pathogen growth (Bédard et al., 2015; Beer et al., 2015; Williams et al., 2015).
High water residence time increases the likelihood and rate of disinfectant decay and has been related to amplification of OPs such as NTM (Falkinham III, 2013; Ley et al., 2020), Pseudomonas aeruginosa (Wang et al., 2012b; Charron et al., 2015), and Legionella (Hayes-Phillips et al., 2019; Buse et al., 2020; NASEM, 2020; Rhoads and Hammes, 2021). Less frequent water use has been demonstrated to support microbial growth, as has loss of chlorine disinfectant residual in both cold and hot water building plumbing systems (Ji et al., 2015; Rhoads et al., 2016; Tolofari et al., 2020).
A multivariate statistical analysis by Haig et al. (2018) revealed that greater water age (i.e., combined distribution system residence time and home plumbing stagnation time) was associated with a greater relative abundance of M. avium, one of the most prevalent NTM causing infections in humans.
The combined effect of water heater temperature set-point and use frequency as control strategies for OPs is examined. Specifically, the objectives of this study are to compare water quality in the water heater tanks with water quality in downstream pipes under higher and lower use and higher and lower temperature conditions. The study consisted of a pilot evaluation of full-scale residential water heaters that compared water quality at shower heads, water heater tanks, and the building influent supply.
Materials and Methods
Experimental setup
The experiment was set up in two different laboratories, one located in Philadelphia, Pennsylvania where the public water supply uses chloramine as a residual disinfectant and the other in Boulder, Colorado where free chlorine is used. The setup is shown schematically in Fig. 1 and consists of four newly purchased 50-gallon electric water heater tanks at each site.
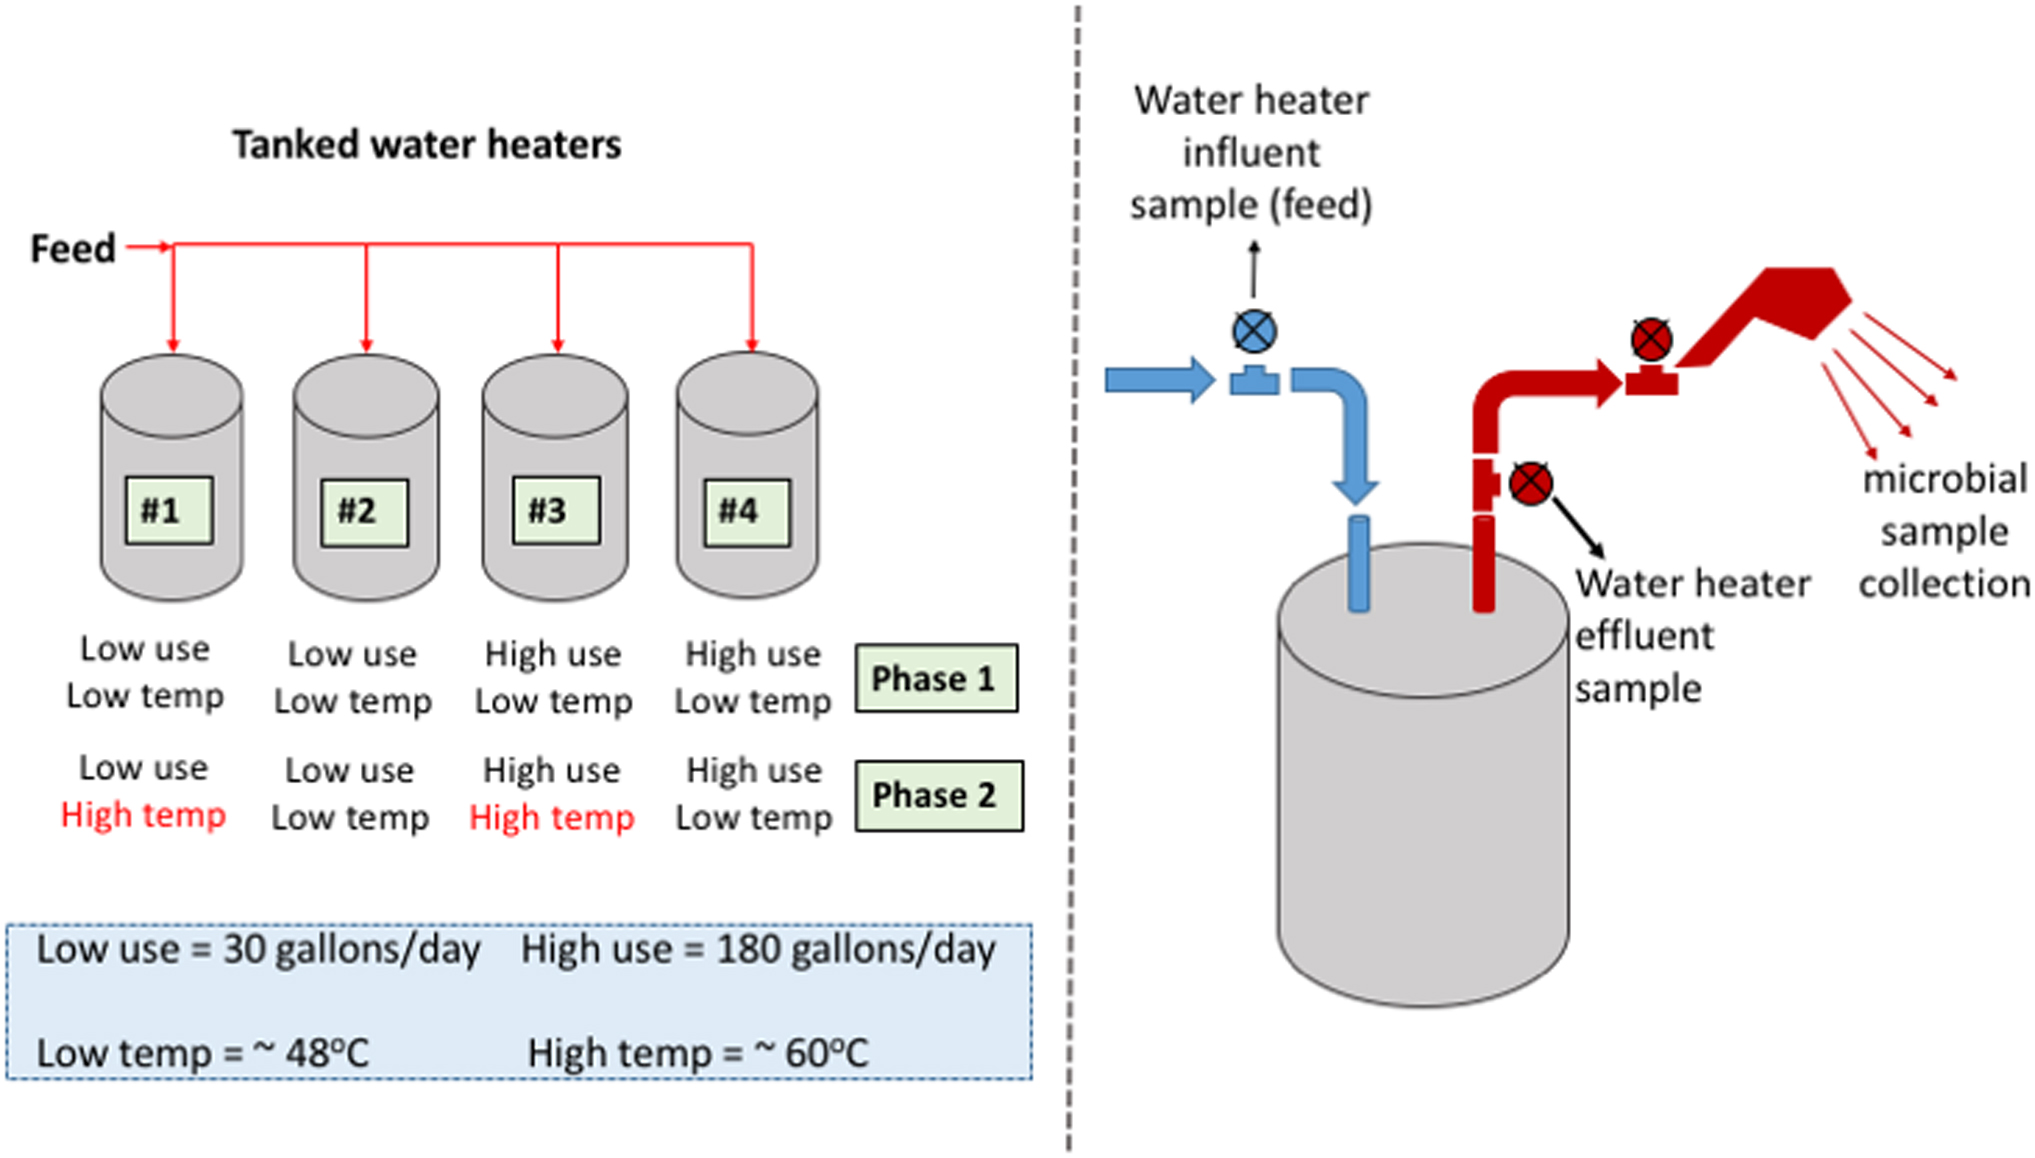
Schematic of water heater tank experiment. Right: Layout of tanks and the different water use frequencies and set temperature, left: layout of the different sample collection points.
Water source
The Philadelphia Water Department operates three conventional filtration water treatment plants supplied by the Schuylkill and Delaware Rivers. Ammonia is added after primary disinfection at dosages that provide ∼0.2 mg/L (as N) free ammonia concentration. Zinc orthophosphate is added for corrosion control.
The City of Boulder has two water treatment plants that treat water from the Middle/North Boulder Creek or the upper Colorado River via Carter Lake using dissolved air flotation and conventional filtration. Free chlorine is used for disinfection, and pH adjustment is used for corrosion control.
Water heater apparatus and design
The intake and discharge points of the water heaters were connected by using flexible hoses. The intake of the flexible hose was 12″ braided stainless steel with a flexible chlorinated polyvinyl chloride (c-PVC) inner core. The discharge was 18″ braided stainless steel with a flexible c-PVC inner core. The tank discharge point was connected with a tee push fitting adapter to split the discharge point into two. One end of the tee-push fitting was connected to a check valve (to prevent backflow and cross-contamination of the systems), a copper pipe (25 ft. long), and then a shower head where samples of the shower spray were collected. A solenoid valve was connected to the shower head with a ½ -inch tee adapter.
The other end of the tee-push fitting is connected to a flexible hose with swivels with a valve where the tank effluent samples were collected. A collection system was designed and attached for collecting the shower spray. The collection system is comprised of a funnel that was located to provide a two-and-a-half-inch air gap between the shower head and funnel and a 3 ft. long, 2-inch diameter PVC pipe that directed water to hoses that drained to a floor drain.
Water heater commissioning and operation
Water heater commissioning
Preceding operation and sampling, the water heater tanks were commissioned to remove debris and age the tanks. In Philadelphia, the tanks were filled with water, which was left stagnant for 3 months after which the samples were analyzed for microbes and drained out. In both Philadelphia and Boulder, the tanks were continuously flushed for 2 days at the hot temperature setting. The flow was stopped after 2 days and maintained at a low temperature for a week.
Water heater operation
The water heater experiment was divided into two phases based on the operational temperature as a distinguishing factor. The schematic of the tank configuration and operation is shown in Fig. 1. In Phase 1, all four water heater tanks were operated at the “hot” temperature setting (which represents a temperature of 45°C ± 3°C) for 6 months after which two of the tanks (Tanks 1 and 3) were switched to operate at the “very hot” temperature setting (which represents a temperature of 60°C ± 3°C) in Phase 2 for an additional 6 months.
Sample collection was conducted to characterize water quality before and after stagnation in the pipe downstream of the water heater. On the day before use, samples were collected from the feed (building supply) after 30 min of continuous flushing (this represents influent water from the distribution system), and from each of the four tank effluents (this represents the water condition before the different stagnation times). On the day of use, first draw samples were collected from the shower heads of each tank (these samples represent the water sitting in the pipe just before each shower head). The flow rate of the showers was 1.5 gallons per minute (gpm).
Different water use frequencies were implemented through a timer that controlled solenoid valves installed on each shower head. For the two higher use frequency tanks (Tanks 3 and 4), the valves were opened three times per day (3 cycles) for 40 min, which is equivalent to water consumption of 180 gallons per day (gpd). There was a 3-h time interval between each of the three cycles. The first cycle began at 7:30 am and stopped at 8:10 am (40 min of flushing), the second cycle began at 11:10 am and stopped at 11:50 am, and finally the third cycle began at 2:50 pm and stopped at 3:30 pm. For the two lower-use frequency tanks (Tanks 1 and 2), the valves were opened once a day (1 cycle) for 20 min, which corresponds to a water consumption of 30 gpd.
The 24-h stagnation samples were collected from the effluent of Tanks 1 and 2 (low use tanks), at 9:15 and 9:40 am, respectively, toward the end of a cycle of use, and samples were collected from the shower head at the beginning of the cycle the next day at 9:00 and 9:25 am, respectively. The 16-h stagnation (first high-use) samples were collected from the tank effluent from Tanks 3 and 4 at 3:25 and 4:10 pm, respectively and from the shower head the next day at 7:30 and 8:15 am, respectively.
The 3-h stagnation (second high-use) samples were collected from the tank effluent from Tanks 3 and 4 at 8:05 and 8:50 am, respectively, and at the shower head the same day at 11:10 and 11:55 am, respectively. This sampling approach allows the comparison of water before stagnation (the feed and the tank effluent) with water after stagnation in the pipe. It does not provide samples of water before and after stagnation in the water heater, except insofar as the feed can be contrasted with the tank effluent. This comparison is inexact, because (1) the feed on the day of sampling may vary in quality from the previous cycle's influent and (2) in both the high-use and low-use tanks, the tank effluent is a blend of feedwater and stagnant water, although the high-use tanks would have substantial feedwater and the low-use tanks limited feedwater in the tank effluent sample (per tracer study described below).
Sample collection and preservation
Samples from the tank water heater were collected every 4 weeks from September 2018 through August 2019. Samples for microbial analysis were collected in 1-liter sterile Nalgene bottles containing sodium thiosulphate to neutralize residual chlorine. Before the samples were collected, the exterior of the sample port or shower head was wiped with alcohol wipes and a wait time of 5 min was provided to allow for effective disinfection to occur and the alcohol to dry.
A total of 13 samples were collected from the water heater sample points—5 samples were collected the day before use (feed and tank effluent from each of the 4 tanks) and 8 samples on the day of use (morning shower samples from all 4 tanks, afternoon shower samples from the 2 high-use tanks, and afternoon pipe effluent samples from the 2 high-use tanks).
Microbial analysis
The analysis included a method blank and positive control for each microorganism analyzed. The samples were concentrated by using membrane filtration and were plated and cultured for NTM, Legionella spp., L. pneumophila, P. aeruginosa, free living amoeba, thermophilic amoeba, and heterotrophic plate count (HPC). Detailed microbial analyses are documented in the Supplementary Data.
Tracer studies
A tracer experiment was conducted by using a step-up tracer feed (fill) followed by a step-down (washout) tracer experiment. Sodium chloride was used as the tracer, and the experiment was conducted at a flow rate of 1.5 gpm and at two different water heater temperature settings, “hot” and “very hot.”
Physical and chemical parameters
Disinfectant residuals were determined at the time of sample collection in Philadelphia (total chlorine residual) and Boulder (free chlorine residual) by using a Hach DR 2700 spectrophotometer in both locations, based on the diethyl-p-phenylene diamine method. Water temperature and pH were determined also at the time of sample collection.
Statistical analysis
Statistical calculations were made by using R language computational software (R Core Team, 2021). Regression models for residual disinfectant and NTM concentrations were found to have non-normally distributed residuals. The HPC and NTM data were log transformed and assessed for normality by using both graphical and statistical methods. Quantile-quantile (Q-Q) plots of the residuals were plotted and analyzed, and a test of normality using the Shapiro-Wilk test was conducted where the null hypothesis of a normally distributed population was retained at p > 0.05 and rejected at p < 0.05.
To assess statistical significance, trends in the residual disinfectant and NTM data were illustrated with box plots with nonparametric methods (Kruskal-Wallis test), and a pair-wise Wilcoxon test was used for post hoc analysis where applicable.
Trends in the HPC data were less clear from the graphical methods, but in this case multivariate models were able to be successfully fit after log transforming the HPC data. The independent variables for the regression modeling were the experimental factors, which include the water heater temperature setting (hot and very hot) and the different water stagnation times (24-, 16-, and 3-h). Where applicable, categorical variables were assigned as either 1 or 0 in the regression model.
Different model formulations were examined to determine goodness of fit and predictive power. The model comparison considered Akaike Information Criterion and Bayesian Information Criterion, as these metrics appropriately tradeoff model fit and complexity. The selected model was further evaluated to determine whether the assumptions for ordinary least squares were met by examining the observed versus predicted plots, normal Q-Q plots, and residual scatter plots.
Results
Summary results for the tracer studies are reported first followed by detailed results for chlorine residuals, HPC, and NTM data. For each of these latter three parameters, tank effluent and shower results are compared for the different experimental conditions (water use frequency and temperature).
Tracer studies and residence time distribution
At the flow rate of 1.5 gpm, a tank average residence time of 33 min was calculated based on the 50-gallon tank volume. The results indicated that the fill and washout portions of the tracer studies behaved differently. The hydraulics of the tank were closer to plug flow during the early part of filling (when cold water was entering from the bottom, resulting in thermal stratification) but deviated significantly from plug flow during the washout process (once mixing removed the thermal stratification in the tank).
A plot showing the impact of temperature setting on tracer curves and temperature profiles at 1.5 gpm is available in the Supplementary Data of this study. Temperature falls sharply during tracer fill for both temperature settings (hot and very hot) and achieves a final steady temperature after about one tank volume for the hot setting and after about two tank volumes for the very hot setting. A schematic diagram showing how the tank hydraulics explained the effect of the water use frequency is also found in the Supplementary Data.
Chloramine residual (Philadelphia)
Tank versus shower total chlorine concentrations for different stagnation times
Figures 2a and b show boxplots of total chlorine measured in the feed, tank effluent, and the shower head for Phases 1 and 2, respectively. The total chlorine concentrations for the tank effluent samples were measured before the samples were allowed to remain stagnant for the different stagnation times, and the total chlorine concentrations for the shower head were measured after the different stagnation times. This is to evaluate the effect of the different stagnation times—low use (24 h), first high use (16 h), and second high use (3 h). Higher values were found in the tank effluent than in the shower.

Boxplots of total chlorine concentration in tank effluent (T) and shower (S) for
In Phase 1, the mean total chlorine concentrations in the tank and shower were 1.27 and 0.65 mg/L, respectively (significantly different by Kruskal-Wallis test with p < 0.001). In Phase 2, the mean values were 0.33 and 0.15 mg/L in the tank and shower, respectively (significantly different by Kruskal-Wallis test with p < 0.001). Per the sampling scheme described earlier, the tank concentrations can be thought of as corresponding to the influent to the shower piping and hence these values indicate the loss of residual due to decay over time. The higher values for the high-use tank reflect greater mixing of fresh feed water into the tank for the high-use samples, as well as the shorter stagnation time.
Tank versus shower total chlorine concentrations for different temperatures
Figure 2c show boxplots comparing the total chlorine concentrations for the two different water heater temperatures operated during Phase 2 of the experiment. The mean total chlorine concentrations in the tank and the shower head when the tank was operated at the hot temperature (45°C ± 3°C) were 0.35 and 0.16 mg/L, respectively, whereas the mean total chlorine concentrations for the tank and shower head when the tanks were operated at very hot temperature (60°C ± 3°C) were 0.30 and 0.14 mg/L, respectively.
There was no significant difference by Kruskal-Wallis test between the two-water heater set point temperatures for both shower and tank effluent samples, possibly reflecting the fact that the water was not held at this temperature for a long duration (i.e., the shower sample cooled in the pipe and the tank effluent sample was taken at the end of the use cycle and hence not detained in the tank).
Free chlorine residual (Boulder)
Tank versus shower-free chlorine concentrations for different stagnation times
Figures 3a and b show boxplots of free chlorine concentrations measured in the feed, tank effluent, and the shower head for both Phases 1 and 2, respectively. The boxplots show higher values in the tank than in the shower. In Phase 1, the mean total chlorine concentrations in the tank and shower were 0.32 mg/L and below detection, respectively (significantly different by Kruskal-Wallis test with p < 0.01); in Phase 2, the mean values were 0.41 mg/L and below detection, respectively (significantly different by Kruskal-Wallis test with p < 0.01). The higher values for the high-use tank reflect greater mixing of fresh feed water into the tank for the high-use samples, as well as the shorter stagnation time.
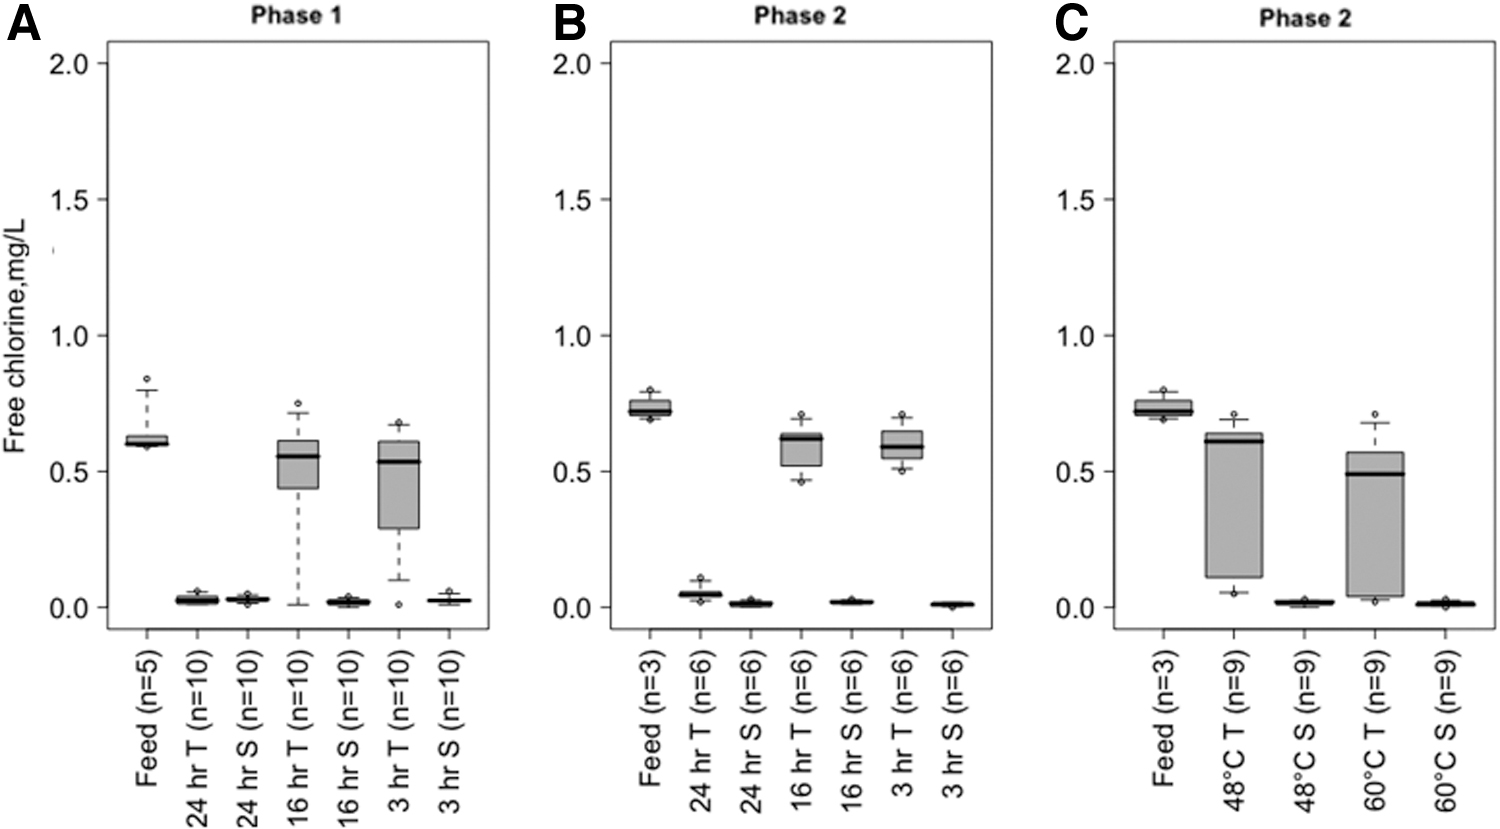
Boxplots of free chlorine concentration in tank effluent (T) and shower (S) for
The free chlorine concentration in the overnight stagnation sample was lower than the 16- and 3-h stagnation times (not significantly different by Kruskal-Wallis).
Tank versus shower free chlorine concentrations for different temperatures
Figure 3c shows boxplots comparing the free chlorine concentrations in the two different water heater temperatures (hot and very hot).
The mean free chlorine concentrations for the tank effluent and shower samples when the tanks were operated at the hot temperature (45°C ± 3°C) were 0.36 mg/L and below detection limit, respectively, and when the tanks were operated at the very hot temperature (60°C ± 3°C) the mean free chlorine concentrations for the tank and shower samples were 0.28 mg/L and below detection limit, respectively. There was no significant difference by Kruskal-Wallis test between the water heater set-point temperatures for both shower and tank effluent samples which may also be due to the fact that the temperature of the shower sample dropped in the pipe and the tank effluent sample was taken at the end of the use cycle.
Legionella spp., Legionella pneumophilla, P. aeruginosa, free living, and Thermophillic amoeba
Legionella spp., Legionella pneumophilla, P. aeruginosa, and free living and thermophilic amoeba were not detected in this study during the operation of the water heaters in both locations. However, in Philadelphia (with the chloramine disinfectant), one of the water heater tanks was put out of operation for 2 months due to some electrical failures, and the water samples tested during that period were positive for P. aeruginosa. Out of 12 samples collected, 9 were positive for P. aeruginosa and the range of concentrations were 1 CFU per 100 mL to 51 CFU per 100 mL.
After the tank was put back in service, the water sample from the tank tested negative for P. aeruginosa. This may indicate that the combination of the water temperature in the tank, and the water use frequency effectively controlled the growth of P. aeruginosa.
Heterotrophic bacteria in the chloramine system
Tank versus shower HPC for different stagnation times
Figures 4a and b show boxplots of log HPC in the chloramine system for the feed, tank, and shower samples measured in Phases 1 and 2 respectively. The plots show that the median HPC in the tank effluent was higher than the median HPC in the shower head except in Phase 1 low-use where the median concentration was higher in the shower than in the tank. Interpretation of the HPC data was complicated by the fact that overall HPC levels are higher in the feed in Phase 2, possibly reflecting lower disinfectant residual in the feed, warmer temperatures, or acclimation of the HPC to the system over time.

Boxplots of log HPC in chloramine system in tank effluent (T) and shower (S) for
As noted in the Materials and Methods section, regression models were successfully fit for the HPC data, and these models were used to identify the significant trends in the data. Table 1 shows the parameter values and significance levels for a multivariate linear regression analysis conducted on HPC data as the dependent variable, and the independent variables consisting of the water use frequency (overnight stagnation, 16-h, and 3-h), the water heater set-temperature (hot- and very hot-temperature), the sample collection point (tank effluent and shower head samples), chlorine disinfectant residuals, and the number of days elapsed in the experiment.
Regression Analysis of Heterotrophic Plate Count in Chloramine System (Philadelphia)
Reference case is tank effluent, hot temperature (45°C ± 3°C), and 16-h stagnation (first high use draw); the 3-h and overnight stagnation effects are the contrast between these conditions and 16-h stagnation; the very hot effect is the contrast between the very hot condition and the hot temperature condition; the shower effect is the contrast between the shower and tank effluent samples.
HPC, heterotrophic plate count.
The HPC concentration in the shower samples was significantly lower than the concentrations in the tank effluent samples. The lower concentration of HPC in the shower samples compared with the tank effluent suggests that the stagnation in the pipe did not allow for substantial multiplication of HPC. However, the HPC concentration in the overnight stagnation samples was significantly higher than HPC concentration in the 16-h stagnation samples, suggesting that this is not a simple dieoff as the HPC stagnate in the pipe but may reflect an initial die off of organisms not acclimated to the pipe followed by growth of organisms more acclimated to the pipe environment.
The increase in HPC with days elapsed suggests that organisms are becoming more established and developed in the pipe biofilm over the duration of the experiment as they acclimate to the specific conditions in the pipe.
A separate regression analysis for just the tank effluent found that feed HPC was a significant predictor for HPC in the tank effluent. The influence of the feed may reflect the fact that the tank effluent was sampled at the end of the use cycle when the residence time of water leaving the tank was relatively short. More detailed information on regression analyses conducted separately on the tank effluent and shower HPC data is presented in the Supplementary Data of this study.
Tank versus shower HPC for different temperatures
Figure 4c shows a boxplot of log HPC in the chloramine system in Phase 2 for the different operated temperatures (hot and very hot). For the regression analysis of the HPC samples, the 45°C ± 3°C samples were chosen as the baseline condition and the very hot temperature parameter represents the effect of increasing the temperature to 60°C ± 3°C. The effect of the higher temperature is to lower the natural log of HPC by an average of −0.77 (Table 1, p-value <0.01), which corresponds to a 54% decrease in HPC compared with the lower temperature.
NTM in the chloramine system
Multiple regression analysis was conducted on the tank effluent and shower sample NTM concentrations. However, the assumption for normality of residuals was not met, and instead a nonparametric Kruskal-Wallis test was applied to compare the medians between the experimental factors—the different sampling points (tank and the shower head), water stagnation times (overnight, 16-h, 3-h stagnation), and water heater set-temperature (hot and very hot).
Tank versus shower NTM for different stagnation times
Figures 5a and b shows boxplots of log NTM in the chloramine system for the feed, tank, and shower samples measured in Phase 1 and 2, respectively. The plots show that the median NTM in the tank effluent was higher than the median NTM in the shower samples (significantly different by Kruskal-Wallis test with p < 0.01). The difference was more pronounced in the Phase 2 high use samples. These results suggest that NTM found the water heater a more hospitable environment than the downstream pipes. There was no significant difference by Kruskal-Wallis test between the different stagnation times.

Boxplots of log NTM in chloramine system in tank effluent (T) and shower (S) for
Tank versus shower NTM for different temperatures
Figure 5c shows boxplots comparing the feed, tank, and shower NTM at the hot and very hot temperature during Phase 2 of the experiment. The median NTM concentrations in the water heater tank were lower in the hot temperature setting (45°C ± 3°C) than in the very hot-temperature setting (60°C ± 3°C), in contrast to the lower levels of HPC found at higher temperatures. However, the Kruskal-Wallis analysis on Phase 2 NTM tank effluent data indicated that the difference in the median values was not significant. Similarly, for the shower samples, the difference between the hot- and very hot-temperature was not significant by Kruskal-Wallis test.
Discussion
The growth of pathogens in premise plumbing is a great concern due to potential impacts on public health, particularly for immunocompromised individuals (Craun et al., 2010; Bédard et al., 2016; Rhoads et al., 2016). In this study, we examined how disinfectant type, residence time, and water heater temperature influence the growth and persistence of microorganisms in the tank and the piping downstream of the tank using actual electric water heater storage tanks to capture real household scenarios as it pertains to water use and heating. The key results from this study are discussed in light of the broader literature below.
Effect of influent water disinfectant type on pathogen occurrence
With frequent use and adequate disinfectant levels in the water supply, a residual could be maintained in the chloramine system. In the chloramine system, a detectable chloramine concentration was commonly maintained in Phase 1, when feed concentrations were 1–2 mg/L. When the chloramine residual declined to <1 mg/L in the feed during Phase 2, chlorine residual in the shower samples declined and was only occasionally detectable.
In contrast, detectable residual was not found in the shower or low-use tank samples for the free chlorine system during either phase of the study. This observation is in line with previous literature that indicated a more stable residual with chloramine disinfectant than free chlorine in the absence of nitrifying conditions (Sathasivan et al., 2008).
Legionella, Acanthamoeba, and P. aeruginosa were not routinely detected in either the Philadelphia (chloramine system) or the Boulder (free chlorine system). NTM was detected in the chloramine system but not in the free chlorine system. This observation is consistent with previous studies that found free chlorine to be more effective than chloramine for control of NTM (Pryor et al., 2004; Luh et al., 2008; Waak et al., 2019).
In contrast, previous literature tends to view chloramine as more effective against Legionella (Rhoads et al., 2017; Loret and Dumoutier, 2019; Wang et al., 2019). It is interesting to note that NTM was not detected in the influent sample from the distribution system in the chloramine system, but was detected in the tank and shower samples, indicating that NTM was multiplying in the system.
Effect of water use frequency and water heater temperature on microbial growth
Previous studies indicated a significant negative correlation between HPC and chlorine disinfectant, suggesting that lower concentrations of chlorine disinfectant residual may contribute to increased HPC concentrations or change the bacterial heterotrophic bacteria population present (Zhang and DiGiano, 2002; Bertelli et al., 2018; Kennedy et al., 2021). Longer stagnation time would lower chlorine residual and due to decay overtime, resulting in an increase in HPC concentrations.
This relationship was observed in this study, as significantly higher HPC concentrations were observed in higher stagnation time samples. Also, earlier studies suggest that shorter stagnation time increases the risk for OP regrowth and is an important factor to be considered for strategic control of OPs (Brazeau and Edwards, 2013; Ji et al., 2017). However, shorter residence times were not successful in controlling NTM growth as NTM was higher in the high-use tank than in the low-use tank (although not by a statistically significant amount).
The NTM may have also benefited from the greater delivery of nutrients and carbon to the biofilm of the high-use tank, and decreased competition for these resources to NTM, as a result of high chloramine disinfectant levels removing ecological competitors to NTM (Norton et al., 2004; Falkinham, 2009; Donohue et al., 2015; Falkinham III, 2016; Waak et al., 2019).
A study by Ji et al. (2018) that employed a lab-scale recirculating hot water plumbing rig to compare the pre- and post- heat shock microbiotas at distal taps indicated that heat shock did lead to decreased total bacteria numbers at distal taps. However, it did not measurably alter the richness or evenness of the microbiota. They concluded that water heater temperature set-point and water use frequency are more promising factors for long-term microbial community control. The effect of temperature was observed in the HPC data, as lower HPC concentrations were observed in the very hot temperature tanks (60°C ± 3°C).
In contrast, higher water heater temperature was observed to increase the survivability of culturable NTM in the tank. Earlier studies reported NTM to be thermotolerant and capable of multiplying at 42°C (Torvinen et al., 2007), but these results suggest the tolerance of temperatures up to 60°C. Although the increase with temperature was not significant, the fact that there was not a decline is noteworthy. Also, tracer studies indicated incomplete mixing and short circuiting of cold water is very likely to have occurred during tank use periods. This observation shows the importance of looking at the entire system when evaluating NTM control strategies.
In summary, the conventional control strategies of greater frequency of use and higher temperature were successful in reducing HPC concentrations. In contrast these measures did not control NTM and may even have been counterproductive. This highlights the difficulties in controlling NTM, a slow growing organism that is highly resistant to environmental challenges and hence may be favored by conditions that reduce general HPC counts. Although HPC may provide some general information as to the level of microbial activity in a system, it does not appear to be an appropriate indicator for NTM.
Is the piping downstream of the tank more microbially active than the tank?
The results show loss of residual, both total and free chlorine, in the pipe downstream from the water heater, but the results do not show enhanced levels of heterotrophic bacteria or NTM in the piping downstream of the tank. In some conditions (Phase 2 low-use for NTM, most conditions for HPC), the HPC and NTM levels were comparable in the tank and in the downstream pipe. In circumstances in which there was a clear difference, the water heater tank samples had higher microbial levels than the downstream pipes.
Although degradation of microbiological water quality in the pipes does not appear to have been a concern in this system, it can be in other systems (Bédard et al., 2015; Rhoads et al., 2015b). Rhoads et al. (2015b) found microbial growth in recirculating systems where temperatures may be maintained for long time periods at levels favorable for microbial growth. In contrast, the hot water distribution pipes in this study would have cooled fairly rapidly to room temperature after each use. Recirculating systems are of great importance as they are widely used, particularly in environments with vulnerable populations such as hospitals and assisted living facilities.
Nevertheless, the results of this study indicate that with relatively regular use (daily or more frequent) microbial quality was not found to deteriorate in a common, nonrecirculating distribution system.
Conclusion
This study provided a head-to-head comparative analysis of the impact of water use frequency, and water heater temperature on water quality in storage tanks and the piping downstream of the tank for two different water sources. The key findings from this study are summarized as follows:
The presence of NTM in the chloramine system under all temperatures and use patterns studied support the adaptability of NTM in these environments. In contrast, NTM was not found in the free chlorine system under any of the conditions studied. Legionella, P. aeruginosa, and Acanthamoeba were not detected under all conditions studied in both the free and chloramine systems. However, P. aeruginosa was detected in the chloramine system when one of the tanks was out of service and was not detected when the tank was back in service. Higher temperature (60°C ± 3°C) and higher water use equivalent to 180 gpd reduced heterotrophic bacterial growth in the tank and the piping downstream of the tank. In contrast, higher temperature increased NTM counts in the tank, although not by a statistically significant amount. For heterotrophic bacteria and NTM, there was no indication that the piping downstream of the tank was more microbially active than the water heater tank.
Footnotes
Authorship Confirmation Statement
Conceptualization, D.L.T., P.L.G., T.B., S.V.M., C.N.H., M.O., and M.D.B; experiment and methodology, D.L.T., M.D.B., T.B., and S.V.M; statistical analysis, D.L.T., P.L.G., T.B., S.V.M., and C.N.H; writing—original draft preparation, D.L.T; writing—review and editing, D.L.T., T.B., S.V.M., M.D.B., C.N.H., M.O., and P.L.G; visualization, D.L.T., and T.B; supervision, P.L.G; funding acquisition, P.L.G., C.N.H., and M.O.
Acknowledgments
The authors would like to thank Randi McCuin for her expertise and valuable contributions toward the experimental efforts, especially with the microbial analysis.
Author Disclosure Statement
No competing financial interests exist.
Funding Information
This research was developed under Assistance Agreement No. R836880 awarded by the U.S. Environmental Protection Agency. It has not been formally reviewed by the EPA. The views expressed in this article are solely those of the authors and do not necessarily reflect those of the Agency. The EPA does not endorse any products or commercial services mentioned in this publication.
References
Supplementary Material
Please find the following supplemental material available below.
For Open Access articles published under a Creative Commons License, all supplemental material carries the same license as the article it is associated with.
For non-Open Access articles published, all supplemental material carries a non-exclusive license, and permission requests for re-use of supplemental material or any part of supplemental material shall be sent directly to the copyright owner as specified in the copyright notice associated with the article.