
Abstract
In recent years, microplastics (MPs) and trihalomethanes (THMs) in drinking water have attracted widespread concern. In this study, bottled water (BW) samples from India were evaluated for both THMs and MPs, and their health risks were assessed. Forty-four samples of BW of 18 brands were tested and THMs were detected in all 44 BW samples tested. At least 1 THM was quantified in 20 BW samples, and all 4 THMs were found in 7 BW samples. The concentrations of chloroform (CHCl3), bromodichloromethane (CHBrCl2), dibromochloromethane (CHBr2Cl), and bromoform (CHBr3) were in the range of 234.8 ± 711.9, 243.3 ± 734.4, 162.7 ± 540.6, and 446.4 ± 1,042.3 ng/L, respectively. The total measured THM concentration ranged from 0.033 to 12.27 μg/L. MP particles ranged in size from 1 to 30 μm, were found in all tested samples, and were identified as either polypropylene or polyethylene terephthalate. The count and corresponding weight of MPs ranged between 20 ± 5 to 127 ± 35 particles/L and 56 ± 14 to 355.6 ± 98 mg/L, respectively. Monte Carlo simulations (50,000 iterations) were done to estimate the chronic daily intakes (CDI) of THMs and MPs, as well as the THM-associated cancer risk (CR) through ingestion of BW. The average CDI of THMs was 1.64 × 10⁻⁴ ± 6.29 × 10⁻⁵ mg/(kg·day) and the associated CR ranged from a minimum of 4.89 × 10⁻⁷ to a maximum CR of 1.9 × 10⁻⁵. The CDI for MPs was 7 ± 2.61 mg/(kg·day), resulting in a yearly intake of 153.3 g. THMs were detected in BW samples even though they had not been chlorinated. Overall, the quantitative information provided through this study has major implications for the consumption of BW with plastic packaging.
Introduction
With increasing awareness of the importance of safe drinking water, the demand for bottled water (BW) has grown exponentially in the last few decades across the globe. This may be due to consumer perception that BW is of better quality and taste than tap water. Indeed, in 2019, more than 111 billion gallons of BW was consumed worldwide, with India as one of the leading consumers along with the United States and China (Rodwan, 2020). Notably, the Indian BW market witnessed a compound annual growth rate of 7.4% between 2014 and 2019. In India, BW is categorized as either packaged drinking water (PDW) or natural mineral water (NMW). PDW is more common as it is prepared from local water resources, employing basic water purification methods. NMW, on the other hand, relies on spring water and generally involve minimal treatment (Stanhope et al., 2020).
Trihalomethanes (THMs) are a prominent class of disinfection byproducts (DBPs), which include trichloromethane or chloroform (TCM, CHCl3), bromodichloromethane (BDCM, CHBrCl2), dibromochloromethane (DBCM, CHBr2Cl), and tribromomethane or bromoform (TBM, CHBr3). They are generally formed in tap water when chlorine is added as a disinfectant.
The U.S. Environmental Protection Agency (EPA) classifies TCM, BDCM, and TBM as probable and DBCM as possible human carcinogens (IRIS, 2021). They have been positively associated with various cancers, cancer mortality, and reproductive abnormalities (Min and Min, 2016; Zeng et al., 2016). Recently, BW has been reported to contain DBPs as well as harmful impurities such as plasticizers and potentially toxic metals at concentrations exceeding the drinking water quality standards prescribed by the USEPA (Ikem et al., 2002; Dippong et al., 2020; Li et al., 2021). For example, Stanhope et al. (2020) detected THMs in spring/mineral BW at concentrations up to 30 μg/L. These concentrations were several times higher than the International Bottled Water Association standard of quality (IBWA SOQ = 10 μg/L) for total THMs (TTHMs).
Compared to trace metals and organic contaminants, the occurrence of THMs in BW is scarcely discussed in the scientific literature. For instance, a Scopus search in June 2021, using “bottled water” and “trihalomethanes” as the keywords, showed only six studies from the past decade on the occurrence and distribution of THMs in BW, with no study addressing Indian BW. This is probably because of the general perception that BW is not chlorinated and therefore is not likely to have THMs (Ikem, 2010).
Apart from chemical impurities, recently BW has been reported to contain harmful microplastics (MPs) as well (Oßmann et al., 2018; Schymanski et al., 2018; Shruti et al., 2021). Similar to the case of THMs, presence of MPs in Indian BW is also scarcely investigated. In terms of packaging, BW is mainly stored in bottles made of polyethylene terephthalate (PET), polycarbonate (PC), or high-density polyethylene (HDPE), while their caps are made of HDPE, low-density polyethylene (LDPE), or polypropylene (PP) and MPs can seep into BW from either the bottle or cap. Despite various efforts to keep water clean and safe, there is always the possibility of contamination during different stages of production and packaging.
Therefore, the objective of this study was to evaluate the presence of THMs and MPs in BW commonly sold in Indian markets. Results of this evaluation were used to predict the chronic daily intake (CDI) by ingestion of both these contaminant groups by drinking BW. Furthermore, human health risk through exposure to THMs was determined using the USEPA risk assessment guidelines. The quantitative information provided through this study has important implications for drinking water treatment, monitoring, and regulations.
Materials and Methods
Sample collection
In this study, 44 BW samples from 18 different brands were procured between January 2020 and March 2020 from local markets, cafes, and railway stations of West Bengal. Based on availability, BW from 13 brands was acquired in triplicate from 3 different manufacturing batches, while the remaining 5 were single bottles. For ease of identification, each bottle was labeled as BWN.n, where N is the brand number (N = 1, 2 … 18) and n is the bottle number within the brand (n = 1, 2, 3). Sample code, manufacturing date, shelf life, price, and treatment methods of the collected BW samples are summarized in Supplementary Table S1.
Two out of the 18 brands were NMW, while the rest were PDW. All the bottles were made of transparent single-use PET. Details of the treatment processes listed in Supplementary Table S1 were collected from the packaging labels or the website of the respective brand. The collected samples were stored immediately at 4°C for further analysis.
Analytical methods
Total organic carbon (TOC) in all samples was measured using a TOC analyzer (Aurora 1030; OI Analytical). The bromide ion concentration was measured using an ion chromatography (ICS 2100; Thermo Fisher Scientific, Austria). Total and free chlorine were measured using an N, N-diethyl-p-phenylenediamine (DPD)—pocket colorimeter (DR 300; Hach)—immediately after opening the BW sample.
Trihalomethanes
Analytical standards for each THM were obtained from Sigma-Aldrich and a 1,000 mg/L mixed stock solution was made in methanol for further dilution. Aqueous working standards were made daily before analysis in ng/L range. Samples for THM analysis were transferred into 40 mL amber colored volatile organic analyte (VOA) vials immediately after opening the BW and were stored at 4°C until analyses. The VOA vials were immersed in 1% HNO3 solution overnight, double-rinsed with ultra-pure water, and finally oven-dried at 100°C before transferring the samples. All samples were analyzed within 24 h of collection using a gas chromatograph (GC) equipped with an electron capture detector (Trace 1300 with Ni63 ECD; Thermo Fisher Scientific, Austria). Preconcentration of the samples was achieved by a purge and trap (P&T) unit (Lumin; Teledyne TekMar).
The USEPA 501.1 method was adapted with some modification (USEPA, 1979). Nitrogen (99.9% purity; Echo Gas) at the rate of 1.2 mL/min was used as carrier gas. The inlet and detector temperature were 265°C and 300°C, respectively. The oven temperature program of the GC system was 3°C for 1 min, 31–40°C at 1°C/min, 40–200°C at 80°C/min, and 200°C for 2 min. The P&T unit program was an 11-min purge followed by a 1-min dry purge, 2-min desorb, and 2-min bake. Quality check standards of 50 and 10 ng/L were made daily from 1 mg/L mixed standard in THM-free water and were run periodically.
While analyzing the samples, a compound that was detected (peak appeared in chromatogram) with a concentration below the quantification level (BQL) of the instrument was considered “present,” whereas a compound that was not detected was recorded as “absent (0).” The retention time of each THM and limits of quantification of the GC system are shown in Supplementary Table S2.
Microplastics
The analysis of MPs in BW was done in two steps: (1) detection and counting of MPs through fluorescence microscopy and (2) characterization of MPs through Attenuated Total Reflectance-Fourier Transform InfraRed (ATR-FTIR) analysis. Triplicates of the first 16 BW brands (BW1.1–BW16.1) were first treated with a strong oxidizing agent (H2O2 + Fe) to remove organic matter as it may affect the count of MPs due to its staining properties with dye (Prata et al., 2019).
Twenty microliters of water from each treated sample was then dropped onto a glass slide after vortexing it for homogeneous mixing. It was then stained with a few drops of a lipophilic fluorescent dye called Nile Red (at a concentration of 0.5 ppm in acetone) and allowed to dry. The slide was then viewed under a fluorescence microscope (Motic BA400). Dye adsorbed onto the surface of particles fluoresced when irradiated with orange-red light (excitation wavelength: 534–558 nm and emission wavelength: >590 nm) (Maes et al., 2017; Lv et al., 2019; Ranjan et al., 2021). Natural Organic Matter (NOM) and other contaminants can be easily tagged by a fluorescent dye and can interfere with the results for MPs (Vermeiren et al., 2020; Ranjan et al., 2021).
Therefore, Milli-Q water was used as the sample blank, while counting MPs as it is free from NOM. The MP particles were viewed and counted, and their sizes were measured. After visualization of MPs, BW samples were filtered through 0.22 μm cellulose membrane filter papers (Whatman) to filter out particles to characterize the grade of MPs. An FTIR spectrophotometer coupled with an ATR (Nicolet 6700; Thermo Fisher Scientific, Waltham, MA) was used to determine the absorbance values in the spectra range of 4,000–650 cm−1 and the result obtained was visualized and collected using OMNIC™ software (Thermo Fisher Scientific, Waltham, MA).
Data analysis and modeling
Bromine incorporation factor of THMs
To understand the formation of brominated DBPs, previous researchers have suggested the use of indices such as bromine incorporation factor (BIF) and bromine substitution factor (BSF) (Srivastav et al., 2020). BIF is the molar ratio of the concentration of brominated compounds in a given DBP class to the total DBP concentration and BSF is the molar ratio of the concentration of brominated compounds to the total brominated and chlorinated DBPs in a given class (Srivastav et al., 2020). By definition, both these indices are equal for the class THMs as they consist of chlorinated or brominated DBPs only.
These indices along with bromide-chloride ratio of the feed water help researchers to understand the patterns of DBP formation. BDCM, DBCM, and TBM are the three brominated THMs (Br-THMs) in increasing order of their bromine content. It is important to assess Br-THMs as they pose higher health risks than chlorinated THMs (Hua and Reckhow, 2012; Min and Min, 2016; Srivastav et al., 2020). To check the extent of Br-THMs in BW, the BIF was calculated as follows (Hua and Reckhow, 2012):
For this calculation, the concentration of THMs was considered in μM. The BIF value obtained by this calculation represents the amount of Br-THMs for each BW. BIF varies between 0 (all TCM) and 3 (all TBM) based on the concentration of each THM. The highest possible BIF values for BDCM only, DBCM only, and TBM only are 1, 2, and 3, respectively. In general, if a BIF value is equal to 1, it implies that BDCM is the predominant species in the water sample (Hua and Reckhow, 2012).
CDIs and cancer risk assessment
Three exposure routes of THMs to the human body as per the USEPA risk assessment guidelines are ingestion, inhalation, and dermal adsorption (USEPA, 2019). Studies on the introduction of MPs into human body also consider the same exposure routes (Rahman et al., 2021). In this scenario, only the first route is conceivable as consumers seldom consider BW for showering, personal hygiene, and house cleaning. The daily intake of THMs through ingestion of BW was predicted using the following formula (USEPA, 1980):
where CDIing is the chronic daily intake of ith THM (mg/[kg·day]), Cw,i is the concentration of THM (μg/L), IR is the daily ingestion rate (L/day), EF is the exposure frequency (days/year), ED is the exposure duration in years, CF is the conversion factor from μg to mg, BW is the body weight (kg), and AT is the averaging time (days).
The CDI was calculated for lifetime exposure (ED and AD corresponding to life expectancy) by assuming BW as the main drinking water source. Input parameters of Equation (2) such as body weight and AT were chosen to fit the Indian population. Ingestion rate (IR), exposure frequency, and duration were decided by referring to previous studies as well as the USEPA report (Table 1).
Parameters and Values Used in the Exposure Model for Calculating Trihalomethane/Microplastic Chronic Daily Intake and Cancer Risk
Values are adjusted as per Indian Council of Medical Research for Indian population, wherever applicable.
Triangular distribution (minimum, median, and maximum).
BDCM, bromodichloromethane; DBCM, dibromochloromethane; MPs, microplastics; TBM, tribromomethane; TCM, trichloromethane; THM, trihalomethane.
It is well established that THMs cause various cancers. Therefore, the route-specific cancer risk (CR) of THMs through BW was assessed. The result of THM CDI estimation was used for the same. The equation to calculate the THM CR is as follows (USEPA, 1980):
where CRing is the cancer risk thorough ingestion route and CSFi is the cancer slope factor of ith THM, (mg/[kg·day])−1. The CSF value of each THM is the slope of dose–response curve of the same (Table 1).
The value of parameters in Equations (2) and (3) are prone to uncertainty. A widely acknowledged approach to address this issue is to consider a triangular distribution (with minimum, median, and maximum) for the values. By doing so, biases with possible outliers can be minimized (Chowdhury et al., 2020). To ensure the reliability and accuracy of computational exposure models, the USEPA recommends probabilistic methods, such as Monte Carlo or Bayesian modeling tools (USEPA, 2019), for daily intake as well as risk assessments. In this study, Monte Carlo simulations were done using Companion in the Minitab® software (Minitab, Inc., 2009) to predict the CDI of both THMs and MPs, as well as the CR of THMs through ingestion of BW.
For this, a total of 50,000 Monte Carlo simulations were carried out, assuming triangular distributions for parameters in Equations (2) and (3) (Table 1). Furthermore, the toxicological additivity assumed in computational exposure assessments is prone to uncertainty. However, these models have been widely used in previous risk assessment studies (Chowdhury, 2013; Kumari and Gupta, 2018; Ahmed et al., 2019; Chowdhury et al., 2020; Kujlu et al., 2020; Tovar et al., 2020; Mosaferi et al., 2021).
Equation (2) can be used to calculate the daily intake of any contaminant that has an entry through ingestion of BW. Therefore, the daily intake of MPs was assessed using the same equation by assuming BW as the main drinking water source. However, MP particles are usually represented as counts (number of particles) and not as mass, which is one of the input parameters of Equation (2). The conversion of counts to mass of MP particles was addressed in a recent study (Senathirajah et al., 2021). In this study, a dataset of various publications that report both count and mass of the MP particles was created to calculate the average weight of MPs.
The MPs were arranged into two categories in the database: (1) pairs of minimum number of MP particles and minimum mass of MP particles and (2) pairs of maximum number of MP particles and maximum mass of MP particles, in the aquatic environment. These were further sorted based on MP particle size and then grouped into two: (1) particles of size 0–1 mm and (2) particles of size 1–5 mm. The average mass of one PP or PET MP particle that comes under the first category of size (between 0 and 1 mm) was found to be 2.8 × 10⁻³ g. The findings of Senathirajah et al. (2021) were adopted to calculate the mass of MPs in BW samples, and it was then used in Equation (2) to calculate the MP CDI.
Results and Discussion
In the shops, the BW was stored at room temperature or refrigerated. In some cases, they were exposed to direct sunlight. Compared to PDW, NMW was at least three times more expensive. Many bottles lacked information about source, detailed treatment process, and mineral composition data, despite displaying the words “added minerals” on their labels. Except BW 11, no other BW mentioned chlorination as a treatment, whereas ultraviolet (UV), reverse osmosis (RO), and ozonation were the most common treatment methods.
TOC analysis revealed the extent of NOM present in BW (Supplementary Fig. S1); TOC varied between 0.011 and 1.013 mg/L. This concentration is within the range of TOC of relatively clean water, which is 3 mg/L as per previous studies (Ikem et al., 2002). Bromine (as bromide ion) is ubiquitous at concentrations up to 3 mg/L in natural waters (Hua et al., 2021). The bromide ion concentration in BW ranged from 0.092 to 1.27 mg/L. These concentrations are similar to bromide concentrations in river water as well as ground water in this region, which ranged from 0.28 to 0.58 and 0.42 to 0.49 mg/L, respectively (Mohanta and Goel, 2016). No free or total chlorine was observed in any of the BW samples tested, indicating the lack of chlorination during the treatment as shown on the labels.
Occurrence of THMs
The representative chromatogram of 4 THMs is shown in Supplementary Fig. S2 and the observed THM concentrations in all 44 BW samples are listed in Supplementary Table S2. At least one THM was detected in all BW samples, and all four THMs were present in seven bottles. TCM was the most common THM (in 42 bottles), followed by DBCM (in 22 bottles), TBM (in 15 bottles), and BDCM (in 13 bottles). Among the BW, which had at least one THM above minimum quantification limit (MQL), both TCM and TBM were the most common compounds (13 bottles) followed by BDCM (11 bottles) and DBCM (9 bottles).
The concentration variation of THMs is shown in Fig. 1. TBM had the highest concentration among all THMs, that is, 4,816.6 ng/L in BW1. The TTHM concentration ranged from 32.9 to 12,274.7 ng/L and the highest recorded TTHM concentrations were from three bottles of the same brand (BW2). Two bottles (BW2.2 and BW2.3) exceeded the IBWA SOQ by at least 1.89 μg/L. For comparison, a summary of all previous studies that analyzed BW samples for the presence of THM is presented in Table 2. These results show that THM concentrations in Indian BW samples were consistent with those observed at other locations. All these studies showed standard deviations that were greater than their average values. This is expected as THM concentrations of different brands are different as they all have diverse sources and treatment processes.

Box plots of individual and TTHMs. Only the samples with concentrations above MQL of the instrument are plotted. The line at 10 μg/L indicates the IBWA SQL for TTHMs. IBWA, International Bottled Water Association; IQR, inter quartile range; MQL, minimum quantification limit; SQL, standard of quality limit; THM, trihalomethane; TTHM, total THM.
Comparison of Trihalomethane Concentrations in Worldwide Bottled Water with the Ones in Indian Market
Italics are to show that this data is for the present study.
THM concentration represented either as mean ± standard deviation or as minimum to maximum.
When analyzed after 3 months of storage period. No THM was detected when checked immediately after purchasing.
ECD, electron capture detector; GC, gas chromatograph; LLE, liquid-liquid extraction; MS, mass spectrometry; MSD, mass spectrometry detector; ND, not detected; NIA, no information available; P&T, purge and trap; SPME, solid phase microextraction.
Presence of THMs even in the nonchlorinated BW samples may be due to (1) the presence of THMs in the source water, which can be of natural origin or due to pollution, and (2) formation due to chlorine addition during or after production from BW treatment units; this can happen from routine cleaning and disinfection of units and premises. It is common in India to clean and disinfect using calcium hypochlorite powder (MoHFW, 2016).
Natural formation of TCM has been demonstrated by Hunkeler et al. (2012) with the help of stable carbon isotope (δ13C). With δ13C, it is possible to differentiate between TCM formed by reaction with NOM versus TCM from industrial (methane derived) source, even if the compound undergoes some changes during transport in groundwater. Subsequently, Hunkeler et al. (2012) detected naturally formed TCM in groundwaters of Denmark at mg/L levels. Another study that indicated the natural origin of THM found 1,600 ng/L of TCM and trace level TBM in a pristine aquifer that is far away from industrial areas (Laturnus et al., 2000). TCM and BDCM concentration in soil layers of relatively undisturbed forests of the Netherlands also prove the same (Hoekstra et al., 1998).
The soil microcosm experiment conducted by Weigold et al. (2016) on soil samples of Schoenbuch wildlife park, Germany, confirms the natural formation of TCM and TBM. After a 1-h incubation of soil samples, they observed the emission of 2.8 ± 0.2 μg/kg dry weight of TCM and 3.4 ± 0.3 μg/kg dry weight of TBM. Weigold et al. (2016) attribute this phenomenon to microbial activity in high organic carbon containing soils leading to the production of THMs. Furthermore, several other organisms such as certain fungi, basidiomycetes, algae, and termites are known to produce THMs naturally (Laturnus et al., 2002; Huang et al., 2014; Field, 2016; Atashgahi et al., 2018). Interestingly, a group of redwood ant (Formica spp.) nests was found to have an elevated amount of THMs, especially TCM in their nest soil and gas.
The TCM concentration was ∼3-fold higher than the atmospheric concentration and 28- to 70-fold higher compared to its main geogenic origin, that is, volcanic emissions (Berberich et al., 2017). As a result, THMs have been detected in BW, ground water, and untreated drinking water at various locations. Ground water in England and Wales from four aquifer groups had all four THMs within the range of 3.7–155 μg/L (Manamsa et al., 2016). Similarly, the presence of THMs (n = 14, 0–1.95 μg/L) in nonchlorinated tap water samples from Cape Cod also indicates their occurrence at source (Bradley et al., 2021). These results are similar to the results of our study. Besides natural occurrence, THM pollution of source is also possible. THMs can be included in volatile halogenated hydrocarbons (VHCs), which are widely used in pesticides.
A study examining Chinese agricultural soils (n = 112) for the presence of VHCs observed that 99.11% of total samples tested were contaminated with TCM at an average concentration of 2.99 ng/g dry weight (Lin et al., 2020). As agriculture is one of the largest sectors contributing to the Indian economy, the presence of pesticides in soil is inevitable, and therefore, this can be another source of TCM occurrence in the groundwater. Introduction of THMs through source water is avoidable only with continuous monitoring and improved treatment units.
BIF was calculated for 19 bottles, which had at least 1 THM above MQL (Fig. 2). Twelve of them had BIF values >1, signifying the domination of Br-THMs at high quantities. Seven bottles had BIF = 3 (only TBM was quantified) and two samples (BW 12.2 and BW 17) had BIF = 0 (only TCM was quantified). In general, % bromine incorporation into THMs at neutral pH was seen as decreasing with longer reaction times. Also, both pH and temperature of the water sample had little impact (Hua and Reckhow, 2012). However, this can be expected only if free residual chlorine is present in the aqueous media to react with the precursors. Therefore, a longer storage time of BW samples, which have no free residual chlorine, may not have any significant impact on the existing Br-THM concentration.
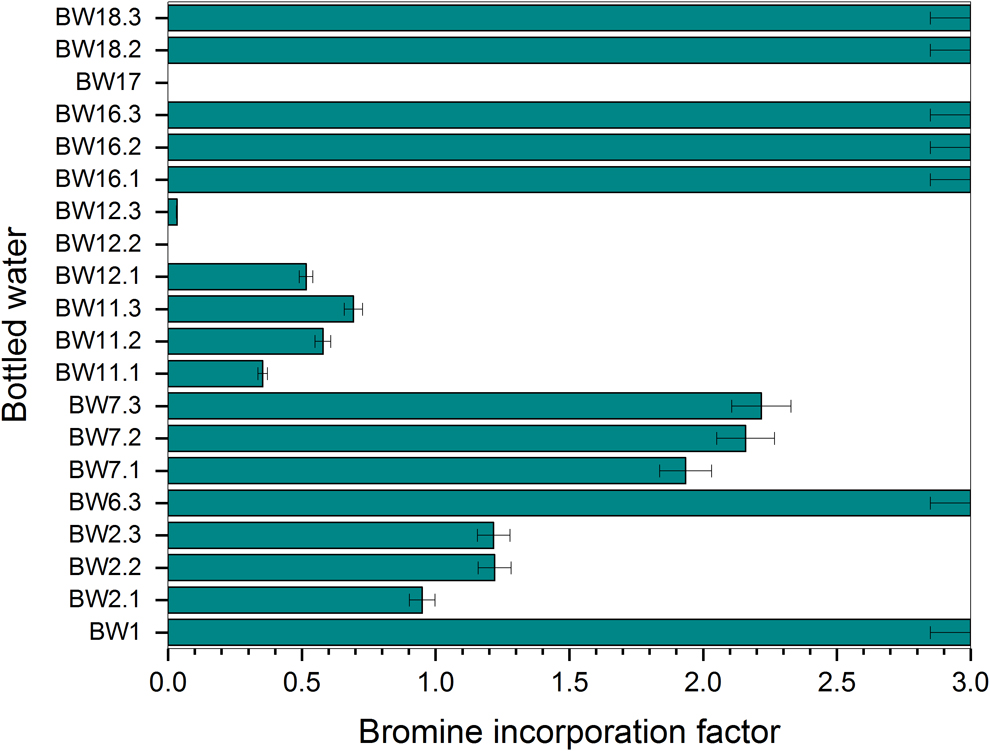
Extent of brominated THMs in bottled waters.
Occurrence of MPs
The MP particles were viewed under a fluorescence microscope with 200 × magnification (Fig. 3). MPs were found in all 16 BW samples tested. The sizes of the MPs varied between 1 and 30 μm. The count of MP particles detected in each BW sample is shown in Fig. 4. A minimum of 20 ± 5 to a maximum of 127 ± 35 particles per liter were found in each of the BW samples. Most of the MPs appeared to be of spherical shape, or thin, long fibers, or of flaky nature.

Microscopic views of fluorescent-tagged MPs found in bottled water samples. MPs, microplastics.
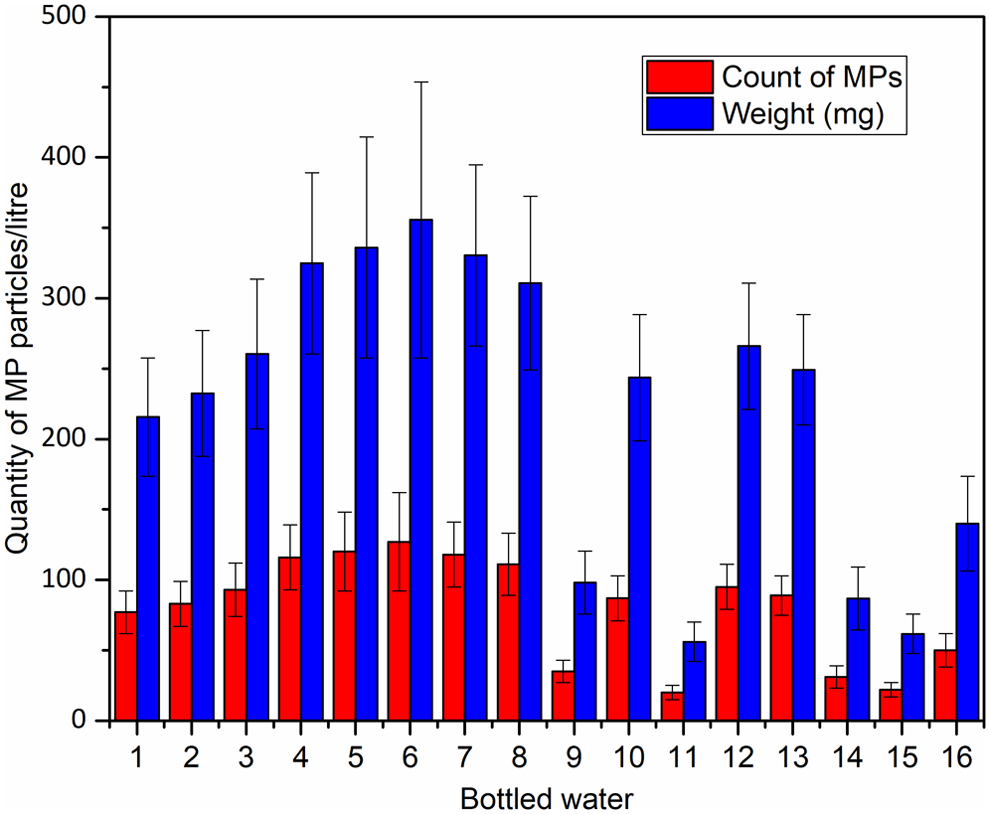
Count and weight of MP particles present in bottled water samples. The numbers on X axis represent the bottled water samples. Weight per liter of the sample was calculated based on the count of particles.
Particles filtered out from each BW were then analyzed and characterized by FTIR analysis to identify the type of plastic present in the water in the form of MPs. Figure 5a and b show the FTIR spectra obtained for the MP particles detected in various BW samples, which were identified as PP and PET. These sample spectra were compared with the spectra of standard reference samples available in the library of OMNIC software to check the compatibility and characteristic peaks. It also satisfied the condition that a minimum of four absorption bands of the sample spectra match the reference spectra. Samples were scanned between the 4,000 to 650 cm−1, and new characteristic peaks were analyzed in that region. The bands at 2,916 and 2,866 cm−1 can be attributed to −CH stretch of all hydrocarbon constituents in polymers (Fig. 5a).
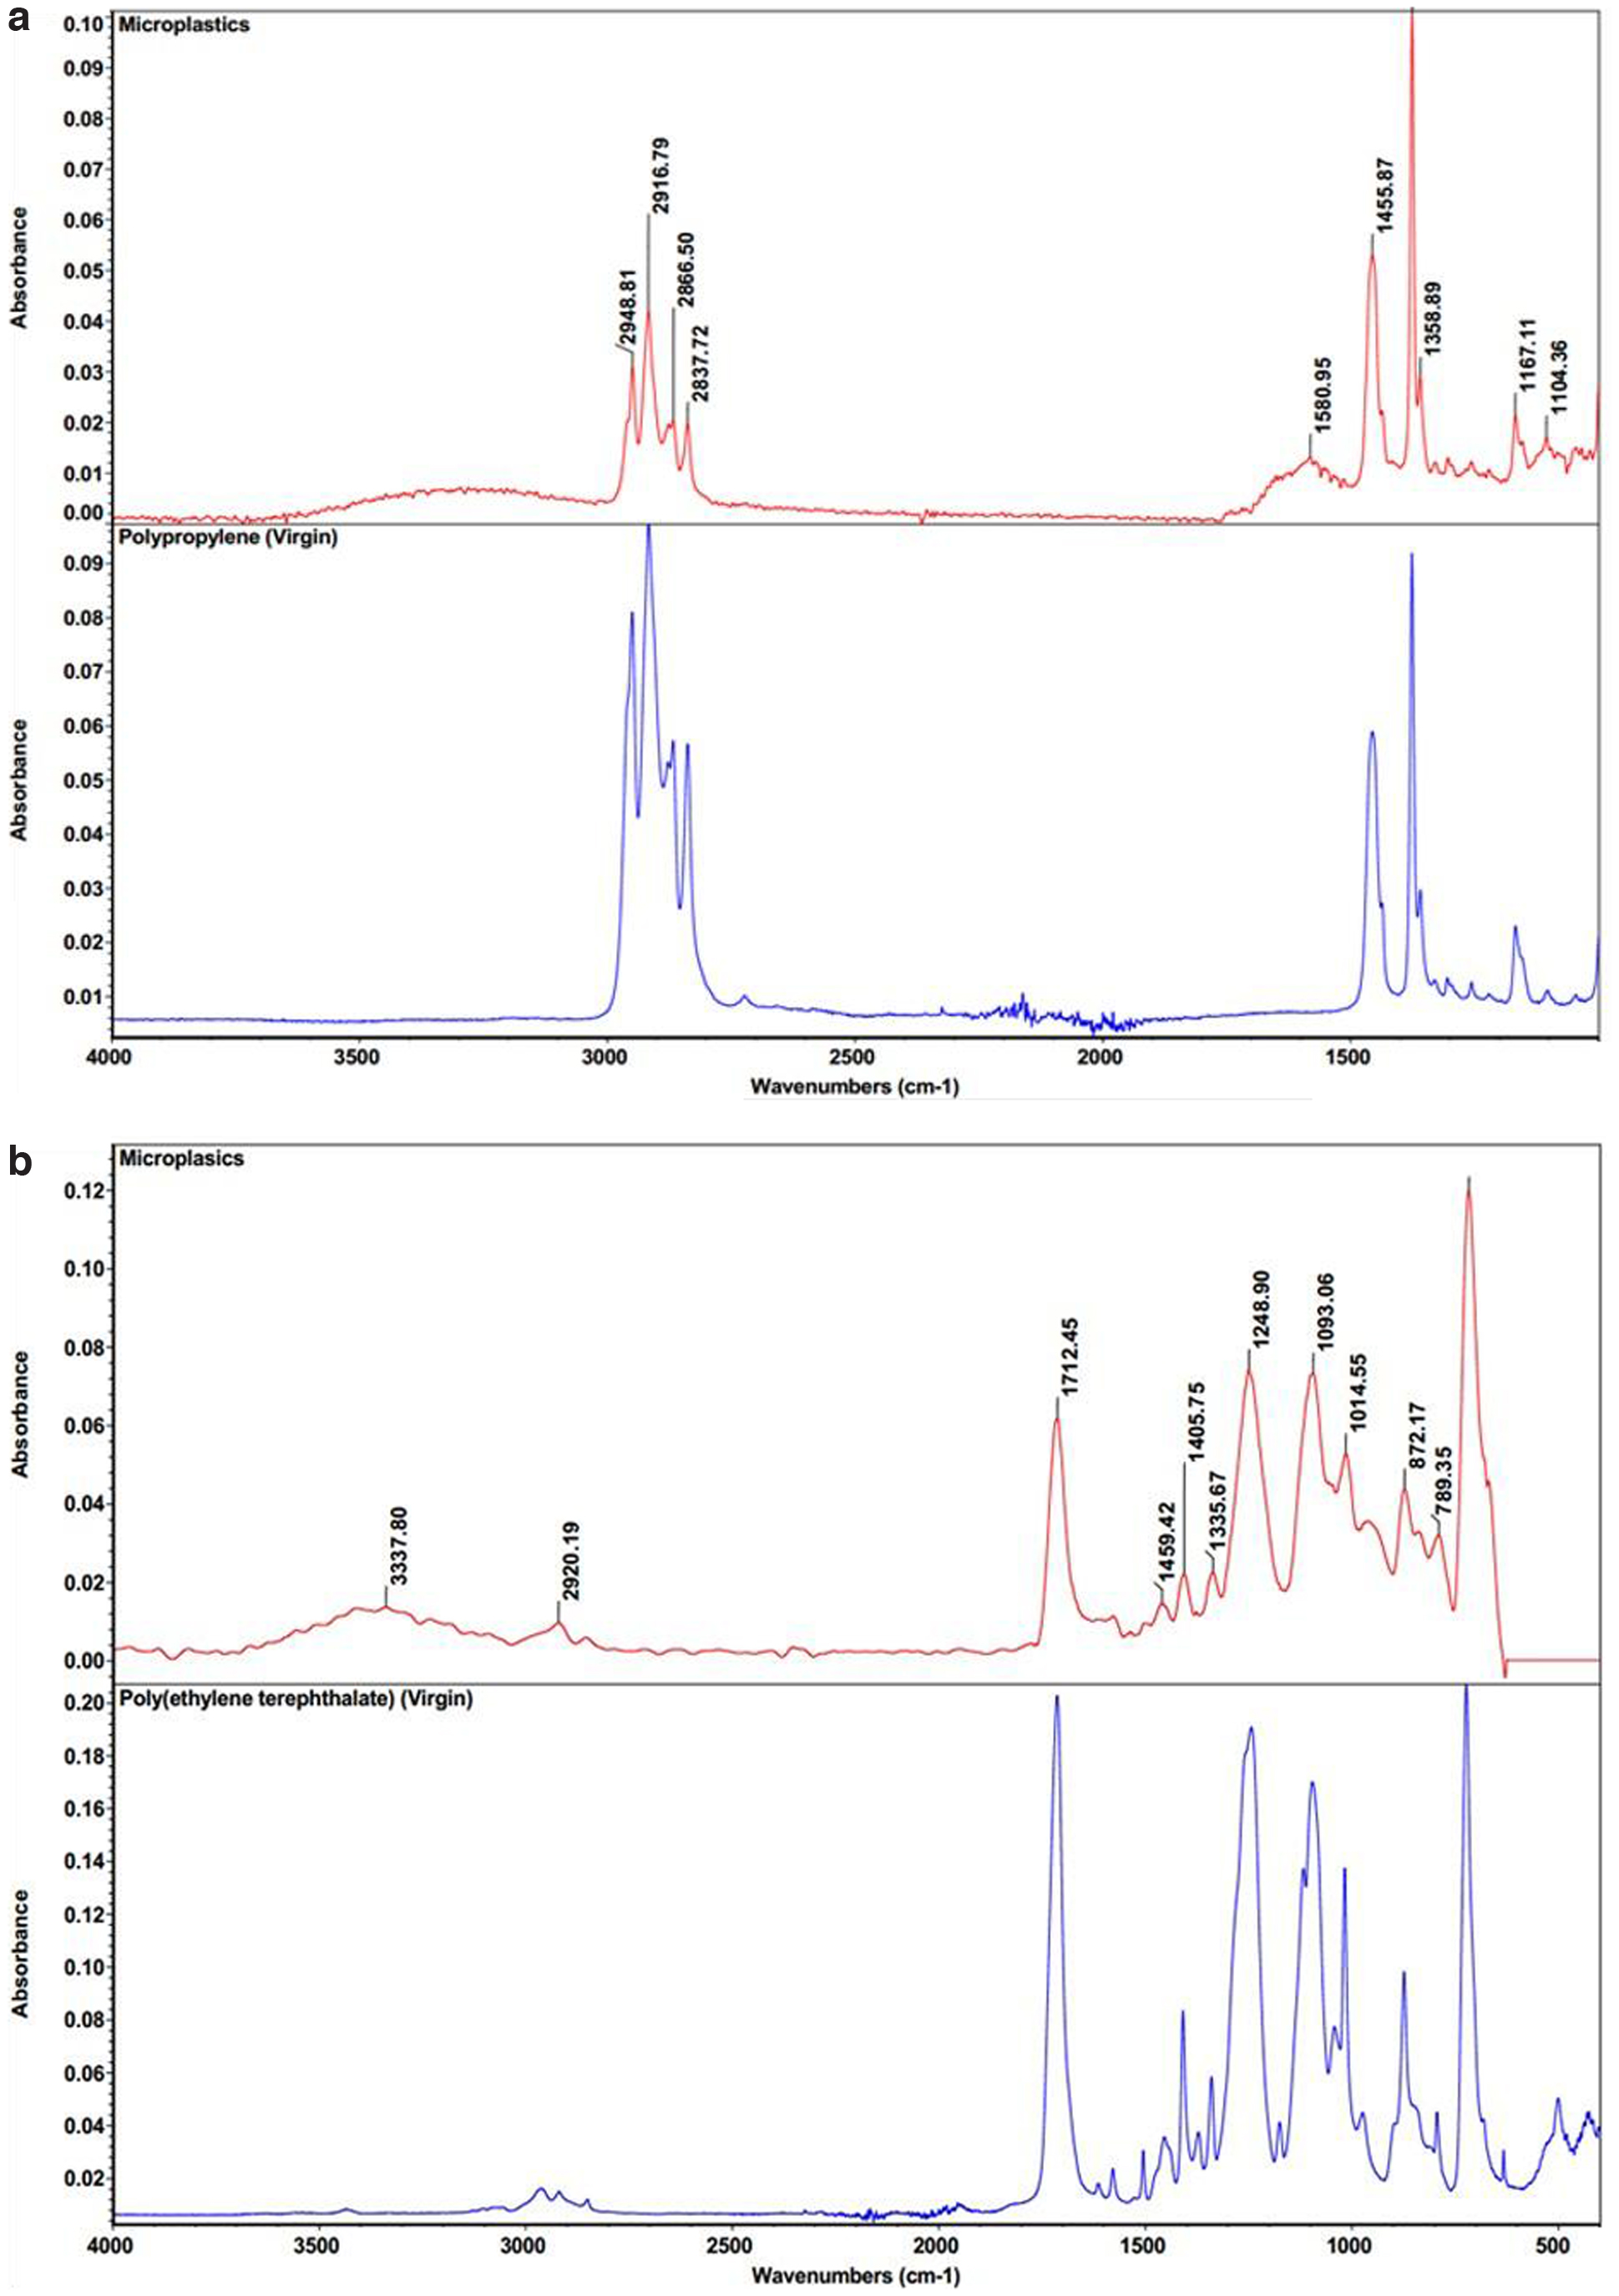
The peaks located at 1,456 and 1,475 cm−1 correspond to −CH2 and −CH3 bend, respectively. The absorption peaks at 1,713 cm−1 correspond to C = O stretch, while the absorption band at 1,241 and 1,095 cm−1 can be attributed to C − O stretch (Fig. 5b), which match closely with the characteristic peaks of a standard reference sample of PET. Identification of all the particles on filter paper was not possible due to particles being missed and destroyed during the handling of samples with tweezers and the inability to visualize MPs with the naked eye. The number of PET particles was greater than the PP particles in all bottles. The bottles were made of PET and the caps are generally made of PP and these are the most likely sources of PET and PP particles in water (Schymanski et al., 2018).
Their relative abundance in BW is also comparable to the water contact surface area with each substance. Water in BW sample is indeed in contact with the PET bottle than its PP cap. Furthermore, the thermal stress developed due to multiple opening and closing of the cap and squeezing of bottles during transportation and handling are possible reasons for the release of MPs from the bottle (Winkler et al., 2019). Weathering of MPs depends on the grade of the plastic (in this case, PET and HDPE) and medium in which plastic is exposed. In this study, the BW samples are continuously exposed to freshwater, which allows some fraction of UV rays to fall onto the surface and cause photodegradation.
Thermal stress may develop in plastics due to variations in temperature. In West Bengal, from where the samples were collected, the temperature varies from 50°C at daytime to 26°C at night in the summer season (Ranjan and Goel, 2021). The stresses developed in the bottle can weaken the chemical bonds of the plastic and help in the release of MPs (Ranjan et al., 2021). At many sample locations (shops), BW was kept at room temperature or even under direct sunlight, and thermal stress on the plastic bottle or cap may have led to the release of MPs.
Daily intakes and CR through ingestion of BW
Monte Carlo simulations of THMs daily intake assessment showed a total CDI of 1.64 × 10⁻⁴ ± 6.29 × 10⁻⁵ mg/(kg·day) for TTHMs through ingestion of BW. Among individual THMs, TBM had the highest CDI (6.14 × 10⁻⁵ ± 3.7 × 10⁻⁵ mg/[kg·day], followed by BDCM (3.95 × 10⁻⁵ ± 2.52 × 10⁻⁵ mg/[kg·day]), TCM (3.42 × 10⁻⁵ ± 2.33 × 10⁻⁵ mg/[kg·day]), and DBCM (2.91 × 10⁻⁵ ± 1.9 × 10⁻⁵ mg/[kg·day]). This trend was expected as in most of the bottles, the greatest contribution to TTHMs was from TBM.
Calculated CDI of THMs was used for the prediction of CR through ingestion of BW. For better understanding, the CR of THMs was categorized into four groups: acceptable (CR <10−6), low risk (1 × 10⁻⁶ ≤ CR <5.1 × 10⁻⁵), high risk (5.1 × 10⁻⁵ ≤ CR <10−4), and unacceptable (CR ≥10−4). Individually, the CR for each THM ranged from negligible to acceptable low risk with mean CR for TCM being 2.09 × 10⁻⁷ ± 1.42 × 10⁻⁷, BDCM being 2.45 × 10⁻⁶ ± 1.56 × 10⁻⁶, DBCM being 2.45 × 10⁻⁶ ± 1.60 × 10⁻⁶, and TBM being 4.85 × 10⁻⁷ ± 2.92 × 10⁻⁷ (Fig. 6a).

The 5th and 95th percentiles of CR due to TCM were 3.62 × 10⁻⁸ and 4.83 × 10⁻⁷, BDCM were 5.04 × 10⁻⁷ and 5 × 10⁻⁶, DBCM were 4.96 × 10⁻⁷ and 6 × 10⁻⁶, and TBM were 1.18 × 10⁻⁷ and 1 × 10⁻⁶, respectively. Evidently, BDCM and DBCM posed higher risk followed by TBM and TCM. Ingestion of BW caused a total minimum CR of 4.89 × 10⁻⁷ and a maximum of 1.9 × 10⁻⁵, which is acceptable to low-level risk. This indicates that the ingestion of THMs in BW may cause cancer in ∼2 out of 100,000 people. The 5th and 95th percentiles of total CR were 2 × 10⁻⁶ and 1 × 10⁻⁵, respectively, with a mean of 5.59 × 10⁻⁶ ± 2.46 × 10⁻⁶.
The sensitivity analysis of the model was carried out using the “sensitivity analysis tool” of the software Companion by Minitab (Supplementary Fig. S3). Among the various parameters, the concentration of DBCM and BDCM (CwDBCM and CwBDCM), IR, and AT was found to make more difference to the total CR than the rest of the input parameters of Equations (2) and (3). A 5% increase in DBCM concentration (CwDBCM) increased the minimum total CR from 4.89 × 10⁻⁷ to 5.32 × 10⁻⁷.
The CR caused by THMs through ingestion of BW tested in this study is similar to the BW samples of Turkey, where the risk was found to be acceptable (CR <1 × 10⁻⁶) (Genisoglu et al., 2019). When compared with tap waters, a THM concentration up to 484 μg/L and a subsequent ingestion of CR up to 2.57 × 10⁻⁴ have been reported from some of India's water treatment plants (Kumari and Gupta, 2018). The relatively lower concentrations of THM in BW can be considered safe from a THM perspective.
However, conventional water treatment plants use chlorine for disinfection and lack modern facilities to remove THM precursors or THMs formed after chlorination. Although BW is generally not chlorinated and is manufactured using some of the best water purifying techniques, it still has measurable quantities of THMs. Interestingly, CR due to ingestion of THMs from point-of-use purifiers (ion exchange and RO) was found to be within the “acceptable to low-risk” level (Kujlu et al., 2020), which is similar to that of BW. THMs have been regulated in tap water for many years, which is not the case with BW. Therefore, there is a need for stringent monitoring of THMs in BW regardless of their origin.
The size of MP particles in BW was found to be within 30 μm. As per Senathirajah et al. (2021), these particles are in the first group for weight determination, that is, within 0–1 mm. Therefore, each of the MP particles was considered equivalent to 2.8 × 10⁻³ g and the corresponding total MP weight was calculated for all the tested BW samples. The weight of MPs in various BW samples varied from 56 ± 14 to 355.6 ± 98 mg/L (Fig. 4). A triangular distribution of the same with the minimum, medium, and maximum weights of MPs was then used as the input concentration (Cw,i) in the CDI assessment (Table 1).
Monte Carlo simulations of CDI of MPs showed a minimum of 1.120 mg/(kg·day), maximum of 18.90 mg/(kg·day), and mean of 7 ± 2.61 mg/(kg·day) (Fig. 6b). At this degree of exposure, a human of 60 kg can have a lifetime (70 years) intake of ∼10.731 × 10⁶ mg (10.7 kg) and a yearly intake of 1,53,300 mg (153.3 g) of MPs through drinking BW. This observation is made by considering BW as the only source of drinking water, and therefore it is limited to only such cases. However, MPs have been detected in various water sources and beverages; hence, in reality, the intake might be even higher. Globally, it is found that on average, a human takes approximately 11,845–193,200 MP particles per year with the largest source being drinking water (Senathirajah et al., 2021).
Although there is a huge intake of MPs, human physiological systems can expel a great amount of it through excretion. Twenty particles of MPs (mostly PE and PP ranging in size between 5 and 500 mm) were found in every 10 g of stool, indicating their removal by excretion (Campanale et al., 2020). Human excretory system can remove up to 90% of microplastics and nanoplastics ingested, but the time required for removal may vary from hours to days. Therefore, the impacts of MPs can be considered a factor of how long they stay in the human body or in the body of other organisms.
In animal studies, the presence of PP in pet food was seen to stimulate the immune system and to enhance the potential hypersensitivity in cats and dogs. Likewise, eye contact with PET resulted in blurred vision and production of tears (Zhang et al., 2019). In a recent toxicokinetic modeling study, MPs of 5 and 20 μm were found to bioaccumulate in the guts of mice. The bioaccumulation factor for 5 μm MPs was estimated to be ∼8 (Yang et al., 2019). Other persistent organic pollutants may also have high bioaccumulation factors as MPs are known to act as “host” to a variety of contaminants. Human exposure to MPs can be through ingestion, inhalation, or dermal contact of food/drinks, air, dust, personal care and cosmetic products, and textiles. To date, it is unclear how MPs affect human bodies.
However, their sublethal effects on other organisms need to be taken seriously. The smaller particles and microfibers in drinking water are considered to have greater cytotoxicity to human cells than larger particles. Long-term exposure to MP-contaminated BW may increase human health risks (Kankanige and Babel, 2020). Moreover, the potential of these MPs to adsorb both organic and inorganic compounds and increase their bioaccumulation potential and toxicity to exposed organisms is a serious concern.
Conclusions
The presence of THMs and MPs in Indian BW has been confirmed in this study. TTHM concentrations varied from 0.033 to 12.274 μg/L with a mean concentration of 1.087 ± 2.77 μg/L among 44 bottles of 18 brands. Two bottles exceeded the IBWA SOQ for TTHMs and Br-THMs were predominant in all the bottles. In addition, MP particles were also detected in 16 BW samples. The count (maximum 127 ± 35 particles), size measurements (0–30 μm), weight (maximum 355.6 ± 98), and grades (PET and PP) of MPs in each BW sample were found. Most of the particles identified were of PET grade as the BW is in constant contact with the PET bottle rather than the PP cap. THMs in these BW samples may be of natural origin as they were detected even in nonchlorinated PDWs and NMWs.
Daily intake assessments of both THMs and MPs showed that significant amounts of both these contaminants can be ingested through BW over a lifetime. CR associated with the intake of THMs varied from 4.89 × 10⁻⁷ to 1.9 × 10⁻⁵, indicating that up to 2 out of 100,000 people are at risk due to cancer. Technologies such as adsorption using activated carbon or carbon nanotubes, UV treatment, and ultrafiltration can remove THMs from water. The BW manufacturing units equipped with the combination of reverse osmosis, ozonation, and microfiltration had the least amount of THMs. Units that lacked microfiltration, but had reverse osmosis and ozonation were found to contain THMs.
Therefore, a combination of these technologies can efficiently remove THMs before packing and shipping the bottles. However, the lack of regulatory specifications regarding THMs in BW remains the main issue. The quantitative information provided through this study has important implications for drinking water treatment and highlights the need to review water quality regulations for BW to include emerging contaminants.
Availability of Data and Materials
The datasets used and/or analyzed during this study are available from the corresponding author on reasonable request.
Footnotes
Acknowledgments
Authors thank Dubey Ravish, Saumyajit Sarkar, and Kola Rajesh for their support in sample collection and analysis.
Authors' Contributions
N.P.: conceptualization, design of study, THM analysis, modeling, Monte Carlo simulation, and writing—original draft; V.P.R.: sample collection, MP analysis, and writing—original draft; S.G.: design of study, supervising, and writing—review, editing, and correspondence; S.C.: supervising and writing—review and editing. All authors read and approved the final article.
Author Disclosure Statement
The authors declare that they have no competing interests.
Funding Information
This research received no specific grant from any public/commercial funding agencies.
References
Supplementary Material
Please find the following supplemental material available below.
For Open Access articles published under a Creative Commons License, all supplemental material carries the same license as the article it is associated with.
For non-Open Access articles published, all supplemental material carries a non-exclusive license, and permission requests for re-use of supplemental material or any part of supplemental material shall be sent directly to the copyright owner as specified in the copyright notice associated with the article.