
Abstract
Point-of-use household water filters (POU filters) are increasingly used to protect consumers from lead in drinking water, but there have been anecdotal reports of premature failure due to clogging when iron is present. To evaluate this concern in relation to lead removal and treatment costs, POU pitcher filters were exposed to water conditions containing lead and/or iron and tested to 100% of their rated capacity or until they clogged. Iron levels above the 0.3 mg/L Secondary Maximum Contaminant Level (SMCL) resulted in rapid clogging, affecting both treatment costs and consumer satisfaction. At 0.3 mg/L iron (Fe), half of the six POU filters tested clogged prematurely between 38% and 68% of the rated capacity. At 1.0 mg/L Fe, four out of six POU filters tested clogged prematurely, and all clogged prematurely at 20 mg/L.
When considering the cost of using POU filters versus purchasing bottled water, the POU filters were often more cost-effective when iron levels were ≤0.3 mg/L. Bottled water occasionally became more cost-effective than POU filters when iron levels increased. The presence of iron seldomly affected overall lead removal in this research; however, clogging greatly affected the cost of using POU filters and was an understandable source of customer frustration.
Introduction
Point-of-use household water filters (POU filters) have the potential to provide consumers with a cost-effective drinking water alternative to protect themselves from lead exposure (Verhougstraete et al., 2019). The performance of POU filters is tested and certified by the NSF International/American National Standards Institute (NSF/ANSI). Lead (Pb) and iron (Fe) removal by POUs are measured using prescribed protocols, which ensure health protection (NSF/ANSI 53) and the esthetic quality of water (NSF/ANSI 42) (NSF International, 2019a, 2019b).
In conjunction to certification, the consumer appeal, convenience, and/or practicality of these POU filters is evidenced by the number of consumers voluntarily purchasing these devices. The proportion of consumers reporting POU use increased from 32% in 2002 to 43% in 2015 and is projected to rise (Cartwright, 2007; Cotruvo, 2015). Between 2011 and 2015, about 6% of bottled water consumers switched to POU filters partly due to environmental concerns regarding plastic waste (Cotruvo, 2015).
In recent decades, high-profile water lead contamination incidents have resulted in widespread public distribution of lead-certified POU filters to protect consumers from lead exposure (Cohn, 2004; Bosscher et al., 2019; Koeske, 2019; Tuser, 2019). Following the distribution of POU filters during the 2015 Flint Water Crisis, public concern was expressed regarding the efficacy of the devices. In response, the U.S. Environmental Protection Agency (EPA) conducted a field study with ∼240 homes that determined POU filters successfully reduced water lead concentrations to below 3 μg/L even with influent Pb concentrations up to 4,080 μg/L Pb (Bosscher et al., 2019).
However, in 2019, the New Jersey Department of Environmental Protection requested that the City of Newark test POU filter effectiveness at three homes expected to represent worst-case scenario lead concentrations within the city (CDM Smith, 2019). Using samples that were believed representative of water after stagnation in lead service lines, POU filters in two out of the three homes did not produce lead levels below the 10 μg/L NSF/ANSI 53 standard requirement. A more comprehensive study in Newark later revealed that 97.5% of homes (n = 198) with properly installed and maintained POU filters had effluent lead levels below 10 μg/L (CDM Smith, 2019; Lytle et al., 2020). However, the publication of the preliminary results with high lead created widespread distrust and caused many residents to discontinue using their POU filters.
Recent laboratory studies have investigated and highlighted additional situations in which POU filters did not perform up to expectations (i.e., reducing lead levels below 10 μg/L) when tested with synthetic lead particulate waters (Deshommes et al., 2010; Pan et al., 2020, 2021; Purchase et al., 2020; Doré et al., 2021). The practical performance of these devices for consumers has also been unsatisfactory for some residents, based on anecdotal reports of premature filter clogging in waters with high iron.
The current certification performance testing for lead removal does not explicitly consider the role of co-occurring iron or other contaminants with regard to premature clogging or lead removal efficiency (NSF International, 2019b). However, it is not illogical to hypothesize that lead removal efficiency might sometimes be associated with iron removal. In 2015, Masters and Edwards documented an association between particulate iron and lead in the tap water of some residential homes.
This investigation evaluated limitations of POU filter performance when iron and lead co-occur in drinking water, including possible impacts on lead removal efficiency and premature clogging. In this three-phase study, we (1) conducted laboratory performance testing (evaluated lead removal efficiency and reduced lifetime for three brands of pitcher-style POU filters in the presence of iron), (2) used a cost–benefit analysis to examine the effects of reduced capacity as a result of iron clogging on the relative costs of POU filters versus bottled water, and (3) extended these concepts to field data from citizen science water monitoring campaigns to further consider the scope of concerns regarding the impacts of POU filter clogging on water treatment costs.
Methods
Phase 1: laboratory pitcher POU testing
Four NSF/ANSI 53 lead-certified POU pitcher filter brands were selected from the Water Quality Association database in April 2018. Three (Brands A, B, and C) POU pitcher filter brands were evaluated, with the fourth being eliminated before testing due to low initial flowrates (Purchase et al., 2020). POU pitcher filter brands A, B, and C had manufacturer-rated capacities of 57 L (15 gal), 454 L (120 gal), and 151 L (40 gal), respectively. The POU filters were tested up to 100% of their rated capacity or until failure due to clogging occurred. The three brands were tested in duplicate against three particulate iron challenge waters (Fig. 1): (1) Moderate iron particulate at pH 6.5 (0.3 mg/L as Fe), (2) High iron particulate at pH 6.5 (1 mg/L as Fe), and (3) Very High iron particulate at pH 6.5 (20 mg/L as Fe).

The discoloration of increasing iron concentrations. The red oval indicates the USEPA SMCL for iron.
Two POU filter brands, A and B, which represent the highest and lowest manufacturer-rated capacities were challenged with two combination waters containing both iron and lead. Brand A was tested in duplicate, consistent with the previous tests, while Brand B was tested in triplicate as a result of duplicate failure inconsistencies observed by Purchase et al. (2020). The combination waters are termed (4) Soluble Combo at pH 5 (200 μg/L Pb and 0.3 mg/L as Fe) and (5) Particulate Combo at pH 6.5 (200 μg/L Pb, 2.3 mg/L PO4 as phosphorous [P], and 0.3 mg/L as Fe) (Table 1). The lower pH (i.e., pH 5) water was representative of conditions observed in Virginia private wells and tends to maximize the amount of soluble lead and iron in the water relative to higher pH municipal water supplies (Pieper et al., 2015).
Water Quality for Point-of-Use Challenge Waters
Orthophosphate addition: 2.31 mg/L as phosphorous (P).
Fe, iron; Pb, lead.
Each POU filter cartridge was soaked for 15 min and rinsed for 10 s using base water before testing, which is both iron and lead free (Supplementary Section S1). The challenge waters were manually filtered through each POU filter one 3.8 L batch (1 gal) at a time, and flowrates were recorded by hand with stopwatches. The POU filters treated up to 12 batches of water daily, with a minimum 30-min rest period between batches.
A total of 8–9 samples (250 mL) were taken at equal intervals of up to 100% of the POU filter manufacturer-rated capacity for the particulate iron waters, and 15–18 samples were taken for the lead–iron combination waters. This sampling scheme was followed unless the POU filters failed prematurely due to clogging. In this work, clogging was defined as a 75% reduction from the initial flowrate recorded for each device, and the initial flowrate was defined as the fastest flowrate measured in the first three batches treated by each device for each test.
Water analysis
Influent water samples (10 mL) were taken to measure total and particulate metal concentrations. To operationally determine particulate lead and iron concentrations in the synthesized waters, 10 mL samples were filtered through either a 0.45 μm Nylon filter or a 0.1 μm Durapore Hydrophilic Polyvinylidene Fluoride filter. Effluent samples (250 mL) captured total metal concentrations from the treated water for each POU filter.
Influent and effluent samples were dosed with 2% nitric acid and 2% hydroxylamine hydrochloride (10% w/w) and digested for 18+ h. Due to the strong adsorption of iron (orange residue), the 250 mL effluent samples were placed in an oven at 50°C for 5 + h to further assist iron digestion (APHA et al., 2017). All samples were analyzed for metal concentrations using a Thermo Electron iCAP RQ Inductively Coupled Plasma Mass Spectrometer (APHA et al., 2017). Blanks and spikes of known concentrations were measured every 10–15 samples for quality assurance and quality control purposes.
Particulate iron waters
To investigate the impact of particulate iron on POU filter clogging, POU filters were challenged with waters of various particulate iron concentrations. A targeted amount of dry ferrous sulfate was added to a synthesized base water for each water condition (Supplementary Section S1). The pH was adjusted just before and after the iron addition, using CO2 to lower pH and NaOH to raise it.
Due to inherent variability, including the time to oxidize ferrous iron and coagulation of particulates, the influent particulate concentrations often deviated from target. The average influent iron concentration for the Moderate iron particulate water was 0.4 ± 0.2 mg/L as Fe and was 63% ± 40% particulate. The High iron particulate water had an average concentration of 1.0 ± 0.3 mg/L as Fe, where 73% ± 34% was particulate. The Very High iron particulate water had an average concentration of 19.7 ± 0.5 mg/L as Fe and was 92% ± 5% particulate (Table 1). The particulate iron waters had a pH of ∼6.5 and an alkalinity between 10 and 30 mg/L as CaCO3. pH was measured using an OAKTON water meter and a HACH digital titrator was used to measure alkalinity.
Lead and iron combination waters
To investigate the impact of iron on lead removal, POU filter brands A and B were exposed to two waters containing both lead and iron.
The “Soluble Combo” water contained 221 ± 17 μg/L as Pb and 0.3 mg/L as Fe. The water was designed to have virtually all soluble lead (1.7% ± 1.9% particulate) and iron (2.2% ± 3.1% particulate) at a pH 5 and with an alkalinity of 11.2 mg/L as CaCO3 (Table 1). Iron was added using the protocol for the particulate iron waters and lead was added using a lead nitrate stock (Supplementary Section S1). The pH was adjusted to the target both before and after the metal additions were made.
The “Particulate Combo” water had 208 ± 23 μg/L as Pb (97.1% ± 1% particulate) and 0.3 mg/L as Fe (89% ± 8% particulate) at a pH 6.5 and an alkalinity of 20 mg/L as CaCO3 (Table 1). The preparation of this water was designed to maximize both particulate iron and lead. Specifically, the base water was dosed with iron sulfate and the pH was then raised to 7 using NaOH to precipitate the iron. Lead phosphate particles were formed in a separate container (3.785 L) by adding lead nitrate to a dissolved orthophosphate solution and shaking the solution for 1 min. Adding 2.31 mg/L orthophosphate as phosphorous (P) achieved the goal of having <4% soluble lead at pH 6.5 due to precipitation. After the lead and orthophosphate particulate solution was added, the pH was readjusted to 6.5 (Supplementary Section S1).
Phase 2: cost analysis
A cost estimate was conducted to evaluate the impacts of iron clogging on the relative costs of POU pitcher filters compared with bottled water. The analysis considered the cost of replacement cartridges versus various types of bottled water at major grocery stores. The initial capital cost of the reusable POU pitcher filter housing was excluded (which ranges from around $17 to $45) as this is typically a one-time purchase and is sometimes covered by public health agencies.
The cost of POU filter replacement cartridges was determined by obtaining prices from four different vendors. The average cost from June 2020 of one name-brand bottled water, available at four grocery and big box stores in Virginia, was used for this analysis ($1.47 per 3.785 L). The average cost of the generic or store-brand options available at the same stores was used as a representative low-cost bottled water alternative ($0.70 per 3.785 L). It is important to note that this analysis solely focused on filter cartridge replacement and bottled water costs, and did not consider other costs associated with transportation, disposal, convenience, and so forth.
Alternative failure criterion
We contemplated whether the NSF/ANSI 53 failure criterion for clogging, based on a 75% reduction of initial flowrate, was practically realistic for a typical consumer. For example, a POU pitcher filter with an initial filter time of 1.5 h per batch (3.8 L or 1 gallon) would fail based on the NSF/ANSI criterion only after the POU filter required more than 6 h to filter a batch of water. We rationalized that a 6-h wait would be unsatisfactory for many consumers, so we conducted an additional cost analysis with a maximum allowable filter time of 2 h per batch.
Phase 3: applying the cost analyses to prior citizen science data
The cost analyses from Phase 2 were extended to first-draw lead and iron data from prior citizen science projects to consider the practical implications of premature clogging. This analysis assumed that the homes in our databases were randomly selected and representative of the distribution of lead and iron across the entire community. We estimated the percentage of homes in each community where POU filters were expected to be more cost-effective than purchasing bottled water. The following first-draw datasets were included in this analysis: Berwyn/Cicero, IL (n = 90), Denmark, SC (n = 51), Enterprise, LA (n = 23), Orleans, NY (n = 89), VA private wells (n = 2,140), and St. Joseph, LA (n = 19). Data from Flint, MI, during the 2015 water crisis and postcrisis in 2017 (n = 145) were also included for comparison.
In addition, a set of historical samples (n = 30) from the home of resident citizen scientists in Denmark, SC, were included to illustrate changes in water quality over time within a single home. This provided the opportunity to estimate the percent of the time from 2009 to 2017 that they could have likely benefited financially from the use of a POU filter instead of purchasing bottled water.
Statistical analysis
Correlation analysis was applied to examine the association between lead and iron in drinking water sources, which has been occasionally observed in field data (Masters and Edwards, 2015). Due to the non-normal distribution of lead and iron data (Shapiro Test, p ≤ 7.16 × 10−07), Spearman's rank correlation was used to evaluate the association between lead and iron for each community using RStudio (Version 1.2.5001).
Cost analysis of POU filters versus store bottled water in each dataset
For each community, we calculated the percentage of consumers estimated to have had lower costs using a given POU pitcher filter compared with store-brand bottled water using the prior method. This analysis was done for the entire dataset and then repeated for the subset of homes with elevated lead (>15 μg/L) in their first-draw samples. First-draw iron concentrations were used to produce the cost analysis model. Brand A results were not included, as store-brand bottled water was always a more cost-effective option than this POU pitcher filter brand.
All study procedures were approved by the Virgina Tech Institutional Review Board (IRB # 17-541).
Results
Phase 1: laboratory pitcher POU testing
Particulate iron waters
Brands A, B, and C duplicate POU filters removed on average 92.2%, 96.4%, and 99.7% of the influent iron for the Moderate, High, and Very High particulate iron waters, respectively (Table 2). All of the POU filter effluent samples were below the EPA Secondary Maximum Contaminant Level (SMCL) of 300 μg/L, with only one exception. During the Very High particulate iron water testing, one Brand A duplicate released 370 μg/L Fe during batch 8 before clogging.
Average (±Standard Deviation) Lead and Iron Removal
There was a wide variation in the time required to filter the initial batches of water between POU filter brands and even between duplicates of the same brand (Supplementary Table S1). On average, brands A and B took 26 and 24 min, respectively, whereas Brand C took 112 min. One duplicate from Brand C had a minimum filter time of 40 min for the Moderate iron particulate condition (Supplementary Table S2) and a maximum initial filter time of 216 min for the Very High particulate iron condition (Supplementary Table S4).
This variability significantly impacted the flowrate threshold for clogging. For instance, using the NSF/ANSI 75% flowrate reduction criterion, the fastest Brand C filter tested only had to increase from 40 to 160 min to treat a batch of water before it failed. In contrast, the slowest Brand C filter tested had to increase from 216 to 864 min before it was considered clogged. POU filter flowrates fluctuated throughout the filter life, which could be due to variable water transport patterns through the media, variable rest periods between batches (e.g., some flowrates increased after having >8 h rest), and variable human response time.
Duplicate POU filters are not identical in terms of initial flowrate or clogging with time (Fig. 2) due to variations in manufacturing (Purchase et al., 2020). Flowrates sometimes increased during the beginning of the filter use, which resulted in a negative reduction (Fig. 2). In addition, there were instances where the final flowrate was not recorded as the time it took to filter a single batch exceeded the hours of a normal workday. In these instances, a 77% reduction in flowrate was recorded as the point of clogging failure.
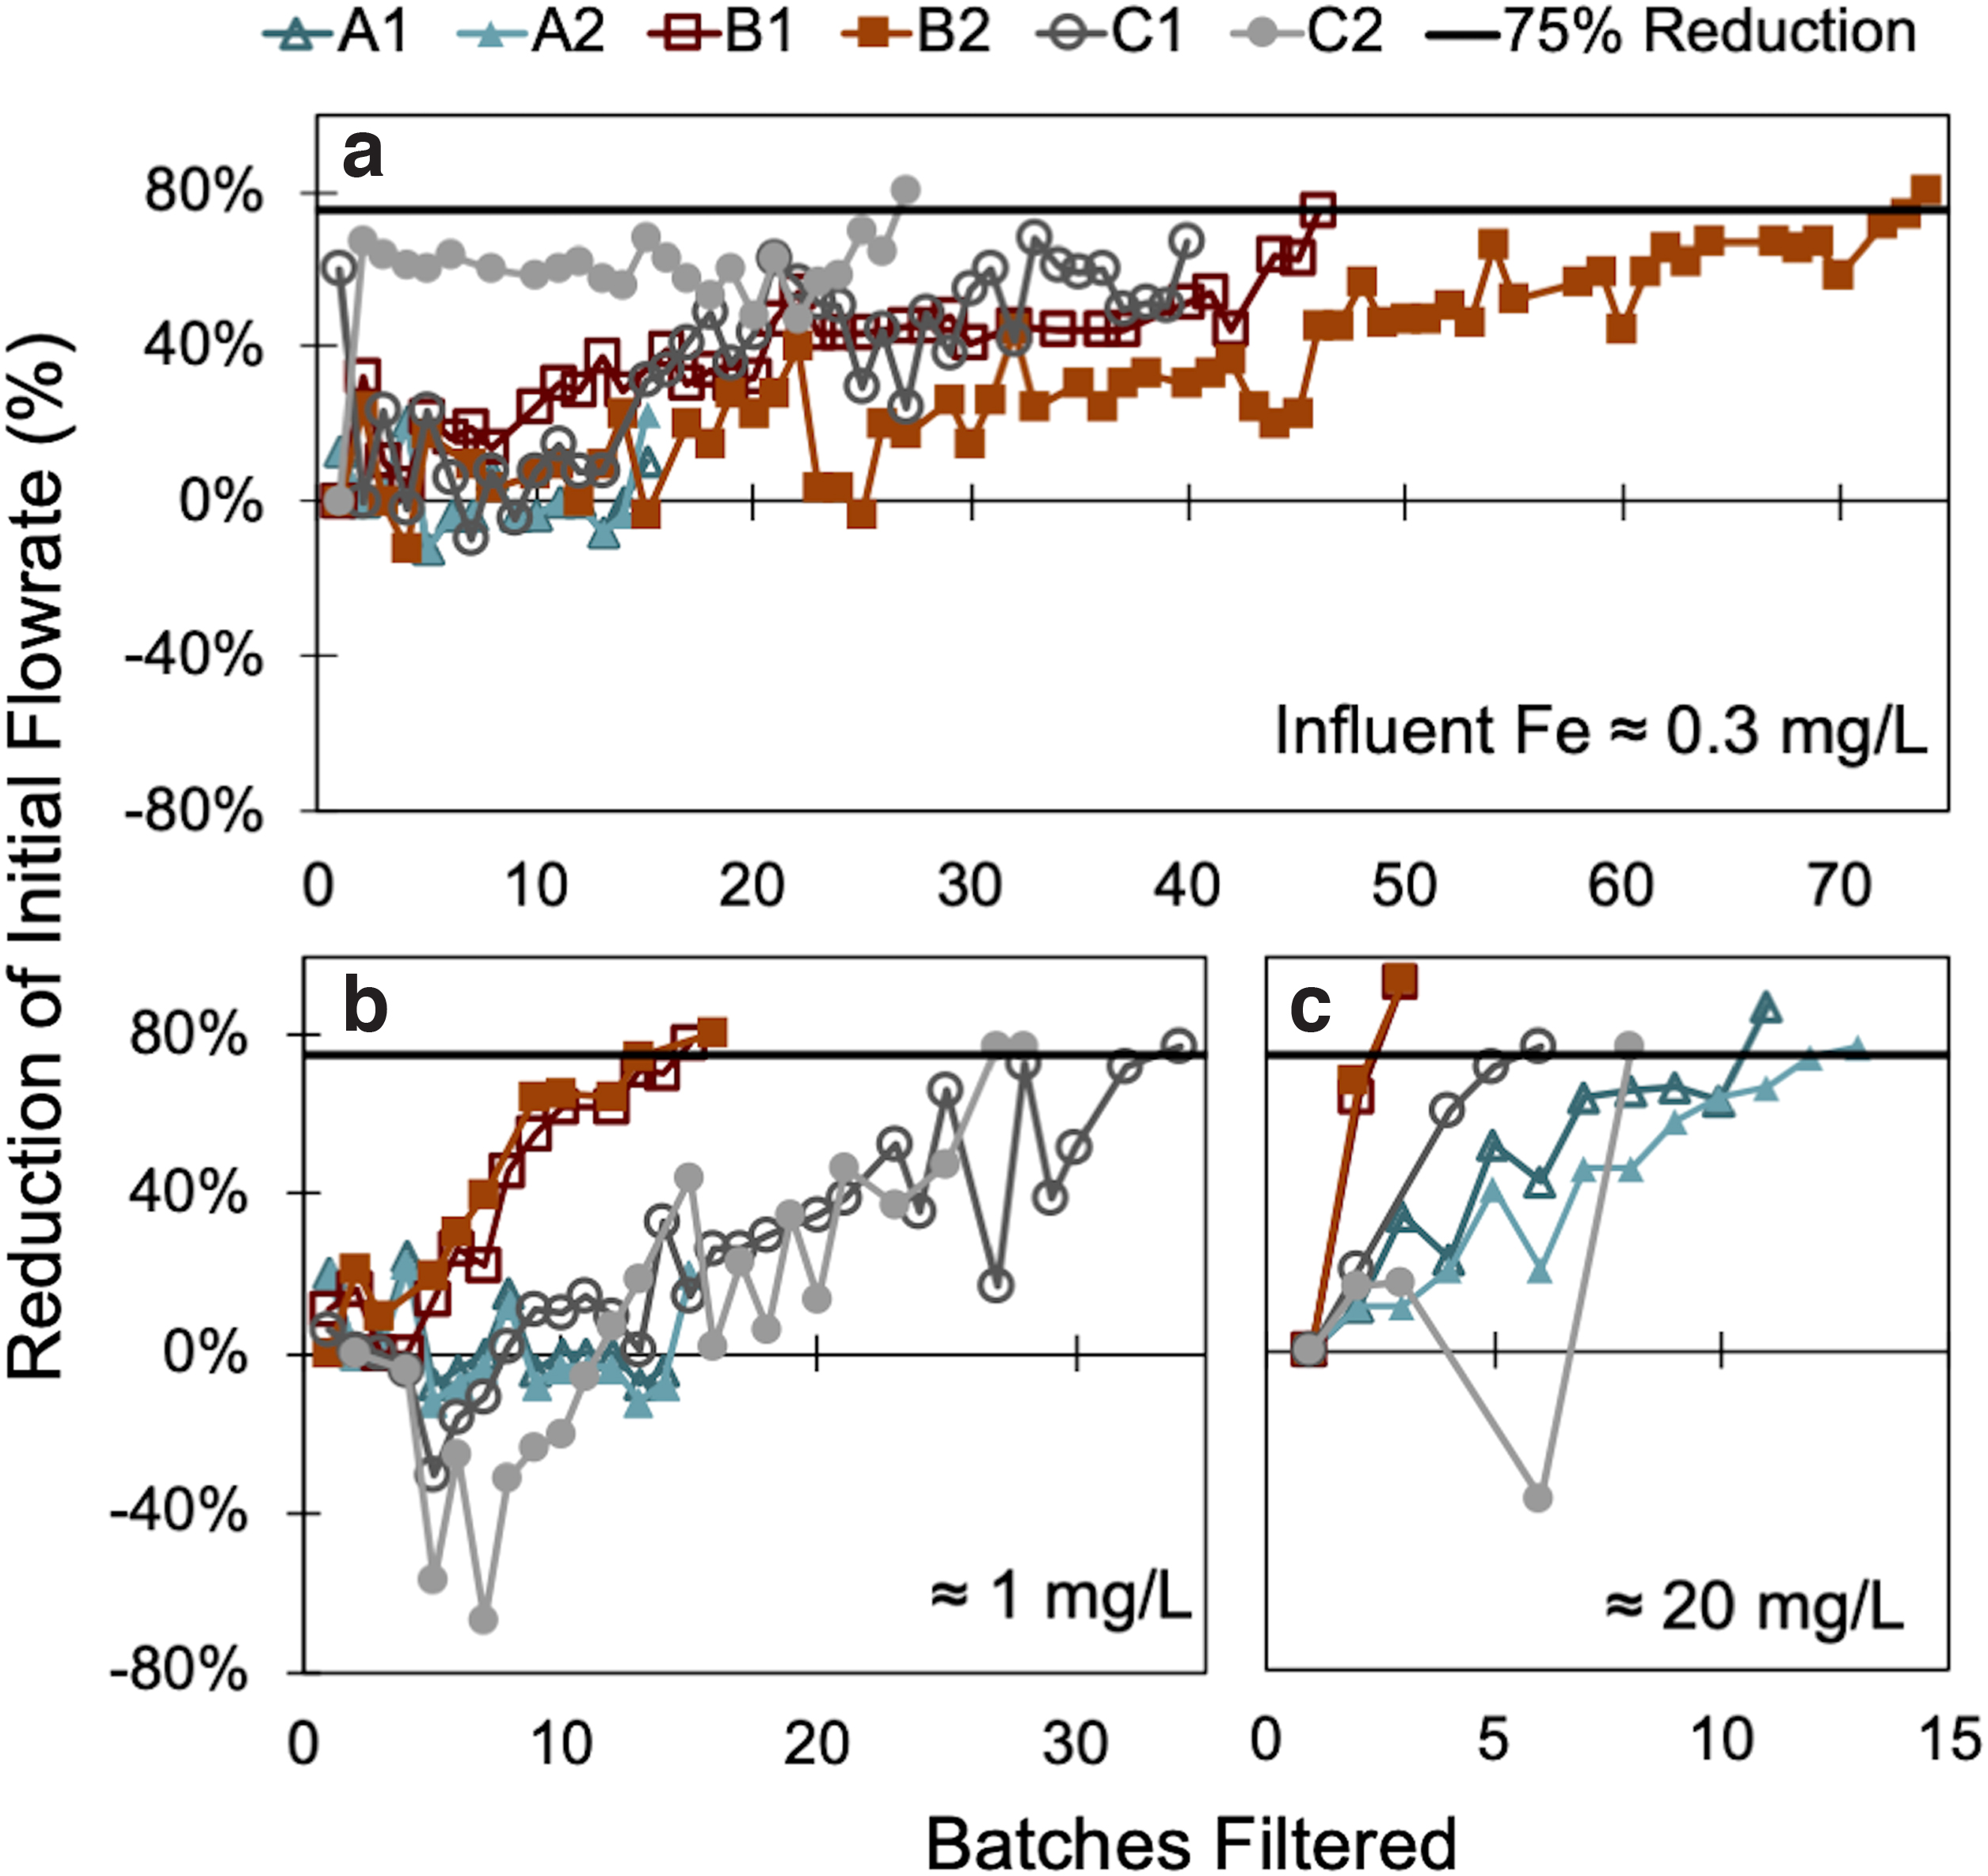
Reduction in flowrates for POUs at various particulate iron concentrations.
When exposed to waters containing 0.3–20 mg/L particulate iron, 72% (13/18) of the POU filters tested failed to meet their rated capacity due to clogging (Fig. 2). Specifically, 3 (50%) of the POU filters exposed to the 0.3 mg/L Moderate iron particulate water, 4 (66%) exposed to the 1.0 mg/L High iron particulate water, and 6 (100%) exposed to the 20 mg/L Very High iron particulate water failed prematurely due to clogging (flowrates reduced by 75% before reaching the manufacturer-rated capacity).
For the Moderate iron particulate water condition, one Brand C duplicate and both Brand B filters failed to reach 100% of their rated capacity due to premature clogging (Fig. 2a and Supplementary Table S2). The Brand C filter failed at 68% of its 151 L (40 batch) rated capacity, and the Brand B duplicate filters failed at 38% and 62% of their 454 L (120 batch) rated capacity. When comparing the volume of treated water across brands, Brand B duplicates treated the largest volume before clogging during the 46th and 74th batches (174 and 280 L) (Fig. 2a). Brand C duplicate 1 reached its rated capacity, treating 40 batches of water; whereas, Brand C duplicate 2 only treated 27 batches of water before clogging. Both Brand A duplicates reached their 57 L (15 batch) rated capacity.
When testing the High iron particulate condition (1.0 mg/L), the duplicate POU filters from Brands B and C clogged before reaching their rated capacity (Supplementary Table S3). The Brand B filters failed at 15% and 13% of their rated capacity, and the Brand C duplicates failed at 85% and 70% of their rated capacity. When comparing the volume of treated water across brands, Brand C treated the most water and clogged during the 34th and 28th batches (Fig. 2b). Brand B filters treated a comparable volume of water to Brand A (15 batches), with 1 duplicate treating 15 batches and the other treating 16 before clogging.
The Very High iron particulate condition (20 mg/L) caused premature clogging in all three POU filter brands (Supplementary Table S4). The Brand A filters failed at 73% and 87% of their rated capacity and treated 11–13 batches, which was the most water treated at this concentration (Fig. 2c). Both Brand B filters failed at <1% of their rated capacity, after treating only three batches of water each. The Brand C filters failed at 15–20% rated capacity after clogging during batches 6 and 8.
Lead and iron combination waters
Five POU filters were tested for the lead–iron combination conditions: two Brand A and three Brand B. When exposed to the Soluble Combo water (220 μg/L Pb and 0.3 mg/L Fe), the filters removed an average of 99.4% Pb and 98.9% Fe across all five filters when tested to 100% of their rated capacity (Table 2). All but 2 of the 81 effluent samples had lead levels below the Bottled Water Standard of 5 μg/L (USFDA, 2019), with a maximum concentration of 3.2 μg/L (Fig. 3a). One exception was a spike at 13% rated capacity of 43.7 μg/L Pb for one Brand A filter. The spike in lead correlated with a spike in iron of 54 μg/L. The second observed spike of 13.7 μg/L Pb occurred in one of the Brand B duplicates at 59% capacity. However, this lead spike did not co-occur with a spike in iron.
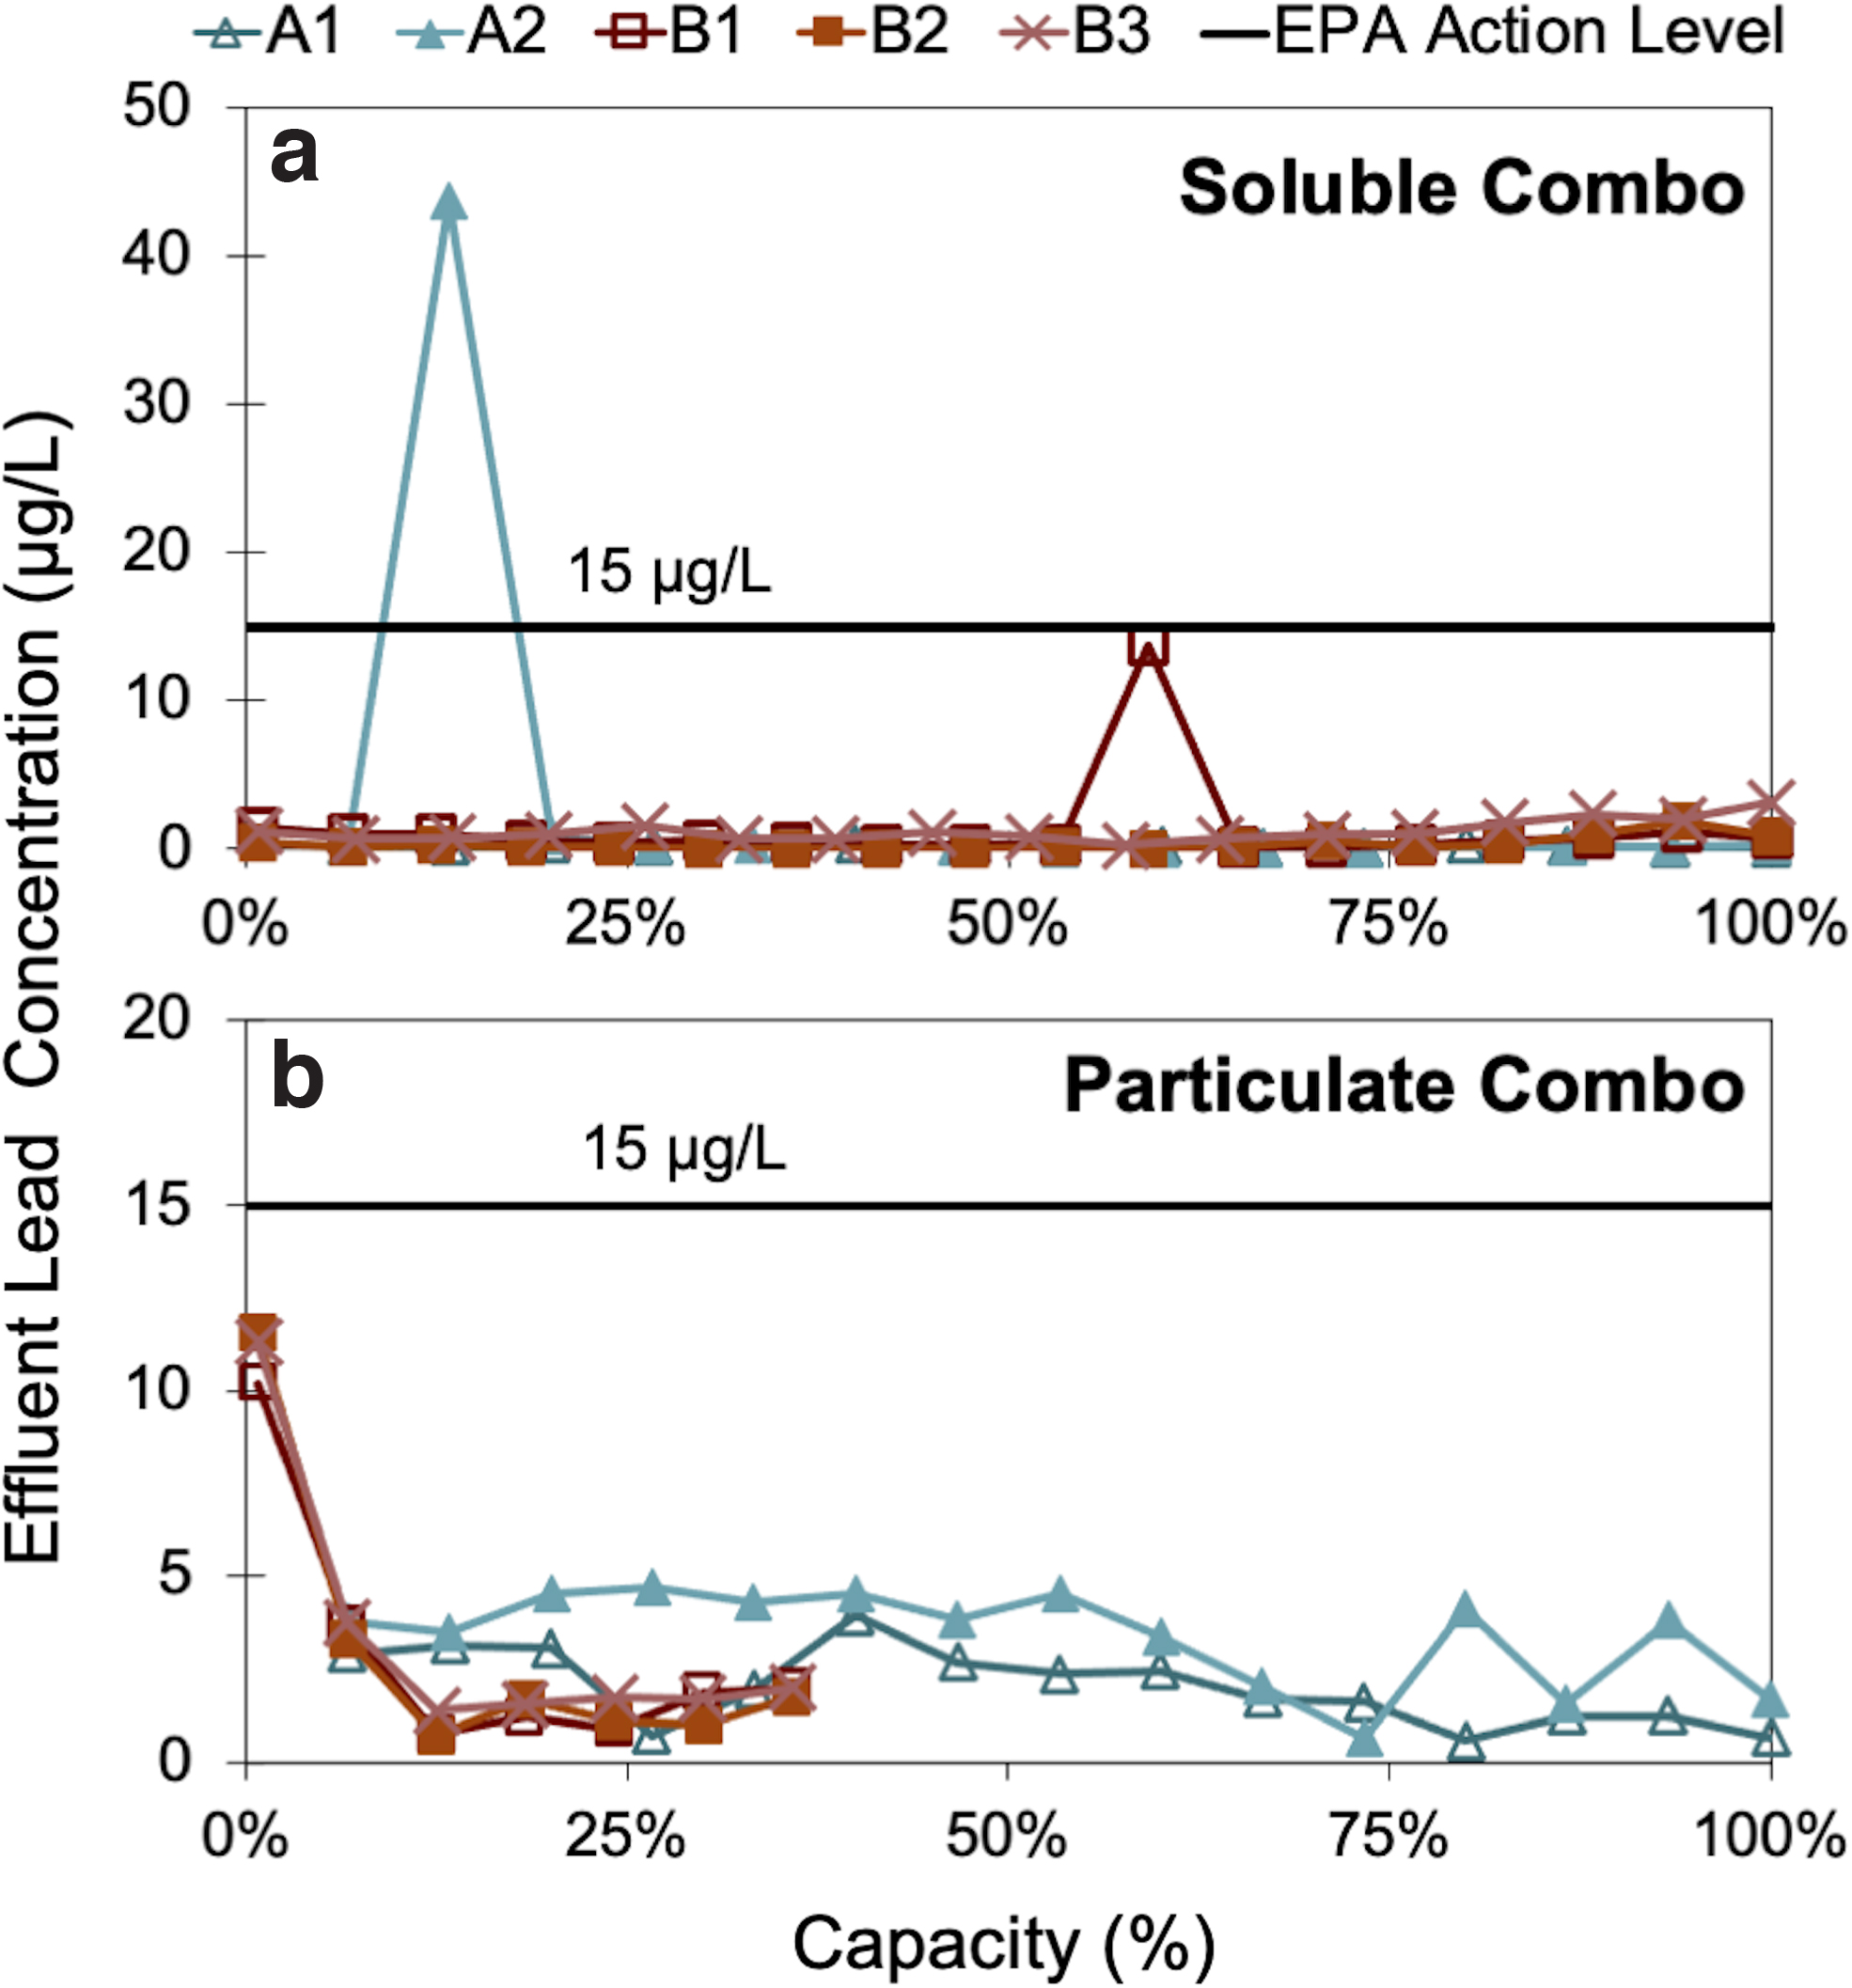
Effluent lead as a function of percent manufacturer-rated capacity.
Effluent iron levels remained below the SMCL across all five filters for the duration of this test condition with a maximum concentration of 54 μg/L Fe and an average below the 5 μg/L detection limit. All five filters reached 100% of their rated capacity when exposed to the Soluble Combo water (Supplementary Table S5).
Filter performance was relatively unaffected when the POU filters were exposed to the Particulate Combo water (210 μg/L Pb and 0.32 mg/L Fe). The POU filters removed an average of 98.6% Pb and 98.7% Fe (Table 2). Except for the first batch of filtered water for each Brand B filter (10.2, 11.6, and 11.3 μg/L of Pb), effluent lead concentrations were always <5 μg/L (Fig. 3b). The maximum effluent iron concentration was 34 μg/L and the average was less than the 5 μg/L detection limit. In the presence of particulate lead and iron, all Brand B filters failed prematurely due to clogging (Supplementary Table S6).
Phase 2: cost analysis
The relative cost advantage of POU filters versus bottled water was a function of iron concentration. When comparing the estimated cost-per-gallon ($/3.8 L) of iron-free treated water, Brand B and C POU filters ($0.14 and $0.22) were more cost-effective than both store-brand ($0.70) and name-brand ($1.47) bottled water (Table 3).
Cost Analysis—Comparing Point-of-Use to Bottled Water at Different Iron Concentrations
POU, point-of-use household water filters.
Brands B and C remained more cost-effective than bottled water if particulate iron was near the 0.3 mg/L SMCL. When iron levels increased above the SMCL, Brand B became more expensive than store-brand bottled water, with an estimated cost of $1.08 at 1 mg/L and $5.58 at 20 mg/L. The estimated cost for Brand C was $0.28 at 1 mg/L and $1.23 at 20 mg/L, exceeding the cost of store-brand bottled water at the higher concentration. Brand A filters ($0.97–$1.21) were more expensive than store-brand bottled water and less expensive than name-brand bottled water over the full range of evaluated particulate iron concentrations.
To better estimate the specific iron concentration at which the cost of POUs surpassed the cost of bottled water, the cost-per-batch ($/3.8 L) for each option was plotted as a function of iron concentration (Fig. 4a). A linear model provided a reasonable fit to the data (R2 = 0.99). However, Brand B diverged from the model in a critical range of 0.3–1 mg/L, where the increasing iron concentration begins to have a large impact on the cost-per-batch. This linear approximation is nonetheless adequate for illustrating the relative trends that are relevant to consumer decision making.

Comparing POUs to bottled water at varying particulate iron concentrations. The calculated base cost-per-batch for each filter when the iron is not present (0 mg/L Fe) was plotted at 0 mg/L Fe for the purpose of this figure.
Brand C became more expensive than store-brand bottled water ($0.70) at around 9 mg/L Fe, whereas Brand B became more expensive than store-brand bottled water at only 1.3 mg/L Fe. In addition, Brand B became more expensive than name-brand bottled water ($1.47) at iron concentrations above 4.5 mg/L Fe. Unlike Brands B and C, increasing iron concentrations had very little impact on the relative cost of using Brand A POU filters.
Alternative failure criterion
To illustrate the sensitivity of our cost analysis to the effects of consumer time invested in obtaining potable water, we repeated the analysis using a 2-h maximum filter time alternative failure criterion. This criterion results in slower filters failing and requiring replacement more frequently, ultimately increasing consumer costs. After applying this 2-h limit, Brand C POU filters became more expensive than store-brand bottled water ($0.70) at just 0.5 mg/L Fe and more expensive than name-brand bottled water ($1.47) at concentrations above 3.5 mg/L Fe (Fig. 4b).
Phase 3: applying the cost analysis to prior citizen science data
A correlation analysis was performed to examine the possible association between high lead and iron in first-draw water samples for several communities. The iron and lead data collected from these communities were applied to our cost analysis to investigate the potential impact of iron on POU desirability.
Correlations between lead and iron
The strength of the association between lead and iron varied greatly across the communities (Table 4). A strong correlation between lead and iron was observed across samples in St. Joseph, LA (ρ = 0.79, n = 19) and for samples collected over a period of 9 years in the home of citizen scientists living in Denmark, SC (ρ = 0.69, n = 30). Moderate correlations across samples were found in Enterprise, LA (ρ = 0.45, n = 23), and Flint, MI during 2017 (ρ = 0.55, n = 145). Most of the communities that were evaluated had weak correlations or no correlation detected between lead and iron concentrations; they are Berwyn/Cicero, IL (ρ = 0.23, n = 90); Denmark, SC (ρ = 0.35, n = 52); Flint, MI during 2015 (ρ = 0.39, n = 145); Orleans, NY (ρ = 0.28, n = 89); and VA Private Wells (ρ = 0.11, n = 2,140).
Lead and Iron Correlations with Cost–Benefit Analysis for Data Collected in Community Sampling Campaigns
Spearman's correlation: “—” indicates p-value >0.05. For purposes of this work, italics represents a strong correlation (0.56 < ρ), bold represents a weak correlation (0.3 < ρ < 0.44), and bold italics represents a moderate correlation (0.45 < ρ < 0.55).
Some utilities, public health agencies, or consumers might decide to deploy or implement filters only in homes with lead over the EPA Action Level (15 μg/L) (USEPA, 2021). When considering only the subset of homes with lead concentrations >15 μg/L, the association between iron and lead increased in some communities, including Berwyn/Cicero, IL (ρ = 0.76, n = 8) and Flint, MI, during 2015 (ρ = 0.76, n = 23).
Cost analysis of POU filters versus store-brand bottled water in each dataset
In conjunction with the prior laboratory testing, conceptual estimates of the proportion of residents in each community that could have saved money by using a POU filter rather than bottled water were developed. This analysis used first-draw iron concentrations for each home, the average cost of store-brand bottled water, and the cost of POU replacement cartridges. The cost per batch of water for each home was dependent on the first-draw iron concentration and was determined using the linear models produced in Phase 2 for each POU brand and each failure criterion (Fig. 4a, b and Table 4). A home is “anticipated” to save money by using a POU filter when the calculated cost to treat water is less than the cost of purchasing store-brand bottled water ($0.70).
The percent of a community anticipated to save money from using POU filters instead of bottled water decreases with increasing iron concentrations (Table 4). Communities with iron concentrations greater than the SMCL (0.3 mg/L) were predicted to have less cost savings from using a POU filter due to premature clogging. Additionally, when the alternative clogging criterion (maximum 2-h filter time) was applied, the percentage of each community expected to save money using Brand C POU filters decreased in comparison to the NSF/ANSI criterion (75% reduction of initial flowrate), consistent with Fig. 4b. Brand C appeared to be the most cost-effective brand when the NSF/ANSI criterion was considered, whereas Brand B often became more favorable when considering the 2-h maximum filter time.
When examining all samples in each dataset, between 87% and 100% (average 97%) of homes would have been expected to save money using a POU filter versus bottled water under the NSF/ANSI criterion. An average of 91% (57–100%) would have been expected to save money when the 2-h filter time criterion is applied. Homes with elevated lead had a slightly greater tendency to also have high iron. When focusing only on the homes with elevated lead (>15 μg/L), an average of 85% (33–100%) would have been expected to have a cost advantage using a POU filter over bottled water when the NSF/ANSI criterion is applied and 70% (33–100%) when the 2-h maximum filter time criterion is applied.
In some communities with the highest lead and iron levels, such as in Enterprise, LA (98.9 μg/L Pb, 1.5 mg/L Fe) and St. Joseph, LA (29.5 μg/L Pb, 1.9 mg/L Fe), it is predicted that it would have often been more cost-effective for consumers to use store-brand bottled water. When the 2-h criterion is applied, 83% of homes with elevated lead (>15 μg/L) in Enterprise, LA would have been expected to have lower costs using brand B filters rather than bottled water; however, only 33% of Enterprise homes would have been expected to have a cost advantage from using Brand C filters over bottled water. In St. Joseph, LA, only 33% of homes would have been expected to have lower costs using POU filter brand over bottled water.
When evaluating the complete set of samples collected in one home in Denmark, SC over a period of 9 years (2009–2017), it was estimated that the residents would have had lower costs using a Brand B filter 60% of the time and a Brand C filter 47% of the time over purchasing bottled water. However, when evaluating only the subset of samples with elevated lead (Pb >15 μg/L), bottled water became more cost-effective than POU filters due to a correlation between elevated lead and iron concentrations.
Discussion
Certification
The POU filter brands tested in this study were lead certified in compliance with the NSF/ANSI 53 standard. Lead-certified POU filters are tested using synthetic soluble and particulate lead challenge waters. POU filters can also be evaluated for compliance with NSF/ANSI 42 standards for particulate removal (NSF International, 2019a). Household lead-certified POU faucet and pitcher filters are not typically certified under NSF/ANSI 42 for iron and manganese removal; however, many lead-certified POUs have dual certification with NSF/ANSI 42 for Nominal Particulates, which might indicate improved treatment of particulate lead (Bosscher et al., 2019) and discolored waters (e.g., red water from elevated iron).
POU filter manufacturers often seek multiple contaminant reduction certifications under NSF/ANSI 53 and 42. The lowest capacity designation determines the rated capacity for each POU filter device. For example, if a POU filter is certified to remove lead up to a capacity of 200 L, but is only certified to remove Nominal Particulate Class I (0.5–1 μm) up to 150 L, the published rated capacity for that POU filter brand would be 150 L.
Iron and lead removal
POU filters were effective at removing particulate iron. In addition, POU filters typically produced lead levels below 10 μg/L when tested against the lead and iron combination waters. Only five lead spikes were observed during the combination challenge water testing: three during the Particulate Combo and two during the Soluble Combo. The three lead spikes observed during the Particulate Combo testing were in the first batch of water filtered by each brand B filter (Fig. 3). These spikes echo problems reported by Purchase et al. (2020), where it was concluded that discarding the first batch of water could help reduce exposure to elevated lead levels that may occur at the beginning of the POU filter life.
Only two effluent lead spikes (>10 μg/L) were observed during the Soluble Combo water testing (Fig. 3). One spike in lead correlated with a higher release of iron (Brand A) and the other did not (Brand B). There was no strong correlation between lead and iron release during the remainder of the Soluble Combo testing. Specifically, even as effluent iron concentrations occasionally increased, the lead concentration remained low. Overall, as the two lead spikes were seemingly isolated occurrences, we do not believe that iron generally impacts lead removal efficiency.
Reduction in flowrate
Increasing the particulate iron concentration resulted in more rapid clogging of the POU filter devices. The clogging and cost-effectiveness of POU brands B and C were more adversely impacted by the presence of Moderate and High iron concentrations, even though they generally treated a larger volume of water than the Brand A filters.
Brands B and C are both certified under NSF/ANSI 42 for Particulate Class I (0.5–1 μm), whereas Brand A is not certified to remove particulates. A presumed enhanced ability of Brand B and C POUs to remove smaller diameter particles of 0.5–1 μm based on particulate removal certification, could help explain the drastic reductions in flowrate that were observed for these devices. The Brand A POU filter cartridges are significantly larger than those of Brands B or C, and the larger surface area of the filter media may allow for increased removal while reducing the impacts of clogging.
The clogging effects of iron noted herein, might also apply to certain waters with high levels of turbidity and other suspended particles.
Reduction in rated capacity
For the POU filters tested, the greater a filter's rated capacity, the greater the adverse impact that was observed due to particulate iron (Supplementary Fig. S1). Brand A had only a 20% reduction (57 L down to 45 L) in expected capacity when the particulate iron concentration increased from 0 to 20 mg/L. In contrast, Brand B had a reduction in practical capacity of >95% (454 L down to 11.4 L) when iron concentrations increased to 20 mg/L.
Ultimately, having an eight times higher advertised capacity for Brand B (454 L) compared with Brand A (57 L), practically translated to having a four times lower actual capacity for Brand B (11.4 L, or 2.5% its rated capacity) versus Brand A (45 L, or 80% its rated capacity) if Very High levels of iron were present. This dramatically impacted the expected costs to treat water with Very High iron concentrations, given that the higher capacity filter clogged much sooner than the lower capacity filter. The presence of iron may become an important factor for consumers to consider, as a higher capacity rating can influence consumers to purchase a particular filter brand, when in fact the brand with a lower capacity rating might last longer.
Monetary and nonmonetary costs of POUs
Our cost analysis sought to normalize filter performance and rated capacity to provide a practical comparison across POU filter brands. We validated our cost analysis results with the calculator used by Verhougstraete et al. (2019), which proved consistent with our results when the initial filter unit cost was excluded from the calculation. Verhougstraete et al. (2019) found that POUs of various types were more cost-effective than purchasing the 5-gal water jugs often used in offices. Our results showed that even with reduced capacity due to Moderate and High iron concentrations, POU filters were more cost-effective than name-brand bottled water and sometimes cheaper than store-brand bottled water. The iron concentrations that were evaluated as part of this analysis are generally more extreme than those typically observed in the field.
We introduced an alternative failure criterion of a 2-h filter time, to account for our belief that a typical consumer might be unwilling to wait longer to filter a batch of water. However, our calculations did not consider other operation and maintenance costs for using bottled water or POU filter devices in comparison to using tap water.
More complex cost comparisons between POU and bottled water can be considered in future work, as there are many nonmonetary factors known to influence a consumers' decision to use bottled water and POU devices (Katner et al., 2021). These factors could include the following considerations: (1) influent water characteristics, (2) locality, (3) family size, (4) daily water use, (5) access to transportation, (6) delivery availability, (7) disposal burden, (8) environmental concerns, (9) monetary value of time, (10) distance to the point of purchase, (11) the consumer's trust (or distrust) in the alternatives, and (12) technical barriers such as the spout and aerator fittings and sink size.
Use of POUs in communities
Co-occurrence of iron and lead varied greatly in the communities evaluated in this study, which is consistent with results found by Masters and Edwards (2015). In some communities, the association was stronger when only looking at homes with elevated lead levels. As a result, on occasion, homes with the highest lead levels also had the highest iron concentrations. These homes have an increased need for a tap water alternative due to elevated lead levels; however, there is also an increased risk of premature clogging of POU filters due to the higher iron concentrations.
Our cost analysis illustrated trends in cost-effectiveness of POU devices when applied to several communities. However, applying the cost analysis to communities with varying iron concentrations further illustrated that POUs may be less attractive in communities with higher iron concentrations. Preflushing taps to lower the concentration of iron in water before collecting water to be used for filtration may reduce the likelihood of clogging and increase the attractiveness of POU filters. Consumers could be advised to run their water until it becomes clear of visible iron to extend the lifetime of their POU filters in some cases.
NSF/ANSI 53 lead-certified filters have proven effective at consistently reducing lead levels, even in the presence of iron, and are often a more cost-effective alternative than purchasing bottled water. Widespread POU distribution may become more common with the recently published Lead and Copper Rule Revisions (LCRR) that require POU distribution to customers after lead service line replacements or disturbances (USEPA, 2021). The LCRR also allow small community water systems (serving ≤10,000 people) to implement POUs as a compliance alternative if a Lead Action Level exceedance occurs.
Systems should plan to evaluate water quality throughout their distribution system before deciding on mass distribution of POU devices within their community. For instance, distributing POUs to homes with chronic discolored water, might sometimes be problematic due to consumer frustration with premature clogging and increased treatment costs. Katner et al. (2021) conducted a POU filter field study in Enterprise, LA to monitor filter performance over time. Enterprise, LA is known for elevated iron levels and in a survey, residents indicated that their tap water had unpleasant colors, odors, and tastes. After participating in the study and using the provided POU faucet filter, residents were less likely to continue using their filters because they clogged within a couple of weeks or days of use and many switched to bottled water (Katner et al., 2021).
Conclusion
The presence of iron only occasionally affected overall lead removal in our laboratory testing. However, premature clogging sometimes controlled the practical capacity of POU filters. Premature clogging had a major impact on the costs of POU filters versus bottled water in some situations where iron levels approached or exceeded the 0.3 mg/L USEPA SMCL. In cases with sufficiently high iron levels, bottled water will be more cost-effective than POU filters.
Footnotes
Acknowledgments
The authors would like to thank the undergraduate students who assisted with the 2 years of laboratory work presented: Joseph Hector, Ailene Edwards, Rebekah Broyles, Sarah Loomis, Isabella Lerer, Jesika McDaniel, Leila Husain, Paighton Vanzant, Natalie Stone, and Abby Simonpietri.
Authors' Contributions
R.J.C.-N. wrote the first draft of the article, conducted formal analysis, data curation, data visualization, methodology, study investigation, and execution. J.M.P. coauthored the article, project administration, data curation, methodology, validation, study investigation, and execution. K.J.P. cowrote the proposal that conceptualized and funded this work, provided the data from previous sampling campaigns for the community analysis, and contributed to revisions of this article. A.K. cowrote the proposal that conceptualized and funded this work, provided the data from previous sampling campaigns for the community analysis, and contributed to revisions of this article. M.E. cowrote the proposal that conceptualized and funded this work, coauthored the article, advised and supervised the work, validation, and methodology.
Author Disclosure Statement
Funding for this study came from the U.S. Housing and Urban Development (HUD), government entity. R.J.C.-N. conducted the work and wrote the first draft of this work while employed by Virginia Tech.
Funding Information
This research was supported by a HUD Healthy Home Technical Studies Grant Number VAHHU0036-17. Any opinions, findings, and conclusions or recommendations expressed in this material are those of the author(s) and do not necessarily reflect the views of HUD.
References
Supplementary Material
Please find the following supplemental material available below.
For Open Access articles published under a Creative Commons License, all supplemental material carries the same license as the article it is associated with.
For non-Open Access articles published, all supplemental material carries a non-exclusive license, and permission requests for re-use of supplemental material or any part of supplemental material shall be sent directly to the copyright owner as specified in the copyright notice associated with the article.