
Abstract
Surface temperature is one of the most basic requirements for the biosphere's existence on earth. Hence, to evaluate urban ecoenvironmental quality, investigating the characteristics of the spatial and temporal surface temperature is essential. In this study, multisource spatial data were used to invert Urumqi's surface temperature over a large time span. Characteristics of spatial pattern of the surface temperature were quantitatively analyzed using a spatial autocorrelation and standard deviation ellipse. A geo-detector model was used to determine the correlation between the surface temperature and 10 influencing factors. Urumqi's surface temperature exhibited a significant geographical heterogeneity from 2000 to 2019, such that a clear heat island effect was observed in the city. From 2000 to 2010, sub-high temperature, high temperature, and severe high-temperature centroids changed 30° to the northwest; whereas from 2010 to 2019, the temperature centroid shifted 13° to the southwest. Among all the factors, the impervious surface has greatest impact on the urban heat island effect in Urumqi. The relationship between the impervious surface and other parameters was the most visible in the interaction detection. In the different land use categories, building land exhibited the highest average surface temperature. Compared with other studies, this study considers the influence of natural and human factors on urban heat island effect more comprehensively, and also quantitatively analyzes the difference of different land use types on urban heat island effect, which makes up for the defects of previous qualitative analysis.
Introduction
Land surface temperature is closely related to the Earth's biosphere. It not only governs human activities and contributes to the modification of the natural environment, but also controls the physical and chemical evolution of the biological world (Wang et al., 2020; Bai and Scott, 2011). In addition, surface temperature is crucial in the layout and development of agriculture, industry, and transportation (Hu et al., 2018). Cities are the main place of human production and life, and with the accelerated urbanization process, the heat island effect of cities has intensified (Fang et al., 2020). The urban thermal environment not only affects urban habitat and residents' health, but also significantly impacts sustainable urban development.
The urban heat island effect and its influencing factors have been extensively studied in China and abroad. Bokaie et al. (2016) considered the replacement of natural ground surface by large impermeable surfaces as the root cause of urban heat island formation. Baldinelli and Bonafoni (2015) found that the decrease in the albedo of the urban subsurface is the main reason for the formation of urban heat islands. Yuan and Bauer (2007) used the vegetation coverage and impervious surface extracted from Thematic mapper (TM) and Enhanced Thematic Mapper (ETM+) images of Minnesota city over 3 years and different seasons to quantitatively analyze the influence of surface temperature. Zhang et al. (2006) showed that the intensity of heat island effect in Shenzhen was significantly influenced by the subsurface and vegetation cover.
Although many studies have explored the effects of impervious surfaces and subsurface on urban heat islands using methods such as correlations and regression analysis (Yang et al., 2016; Cui et al., 2018; Xie et al., 2018; Zhou et al., 2018), the urban heat island effect usually results from a combination of meteorological factors, socioeconomic and surface characteristics, and the interaction of multiple factors on urban heat island intensity remains unclear.
Quantitative analysis of the interaction of multiple factors on urban heat island intensity can reveal the mechanisms that generate the urban heat island effect. The geo-detector is suitable for multivariate driving force analysis (Wang et al., 2010). At present, the geographic detector model has been widely used in many fields. For example, such models were used to analyze the impact of different influencing factors on the surface temperature of the Western Sichuan Plateau and the spatial pattern of urban heat islands in the Guangdong–Hong–Kong–Macao Greater Bay Area (Yang et al., 2019; Yao et al., 2020). Chen et al. (2020) analyzed the influence of population density, road network density, and commercial type on surface temperature in Urumqi city using a geo-detector, whereby the results showed that the commercial type has a strong influence on surface temperature. Chai et al. (2021) analyzed the contribution of different land use types to surface temperature in Urumqi city using the contribution index method.
The results show that there are certain differences in the driving factors and interactions between factors of surface temperature in different study areas (Yang et al., 2019, 2021; He et al., 2020; Zhao et al., 2021). Nevertheless, the above studies did not consider the effects of natural factors on surface temperature and lacked in-depth analysis of the differences in urban heat island effects associated with different land use types. Urumqi is an important node city of the “Belt and Road” economic development strategy and the core area of the “Wu-Chang Integration” strategy. Consequently, the urban heat and environmental problems caused by rapid urbanization are becoming increasingly prominent (Zhao and Alimujiang, 2021).
Compared with other studies, by considering natural and human factors, the 10 factors affecting urban heat island intensity were selected in the study in a more comprehensive way, thereby ensuring more accurate detection results. In addition, this study fills the gap of the previous qualitative analysis by considering the variability of the effects of different land use types on the urban heat island effect. Besides, differences in urban internal structure, urbanization level, and economic development will lead to different driving factors for the heat island effect in different cities. Therefore, this study used geographic probes to explore the main drivers of heat island intensity in Urumqi and their interactions, and presents the results of exploring the geographic pattern of surface temperature and influence mechanisms in the area. The results can provide theoretical basis and scientific guidance for alleviating the heat island effect in Urumqi and promoting the construction of urban green ecological environment.
Study Area and Data
Study area
Urumqi is located between 86°37′35″E to 88°58′23″E and 42°45′33″N to 44°08′00″N. It is the political, economic, and cultural heart of Xinjiang, and is located in Eurasia's hinterland. With a total area of 1.4 × 10⁴ km2, it is also the westernmost point of the country (Fig. 1). The average elevation in Urumqi is 900 m. The ground is undulating and is bordered by mountains in the east, west, and south. With an average temperature of 23.6°C and an average annual precipitation of just ∼300 mm (Zhou et al., 2018), the city has a typical mid-temperate continental desert climate, with huge temperature fluctuations between day and night, drastic changes in cold and heat, and a typical arid region city climate. According to statistics, as of the end of 2019, the urban area of Urumqi City was 521 km2, and the area has expanded by 178 km2 in the past 10 years. The resident population of Urumqi in 2019 was 3.352 million (available online).

Location map of the study areas.
Data and data preprocessing
Landsat remote-sensing pictures (30 × 30 m) from three phases (August 20, 2000, August 25, 2010, and August 13, 2019) were employed to obtain land surface temperature. Each phase has three remote-sensing photos, with orbit numbers of 142/30, 143/29, and 143/30 (Geospatial Data Cloud Platform). Land use type data, annual average precipitation, annual average temperature, population density, and Gross Domestic Product (GDP) geographical distribution (2000, 2010) are among the 10 influencing elements strongly associated with surface temperature with a spatial resolution of 1 km in 2000, 2010, and 2019 and all data from the Chinese Academy of Sciences' Resource and Environmental Science Data Center (available online at their website). The data from the statistical yearbook, land use types, and population density are all included in this article and night light data (available at the National Oceanic and Atmospheric Administration website) of the 2019 GDP of the study area were used to obtain the spatial distribution data of GDP in 2019 (Feng et al., 2021; Yi et al., 2006).
Digital elevation model (DEM) data (30 × 30 m) were sourced from the geospatial data cloud platform (available at the Geospatial Data Cloud website in Chinese), slope and aspect data were extracted from DEM, and vegetation coverage and impervious surface data of the three phases were extracted from Landsat remote-sensing images in the study area. The verification data of surface temperature MOD11A2 have a spatial resolution of 1 km from the NASA data network (available at the NASA website). The dataset of 10 impact factors (averages in 2000, 2010, and 2019) is shown in Supplementary Figs. S1 and S5. Meteorological data during the study period in the study area is shown in Supplementary Table S3.
In this study, the Radiometric Calibration tool in the ENVI software was used to calibrate the thermal infrared band (i.e., spatial resolution 120 m) and multispectral band (i.e., spatial resolution 30 m) of Landsat images of the three phases. FLAASH atmospheric correction module in the ENVI software was used to remove the influence of factors such as the atmosphere and illumination on the reflectivity of the ground objects after the calibration data to obtain more accurate ground object reflectance and emissivity in the study area (Chen et al., 2020). The MOD11A2 data were spliced using MRT software. Finally, all the above data were subjected to projection transformation and cropping processing.
Methods
Atmospheric correction
A single-channel algorithm, namely the atmospheric correction method, was used to retrieve the surface temperature of the study area. The main steps included the calculation of normalized difference vegetation index (NDVI), vegetation coverage, surface emissivity, and blackbody radiance, followed by the estimation of the true surface temperature (Qin et al., 2004). The specific calculation formula is as follows:
NDVI was calculated as:
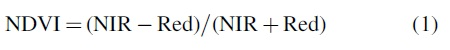
NIR and Red, respectively, are the near-infrared band of the image and the red band of the visible light range.
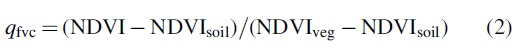
The formula for calculating the value of vegetation coverage qfvc is:
Here,
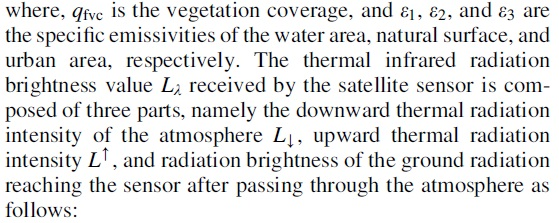

In the formula, P(Ts) is the black body thermal radiation intensity (
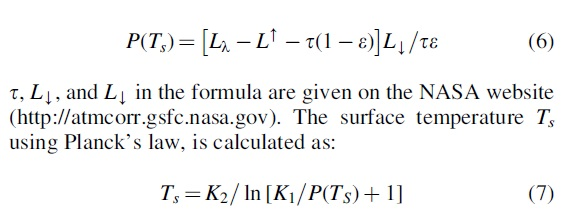
K1 and K2 in the formula are constants; K1 = 607.864 and K2 = 1260.543 for Landsat TM5 images and K1 = 774.856 and K2 = 1201.356 for Landsat8 OLI_TIRS images.
Spatial autocorrelation analysis
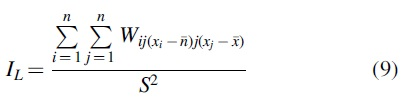
The spatial autocorrelation statistic Moran's I was chosen in this work to quantitatively examine the degree of dependency of land surface temperature spatial autocorrelation (Wang et al., 2020). The global spatial autocorrelation index has a range of [−1, 1]. A higher index indicates a higher degree of spatial correlation, whereas a lower index indicates a lower degree. The global Moran index I (Moran's I) is calculated as:
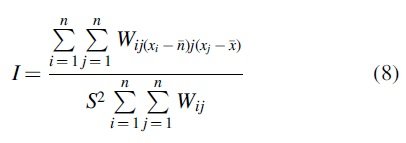
where n is the number of spatial units; xi and xj are the surface temperature of pixel i and j, respectively;
Standard deviation ellipse
Standard deviation ellipse (SDE) can accurately reveal the characteristics of spatial element distribution (Lu and Zuoquan, 2014). With basic parameters such as the long axis, short axis, and centroid of the SDE, the SDE technique statistically defines the distribution properties of spatial elements. In this study, SDE was used to analyze the spatial distribution characteristics of temperature grades as sub-high temperature, high temperature, and ultra-high temperature.
Geo-detector
With basic parameters, such as the long axis, short axis, and centroid of the SDE, the SDE technique statistically defines the distribution properties of spatial elements (Wang et al., 2010). The detector type can be divided into factor detection, interaction detection, risk detection, and ecological detection. The factor detector can measure the spatial heterogeneity of the factor to the surface temperature (Y) and detect its influence factor (X) to explain the spatial differentiation of the attribute Y to a certain extent; the formula is:
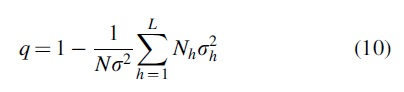
where q is the degree of influence of a certain factor X on the surface temperature Y, L is the sample number of the independent variable, Nh and N are the number of units in layer h and the entire study area, respectively, and σ2 and
The larger the value of q, the higher the influencing factor's influence on the surface temperature, and vice versa. If q is equal to 1 or close to 1, the influence factor fully controls the dependent variable; if the value of q is equal to 0 or close to 0, it indicates that the impact factor does not affect the dependent variable (Jiménez-Muñoz et al., 2014).
The interaction detector can detect the interaction between different factors and evaluate whether there is an increase or decrease in increasing or decreasing the surface temperature when factors x1 and x2 work together. First, the explanatory power of x1 and x2 on the surface temperature was calculated, namely q(x1) and q(x2); then q was calculated when x1 and x2 interacted, namely q(x1 ∩ x2) and set q(x1); then the sums of q(x2) and q(x1 ∩ x2) were compared.
The risk detector is used to determine whether there is a significant difference between the mean value of the risk attributes of the two regions and the surface temperature, which is represented by the t-test; the formula is as follows:
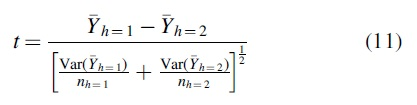
Here,
Ecological detectors are used to compare whether the effects of pairwise impact factors on the spatial distribution of surface temperature have significant differences and use F statistics to test.
Here, Nx1 and Nx2 represent the sample numbers of the two factors x1 and x2, respectively, and SSWx1 and SSWx2 represent the sum of the stratified variance formed by x1 and x2, respectively.
Comprehensively considering the study area's humanistic and natural environment characteristics, the ArcMap was used to discretely classify the inverted surface temperature and influencing factors. Using the fishing net tool to grid the classified data, the research area was divided into 1,595 grids with each grid size being 3 × 3 km.
Extraction of impervious surface information
To extract urban impervious surface and check correctness, a linear spectrum mixed decomposition model and the principal component analysis method were used to create an urban built-up area index (BUAI). First, normalized building index (NDBI) was calculated as:

Here, NIR and MIR are the near-infrared and mid-infrared bands of remote sensing images, respectively. NDBI and NDVI were used to construct the urban BUAI; the index range was [−2, 2] (Yang et al., 2019).
To improve the extraction accuracy of urban impervious surfaces, elimination of the influence of vegetation and water bodies on the NDBI index was necessary. Therefore, improved normalized water index (NDWI) was used for water mask processing on remote sensing images. NDWI is calculated as:

where the green band is the green light band. The results of BUAI and NDWI binarization were multiplied to remove the influence of the water body to obtain impervious surface information.
Results
Spatiotemporal patterns of surface temperature
With the help of ENVI software, the atmospheric correction method was utilized to determine the surface temperature of Urumqi in August 2000, 2010, and 2019. The surface temperature of the study area was divided into seven grades (Zhao et al., 2021): low temperature (≤5°C), lower temperature (6–15°C), sub-medium temperature (16–22°C), medium temperature (23–29°C), sub-high temperature (30–34°C), high temperature (35–37°C), and extra high temperature (≥38°C); the classification results are shown in Fig. 2.

Surface temperature distribution in Urumqi in August.
The spatial distribution trend of surface temperature in Urumqi in August 2000, 2010, and 2019 was generally consistent (Fig. 2). Sub-high temperature, high temperature, and ultra-high temperature were mainly distributed in the main urban area. The northern part of the city and the city center showed a significant heat island effect. The results of the area of different levels of surface temperature and the proportion of the total area in the three phases of the study area can be obtained by calculation, which can be shown in Supplementary Fig. S2.
Spatial autocorrelation of surface temperature
The global spatial autocorrelation Moran's I index of the studied area from 2000 to 2019 was larger than 0.9, with a p-value <0.001, indicating that the surface temperature has substantial spatial autocorrelation and spatial clustering characteristics (Supplementary Table S1). The most significant were the characteristics of spatial agglomeration in 2019, followed by those in 2000 and 2010. Spatial autocorrelation spatial distribution characteristics are as shown in the Supplementary Fig. S3.
Spatial distribution pattern of surface temperature
The SDE method used in this research examined the evolution characteristics of sub-high temperature, high temperature, and ultra-high temperature in the study area throughout three time periods of 2000, 2010, and 2019 (Fig. 3). The results showed that the centroid of the SDE in 2000 was located in the northeast of the study area, and by 2010 it shifted to the northwest with a deflection angle of 30°. During this period, the rapid development of the Shuimogou District and the new urban area caused the surface temperature to rise. In 2019, the rapid expansion of the built-up area of Tianshan District and Shayibake District caused the SDE center of land surface temperature to shift 13° southwest from 2010. Based on the abovementioned observations, a certain correlation between the change of the surface temperature and the development of the city can be observed.
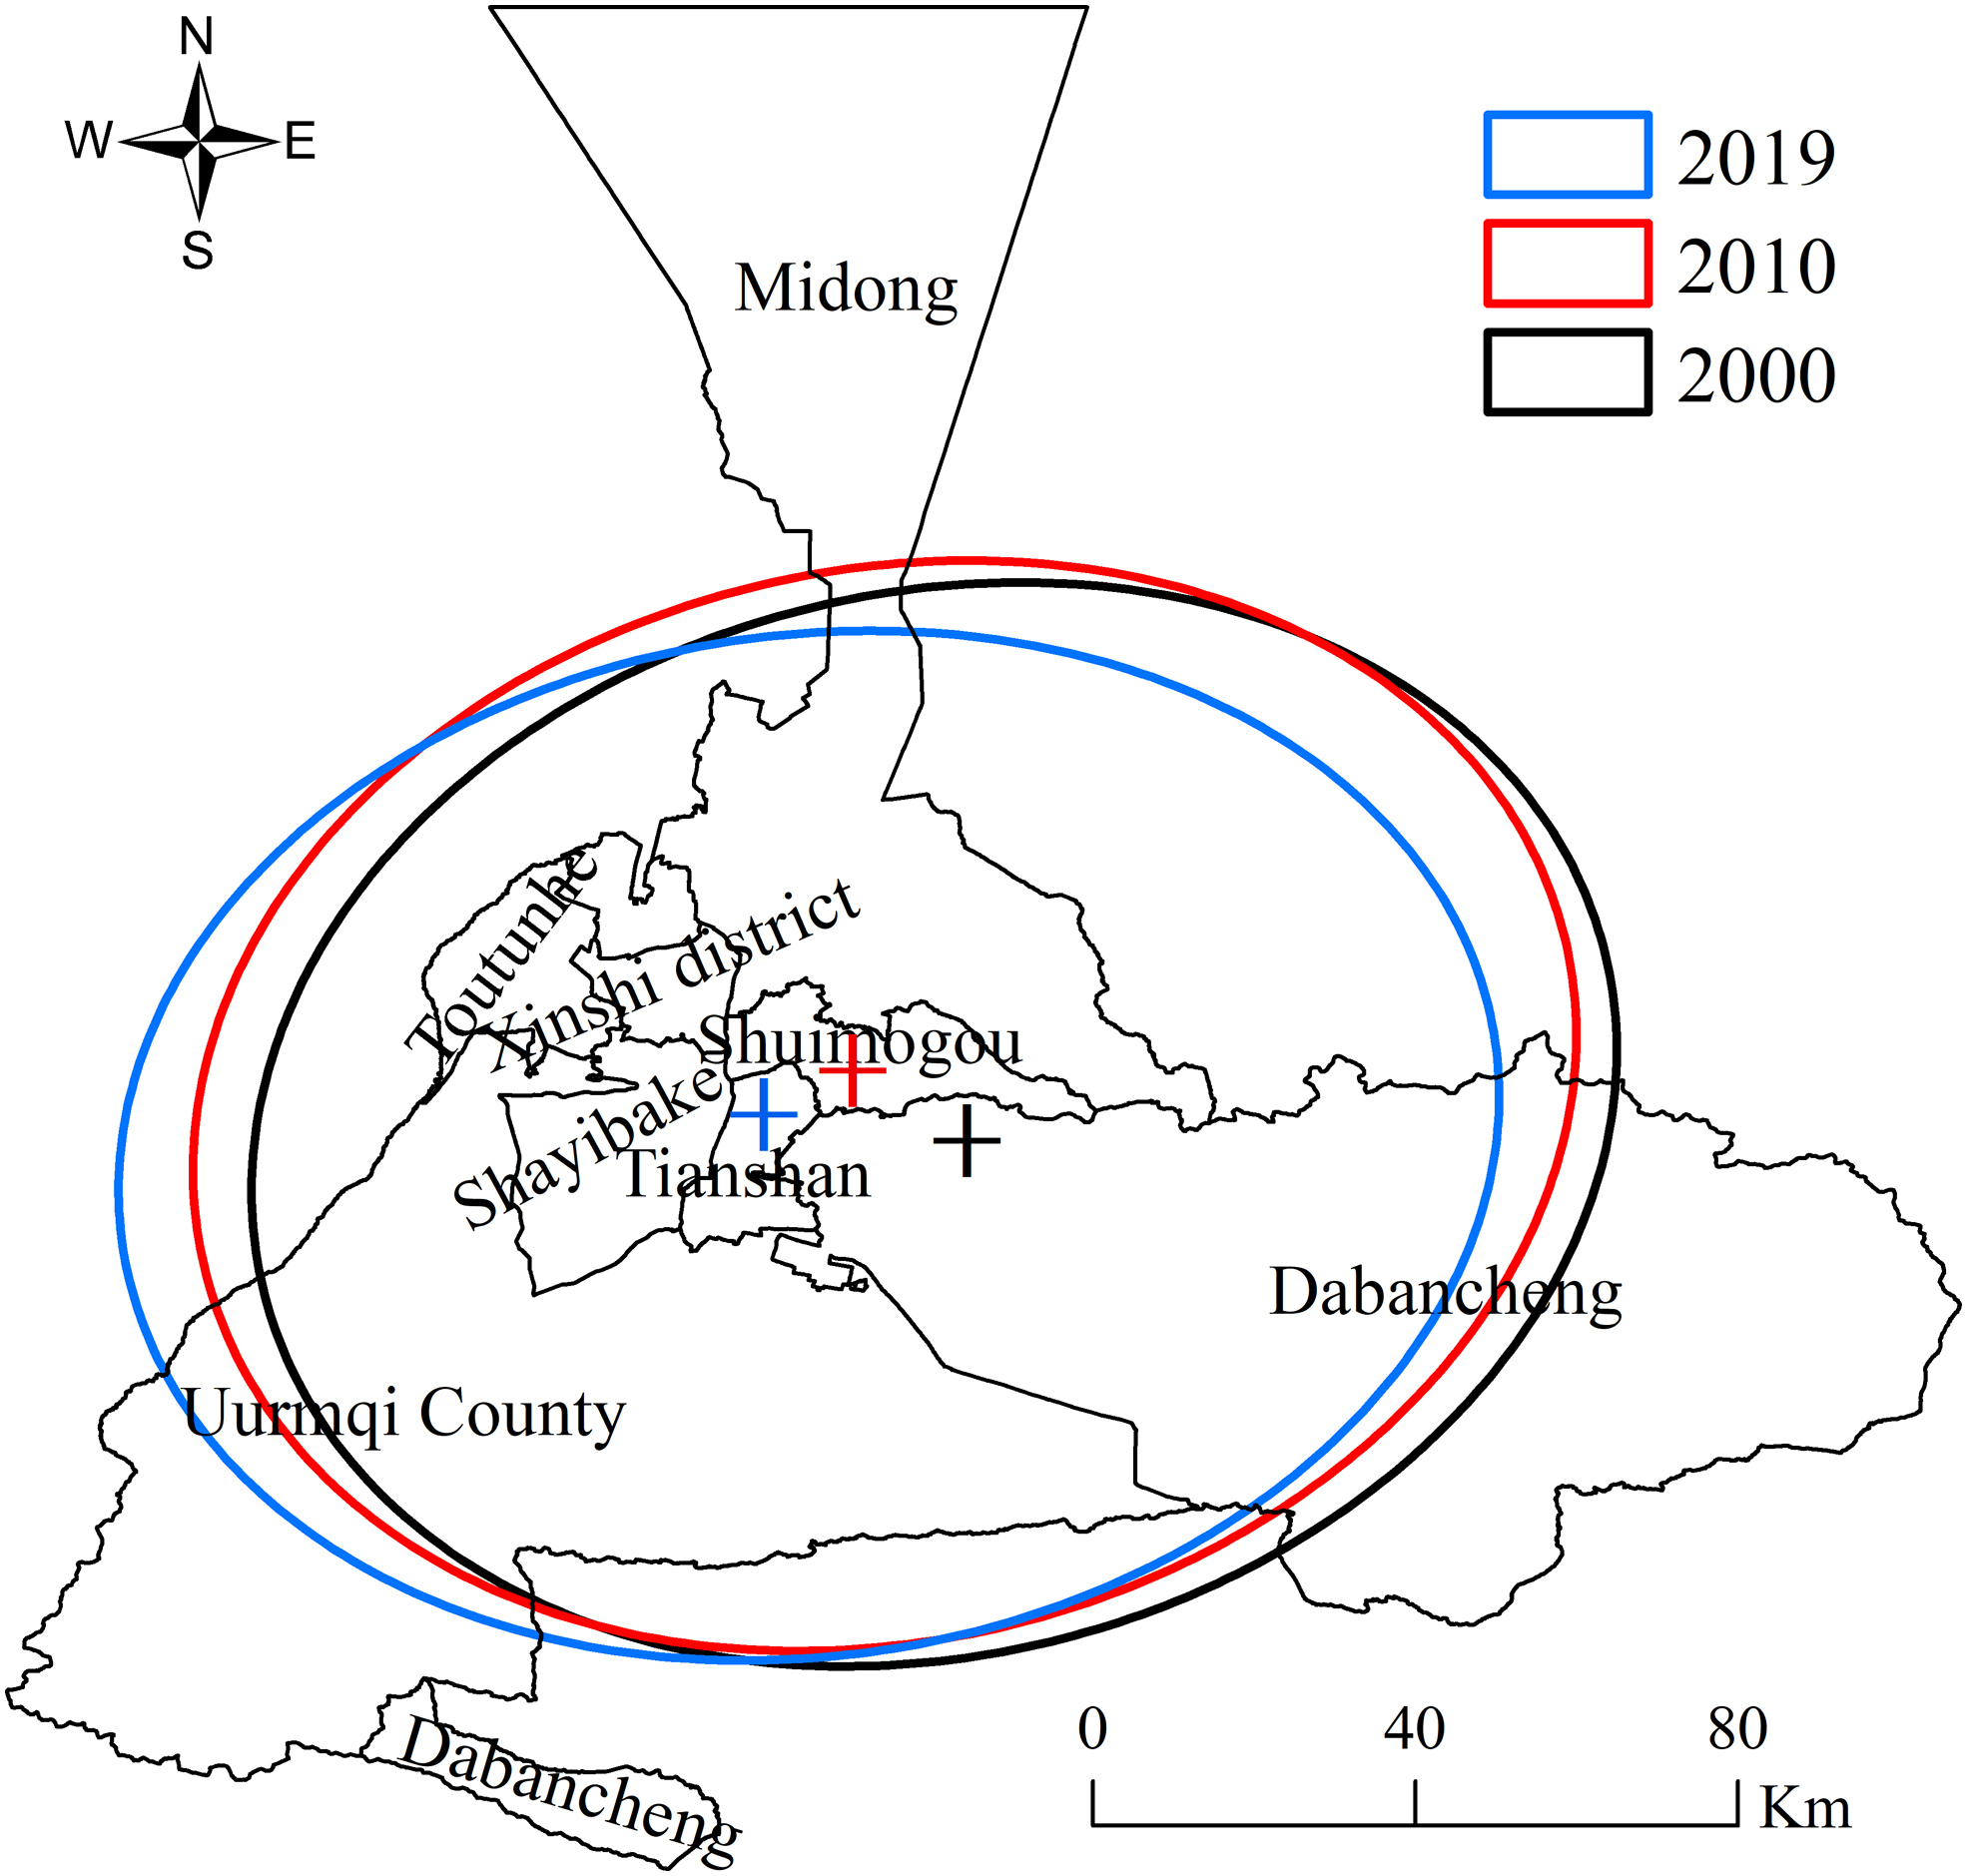
Change direction of surface temperature and the migration of center of mass.
Geographic Detector Result Analysis
Factor detection analysis
The factor detection can monitor the degree of interpretation of the influence factor on the surface temperature; the higher the influence, the closer the value of the interpretation degree to 1, and vice versa. Table 1 shows the detection results of different influencing factors on the explanatory power of surface temperature in 2000, 2010, and 2019. In 2000, the impact factors with their corresponding explanatory power were: impervious surface (60.3%) > vegetation coverage (33.6%) > land use type (21.5%) > slope (20.2%) > altitude (17.1%) > annual average temperature (14.3%) > population density (12.7%) > GDP (10.6%) > aspect (4.5%) > annual average precipitation (2.2%). The results showed that imperviousness had the greatest impact on surface temperature in Urumqi in 2000, followed by vegetation coverage and land use types.
Interpretation Power of Different Factors to Spatial Differentiation of Land Surface Temperature (q Value)
GDP, Gross Domestic Product.
Thus, imperviousness had the greatest impact on surface temperature in 2010, followed by vegetation coverage and average annual precipitation.
The results showed that impervious surfaces still had the greatest impact on surface temperature in 2019. Thus, the impervious surface and vegetation coverage were found to have the strongest influence on the spatial pattern of surface temperature in Urumqi.
Analysis of interaction detection and ecological detection
Here in, x1, x2, x3, x4, x5, x6, x7, x8, x9, and x10 are used to represent the average annual precipitation, population density, annual average temperature, land use type, altitude, slope, aspect, GDP, impervious surface, and vegetation coverage, respectively, the 10 influencing factors of impervious surface and vegetation coverage. As shown in Fig. 4, the color represents the intensity of the interaction; the yellower the color, the greater the interaction between the two factors, and the bluer the color, the smaller the interaction. “*” Represents the two-factor nonlinear enhancement, “**” represents that the two-factor interaction is not significant, and no mark represents the two-factor enhancement.

Results of interaction detector and ecological detector in 2000, 2010, and 2019.
The surface temperature interaction detection in 2000 showed that the interactive effect of impervious surface and GDP on surface temperature was highest at 68.5%, followed by the effect of impervious surface and population density at 67.4% (Fig. 4). The effect of impervious surface and slope was 65.3%. The results of ecological detection showed that the significant difference in impact factors was as high as 83.7%, and the least significant difference was 16.3%.
In 2010, the surface temperature interaction survey showed that the interaction between impervious surface and GDP was the highest in the impact of the two-factor interaction on surface temperature (58.2%), followed by the impervious surface and the average annual precipitation (56.4%) and impervious. The effect of surface and the annual average temperature was 56.2%. The results of ecological detection showed that the significant difference of impact factors was as high as 92%, and the least significant difference was 8%.
The interactive detection of surface temperature in 2019 showed that the interaction between impervious surface and GDP was the highest in the impact of two-factor interaction on surface temperature (80%), followed by the effect of impervious surface and average annual precipitation of 77.9% and imperviousness. The effect of impervious surface and slope was 77.6%. The results of ecological detection showed that the significant difference in impact factors was as high as 96.4%, and the least significant difference was 3.6%. In summary, the above detection results showed that surface temperature's temporal and spatial distribution characteristics in the study area in the past 20 years were not the result of a single factor but a combination of multiple factors. Among them, impervious surface and vegetation coverage had a great impact on surface temperature. Two-factor enhancement and nonlinear enhancement among factors were observed, and the significant differences between factors were large.
Risk detection
The risk detector model can detect the maximum surface temperature value when the impact factor is within a certain range or belongs to a certain type. In the past 20 years, when the local surface temperature was the highest, except for the average annual precipitation, population density, and GDP factor, the range of types of other influencing factors were consistent (Table 2). Construction land, impervious surface, and areas with low vegetation coverage had the highest surface temperature. The risk detection results showed that there are significant differences in surface temperature corresponding to different influencing factors. The surface temperature of Urumqi City has fluctuated in the past 20 years, especially the surface temperature of impervious surfaces; furthermore, areas with low vegetation coverage showed a significant increasing trend.
Type or Range of the Driving Factors at Maximum Surface Temperature
DEM, Digital Elevation Model.
Discussion
Verification of the inversion results of the surface temperature
The verification shows that the surface temperature retrieved in this article is in good agreement with the MOD11A2 product, which can meet the accuracy requirements of this study. The detailed validation process can be seen in Supplementary Fig. S4.
Spatial relationship between land use and surface temperature
Combined with the land use type (Supplementary Fig. S5), the Statistical table of the land use type area (Supplementary Table S2) and the surface temperature in Urumqi (Fig. 2). The spatial relationship between land use and surface temperature and the difference in surface temperature of different land use types can be further analyzed. It can be seen from Fig. 5 that the average surface temperature of construction land during the study period was the highest; the average surface temperatures in August 2000, August 2010, and August 2019 were 34.6°C, 37.4°C, and 38.5°C, respectively. Except for that of the construction land, the average surface temperature of unused land, arable land, grassland, woodland, and waters decreased sequentially. The highest surface temperature of construction land is that many artificial heat sources are formed in the production and life of urban residents.
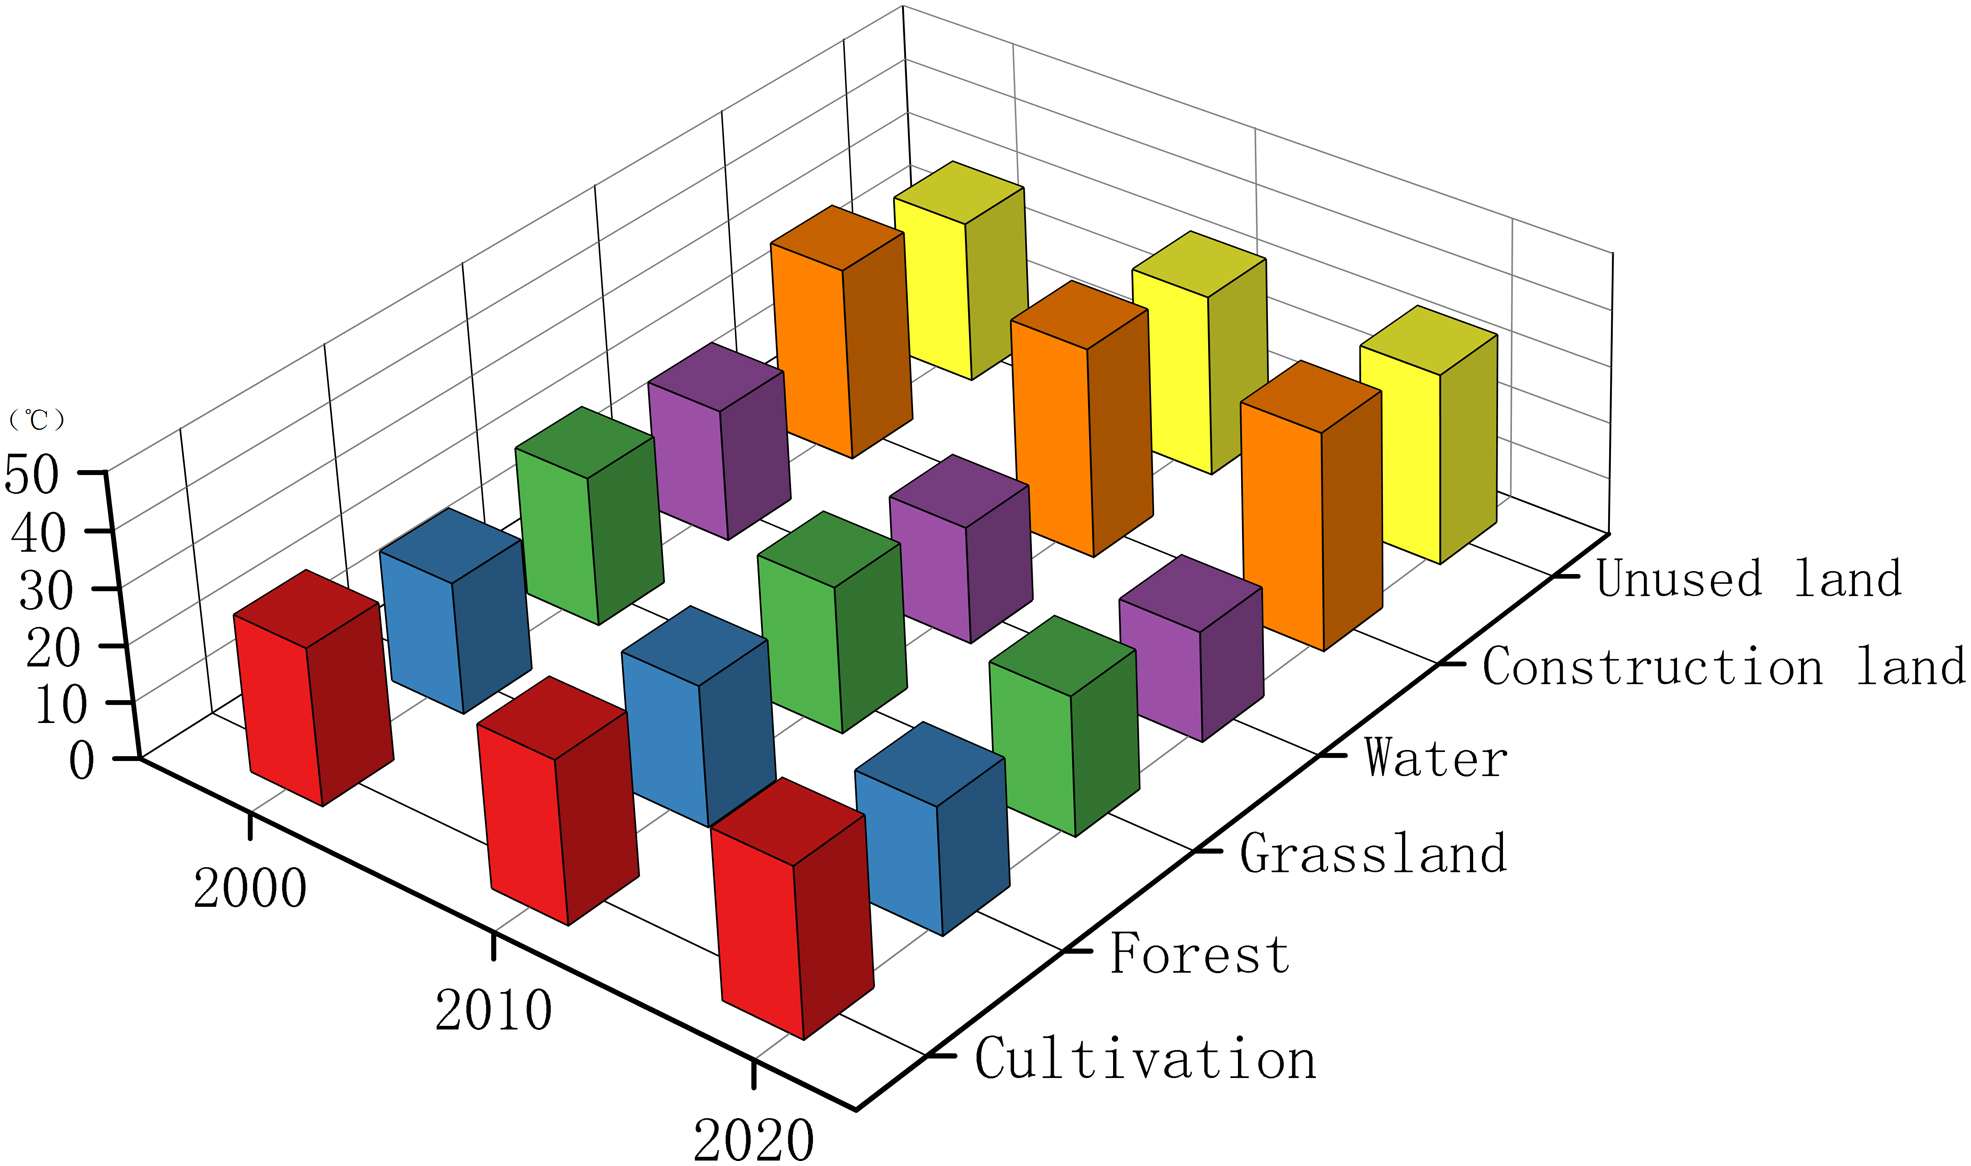
Mean surface temperature of different land use types in different periods.
Buildings and roads also absorb heat readily. In addition, the moisturizing effect of urban air pollutants increases the back radiation of the atmosphere, leading to the construction area's surface temperature increase. The unused land in the study area is mainly bare; its higher surface temperature is due to the low soil moisture content, which results in low thermal inertia. The lowest surface temperature of the water area is due to the strong heat storage capacity of the water body. The continuous increase in the average surface temperature of the construction land in the study area from 2000 to 2019 reflects the rapid development of urbanization. The increases in the internal temperature of the city have aggravated the heat island effect in the study area.
Correlation analysis of vegetation coverage, impervious surface, and surface temperature
The results of factor detection showed that impervious surface and vegetation coverage have a relatively large contribution to the surface temperature of Urumqi. From the analysis of the temporal and spatial distribution characteristics of the surface temperature in the study area, it was found that there are characteristics of high and low-temperature distribution within the city, indicating that the distribution of urban heat islands and driving factors are complicated to a certain extent (Zhou et al., 2001). To further explore the impact of the main driving factors of urban vegetation coverage and impervious surface on the urban heat island effect, 200 sample points were randomly selected in the study area to extract the surface temperature, vegetation coverage, and impervious surface information of the corresponding sample points for regression analysis, respectively. The impervious surface of the study area had a positive correlation with the surface temperature (R2 = 0.688) and the vegetation coverage has a negative correlation with the surface temperature (R2 = 0.692) (Supplementary Fig. S6).
Maimatijiang and Alimujian (2015) and Shuang et al. (2021) also obtained consistent results in their research on the thermal environment of Urumqi. In addition, the impervious surface of the study area and the areas with low vegetation coverage were also the areas with the highest surface temperature, thus forming the heat island effect in local areas of the city (Supplementary Fig. S7). The increase in urban vegetation area can help alleviate the thermal environment inside the city. To reduce the heat island effect inside the city, the expansion of artificial impervious surfaces should be strictly controlled while increasing the area of vegetation.
This study found that among the 10 influencing factors, impervious surface is the dominant factor of surface temperature in Urumqi, and the two have a significant positive correlation. Due to the accelerated urbanization of the area in recent years, the impervious surface area with limited evaporative cooling potential is increasing, and a large number of concrete, asphalt, and other building materials in the city have high heat storage and low reflectivity; solar radiation is reflected many times between buildings, and heat collects inside urban building complexes, which in turn exacerbates the urban heat island effect (Shuang et al., 2021; Dong and Zhang, 2020). Among the factors affecting the surface temperature in the area, the role of vegetation cover was second factor only to impervious surface, and vegetation cover in the study area was negatively correlated with surface temperature. Because water bodies and vegetation have a cooling effect on the environment, they can improve the urban thermal environment and reduce the surface temperature (Chen et al., 2020; Yi et al., 2006).
In addition, the rapid development of urban economy, the increase of urban population, and the large amount of nitrogen oxides, carbon dioxide, dust, and heat sources emitted by industrial production, transportation, and residents' living have also exacerbated the urban heat island effect to a certain extent. It can be seen that the formation of the urban heat island effect is the result of the combined action of many factors. Therefore, further studies on the impact of anthropogenic emissions on the surface temperature and heat island effect in the study area is needed in the future.
Conclusions
This study uses geographic information and remote sensing technology to estimate the surface temperature of Urumqi city using multi-source spatial data, selects 10 factors affecting urban surface temperature that fully consider natural and human factors by improving previous research flaws, accurately detects the driving factors of surface temperature in Urumqi city and the interaction between factors using geographic probes, and analyzes the differences of different land use types on urban heat island effect in Urumqi city in depth. The findings of the study are as follows:
Certain differences in the spatial distribution of surface temperature existed from 2000 to 2019, and a thermal environment appeared in urban built-up areas. The surface temperature in Urumqi had strong spatial autocorrelation, showing agglomeration characteristics. From 2000 to 2010, the centroid of sub-high temperature, high temperature, and extremely high temperature shifted by 30° to the northwest. Due to the rapid development of the Shuimogou District and the new urban area during this period, the surface temperature increased. From 2010 to 2019, the center of mass shifted 13° to the southwest.
Based on the factor detection analysis, the impervious surface and vegetation coverage were found to strongly have the strongest influence on the spatial differentiation of surface temperature. In addition, the changes in surface temperature were the result of a variety of influencing factors. There were differences in the interaction of different influencing factors. Most of the influencing factors and the surface temperature had a two-factor nonlinear enhancement effect. The interaction between impervious surfaces and other factors was the strongest. The type and range of the corresponding influence factor were different when the surface temperature value was the largest.
Certain differences in surface temperature of different land use types were also observed in Urumqi city. Among the land use types, the average surface temperature of construction land was the highest and continues to increase. The corresponding land types are unused land, cultivated land, grassland, woodland, and water area, from high to low. Quantitative analysis showed that the impervious surface of the study area had a positive linear relationship with the surface temperature. By contrast, the vegetation coverage had a linear negative relationship with the surface temperature. Therefore, reducing the impervious area to a certain extent and increasing the coverage of green vegetation can alleviate the thermal environment of the city.
Authors' Contributions
G.A.: experiment and data curation. Z.M.: conceptualization, supervision, writing-review and editing, and methodology. A.K.: writing-review and editing.
Footnotes
Author Disclosure Statement
No competing financial interests exist.
Funding Information
This work was supported by the Natural Science Foundation of Xinjiang Uygur Autonomous Region (2017D01A55), Xinjiang Normal University Doctoral Research Start-up Fund Project (XJNUBS2003), and Xinjiang Uygur Autonomous Region Key Laboratory Bidding Project (XJDX0909-2021-01).
References
Supplementary Material
Please find the following supplemental material available below.
For Open Access articles published under a Creative Commons License, all supplemental material carries the same license as the article it is associated with.
For non-Open Access articles published, all supplemental material carries a non-exclusive license, and permission requests for re-use of supplemental material or any part of supplemental material shall be sent directly to the copyright owner as specified in the copyright notice associated with the article.