




Abstract
The effectiveness and cost implications are always top factors for policy makers while deciding upon the appropriate air pollution abatement measures. The present study aimed to understand the actual particulate matter (PM2.5 and PM10) patterns during different phases of COVID-19 lockdown periods and depict their spatial distributions covering the 36 major areas in Delhi, India. Drastic visible reduction in both the pollutants was found during lockdown phase 1 and 2. Average PM2.5 reductions of 41.97%, 39.24%, 56.04%, and 56.77% were recorded comparing lockdown and/or study period with the years 2018, 2019, 2021, and 2022, respectively. Similar average reduction of PM10 to the magnitude of 51.72%, 48.95%, 48.24%, and 49.00% was found for the referred years. However, the reduction during the before-lockdown period of 2018 and 2019 and the year 2020 did not follow such radical reduction returning the values for PM2.5 as 7.66–14.88% and that for PM10 as 12.86–20.67%. The geospatial maps generated for Delhi city followed the similar findings at macro level depicting huge reduction in PM distribution classes for the study period. For instance, the percent surface area under “moderately high” polluted due to PM2.5 came down to 0.61 during lockdown phase 2 from 13.96 during January 2020. Further, about 15 of the 36 locations reported compliance to the National Ambient Air Quality Standards (NAAQS) for either of the pollutants during the study period. Nevertheless, such reductions are short-lived because the levels went up again in the years 2021 and 2022 (except similar lockdowns) as the situation got back to normal daily life activities postlockdown. Although, lockdown may be imposed in case of severe ambient air quality in a densely populated megacity like Delhi, it remains a temporary or quick-fix solution, to be looked as a last line of defense.
Introduction
The urban conglomerations worldwide are subject to adverse environmental effects attributed by its high population density, intense traffic volume aggravated by the ever-growing motorized transport, vehicle characteristics and also, the driving characteristics. Compared to other similar urban setup(s), the ambient concentration of air pollutants in Delhi has been reported to be in violation of limits prescribed by the World Health Organization (WHO) and National Ambient Air Quality Standard (NAAQS, India) year after year. This perennial scenario has been raising serious concerns pointing toward the remarkably worse environmental quality in the region (Mohan and Kandya, 2007; Dandona et al., 2017; Kumar et al., 2020). The deteriorating air quality of Delhi, mainly during the winters, compelled the state government implementing odd-even numbers driving system on the roads, which brought small but positive changes in air quality (Mishra et al., 2019).
The mass concentration of particulate matter (PM) largely comprises PM10 (inhalable particles, with diameters ≤10 μm, e.g., dust, pollen, mold etc.) and PM2.5 (fine inhalable particles, with diameters, in-general, ≤2.5 μm, e.g., burning particles, carbon-based compounds, metals etc.). This heterogeneous mass of particles is known to be able to travel acutely into the lungs of human bodies and thereby causing respiratory problems like emphysema and bronchitis leading to an increase in hospital visits and early death(s) (Adar et al., 2013).
A local outbreak of pneumonia of primarily unknown cause, was noticed at Wuhan in December 2019 (Hubei, China), and was rapidly determined to be produced by a novel coronavirus, specifically, severe acute respiratory syndrome coronavirus 2 (SARS-CoV-2) (Dutheil et al., 2020; Fann et al., 2012; Gautam and Hens, 2020). The outbreak since then extended to each area of mainland China as well as other continents with almost no country untouched (Devara et al., 2020; Filonchyk and Peterson, 2020). Following the epidemic, as on February 21, 2020, the total confirmed cases of COVID-19 in the world were 110,763,898 with a casualty of 2,455,331 numbers (WHO, 2021).
At this time, India was placed third in terms of confirmed case of COVID-19 (Table 1). Delhi had recorded 145 new COVID-19 cases on this date (registering just about 2.15% of numbers registered on November 20, 2020 as 6,746 numbers) whereas its tally of total cases rose to 6,37,900 from 5,29,863 recorded on November 20, 2020, thereby reporting 16.9% higher figures.
Status of Cases Related to COVID-19 (as on February 21, 2021)
WHO, World Health Organization.
There have been several researches focusing on the air quality assessment in view of the lockdown restrictions imposed by the Governments worldwide. A decline of about 14% (from 30 to 26 μg/m3) in PM2.5, ∼30% (10–7 μg/m3) in Delhi and Chennai was reported. Further, a similar trend was found for lockdown period March to April 2020 while comparing air quality data of the previous year March to April 2019 except for PM2.5 (89 μg/m3) in Delhi and PM10 levels in Delhi (at 222 μg/m3), Kolkata (at 102 μg/m3), and Bangalore (at 118 μg/m3) (Jain and Sharma, 2020).
The metropolitan cities of Kolkata, Bangalore, and Mumbai reported a similar decline of PM10 as 34%, 42%, and 47%, respectively, which were observed “during” lockdown phase in comparison to the “before” lockdown phase. The study also reported alike reduction in PM10 concentration levels in Vienna (−60.7%), Bern (−53.3%), Paris (−52.7%), Warsaw (−45.9%), and Dublin (−44.3%) during February. On the contrary, Ulaanbaatar (−43.4%), Delhi (−32.5%), Nanjing (−31.8%), Wuhan (−26.8%), and Lima (−25.7%) witnessed maximum reduction in March (Shrestha et al., 2020). A study on the impact of the lockdown period (partial, from January to March 2020) on ambient air quality in 6 cities of Hubei province, China, along with six megacities in India reported that Cities in China and India post-1-week-of-lockdown witnessed an average decline in AQIPM2.5 and AQINO2 of 11.32% and 48.61% as well as 20.21% and 59.26%, subsequently.
The results indicated that such a drop in AQINO2 was instantaneous when compared with the rather gradual decline in AQIPM2.5 (Agarwal et al., 2020). In an alike study, Air Quality Index (AQI) variations were analyzed the before and after nationwise lockdown reporting a major sustaining type of decline in the average AQI values for major Type-1 and Type-2 cities due to the reduction in public movement and industrial activities, whereas the reduction in AQI values for Type-3 and Type-4 cities was observed to be fluctuating due to the continued small-scale industrial activities and low awareness level about ban on public gathering programs (Selvi et al., 2020).
An analysis using the National Air Quality Index (NAQI) to demonstrate the spatial pattern of air quality before and during lockdown phases in Delhi witnessed positive change therein. PM revealed maximum reduction (>50%) in comparison to the prelockdown phase, while ambient levels of other gaseous pollutants, such as NO2 (−52.68%) and CO (−30.35%) were also reduced during-lockdown phase reporting about 40% to 50% betterment. Further, about 54%, 49%, 43%, 37%, and 31% reduction in NAQI were observed in Central, Eastern, Southern, Western, and Northern areas of the Indian capital city (Mahato et al., 2020).
Observation data from the China National Environmental Monitoring Center (CNEMC) revealed that compared to levels in 2019, the average concentration of PM2.5 got reduced by 35%, 29%, and 19% in Wuhan, Hubei (Wuhan excluded), and China (Hubei excluded), respectively. The temporal variation and spatial distribution reported decrease in PM2.5 and NO2 concentrations, which was found to be relatively consistent (Chu et al., 2020). An investigation on the impact of short-term lockdown during the period from March 15 to April 12, 2020 on the ambient levels of gaseous and PM in about 11 Spanish cities found that lockdown had a considerable impact on observed reduction in PM10 in almost all cities, however, did lead to increase in O3 levels in a few areas (Briz-Redón et al., 2020).
Interestingly, lockdown scenarios contributed to significant reduction of PM2.5 and PM10 in ambient air quality by way of surface and off-surface transport activities and also through fuel combustion in commercial and institutional buildings; however, such reductions were counter-balanced by an increase of PM emissions from the household activities (e.g., domestic heating and biomass burning (Devara et al., 2020; Sicard et al., 2020).
After a thorough review of concurrent literature and understanding the gaps, the present study was undertaken with the following objectives:
Land-use pattern (LUP)-wise average variation of PM2.5 and PM10 over the 36 study sites during lockdown phases. LUP-wise variation in PM2.5:PM10 ratios during lockdown phases and through 2019–2022. LUP-wise average changes in PM2.5 and PM10 through 2019–2022. Average meteorological conditions vis-à-vis PM2.5 and PM10 variations through 2019–2022. Spatial distribution of PM2.5 and PM10 over the entire city of Delhi comprising different distribution classes, namely, “low,” “moderately low,” “moderate,” “moderately high,” and “high.” The geographic information system (GIS) tool-generated maps were presented as a supplemental analysis to get a glimpse of how the PM was distributed over the entire city and was limited only to the study period (January 2020 to May 2020). Assessment of compliance of PM levels toward the extant NAAQS.
Research Methodology
Study area
The National Capital Territory (NCT) of Delhi has a total geographical area of 1,483 km2 with diverse LUPs (CPCB, 2011, 2012). The study area is bordered by the peripheral districts of Gurgaon, Sonipat, Bahadurgarh, and Faridabad of Haryana and Ghaziabad, Noida, and Greater Noida districts of Uttar Pradesh state. A total number of 36 locations (Table 2) denoted from L1 to L36 have been selected within the NCT of Delhi for the present study (Supplementary Fig. SM1 in the Supplementary Data).
Schedule of Lockdown Restrictions in Delhi
Materials and methods
Base data
The base data that is, PM2.5 and PM10 concentrations, have been retrieved from the 36 Air Quality Monitoring Stations (AQMS) in NCT of Delhi for the entire period of study and data analysis (i.e., from January to May; 2019–2022). The AQMS located across Delhi are owned/operated by three agencies, viz., Central Pollution Control Board (CPCB), Indian Institute of Tropical Meteorology (IITM), and Delhi Pollution Control Committee (DPCC). The data recording, quality control and other aspects may be referred from Data Recording & Quality Control section in the Supplementary Data.
The location of the monitoring stations is representative of all four types of LUPs (i.e., commercial, residential, transport, and institutional) falling within urban areas of the city (Table 2). Twenty-four hours' average secondary data for all the parameters used in the study (namely, PM, and meteorological) were used in the present study corresponding to the lockdown, pre-, and post-lockdown (or extended) phases. The schedule of lockdown follows as in Table 2. The other particulars of the lockdown imposed in Delhi, India, can be had from the from Particulars & Schedule of Lock-Down in the Wake of COVID-19 section in the Supplementary Data.
The PM that is, PM2.5 and PM10 concentration levels were analyzed from January 2020 to May 2020 during the pre- and post-COVID-19 pandemic phases and additionally for the corresponding periods of year 2018, 2019, 2021, and 2022 for the trend analysis purposes (Table 3).
Selected Locations of Study Area Covered by Existing Air Quality Monitoring Stations
AQMS, Air Quality Monitoring Stations; DTU, Delhi Technological University; LUP, land-use pattern.
The spatial interpolation tools and technique
The GIS was used for the spatial dissemination of the point data recorded over the environment span (Cao et al., 2007; Adams and Kanaroglou, 2016; Li et al., 2018; Kumar et al., 2020). The point locations were interpolated to generate thematic (spatial variability) maps that exhibit the trends of Spatiotemporal dynamics in relationship to the corrosion-scaling potential possible within the surface boundaries. Such dynamics was created using the spatial analyst function available in the ArcGIS tool. The inverse distance weighting interpolation technique has been applied for estimating the values between the computed data points.
This technique encompasses the calculation of the weighted values for the unsampled point considering that it is inversely proportional to the squared distance between the observed point data and that of the unsampled location (Qu et al., 2010; Burrough et al., 2015; Jiang and Bai, 2018). This is to be noted that, however, the exactness of the surface interpolation generated using this technique is highly dependent upon the distribution, density, accuracy, and resolution of the input point dataset (Tyagi and Sarma, 2020).
Results
Effect of different lockdown phases and corresponding periods on PM2.5 concentration
In January 2020, the maximum mass concentration range of PM2.5 (over 200 μg/m3) was found at three locations, namely, Nehru Nagar (L23: 219.65 μg/m3), Jahangirpuri (L14: 206.15 μg/m3), and Wazirpur (L36: 200.28 μg/m3). Former two areas belonged to residential LUP, while the later to the commercial.
Further, in February 2020, highest monthly average concentrations (>150 μg/m3) were recorded at six study locations, namely North campus (L24: 165.18 μg/m3); Mundka (L19: 163.23 μg/m3); Narela (L22: 159.69 μg/m3); ITO (L13: 156.97 μg/m3); Sirifort (L32: 152.77 μg/m3), and Anand Vihar (L2: 152.58 μg/m3). The lowest value range, that is, <100 μg/m3 corresponded to five locations, viz., Rohini (L30), Punjabi Bagh (L27), Okhla Phase 2 (L25), IHBAS-DG (L12), and Patparganj (L26) as 79.80, 82.88, 97.34, 98.38, and 98.58 μg/m3 correspondingly. All the locations, irrespective of LUPs, exceeded NAAQS for PM2.5 that is, 60 μg/m3 (Figs. 1 and 2).

Average PM2.5 variations during pre- and lockdown phases and corresponding periods of 2021 and 2022 (L1–L18). PM, particulate matter.
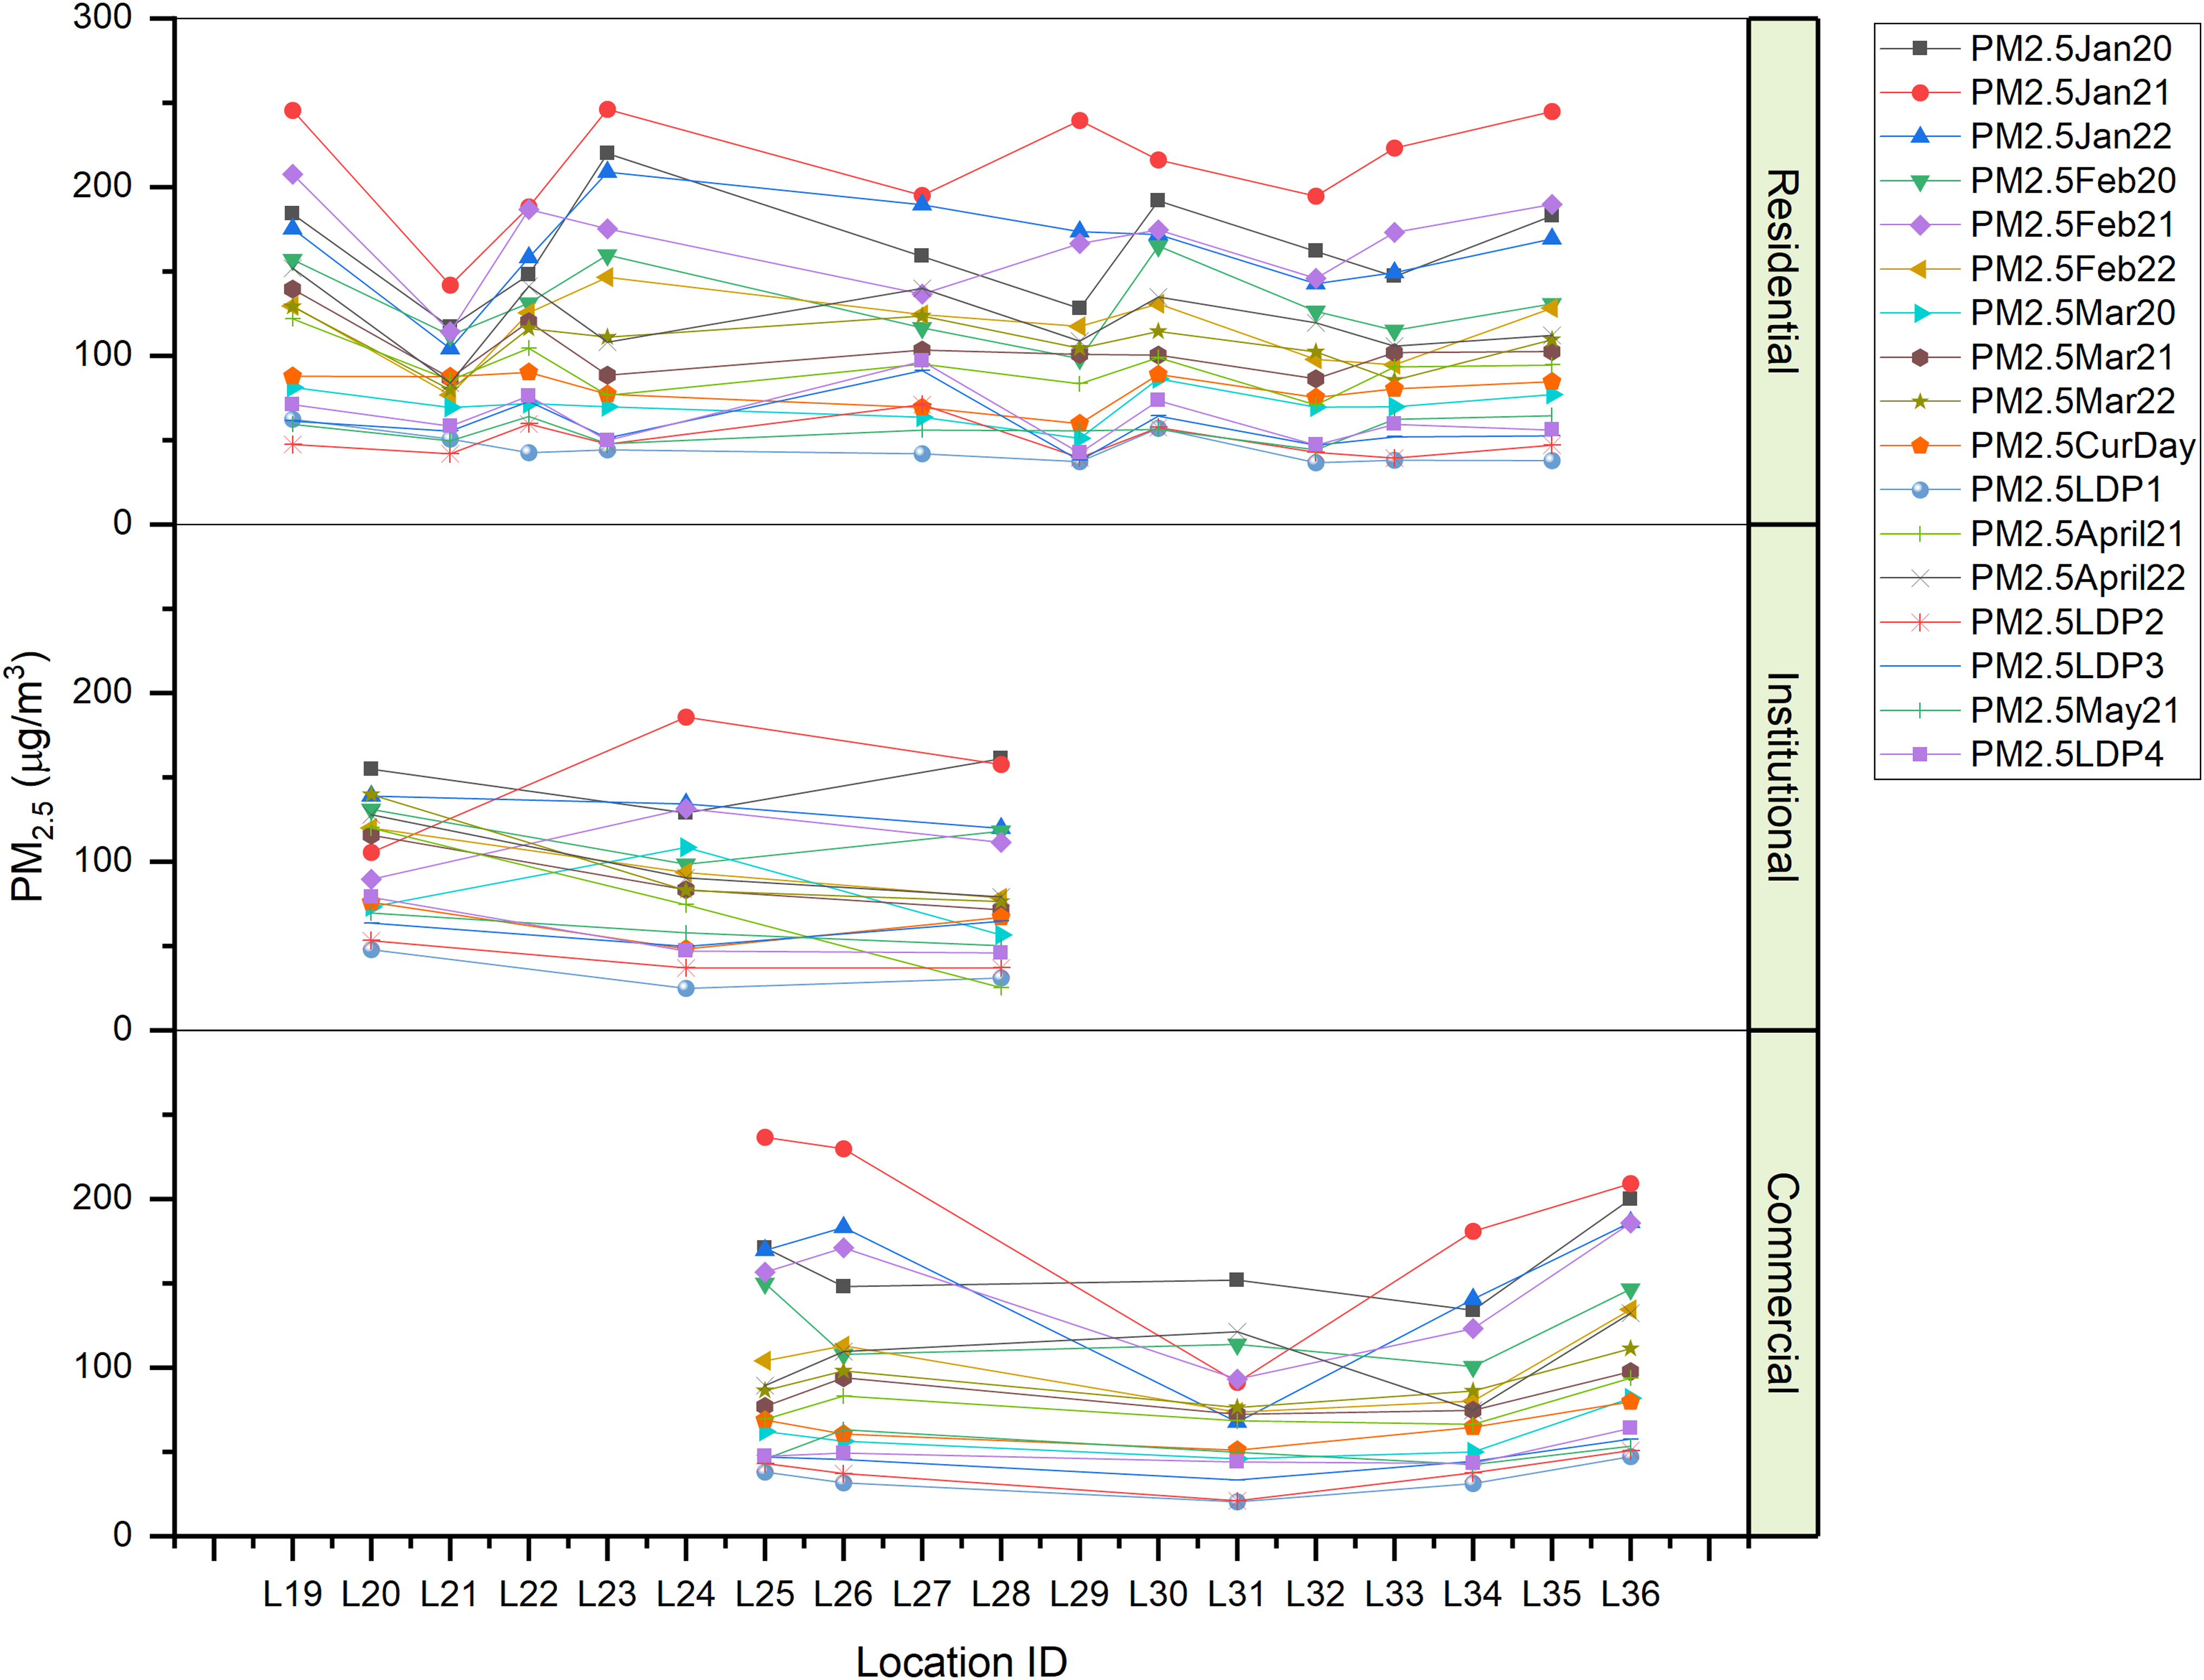
Average PM2.5 variations during pre- and lockdown phases and corresponding periods of 2021 and 2022 (L19–L36).
In March 2020, 11 of 36 locations complied with NAAQS for PM2.5 by recording average values below 60 μg/m3. These were Shadipur (L31: 46.0 μg/m3), Lodhi Road (L16: 48.1 μg/m3), Sri Aurobindo Marg (L34: 49.9 μg/m3), Aya Nagar (L4: 50.5 μg/m3), R.K. Puram (L29: 51 μg/m3), IGI Airport-Terminal 3 (L11: 55.5 μg/m3), Patparganj (L26: 56.4 μg/m3), Pusa (L28: 56.5 μg/m3), Major Major Dhyan Chand National Stadium (MDCNS, L17: 56.5 μg/m3), Dr. Karni Singh Shooting Range (DKSSR, L8: 56.9 μg/m3), and Jawaharlal Nehru Stadium (JNS, L15: 58.1 56.5 μg/m3). All remaining 25 locations (majority of residential and institutional LUP areas) exceeded the NAAQS with Dwarka-sector and North Campus recording the highest values over 100 μg/m3, that is, 114.07 and 108.60 μg/m3, respectively.
During 14 h public curfew on March 22, 2020, only three of the locations complied with the prescribed annual average PM2.5 concentration of 60 μg/m3, that is, R.K. Puram (L29: 59.71 μg/m3), Shadipur (L31: 50.99 μg/m3), and North Campus (L24: 48.32 μg/m3). All remaining 33 locations violated such norms, majority being a mix of residential and institutional LUP areas (Fig. 3). During LDP1, interestingly, 35 locations conformed to PM2.5 concentration of 60 μg/m3 (from L1 to L18 and L20 to L36) with only Mundka (L19, residential LUP) recording the highest average concentrations as 62.31 μg/m3.

Average PM10 variations during pre- and lockdown phases and corresponding periods of 2021 and 2022 (L1–L18).
During LDP2, except 4 locations, namely ITO (L13: 109.21 μg/m3), Punjabi Bagh (L27: 71.07 μg/m3), Lodhi Road (L16: 68.20 μg/m3), and Bawana (L5: 63.31 μg/m3), most of them representing commercial LUP, seeing a violation of the prescribed standard, all other 32 locations complied to it by having values lower than 60 μg/m3. Further, DKSSR (L8: 30.45 μg/m3), Shadipur (L31: 21.13 μg/m3), and IHBAS-DG (L12: 18.78 μg/m3) witnessed the lowest concentrations.
During LDP3, as many as 14 locations recorded values above 60 μg/m3 violating the NAAQS norm, such as Punjabi Bagh (L27: 91.19 μg/m3). Anand Vihar (L2: 81.99 μg/m3), Lodhi Road (L16: 80.76 μg/m3), Bawana (L5: 77.13 μg/m3), Aya Nagar (L4: 76.77 μg/m3), ITO (L13: 75.82 μg/m3), Narela (L22: 72.94 μg/m3), Pusa (L28: 64.67 μg/m3) Alipur (L1: 64.51 μg/m3), Rohini (L30: 64.33 μg/m3), NSIT-Dwarka (L20: 63.59 μg/m3), Delhi Technological University (DTU; L7: 61.75 μg/m3), Jahangirpuri (L14: 61.66 μg/m3), and Mundka (L19: 61.26 μg/m3). All remaining 22 locations were found in conformance to the norm having recorded values below 60 μg/m3. R.K. Puram (L29), DKSSR (L8) and Shadipur (L31) recorded the lowest values as 37.82, 37.44, and 33.44 μg/m3, respectively.
LDP4 saw as 15 locations recording average concentrations >60 μg/m3, thus flouting NAAQS. These were Punjabi Bagh (L27: 96.71 μg/m3), Bawana (L5: 80.26 μg/m3), NSIT-Dwarka (L20: 78.96 μg/m3), DKSSR (L8: 76.73 μg/m3), Narela (L22: 76.10 μg/m3), Rohini (L3: 73.36 μg/m3), Anand Vihar (L2; 71.94 μg/m3), Jahangirpuri (L14: 71.76 μg/m3), ITO (L13: 71.38 μg/m3), Mundka (L19: 71.04 μg/m3), DTU (L7: 70.99 μg/m3), Alipur (L1: 68.43 μg/m3), Wazirpur (L36: 63.99 μg/m3), IHBAS-DG (L12: 62.89 μg/m3), and Aya Nagar (L4: 60.99 μg/m3).
Effect of different lockdown phases and corresponding periods on PM10 concentration
During January 2020, all locations violated NAAQS norm of 100 μg/m3 (24 h average) prescribed for PM10. Four locations even recorded more than three times of NAAQS, that is, 317.73, 303.55, and 301.57 μg/m3 (L9, L14, and L36, respectively). Values >150 and <200 μg/m3 were reported at least four locations, namely L16 (192.89 μg/m3), L34 (169.26 μg/m3), L4 (167.91 μg/m3), and L21 (158.1 μg/m3), respectively (Fig. 3). In February 2020, all the selected locations were flouted the corresponding air quality standard (100 μg/m3) as set by CPCB. Twenty-three locations were recorded double the prescribed norm and up to 328.43 μg/m3 (recorded at L9), whereas 13 locations witnessed values between 150 and 200 μg/m3 (L34, L4, L16, L21, L13, L26, L18, L24, L27, L28, L8, L17, and L11 in descending order) (Fig. 3). A variation in effect of LUP on PM10 from that on PM2.5 was noted.
During March 2020 too, all the locations recorded values greater than the prescribed norm of PM10 except location L34, which reported an average monthly concentration of 90.7 μg/m3. More than 15 locations depicted concentration >150 and <200 μg/m3 (L9, L24, L6, L36, L2, L32, L19, L7, L14, L5, L30, L22, L35, L25, and L3 in reducing order).
Similar to March 2020 data, during 14 h curfew period, the average concentration of PM10 at all the locations exceeded the NAAQS norms expect location L34, which reported the concentration of 93.44 μg/m3. However, only 5 of 36 locations recorded concentration >150 and <200 μg/m3 (L22 > L14 > L5 > L2 > L7), (Fig. 4).
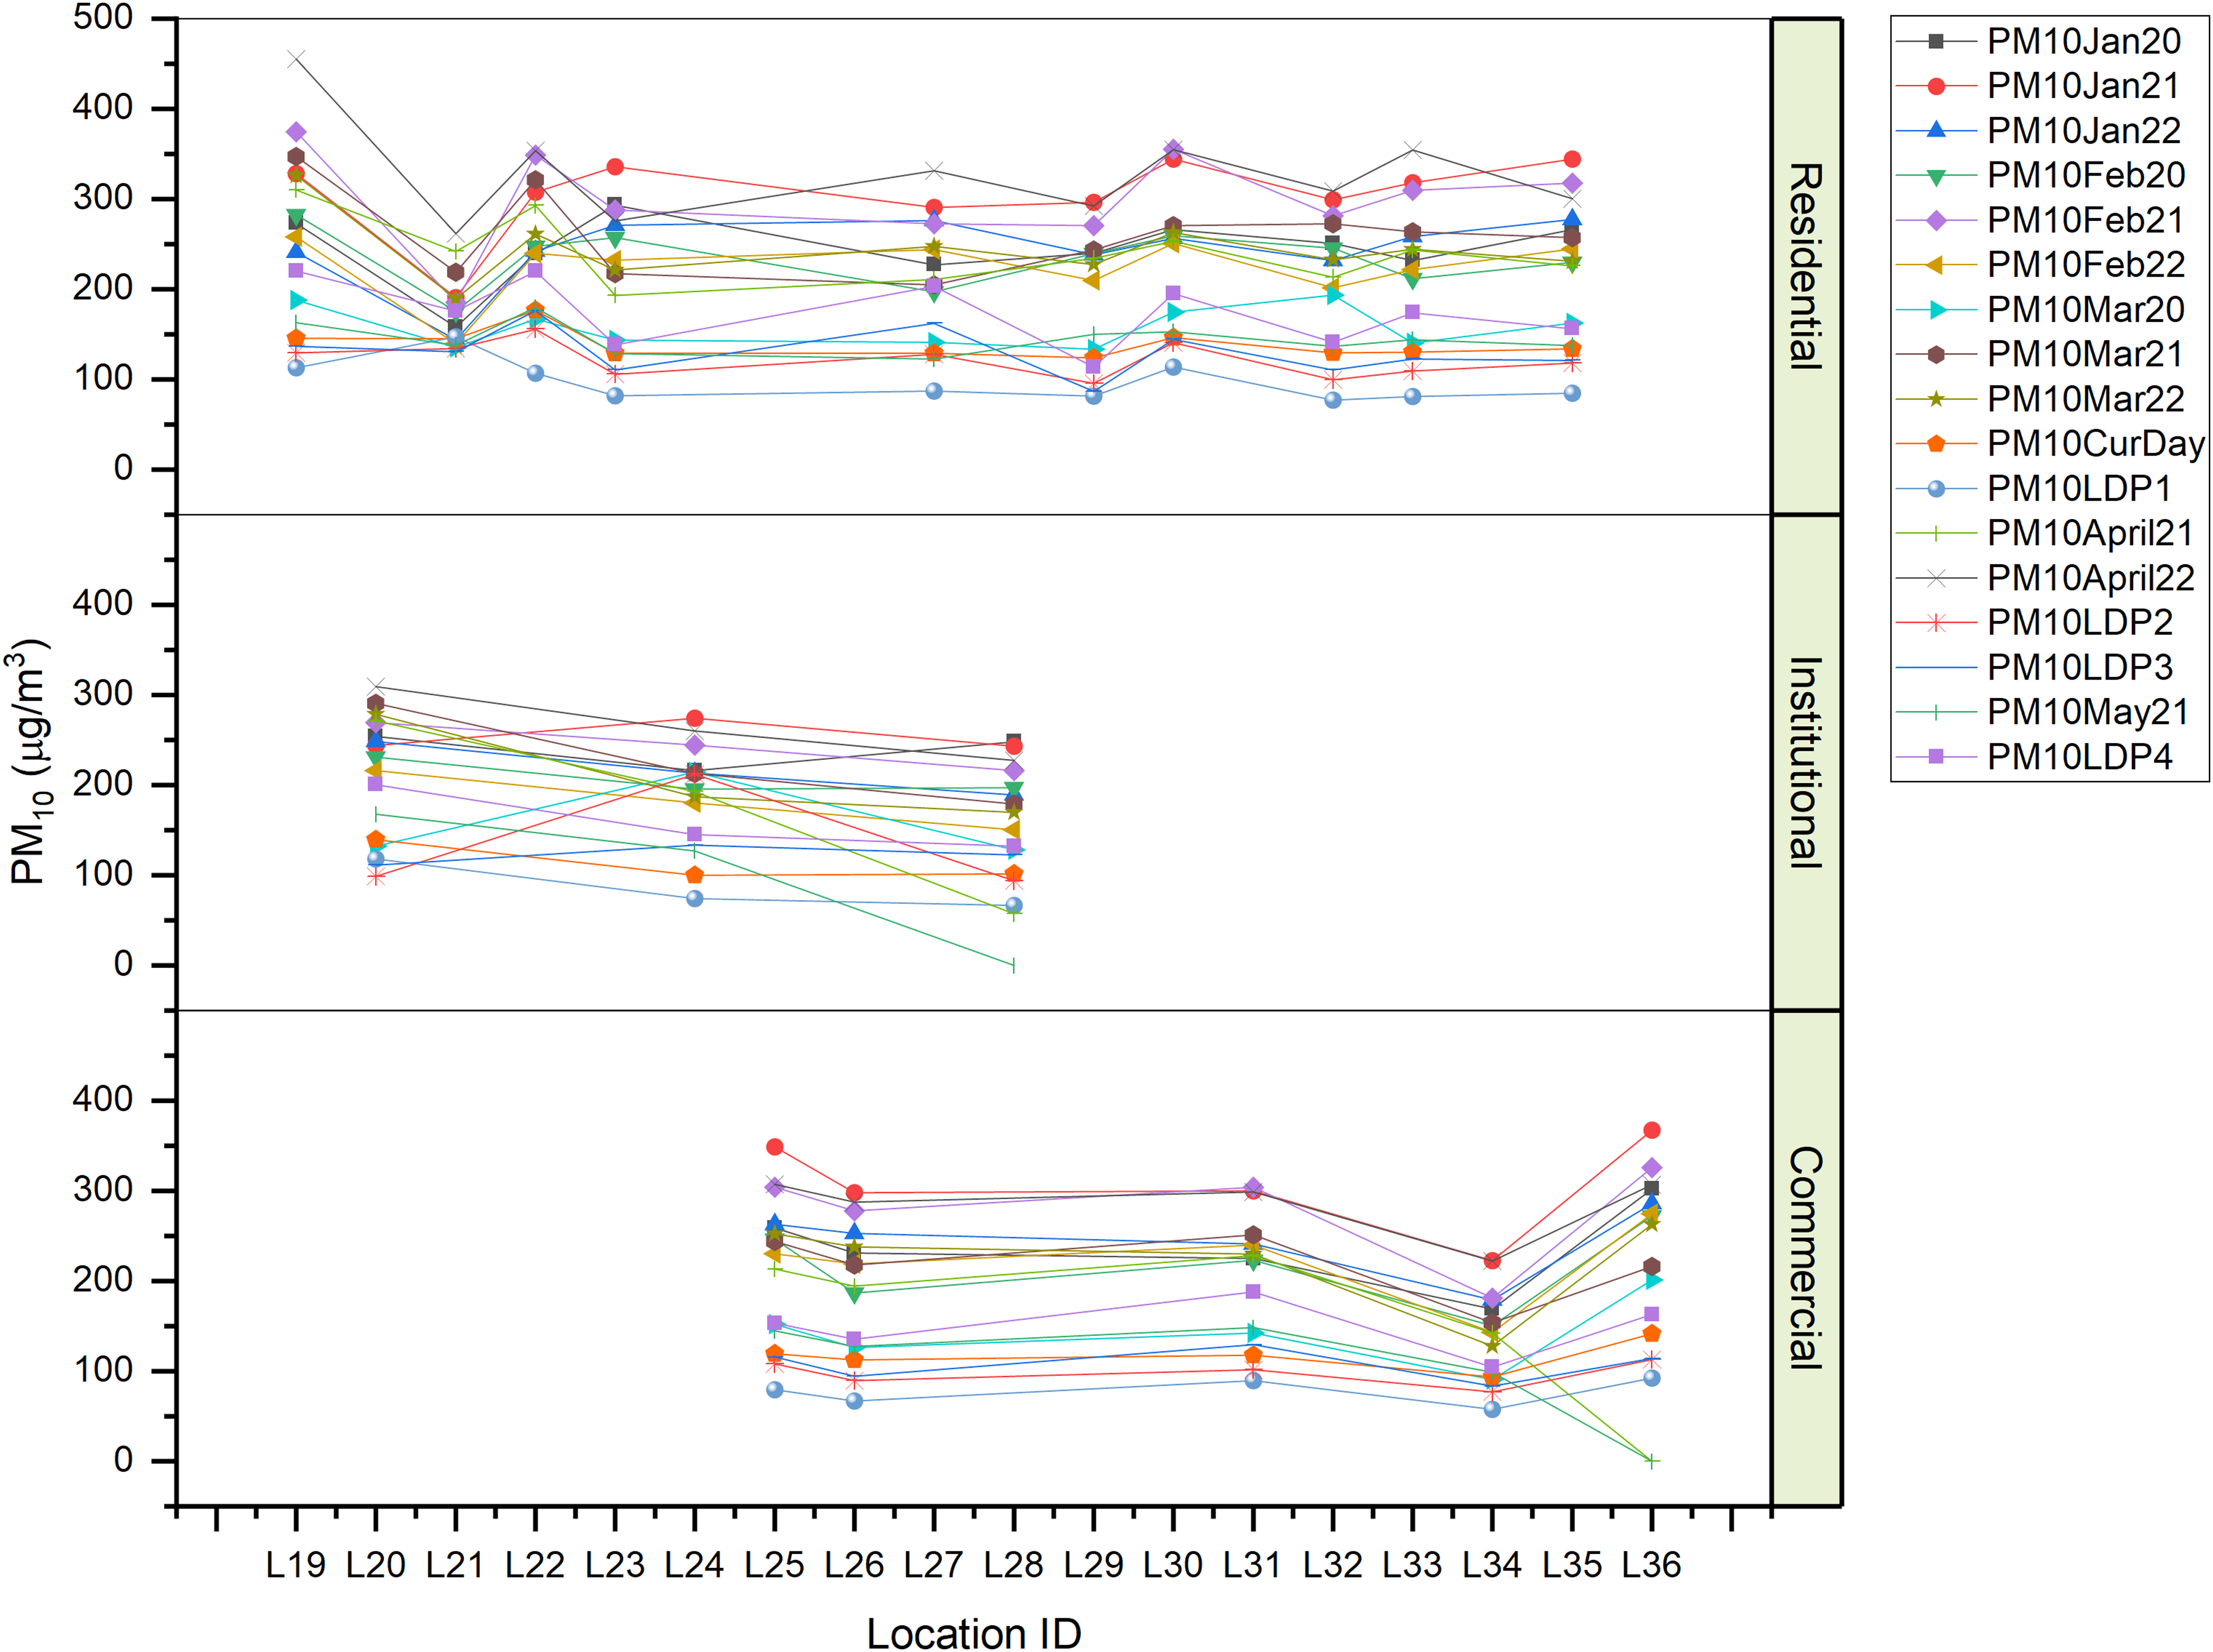
Average PM10 variations during pre- and lockdown phases and corresponding periods of 2021 and 2022 (L19–L36).
During LDP1, 23 locations conformed to PM10 concentration of 100 μg/m3 (L34, L4, L28, L26, L17, L16, L13, L11, L8, L24, L18, L32, L15, L2, L25, L33, L29, L3, L23, L6, L35, L27, and L36 in ascending order), whereas remaining locations did not comply to the norm. During LDP2, only 15 locations complied with the prescribed PM10 norm, whereas remaining locations did not. The highest recorded value increased to LDP1 (147.15 μg/m3 at L21 vis-à-vis 212.1 μg/m3 at L24). The compliance scenario worsened during LDP3 with only 13 locations complying with PM10 norm, whereas 23 locations remained noncompliant. Location L13 recorded maximum concentration at 303.48 μg/m3 about three times the standard.
The LDP4 witnessed worst compliance to the prescribed PM10 standard as none of the locations complied with it. As many as six locations even showed just double concentration values compared to the norm (L19, L22, L7, L14, L5, and L27).
The positive impact on ambient average PMS concentrations during lockdown phases are attributable to its strict implementation by the Government (Central and State both) further supported by the citizens of Delhi. Only essential services and people needing medical attention along with those attending them were allowed during LDPs. Police, other enforcement and monitoring agencies together with certain Non-Governmental Organizations (NGOs) took up to the task and helped the cause.
The average reduction in PMS over corresponding periods from four different years (2018, 2019, 2021, and 2022) was also looked into vis-à-vis study locations and the period of 2020 in-question. The result of such analysis is depicted in Supplementary Figs. SM2 and SM3 in the Supplementary Data (for PM2.5 and PM10, respectively). PM (PM2.5:PM10) ratios were also examined at all the locations with a view to understand the proportion of PM2.5 and PM10. As the higher ratios (i.e., higher proportion of PM2.5 in PM10 or total PM) are considered to be indicator of presence of natural aerosols in total PM in the ambient air contributed by various natural phenomenon and the lower ratios are indicative of lesser proportion of PM2.5 in total PM, that is, lesser degree of aerosols sourced from anthropogenic causes, such as vehicular exhaust, construction activities and so on (Zhao et al., 2019; Biswas et al., 2020). The location-wise PM ratios are presented in Supplementary Figs. SM4 and SM5 in the Supplementary Data through the years 2018–2022.
Impact of different lockdown phases on spatial distribution of PM2.5 and PM10
The GIS mapping of monthly average PMS during January, February, March 2020, curfew days, and LDP1, 2, 3, and 4 were also undertaken in the present study (as part of supplemental study) and spatial distribution results are presented in Figs. 5 and 6. The pollution level is assigned as five-class distribution namely low, moderately low, moderate, moderately high, and high. This is done so, so as to provide more scope in depicting the range of results in five classes. This methodology has also been adopted in previous studies (Followed by: Gupta and Sarma, 2016; Kumar et al., 2020).
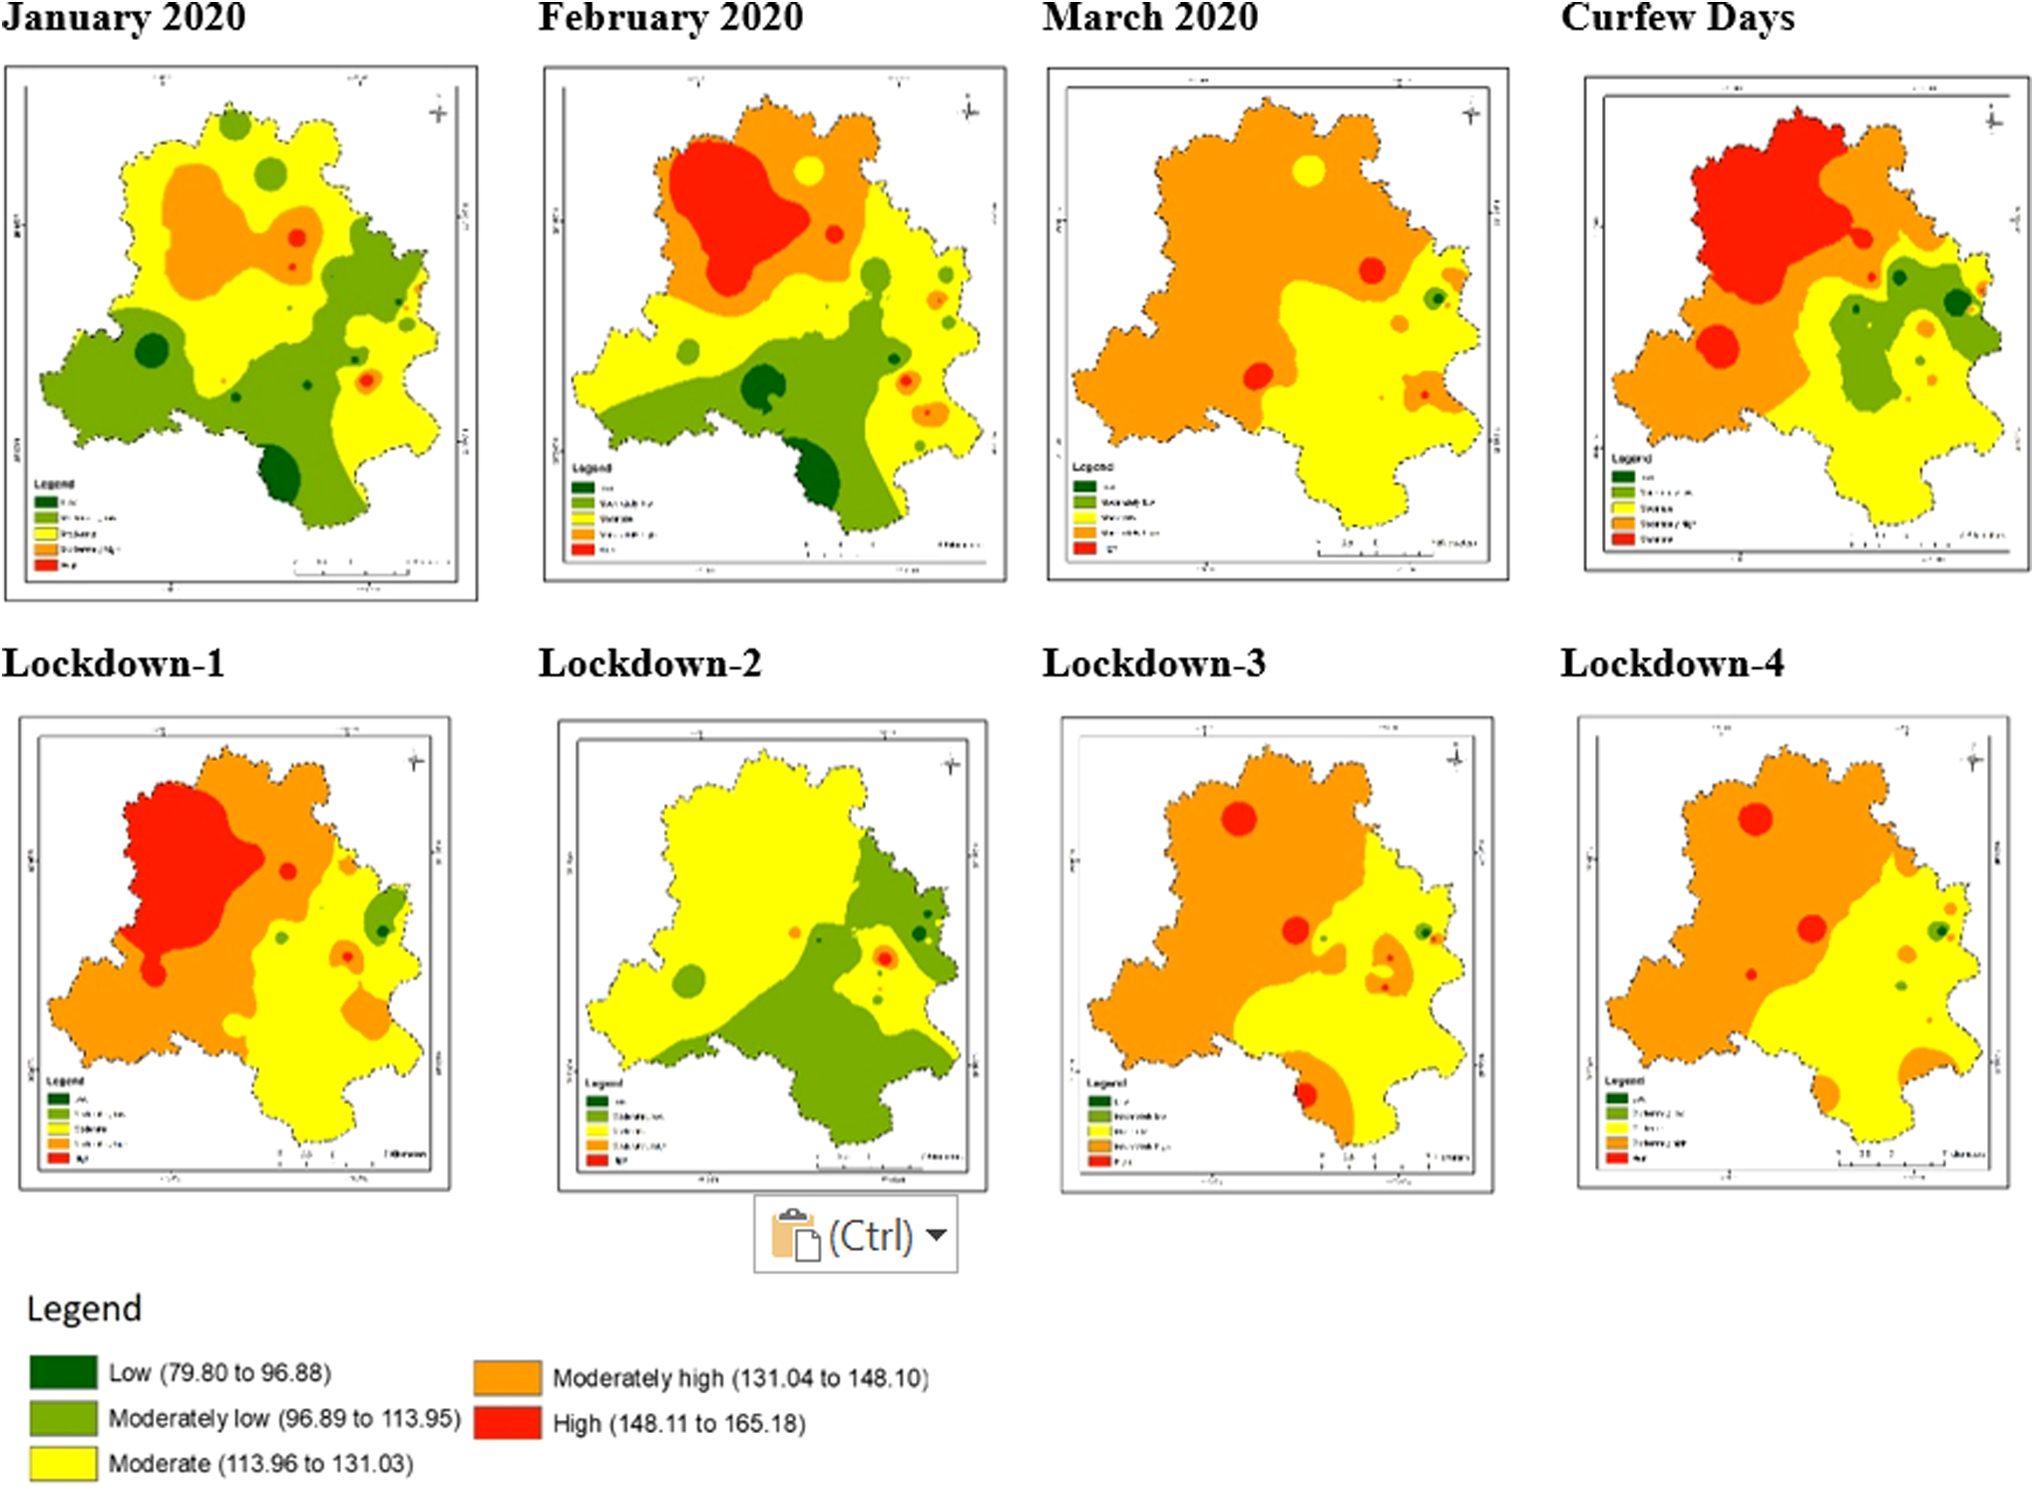
The spatial distribution of PM2.5 over Delhi city.

The spatial distribution of PM10 over Delhi city.
Average PM2.5 spatial distribution over NCT of Delhi in various class range show low (79.80–96.68 μg/m3), moderately low (96.96–113.95 μg/m3), moderate (113.96–131.03 μg/m3), moderately high (131.04–148.10 μg/m3), and high (148.11–165.18 μg/m3) (Table 4). On the contrary, the PM10 concentration range is represented as low (150–177.48 μg/m3), moderately low (177.49–204.43 μg/m3), moderate (204.44–231.37 μg/m3), moderately high (231.38–258.32 μg/m3), and high (258.33–285.26 μg/m3) (Table 5).
Area in Square Kilometer Under Each Distribution Class of PM2.5 Values in Delhi
PM, particulate matter.
Area in Square Kilometer Under Each Distribution Class of PM10 Values in Delhi
The January and February 2020 (prelockdown period) showed a higher value of PM2.5 and PM10 as all the activities of industry, transport, commerce, and others were at normal paces. The maximum concentration level was observed in northwest Delhi. This is because of the presence of high vehicular and industrial activities in that area. There was a drastic reduction in the values of PMS in parts of central, east, south, and southwest Delhi because of restrictions during the lockdowns. The curfew day also showed a lower level of pollution than the prelockdown phase (Figs. 5 and 6).
Areas under these moderately high ranges prolonged during the early lockdown phase-1 period and gradually started declining. In this phase, almost all the activities were strictly enforced to close down with strong vigilance from the Government. The outcome of these enforcements was observed during the lockdown phase-2 where the area under PM2.5 was drastically reduced. Relaxations in many activities were given during the lockdown phase-2, and as a result, the area under PM2.5 during lockdown-3 again increased in alarming rate. Similar was the case for lockdown-4. In addition, the high pollution level in early March 2019, just before the lockdown could possibly have kept the monthly mean values of March 2020 in few cities unaltered amid a blanket restriction over traffic flow, industries, and other businesses, and industries. A quick decline in pollutant levels in such cities due to lockdown is more peculiar (Shrestha et al., 2020).
Meteorological aspects
The meteorological parameters during the study period were also collected as secondary data from India Meteorological Department (IMD) web portal and analyzed. Four variables were studied, that is, atmospheric temperature (AT, unit °C), solar radiation (SR, unit W/m2), wind direction (WD, unit °), and wind speed (WS, unit m/s). All the parameters used in the study correspond to 24 h average values over the study period, which spanned from January 1 to May 31, 2020 and pre- and postlockdown periods between 2019 and 2022. The meteorological parameters were plotted against the average PM values against all the study locations to assess any significant variation over the study locations (Supplementary Figs. SM6–SM13 in the Supplementary Data).
Concluding Remarks
Although the COVID-19 lockdown in India and elsewhere in the world never had a goal of ambient air quality improvement as such, interestingly, more than 50% reduction in ambient PM (both PM10 and PM2.5) was recorded during lockdown 1 and 2 compared to lockdown 3 and 4. Lockdown 1 showed the maximum reduction in PM while the lockdown 4 depicted relatively the lowest reduction among the total lockdown period. During the lockdown, PM10 and PM2.5 levels were found well below the NAAQS (Singh et al., 2020). The main reason for these conspicuous positive changes in initial lockdown phases is a strict restriction on the anthropogenic activities giving rise to PM concentrations, primarily, vehicular and construction (Roy and Balling, 2021).
On the contrary, declination in such reduction may be attributed to the relaxations provided to the public in between and during the ending phases of lockdowns. Although we assessed that the meteorological conditions within the city boundaries have been largely flat during the study period, their contribution to such improved air quality cannot be denied (Singh et al., 2020). Nevertheless, such reductions in PM levels were short-lived because the levels went up again in the years 2021 and 2022 (except similar lockdowns) as the situation returned to normalcy postlockdown. (Vasudevan et al., 2021). In other words, COVID-19 had a significant effect on the air quality during full lockdown implemented for few months and afterward, however, there was unprecedented growth of poor air quality, which has a seasonal effect compared to previous years (Tiwari et al., 2021).
In the purview of air quality, the effectiveness and cost are always top factors for policymakers to decide upon preferred measures for abating air pollution. This study found that lockdown shows a substantial positive change in the air quality of NCT of Delhi. Interestingly, the resident of the Delhi city witnessed a rare blue sky after decades during the lockdown period. It is, therefore, for the immediate benefit toward urban quality that Government imposes lockdown in case of severe ambient air pollution in a densely populated megacity like Delhi; it still remains a temporary or quick-fix solution, to be looked as a last line of defense.
Footnotes
Acknowledgments
The authors thank the CPCB, DPCC, Amity University Haryana (AUH), and DTU for the extended support during research activity and secondary data sources for completed research objectives of this article.
Authors' Contributions
Conceptualization and methodology development: A.K.; formal analysis and investigation: A.K., K.S., and A.P.; writing—original draft preparation: A.K. and A.P.; writing—review and editing: A.P.; supervision: critical inputs: R.K.M. and A.P.; approval of article: A.K., K.S., A.P., R.K.M., and P.C.S.D.
Author Disclosure Statement
The authors declare that they have no conflict of interest or competing interest to declare.
Funding Information
The present research did not receive any funding or funding is not applicable.

References
Supplementary Material
Please find the following supplemental material available below.
For Open Access articles published under a Creative Commons License, all supplemental material carries the same license as the article it is associated with.
For non-Open Access articles published, all supplemental material carries a non-exclusive license, and permission requests for re-use of supplemental material or any part of supplemental material shall be sent directly to the copyright owner as specified in the copyright notice associated with the article.
