
Abstract
Dissolved organic matter (DOM) is the largest biologically available carbon pool in aquatic ecosystems and can mediate biogeochemical cycle processes. Its chemical nature and sources in marine environments and lakes have been extensively studied. However, DOM properties from river–reservoir systems in high altitude and severe cold climate regions remain unclear. In this study, the DOM components and sources in the upper “river–reservoir” system of the Yellow River were investigated using parallel factor analysis of fluorescence excitation–emission matrices. The factors influencing DOM florescence characteristics, especially the influence of cascade damming and frozen soil and freeze–thaw cycles, were explored. Our results demonstrated that the DOM fluorescence characteristics and sources of the river–reservoir system in the upper Yellow River had obvious temporal and spatial heterogeneity. Two humus-like substances (C1, C2) and one tryptophan-like substance (C3) were identified in the dry period. The fluorescence intensity of the cascade reservoir section (CR) was higher compared with the source region section (SR). External input and internal generation were the main sources of DOM, and the cascade reservoirs showed strong internal source characteristics. Two humus-like components (C1 and C2) were identified in the flood period, and the fluorescence intensity of the SR was higher compared with the CR. External input was the main source of DOM and the SR showed strong exogenous characteristics. The cascade reservoirs and seasonal freezing and thawing of frozen soil affected the fluorescence characteristics and sources of DOM. This study advances our knowledge of DOM florescence characteristics, sources, and influencing factors in river–reservoir systems in high altitude and severe cold climate regions.
Introduction
Dissolved organic matter (DOM) is a mixture of a variety of active organic substances, such as polysaccharides, proteins, and humus, and is recognized as one of the most biochemically active organic matter on Earth (Aiken et al., 2011a; Zhang et al., 2021a). Furthermore, it is also the largest biologically available carbon pool in aquatic ecosystems. It widely exists in oceans, rivers, lakes, and other habitats and is closely related to the biogeochemical cycle and energy flow of aquatic systems (Chen et al., 2018).
Rivers play a key role as the main links between terrestrial and marine ecosystems (Regnier et al., 2013; Wehrli, 2013; Schefuss et al., 2016). In rivers, DOM can provide energy and carbon sources for microbial reproduction activities, and can also change the migration, transformation, stability, and bioavailability of water pollutants through reactions, and at the same time have an impact on the activities of bacteria, animals, and plants in the water body. Therefore, exploring the chemical nature and sources of river DOM and interpreting the biogeochemical cycle processes it mediates has increasingly become a focus of the academic community (Derrien et al., 2019).
There has been much research on the environmental behavior of DOM in rivers and other water bodies. For example, in high altitude and Arctic oligotrophic waters or in humus-rich rivers and lakes, light-absorbing DOM largely determines the optical properties of the water bodies and the waters' lower ultraviolet (UV) and blue light attenuation (Huovinen et al., 2003; Zhang et al., 2011a). DOM also protects aquatic organisms by reducing the amount and depth of penetration of harmful UV-B (280–320 nm) radiation (Williamson et al., 2014).
At the same time, the transformation of DOM is accompanied by the biogeochemical cycle of carbon, nitrogen, phosphorus, and other biogeochemical substances, thus becoming an important link in the nutrient supply for the growth of microorganisms and phytoplankton plants in river ecosystems (Mladenov et al., 2011; Wear et al., 2015). Moreover, DOM is a key component of the river carbon pool, and its source, composition, degradation, and mineralization process are involved in the river carbon cycle and carbon budget (Battin et al., 2009; Zhou et al., 2018) and may cause greenhouse gas emissions and affect global climate change (Lapierre et al., 2013; Emilson et al., 2018).
DOM occurrence significantly affects the river carbon cycle, material transport, and microbial utilization of substrates and has important implications for ecosystem functions in river habitats (Cook et al., 2009; Huguet et al., 2009; Aiken et al., 2011b; Minor et al., 2014).
In view of the complex composition of DOM, there are currently a variety of technical means to analyze and trace the source. The commonly used methods can be divided into two categories: one is to analyze the overall properties of DOM, such as dissolved organic carbon (DOC), stable carbon isotopes (δ13C), and so on; the other type is analysis at the microscopic level, including ultraviolet-visible absorption spectroscopy (UV-vis), fluorescence excitation emission matrices (EEMs), and other spectral means, as well as nuclear magnetic resonance, time-of-flight mass spectrometry, electrostatic field Orbitrap mass spectrometry, and Fourier transform ion cyclotron resonance mass spectrometry. (Huang et al., 2015; Waggoner and Hatcher, 2017). Fluorescence spectroscopy has been extensively applied to elucidate the components and sources of DOM in aquatic systems. With the parallel factor method widely used in the fluorescence spectrum analyzed, the analysis of large-scale DOM in time and space becomes more accurate. (Mcknight et al., 2001; Weishaar et al., 2003; Helms et al., 2009).
The upper reaches of the Yellow River (YeUR) are located in the northeastern Qinghai–Tibet Plateau, is one of the 13 hydropower bases planned and constructed in China, with the highest degree of development and the most perfect pattern of cascade reservoirs. The YeUR flowing through the plateau's permafrost area and the canyon cascade reservoirs' development zone, of which the source region section (SR) of the river [Eling Lake (ELH)-Tangnaihai (TNH)] and the cascade reservoir section (CR) [Longyangxia reservoir (LYX)-Liujiaxia (LJXX)] form a typical river–reservoir system. Due to the typical geomorphological and environmental characteristics of the YeUR and the influence of frequent anthropogenic activities, the study of the components and sources of DOM in this area is conducive to interpreting the migration and transformation of carbon in the river–reservoir system under special environments and human disturbance. However, previous studies have paid little attention to the DOM characteristics of the river–reservoir system (Doretto et al., 2020).
In this article, the YeUR (ELH-LJXX) were selected as the research area to study DOM in the water body using parallel factor analysis of fluorescence excitation–emission matrices (EEMs-PARAFAC) to explore the DOM fluorescence components in the river–reservoir system in the YeUR and to analyze the possible sources of DOM and the driving and influencing factors of the DOM spatial mode. This study provides a reference for the biogeochemical cycle of carbon in the YeUR and a theoretical basis for the protection of the water environment in this river–reservoir system.
Materials and Methods
Study area overview and sample collection
The river–reservoir system of the YeUR (ELH-LJXX) is located at 95°52′-99°29′ E, 33°42′-35°20′ N. It flows through Qinghai Province and Gansu Province, China. It is located in the northeastern margin of the Qinghai–Tibet Plateau (the transition zone between the Qinghai–Tibet Plateau and the Loess Plateau) and is composed of plateaus, wetlands, and mountain canyons. There are distinct dry and flood periods. The study area is mainly divided into the SR from ELH to TNH and the CR from LYX to LJXX. The average elevation of the SR is more than 3500 m, the annual temperature range is from −5.6°C to 7.8°C, and the annual average rainfall is between 262.2 and 772.8 mm, showing a typical continental alpine climate. The CR is the most suitable river section of the Yellow River cascade reservoir development pattern, with a total of 14 cascade reservoirs planned. Twelve reservoirs, including LYX, Lijiaxia Reservoir (LJX), Gongboxia Reservoir (GBX) and LJXX, have been built.
The elevation drop of the main stream that reaches in the study area is 2691 m, and the river is 1842 km long. Runoff is mainly recharged by precipitation and, to a lesser degree, by snowmelt. Based on the distinct dry and flood periods in the study area, the research team selected sampling sites based on the relative positions of their hydrological stations and cascade reservoirs. Sampling was performed during the dry period in January 2021 and the flood period in August 2021. Among them, 7 sampling points were set up in the SR, including ELH, Huangheyan (HHY), Jimai (JM), Mentang (MT), Maqu (MQ), Jungong, and TNH. The LYX, LJX, GBX, and LJXX reservoirs were selected in the CR. According to the principles of the reservoir area (RR), the front of the dam (BQ), and the lower reaches of the dam (BX), 15 sampling points were set up in the CR. See Fig. 1 and Supplementary Table S1 for details.

Locations of sampling site in the SR and CR of the upper Yellow river. BQ, front of the dam; BX, lower reaches of the dam; CR, cascade reservoir section; ELH, Eling Lake; GBX, Gongboxia Reservoir; HHY, Huangheyan; JG, Jungong; JM, Jimai; LJX, Lijiaxia Reservoir; LJXX, Liujiaxia; LYX, Longyangxia reservoir; MQ, Maqu; MT, Mentang; SR, source region section; TNH, Tangnaihai.
A Niskin deep-water sampler (General Oceanics, USA) was used to collect the water samples. Samples were taken of the surface water (0.5 m below the water surface). The sampling point in front of the dam was located 0.4–0.5 km away from the dam. An automatic multiparameter monitor (YSI EXO2 United States Gimcheon Instruments Inc.) was used to monitor the temperature (T), dissolved oxygen, and pH on site in the reservoir. All the collected water samples were filtered through a 0.45 μm cellulose acetate membrane and stored in the dark at 4°C for testing. An automatic continuous flow analysis (SKALAR San++, the Netherlands) was used to determine the contents of NO3− and NH4+ in the water samples. TN was determined using a UV spectrophotometric method with alkaline potassium persulfate digestion. The total phosphorus (TP) concentration was determined using a spectrophotometric method with persulfate potassium digestion. Water samples for DOC were filtered through 0.45 μm cellulose filters and then measured with a total organic carbon analyzer (Vario TOC, Elementar, Germany). The detection limit and precision are shown in Supplementary Table S2.
Three-dimensional fluorescence measurements and PARAFAC modeling
The fluorescence EEM of DOM was determined by a fluorescence spectrophotometer (FluoroMax-4, Horiba Jobin Yvon, USA). Using a 1 cm quartz colorimetric dish, the basic parameters were as follows: the excitation light source was a 150 W xenon arc lamp, the response time was 3 s, the photomultiplier tube voltage was 700 V, the scanning speed was 2400 nm/min, and the excitation and emission slit width were set to 5 nm. The parameter settings in the flood period and dry period were different. The excitation (Ex) wavelength in the flood period was 230–450 nm and the step length was 4 nm; the emission (Em) wavelength was 260–550 nm and the step length was 5 nm. The Ex wavelength in the dry period was 190–502 nm and the step length was 5 nm; the Em wavelength was 246–550 nm and the step length was 5 nm.
In addition, a 1 nm four-pass colorimetric dish was used to assess the water sample. The filtered water sample was scanned with ultrapure water as a blank. Then, the parameters of the ultrapure water used as a blank control were subtracted from the measured data to reduce the influence of the instrument and Raman scattering on the spectrum. Innerfilter effects were corrected for the EEM using the measured DOM absorbance.
In this study, PARAFAC of EEM data was performed using MATLAB 2018a software and DOM Fluor toolbox 1.7 (Stedmon and Bro, 2008). Due to the signal-to-noise ratio, EEM data at the Ex wavelengths (200–230 nm) and Em wavelengths (250–299 nm; 551–600 nm) were removed to eliminate unreliable measurements. The number of components was determined through semianalysis and residual and load analysis (Stedmon et al., 2003). According to the PARAFAC results, in the dry period, 2 SR and 2 CR samples were removed because of possible problems. In the flood period, 2 SR and 3 CR samples were removed because of possible problems. Finally, 18 EEM datasets in the dry period and 17 EEM datasets in the flood period were analyzed using PARAFAC modeling separately and were used in this study. The fluorescence characteristics of DOM were quantitatively described and distinguished by various fluorescence parameters. The fluorescence index (FI) was defined as the ratio of Em intensity at 470 nm to 520 nm, which was obtained at Ex 370 nm (Mcknight et al., 2001).
The biological index (BIX) was defined as the ratio of Em intensity at 380 nm to 430 nm, which was obtained at Ex 310 nm. The humus index (HIX) was defined as the ratio of Em intensity at two spectral regions (434–480 nm and 300–346 nm), which was obtained at Ex 255 nm (Li et al., 2020).
Statistical analyses
In this article, the mean, standard deviation, principal component analysis (PCA), Pearson's correlation, and nonparametric tests (Kruskal–Wallis) were conducted with IBM SPSS 20.0. Results with significance levels of p < 0.05 and p < 0.01 were defined as “significant” and “highly significant” differences, respectively. All graphs were plotted with ArcGIS 10.1 and Origin 2020. PARAFAC of DOM fluorescence components were constructed with MATLAB 2018a software.
Results and Analysis
DOM EEM-PARAFAC components
A total of three fluorescent substances were identified in the YeUR in the dry and flood periods in 2021, of which three components were identified in the dry period and two components were identified in the flood period.
As shown in Fig. 2a, d, f, and Supplementary Table S3, in the dry period, the DOM component C1 [Ex/Em: 265 (365) nm/492 nm] had two Ex peaks and one Em peak, reflecting the fluorescence characteristics of ultraviolet radiation A (UVA) humus-like substances that are mainly derived from land with high molecular weights and wide distributions. The peaks of 265/492 nm and 365/492 nm were located in the vicinity of the traditional A peak and the traditional C peak, but the emission wavelength was slightly longer. High molecular weights and strong aromatic groups were considered to be present in the structure of the C1 component (Mcknight et al., 2001; Stedmon et al., 2003). The DOM component C2 [Ex/Em: 245 (320) nm/430 nm] had two Ex peaks and one Em peak, which have shorter excitation and emission wavelengths than the C1 component, reflecting the fluorescence characteristics of UVA humus-like substances that are mainly derived from land soil. The 245/430 nm peak was located in the traditional A peak area, and the 320/430 nm peak was located in the traditional C peak area.
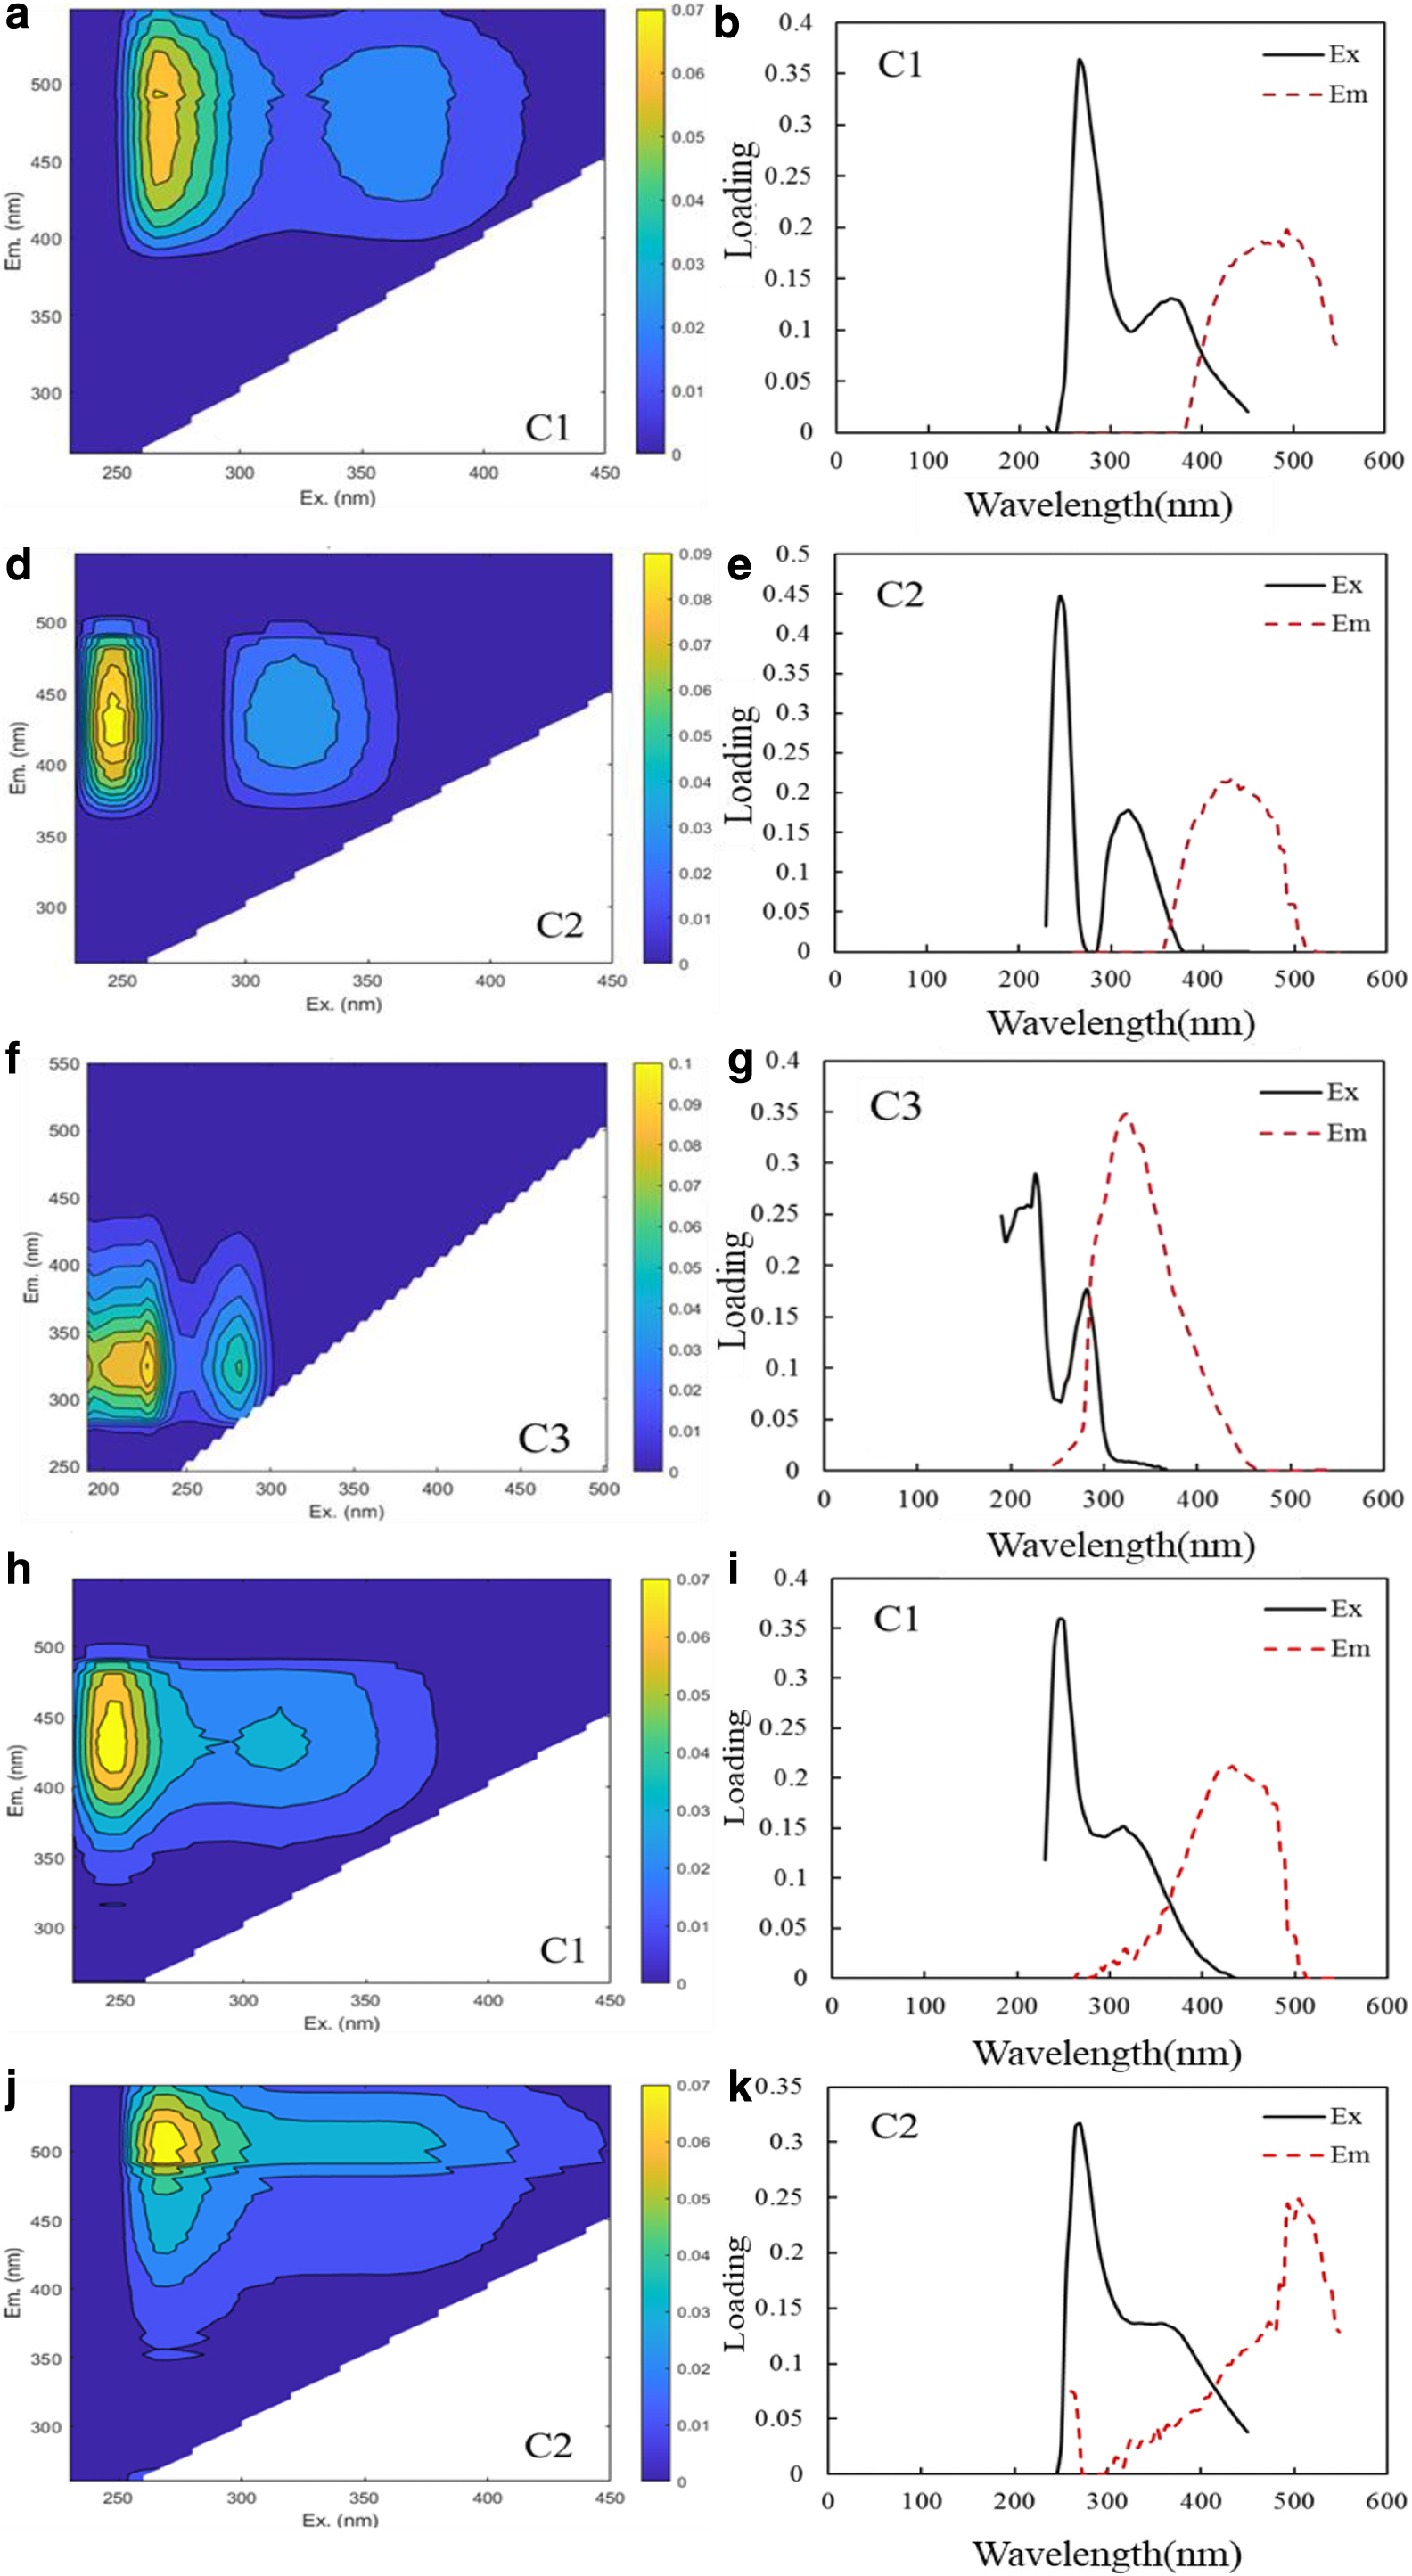
The fluorescence components were found from the results of PARAFAC modeling (Three fluorescence components in dry period, two fluorescence components in flood period). Contour plots
The DOM component C3 (Ex/Em: 190, 226, 282/326 nm) had three Ex peaks and one emission Em peak, reflecting tryptophan-like fluorescence characteristics, mainly produced by endogenous and microbial decomposition, indicating a relatively complete protein. The 190/326 nm, 226/326 nm, and 282/326 nm peaks were located near the traditional T peak.
In the flood period (July), as shown in Fig. 2h, j, and Supplementary Table S4, the DOM component C1 (Ex/Em: 270/504 nm) had one Ex peak and one Em peak, reflecting the fluorescence characteristics of UVA humus-like substances that are mainly derived from land, with a high molecular weight and a wide distribution. The 270/504 nm peak was located near the traditional A peak. The DOM component C2 [Ex/Em: 245 (315) nm/432 nm) had two Ex peaks and one Em peak, reflecting the fluorescence characteristics of UVA humus-like substances that are mainly derived from land. The 245/432 nm peak was located in the traditional A peak area, and the 315/430 nm peak was located in the traditional C peak area.
DOM fluorescence intensity
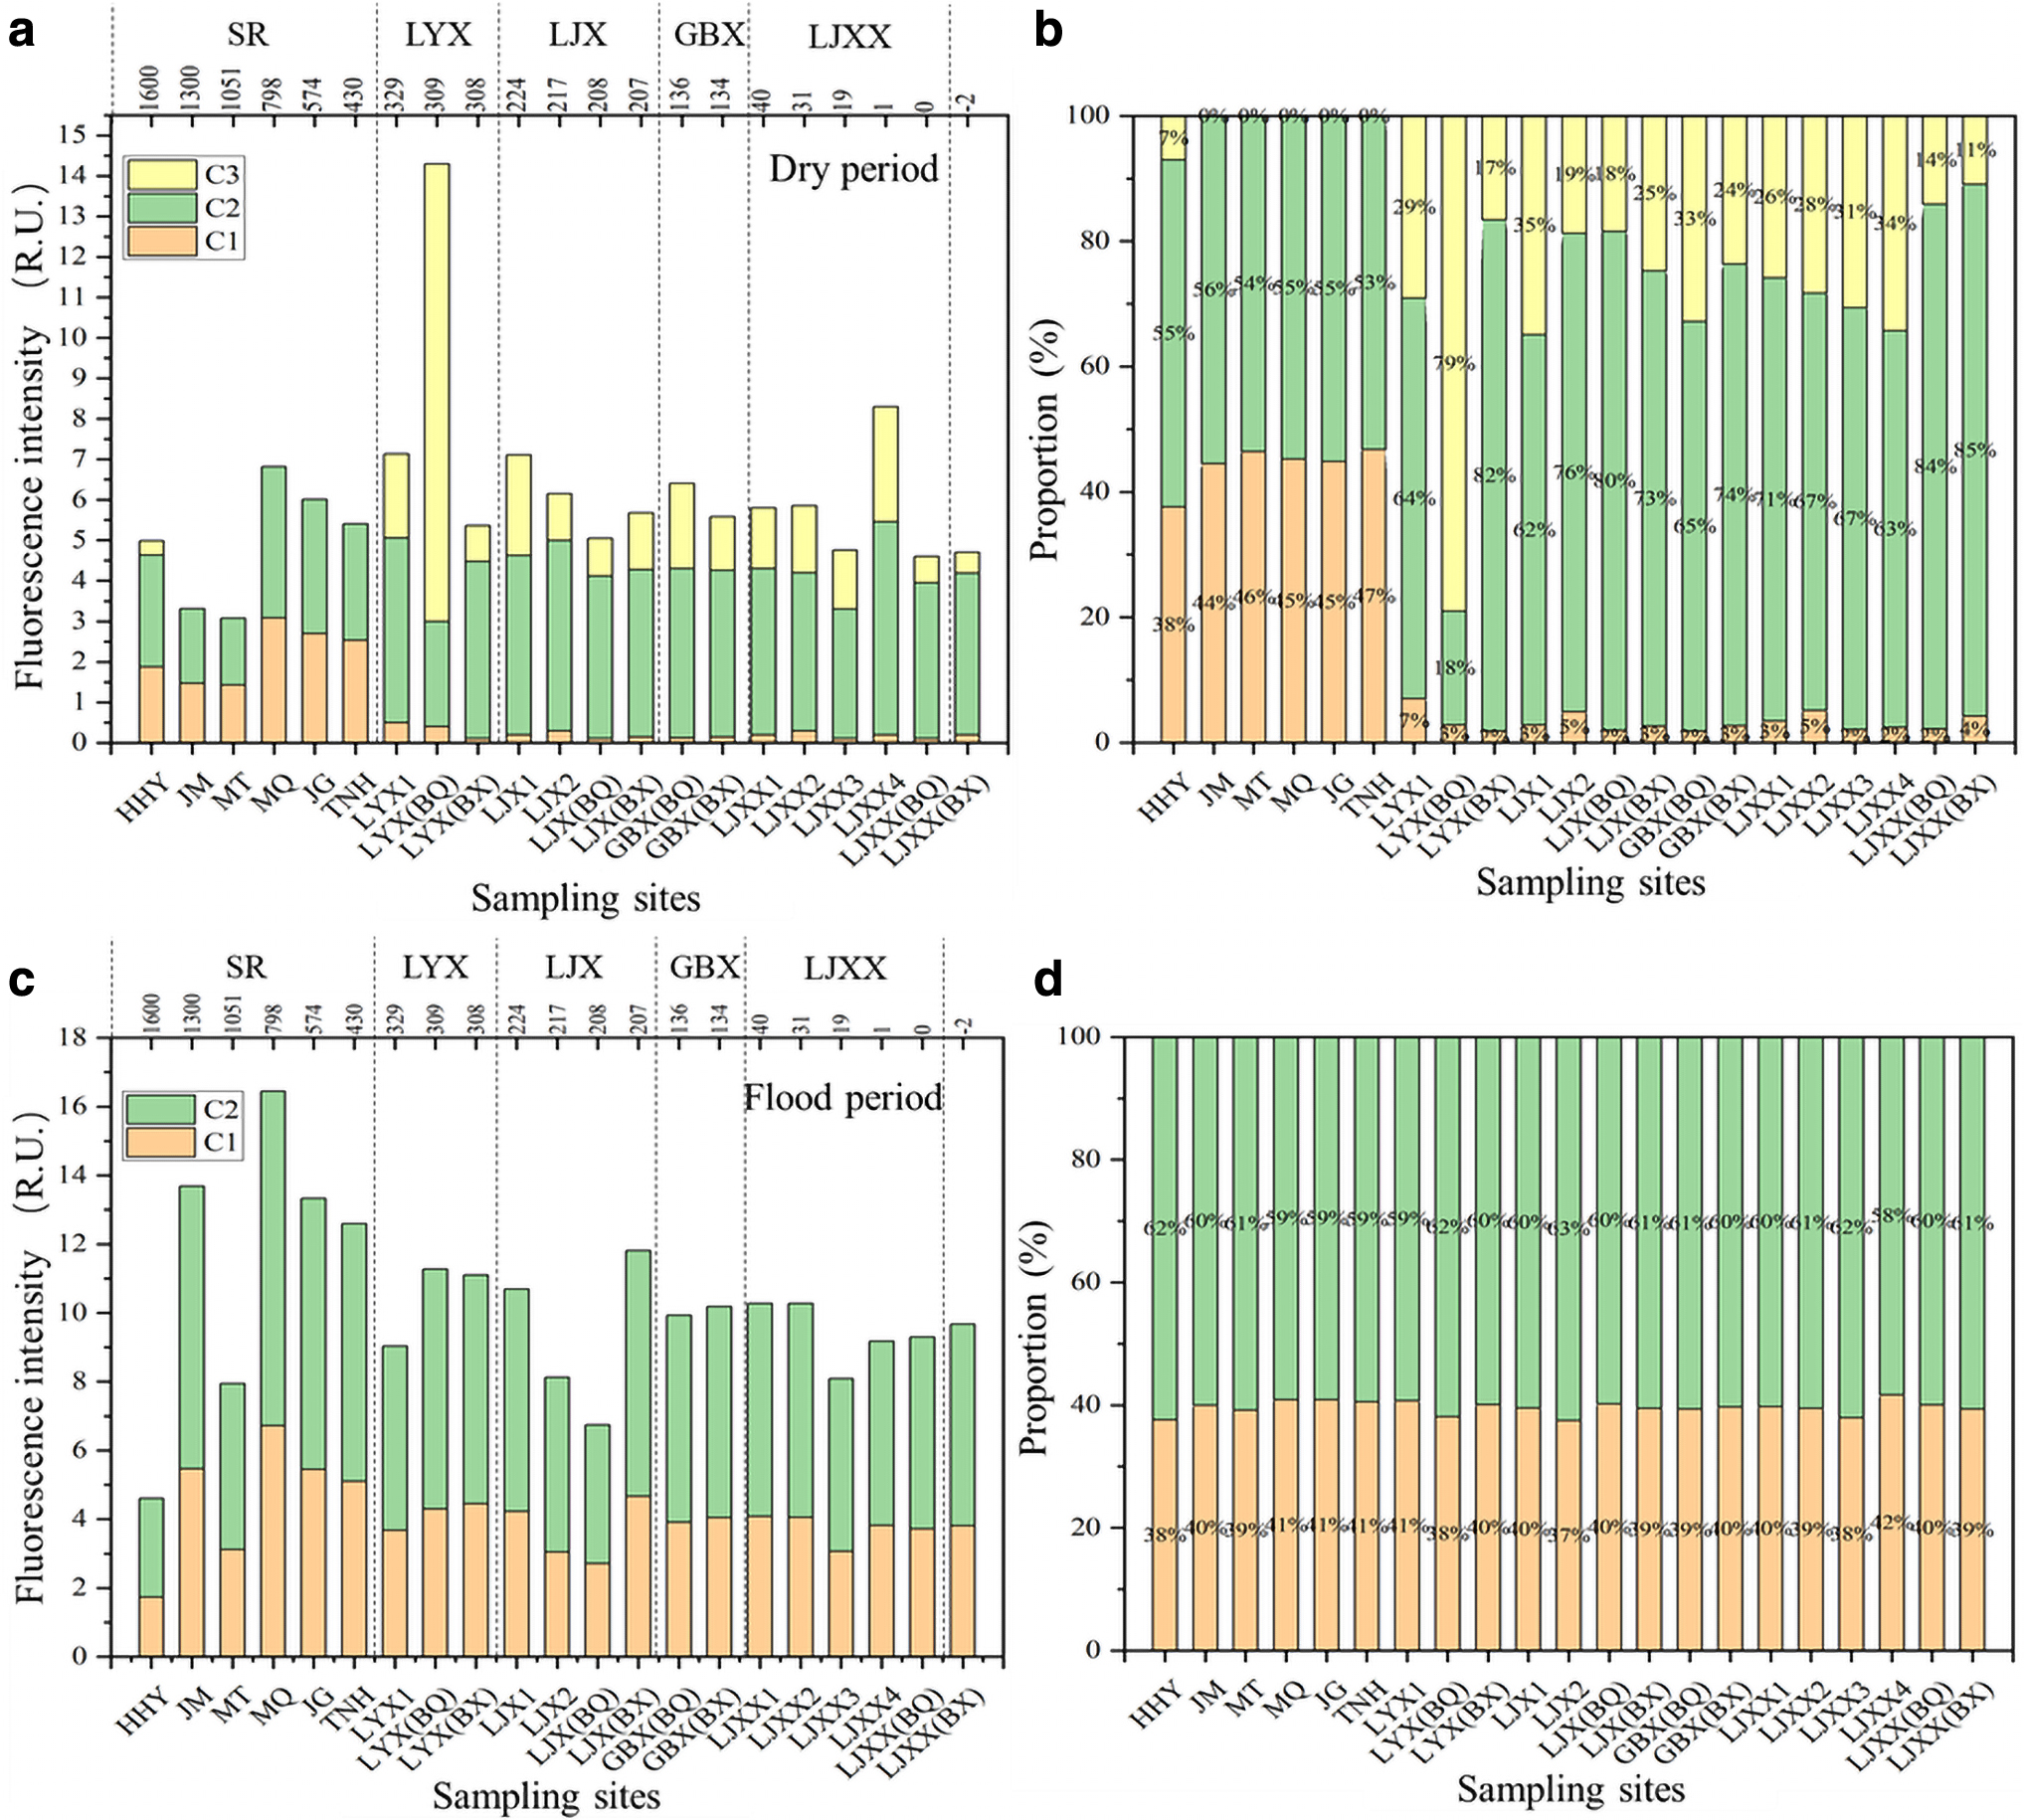
As shown in Fig. 3a and b, during the dry period, the overall fluorescence intensity of DOM in the SR of the YeUR showed two sections of decline. The first section was from HHY to MT and the second section was from MQ to TNH. The highest value appeared in MQ, and the average fluorescence intensity was 4.88 ± 1.49 relative fluorescence unit (R.U). The average fluorescence intensity of DOM in CR was 6.45 ± 2.40 R.U., in which the total fluorescence intensity of LYX gradually increased from the reservoir area to the front of the dam, and the average fluorescence intensity was 10.26 R.U. LJX decreased from the RR to the BQ, and the average fluorescence intensity was 5.90 R.U. LJXX decreased from the RR to the BQ, and the average fluorescence intensity was 5.68 R.U. The four reservoirs in the CR all showed a higher average total fluorescence intensity of the RR compared with BX.
The fluorescence intensity distribution characteristics
Overall, the average fluorescence intensity of CR in the YeUR was higher compared with the SR. The proportion of each component showed that the fluorescence intensity of the C2 component (UVA humus-like substances), which was the main material component of DOM in the water body of the YeUR during the dry period, was the highest at each point. The C3 component (tryptophan-like substances) was only identified at HHY in the SR, but all were identified in the CR.
As shown in Fig. 3c and d, in the flood period (July), the overall fluorescence intensity of DOM in the SR first increased and then decreased, the highest value appeared in MQ, and the average fluorescence intensity was 11.43 ± 4.33 R.U. The average fluorescence intensity of DOM in the CR was 9.71 ± 1.35 R.U., and the total fluorescence intensity of LYX increased gradually from the RR to the BQ, with an average of 10.15 R.U. The LJX gradually decreased from the RR to the BQ, with an average of 8.52 R.U. LJXX first decreased and then increased from the RR to the BQ, with an average of 9.42 R.U. Contrary to the dry period, the four reservoirs in the cascade reservoirs all had a lower average total fluorescence intensity of the RR compared with the BX.
Overall, the average fluorescence intensity of the SR was higher compared with the CR. The proportion of each component showed that the fluorescence intensity of the C2 component (UVA humus-like substances), which was the main material component of DOM in YeUR during the flood period, accounted for the largest proportion at each point, and this component belonged to the same substance as the C2 component identified during the dry period.
DOM EEM-PARAFAC qualitative indices
The FI is usually used to study and characterize the source of humus in DOM. The BIX is usually used to characterize the relative contribution rate of the self-generation of organic matter and can be used to evaluate bioavailability. The HIX is usually used to characterize the humification degree of organic matter. The higher the value is, the higher the DOM humification degree (Ohno, 2002; Leenheer et al., 2003). The characteristics of DOM fluorescence parameters in different water periods are shown in Fig. 4.
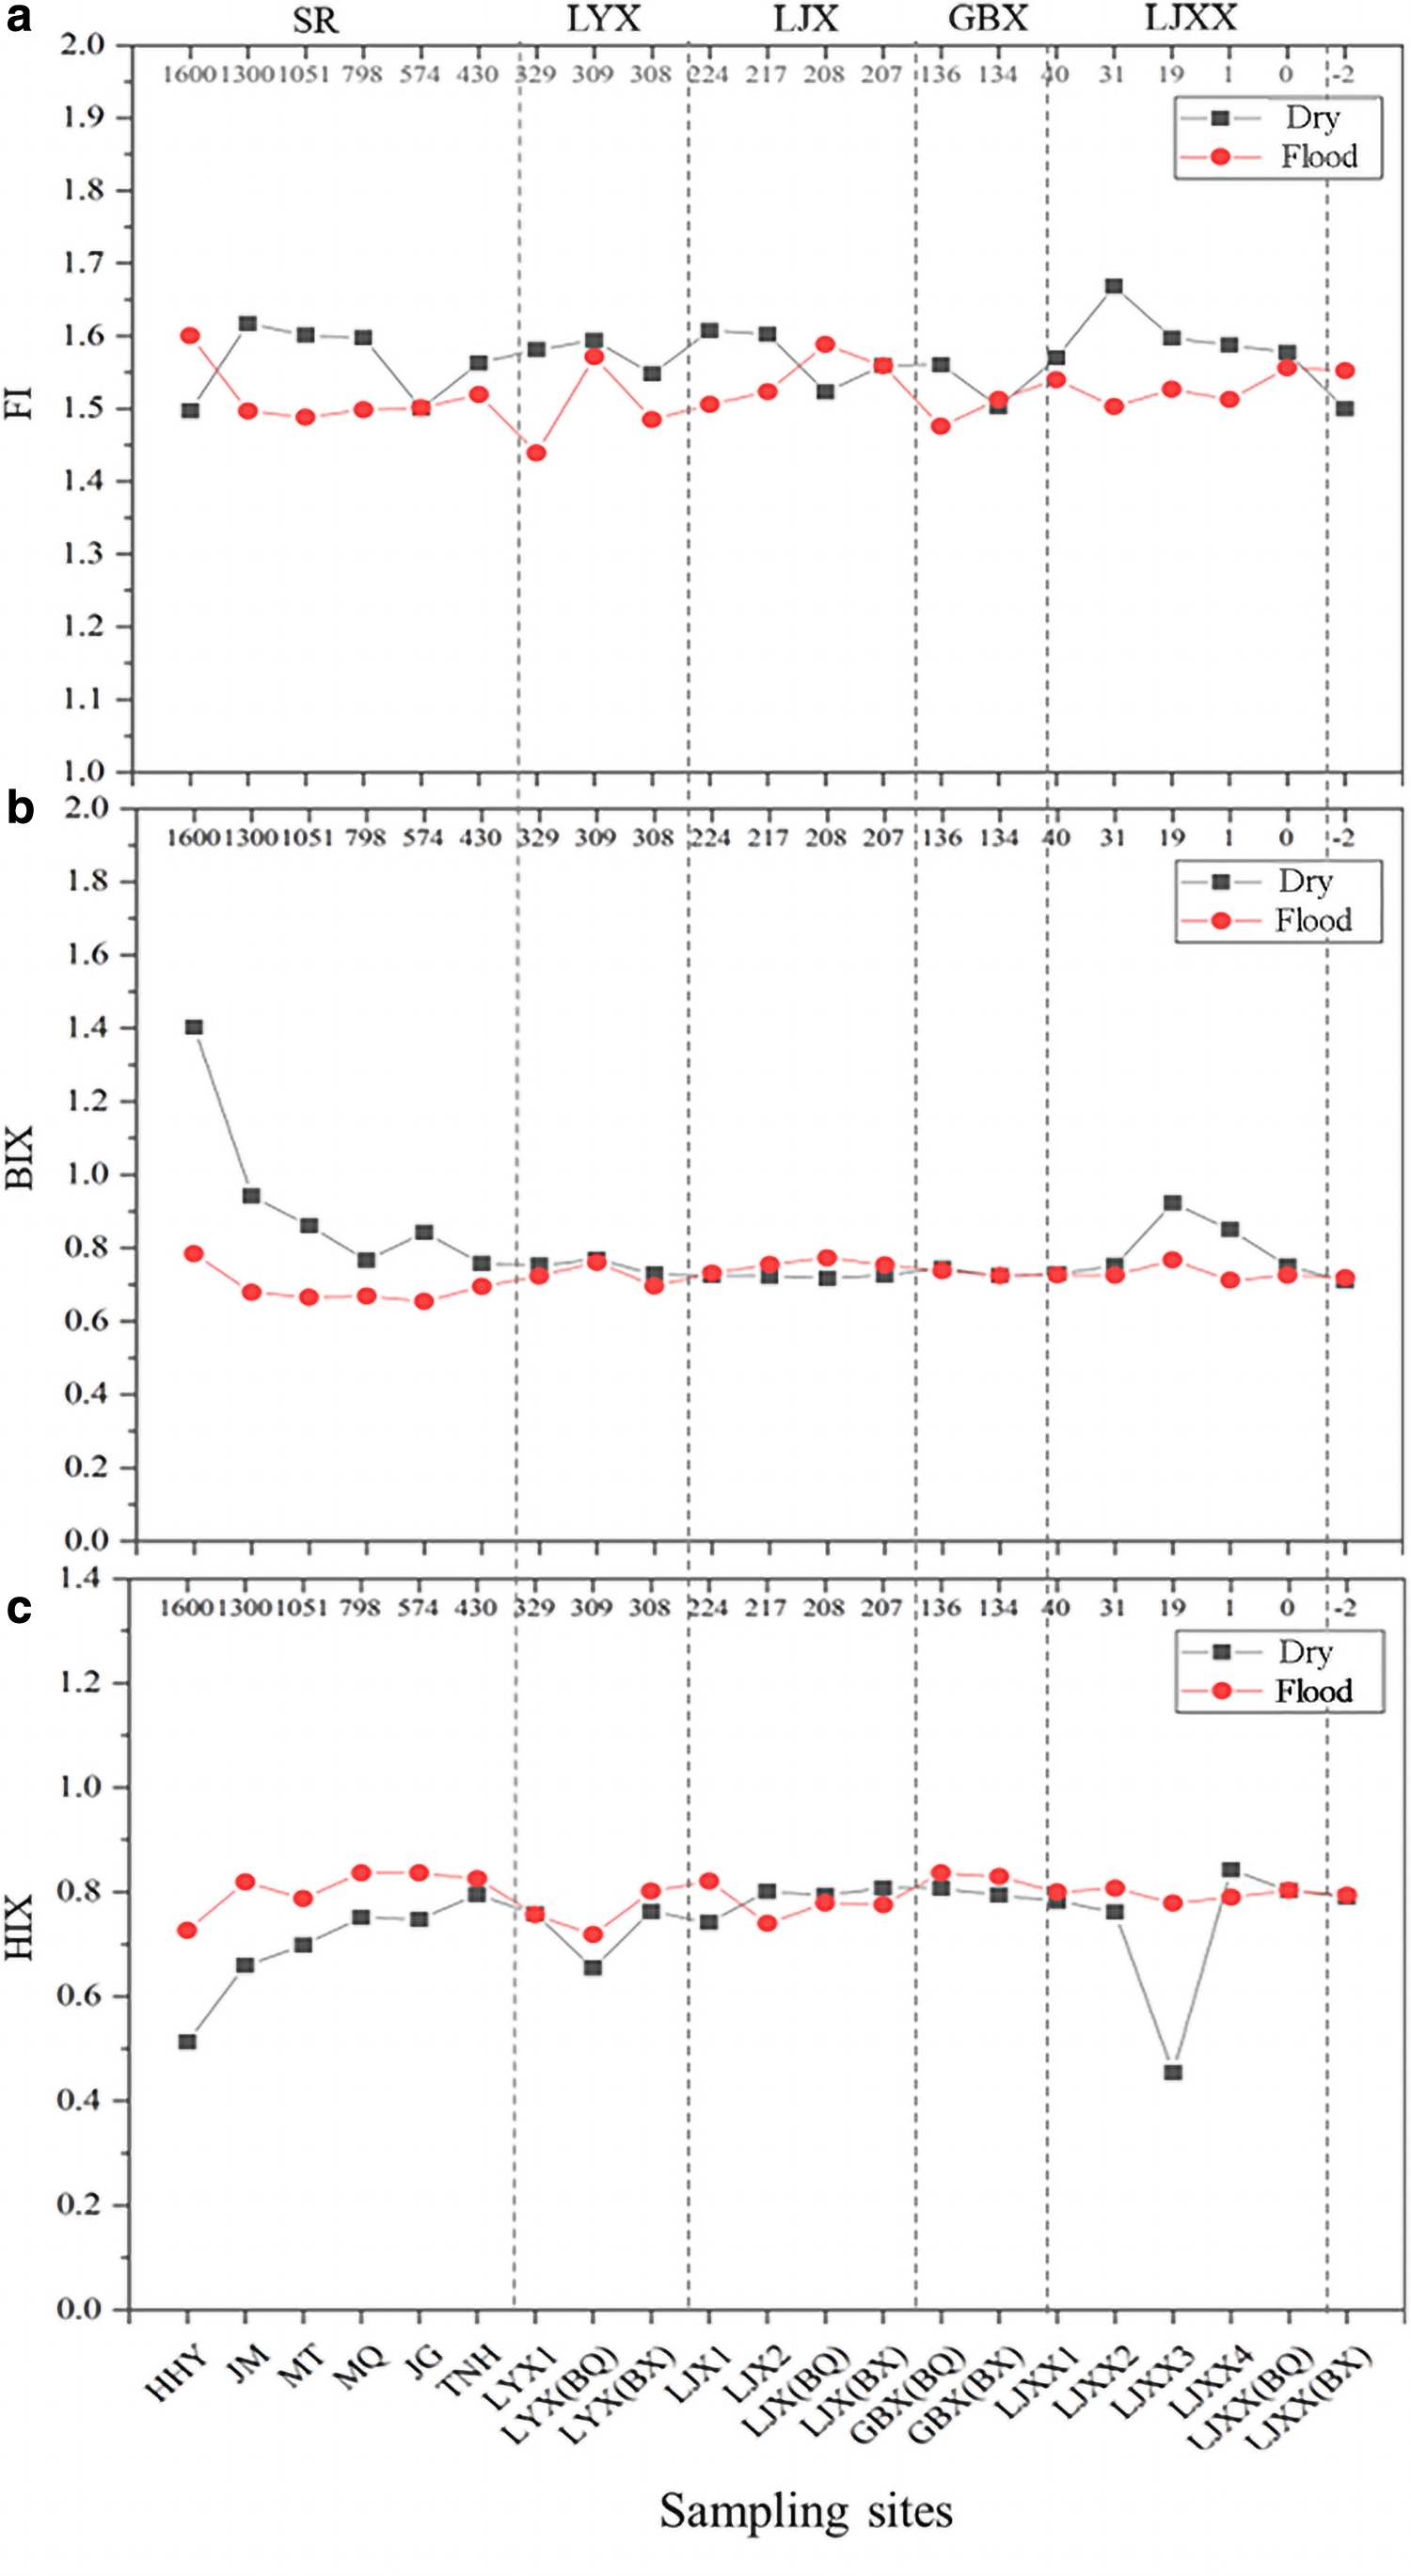
The spatial distribution fluorescence parameters in the upper Yellow River.
In the dry period, the FI ranged from 1.50 to 1.67, with an average of 1.57 ± 0.04 (Fig. 4a). Overall, there was no significant difference in FI values between SR and CR (p > 0.05). In the SR, the average FI value of JM was 1.62. In the CR, the average FI value of the LJXX reservoir area (LJXX2) was the highest at 1.67. The BIX ranged from 0.71 to 1.40, with an average of 0.80 ± 0.15 (Fig. 4b). Overall, the average BIX of SR (0.93 ± 0.24) was significantly higher compared with CR (0.75 ± 0.05) (p < 0.05). The average BIX value of HHY in the SR was the highest at 1.40. The average BIX value of the LJXX reservoir area (LJXX3) was highest in the CR at 0.92. The HIX ranged from 0.45 to 0.84, with an average of 0.74 ± 0.10 (Fig. 4c). Overall, the average HIX value of SR (0.69 ± 0.10) was compared with CR (0.76 ± 0.06). In the SR, TNH had the highest HIX value of 0.80. In the CR, the average HIX value of the LJXX reservoir area (LJXX4) was the highest at 0.84.
In the flood period (July), the FI ranged from 1.44 to 1.60, with an average of 1.52 ± 0.04 (Fig. 4a). Overall, the FI values of SR and CR were basically the same, and the difference was not significant (p > 0.05). The BIX ranged from 0.65 to 0.78, with an average of 0.72 ± 0.04 (Fig. 4b). Overall, the average BIX of SR (0.69 ± 0.05) was significantly lower compared with CR (0.74 ± 0.02) (p < 0.05). The average BIX value of HHY in the SR was the highest at 0.78. In the CR, the average BIX value of the LJX reservoir area (LJXBQ) was the highest at 0.77. The HIX ranged from 0.72 to 0.84, with an average of 0.79 ± 0.04 (Fig. 4c). Overall, the average HIX value of SR (0.81 ± 0.04) was higher compared with CR (0.79 ± 0.03). In the SR, MQ had the highest HIX value of 0.84. In the CR, the average HIX value of GBXBQ was the highest at 0.84.
Discussion
The driving factors of the spatiotemporal heterogeneity of DOM
In this study, the fluorescence components identified by DOM in the river–reservoir system in the YeUR were slightly different in the flood period and the dry period (Fig. 2).
In addition to two types of humus-like substances identified in both periods, DOM identified a protein-like component in the dry period. Although most components were identified in the dry period, the overall fluorescence intensity was still higher in the flood period than in the dry period. Rainwater is abundant in the flood period, with more rainfall than in the dry period, and rainfall runoff transports a large amount of terrestrial organic matter to water (Li et al., 2022). High temperatures in the flood period lead to the melting of the active layer of frozen soil around the SR, releasing a large amount of organic matter from the soil that flows into the river (Kicklighter et al., 2013). In the dry period, the temperature is very low, the rainfall is low, and the frozen soil active layer around the SR of the river remains frozen, which greatly reduces the DOM load transported from the land to the river, resulting in a relatively low fluorescence intensity of DOM fluorescence components in the river.
However, due to the decrease in external DOM input load, the available organic matter of microorganisms in the water changes from an external input dominance to an endogenous dominance. Therefore, protein-like (tryptophan-like) fluorescence components produced by microbial decomposition have been identified in the water (von Wachenfeldt et al., 2009; Williams et al., 2010; Zhou et al., 2019). This process also reduces the DOC concentration and total fluorescence intensity (Zhang et al., 2021b).
In the dry period, the fluorescence intensity of tryptophan-like substances (C3 component) showed a significantly higher fluorescence intensity of CR compared with SR (Fig. 3). Since cascade damming intercepts a large amount of water and changes the distribution pattern of nutrients in the river, the reservoir has characteristics similar to those of the lake from an ecosystem perspective and has an evolutionary trend toward lake swamping. In addition, in the dry period, the cascade reservoirs are mostly in the water storage period, and the flow pattern is relatively stable. Therefore, DOM in the cascade reservoirs recognizes the tryptophan-like fluorescent substances that are common in natural lakes, and the fluorescence intensity is high (Du et al., 2016).
In the flood period, the humus-like substance fluorescence intensity of the SR was higher compared with the CR (Fig. 3). The SR flows through the permafrost region, which is an important carbon pool. With seasonal ablation of the active layer, a large amount of organic carbon is released from permafrost and transported to rivers in the flood period, which makes the humus-like substance fluorescence intensity relatively high (Kicklighter et al., 2013).
Possible source analysis of DOM
Relevant studies have shown that the sources of DOM components in aquatic ecosystems are mainly external (i.e., terrestrial) and internal (i.e., microorganisms/algae) (Coble, 2007). External sources mainly come from a high number of animal and plant residues in the soil, which are degraded by bacteria and fungi, and most of them are dominated by humus peaks. Internal sources mainly come from plankton, aquatic bacteria, algae, and other biological activities in aquatic ecosystems, and these sources are mostly protein-like peaks (Zhang et al., 2011b).
FI, BIX, and HIX can also be used to analyze the structure and source of DOM. FI, as an indicator of DOM source and degradation, reflects the source of humus in DOM (Mcknight et al., 2001). Studies have shown that an FI >1.8 indicates that DOM originates from the extracellular release of bacteria and algae and has significant internal generation characteristics. An FI <1.4 reflects the characteristics of external sources such as terrestrial plants and soil organic matter (Mcknight et al., 2001). In this study, the average FI value was 1.57 ± 0.04 in the dry period and 1.52 ± 0.04 in the flood period. The FI values of the two water periods were closer to 1.4, and DOM showed strong external source characteristics. Studies have shown that the higher the HIX is, the higher the degree of corruption. In this study, the HIX value was 0.74 ± 0.10 in the dry period and 0.79 ± 0.04 in the flood period. This indicated that DOM in the two water periods showed a high degree of humification. BIX can reflect the proportion of DOM self-generation in water, and the BIX was between 0.6 and 0.8, indicating that the proportion of self-generation was small.
When the value exceeds 1.0, DOM has a high degradation degree and obvious autogenic component characteristics (Birdwell and Engel, 2010). Supplementary Figure S1 shows the distribution of fluorescence parameters in different water periods. As shown in Supplementary Fig. S1, in the dry period, the DOM source was a combination of terrestrial and autogenetic sources, mainly terrestrial sources, and had a high degree of humification. Compared with the SR, the proportion of newly self-generated components in the CR was lower, which can also explain why the fluorescence intensity of protein-like substances identified in the CR was relatively high. In the flood period, DOM sources were also a combination of terrestrial sources and self-generation, but the degree of terrestrial sources was stronger and had a high degree of corruption, and the proportion of self-generation components generated by new progress was also small.
The source of DOM can also be preliminarily analyzed by PCA (Fig. 5). In this study, the fluorescence components C1 and C2, DOC, HIX, water temperature, and pH in the dry period (Fig. 5a) had higher PC1 principal component extraction factors. The C1 and C2 components were humus-like substances with the characteristics of external sources, and HIX was used to characterize the degree of humification, so the PC1 principal component could represent the external source of DOM in the river–reservoir system of the YeUR. The fluorescence component C3 and BIX were higher in the PC2 principal component. The C3 component was a protein-like substance with internal self-generated characteristics, and BIX represented the contribution of the self-generated components. Therefore, the PC2 principal component could represent the source of DOM as an internal source. The contribution rate of PC1 was 52.6% and that of PC2 was 33.4%. Therefore, the source of DOM in the dry period was considered to be mainly external (terrestrial humus), but there was a certain degree of internal sources (self-generated protein).

The principal component analysis between DOM absorption spectrum and fluorescence intensity and conventional water quality parameters in different water periods of the upper Yellow River.
In the flood period (Fig. 5b), the extraction factors of fluorescence components C1 and C2, FI, HIX, and water temperature in the PC1 principal component were relatively high. The extraction factors of DOC, pH, TN, TP, and alkalinity in PC2 were higher, so PC1 and PC2 could represent the source of DOM. The total contribution rates of PC1 and PC2 were 83.6%, so the source of DOM in the flood period was considered to be mainly external terrestrial humus inputs.
The influencing factors of DOM fluorescence characteristics
Environmental factors that play a key role in the carbon cycle of river ecosystems have significant effects on DOM occurrence and fluorescence characteristics (Zhang et al., 2018; Zhou et al., 2019). Related studies have shown that DOM may be an important nutrient source for phytoplankton in water (Kowalczuk et al., 2009). In this study, in the two water periods, different forms of N (TN, NO3-N, NH3-N) and TP were significantly correlated with different fluorescence components of DOM (p < 0.05; Fig. 6). Therefore, DOM was also one of the nutrient sources of phytoplankton. In the dry period, NO3-N was significantly correlated with the fluorescence component C1 and HIX (p < 0.05), indicating that the degradation of organic matter dominated by microorganisms was dominant in the nitrification and denitrification process.

Pearson correlation analysis of DOM absorption spectrum characteristics and corresponding fluorescence intensity with conventional water quality parameters in different water periods of the upper Yellow River.
Water temperature was also the main factor affecting the occurrence of DOM. In this study, water temperature in the dry season was significantly correlated with the fluorescence components C1 and C2 and the BIX (p < 0.05), and water temperature in the flood period was significantly correlated with the fluorescence components C1 and C2 (p < 0.05). Related studies showed that water temperature further affected the change in DOM concentration by affecting microbial activities and DOM degradation (Zhou et al., 2019). Therefore, DOM is also significantly affected by water temperature. In view of the seasonal water temperature stratification characteristics of the reservoir, the DOM concentration may be more affected by water temperature.
Conclusion
In this study, DOM in the river–reservoir system of the YeUR was studied, the fluorescence characteristics of DOM were analyzed by fluorescence spectroscopy, and the driving factors of the temporal and spatial heterogeneity of fluorescence characteristics were explored. The source of DOM was preliminarily analyzed by fluorescence parameters and PCA, and the influencing factors of DOM occurrence were explained by statistical correlation analysis. The specific conclusions were as follows:
In the dry period, three fluorescence components (C1, C2, and C3) were identified and classified into two categories: humus-like substances and tryptophan-like substances. The fluorescence intensity of the C3 component in CR was higher than that in SR due to the influence of the cascade reservoir in the water storage period. In the flood period, two fluorescence components (C1 and C2) were identified and classified into one class: humus-like substances. Affected by the melting of the active permafrost layer, the total fluorescence intensity of SR was higher compared with CR. Overall, the DOM fluorescence intensity in the flood period was higher than that in the dry period. Changes in temperature, rainfall conditions, active permafrost layer ablation, and high-intensity cascade reservoir development caused by seasonal changes in climate and river hydrology may be the main driving factors. Based on the fluorescence parameters and PCA of DOM, the source of DOM in the dry period was a mixed source of an external input of humus and an internal self-generated protein. The degree of internal sources of the CR was stronger compared with the SR. In the flood period, the main source was an external humus input, and the SR showed a stronger external source degree than the CR. DOM in the upper reaches of the river–reservoir system of the Yellow River was affected by environmental factors, such as TN, NH3-N, NO3-N, TP, and water temperature. This further reflects that cascade reservoir development changes the hydrological and nutritional status of rivers and that the changes in water temperature and temperature promote the freeze–thaw cycle of the active permafrost layer to affect the DOM occurrence and fluorescence characteristics.
Footnotes
Authors' Contributions
J.W. designed and performed the research. W.W. and X.Z. were the main technical guides. J.W. and W.W. analyzed the data and wrote the article. J.L. and C.L. provided valuable suggestions on the comparative methods. All authors reviewed and approved the article.
Data Availability Statement
All data, models, and code generated or used during the study appear in the submitted article.
Author Disclosure Statement
No competing financial interests exist.
Funding Information
The authors are grateful for the financial support provided by the National Natural Science Foundation of China (Grant Nos. 51979222 and 91747206).
References
Supplementary Material
Please find the following supplemental material available below.
For Open Access articles published under a Creative Commons License, all supplemental material carries the same license as the article it is associated with.
For non-Open Access articles published, all supplemental material carries a non-exclusive license, and permission requests for re-use of supplemental material or any part of supplemental material shall be sent directly to the copyright owner as specified in the copyright notice associated with the article.