
Abstract
This study investigated two different hybrid processes for the treatment of municipal secondary-treated biological effluents to meet the reuse of recycled water requirements for organic matter and color. The two hybrid treatment approaches were an oxidation-based treatment process (coagulation–sedimentation–deep-bed filtration [CSDF]–ozone oxidation) and an adsorption-based treatment process (CSDF-granular activated carbon [GAC] adsorption). The efficiencies of ozonation and GAC adsorption in removing chemical organic demand (COD), dissolved organic carbon (DOC), and color intensity were evaluated. The effect of CSDF as the pretreatment was also studied. Ozonation showed a much higher color removal efficiency (88%, 4.7 mg/L ozone dose) than GAC adsorption (23%). Organic matter with an apparent molecular weight of 2–3 kDa, being humus-like, might be the colored fraction in the secondary and CSDF effluents. Ozonation had a stronger ability to remove these substances than GAC adsorption, resulting in a visibly higher color removal efficiency. In addition, higher COD and DOC removal were achieved by ozonation when the average ozone dose was increased to 9.1 mg/L. Although both hybrid processes were reliable for reducing organic matter and color, the results show that ozonation is more suitable for simultaneously removing refractory organic matter and color.
Introduction
There is growing interest in wastewater reuse because water scarcity, droughts, and population growth have increased the demand for freshwater resources (Hering et al, 2013). The reuse of treated urban wastewater is considered the most suitable and reliable approach for coping with water shortage (Marteleira et al, 2014), improving scenic environments (Jin et al, 2013), and developing agriculture (Massoud et al, 2019). Although water reuse has numerous benefits, several concerns still exist, including safety risks caused by the remaining high concentrations of organics (Jin et al, 2013; Turhan et al, 2012) and esthetic property impairment of water due to the yellowish color (Corno et al, 2019; Islam et al, 2021; Marshall and Johnsen, 2017; Zou and Zhu, 2008) of effluents.
However, conventional secondary treatments are not considered sufficient to ensure safe reuse (Chen et al, 2017a; Jin et al, 2016). Therefore, advanced tertiary treatment processes are adopted to simultaneously increase organic matter and color removal after conventional biological secondary treatment processes.
Extensive technologies applied to remove recalcitrant organic matter or color are oxidized by ozone (Galapate et al, 2001; Gümüs and Akbal, 2017; Mo et al, 2019) and adsorbed onto activated carbon (Kårelid et al, 2017; Moreno-Castilla, 2004; Östman et al, 2019). Ozone can react as a polar molecule, an electrophile, or a nucleophile that selectively undergoes oxidative reactions with unsaturated aromatic and aliphatic compounds (Vatankhah et al, 2019; von Sonntag, 2008). It has also been reported that ozone is frequently used for decolorizing certain categories of industrial wastewater because it attacks conjugated double bonds, which are often associated with color (Turhan et al, 2012). Although the hydroxyl radical formation during ozonation, which is an advanced oxidation process, has a higher oxidation power than ozone (von Sonntag and von Gunten, 2012), ozonation is still considered to have large-scale potential applications in terms of efficiency, cost, and energy requirements (Margot et al, 2013; Reungoat et al, 2012).
Activated carbon was found to remove organics through adsorption to its large specific surface area and is, thus, widely used in water treatment (Moreno-Castilla, 2004; Sun et al, 2021; Vaidya et al, 2019; Zarroug et al, 2022). This process is highly sensitive to the aromaticity and molecular weight (MW) of organics (Antony et al, 2012). In the wastewater treatment plants (WWTPs) where the pilot experiments are conducted, sludge is generally treated through anaerobic digestion; therefore, in this study, the performance of granular activated carbon (GAC), as opposed to powdered activated carbon, was evaluated. In addition, research on ozonation and GAC adsorption has mainly focused on either organic matter removal or color removal, but not both processes occurring simultaneously.
Colored dissolved organic matter (DOM) is an optically measurable component of DOM in water that absorbs light at wavelengths between 280 and 700 nm (Hoge et al, 1995). The colored compounds in DOM may be heterogeneous mixtures of aromatic and aliphatic organic compounds containing different chromophoric groups (Chen et al, 2003; Islam et al, 2021; Wilkie et al, 2000). To date, most studies on colored DOM have been conducted on river and ocean water (Song et al, 2019; Wen et al, 2018). Advanced characterization of organic matter based on hydrophobicity, MW, and fluorogenic origin is gaining interest in the water treatment industry (Huber et al, 2011; Jin et al, 2016; Peiris et al, 2010; Wang et al, 2017); however, the characteristics of compounds that cause coloration remain unclear.
Previous research by our cooperative group revealed that fulvic-acid-like and humic-acid-like organics are the primary reasons for the yellowish color of biological effluent from the WWTP of an industrial park, and these colorants may have MWs in the range of 2–5 kDa (Islam et al, 2021). Therefore, further studies on effluent-colored DOM from municipal WWTPs and their transformations should be conducted during treatment processes.
In this study, to provide advanced method of organic matter and color removal for a municipal WWTP in Tianjin, China, a pilot-scale system consisting of two different processes was operated from June to October 2020. Ozonation and activated carbon adsorption, which are two common methods used to remove organic matter or color in industrial wastewater, were employed. A coagulation–sedimentation–deep-bed filtration (CSDF) system has already been built in this WWTP to remove suspended solids; therefore, pilot-scale CSDF equipment was established with working parameters of the WWTP determining the efficiency of ozonation and GAC adsorption as pretreatments. Thus, two technological processes were designed: CSDF–ozonation and CSDF–GAC adsorption.
The aim of this study was to compare the efficiency of different ozone doses in simultaneously removing organic matter and color with that of GAC adsorption. The removal of two substances was investigated using CSDF as the pretreatment process. To explore the different fates and transformations of DOM during these processes, the characteristics of DOM, including apparent MW and excitation–emission matrix fluorescence (EEM) in the effluent of secondary clarifiers, filtration, ozonation, and GAC methods, were studied.
Materials and Methods
WWTP and secondary effluent
The WWTP where the pilot-scale system in this study was set up is in Tianjin, China, and has a design scale of 65 × 104 m3/d (Tianjin Capital Environmental Protection Group Co. Ltd., 2022). The biological treatment system of the WWTP adopted an anaerobic–anoxic–aerobic–anoxic–aerobic process, with a hydraulic retention time (HRT) of 19.6 h. To meet the stringent local discharge standards for chemical organic demand (COD) and color intensity, an advanced treatment process based on a secondary sedimentation tank manual was planned. The organic and color characteristics of the secondary effluent from the WWTP are summarized in Table 1.
Typical Characteristics of Secondary Effluent
COD, chemical organic demand; DOC, dissolved organic carbon; PCU, platinum cobalt color unit; SCOD, soluble COD.
Experimental system
An experimental schematic of the CSDF, ozonation, and GAC adsorption units is shown in Fig. 1.
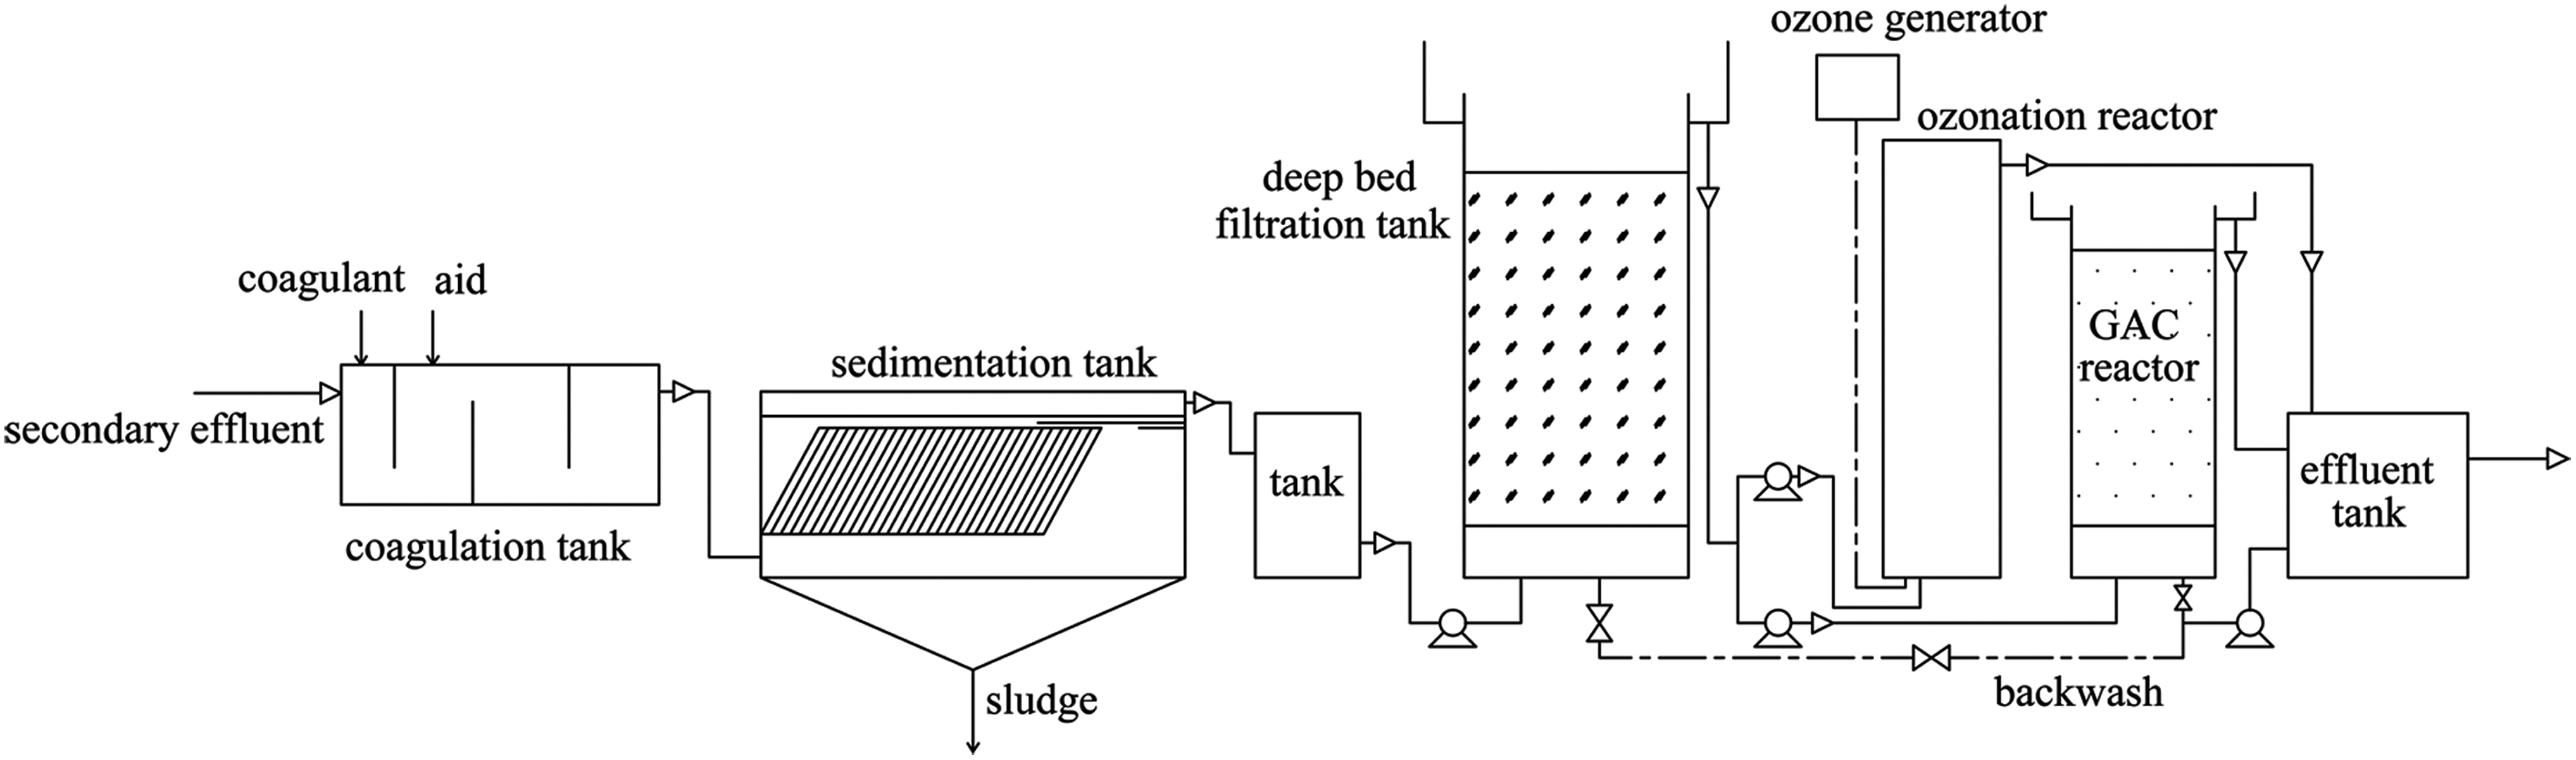
Schematic of experimental equipment. GAC, granular activated carbon.
The pilot plant unit consisted of a coagulation tank, sedimentation tank, deep-bed filtration tank, ozonation reactor, GAC adsorption reactor, and final-effluent tank. The treatment capacity of the reactors, from coagulation to filtration, was 24 m3/d, whereas those of the ozonation and GAC reactors were 12 m3/d. First, the secondary effluent was run through the coagulation tank, sedimentation tank, and deep-bed filter. The deep-bed filtration effluent was divided into two equal parts: one part was pumped into the ozonation reactor, and the other was pumped into the GAC reactor.
The coagulant used was polyaluminum chloride, and the coagulant aid was polyacrylamide, with doses of 5 and 0.5 mg/L, respectively. The filters in the deep-bed filter tank comprised quartz sand with a diameter of 2.5–3.5 mm and a height of 1.8 m. The HRT of the ozonation reactor was 30 min, and ozone-containing gas was continuously produced using an ozone generator fed with pure oxygen at a gas flow rate of 2 L/min. Online monitoring of the ozone gas was performed to determine the feed and off-gas ozone concentrations and gas transfer efficiency. The HRT of the GAC empty bed was 30 min, and the raw material of the GAC was coconut charcoal. The initial iodine content was 665 mg/g, and the proportion of the mean particle diameter of the GAC (1–3 mm) was >85%.
Size-exclusion chromatography for apparent MW analysis
The apparent MW of the organics in the water samples was determined using high-performance liquid size-exclusion chromatography. A high-performance liquid chromatography system (Breeze 1525, Waters, USA) coupled with a ultraviolet (UV) detector (254 nm) and Shodex KW 802.5 gel chromatography column was used for organic separation. The samples were filtered through 0.45-μm membranes and injected into a high liquid chromatography system with a volume of 200 μL. The mobile phase was a 5-mM phosphate buffer solution with a pH of 7 ± 0.2, and the flow rate was 0.8 mL/min. DOM isolation tests were performed at an ozone dose of 6.3 mg/L. Polystyrene sulfonate standards (Sigma-Aldrich, USA) of MW 1.8–32 kDa and an acetone standard (58 Da) were used for apparent MW calibration (Islam et al, 2021; Makehelwala et al, 2019; Wang et al, 2010). The MW fraction distributions of total organic matter or dissolved organic carbon (DOC) ranged between 100 and 5 kDa.
Fluorescence EEM analysis
The EEM spectra were measured using a fluorescence spectrophotometer (F7000; HITACHI, Japan). A three-dimensional scan was selected as the operating model. Emission scans were performed from 220 to 550 nm, with 5 nm increments, by varying the degree of excitation between 200 and 400 nm at each 5 nm sampling interval. The EEM spectra are plotted as contours. The x-axis represents the emission spectra, the y-axis represents the excitation wavelength, and the contour lines represent the fluorescence intensity. The detector was set to high sensitivity, and the scanning speed was maintained at 12,000 nm/min. The spectrum of Milli-Q water (ultrapure water) was used as a blank. The EEM of the Milli-Q water was obtained before each measurement to eliminate Raman scatter peaks. To minimize the inner filter effect on the fluorescence measured, the samples were diluted, when necessary, using ultrapure water to guarantee that the absorbance of each water sample would not exceed 0.05 at 254 nm (Islam et al, 2021; Liu et al, 2019).
Analytical methods
COD was analyzed using the potassium dichromate oxidation method (State Environmental Protection Administration of China, 2002). Color intensity was measured following a standard method of NCASI (National Council for Air and Stream Improvement), color method 71.01 (PCU455nm), also known as the platinum-cobalt standard method (Pt-Co method) (EPA 1974; NCASI West Coast Regional Center Organic Analytical Program 1999). Direct color intensity (PCU455nm) was used based on the Pt–Co standard, because this standard is specifically designed to measure the yellowish color of wastewater (Islam et al, 2021). The intensity was measured at 455 nm using a spectrophotometer (DR 6000; HACH, USA). The DOC concentrations were determined using a total organic carbon analyzer (TOC-Vcph, Shimadzu, Japan). Before the DOC, soluble COD (SCOD), and color intensity measurements, the samples were filtered through 0.45-μm membranes.
Results and Discussion
Effect of CSDF pretreatment
Removal of organic matter and color
The removal of COD, DOC, and color intensity by the CSDF pretreatment is summarized in Table 2. The results show that the three indices had average removal rates of 26.7%, 6.5%, and 29.2%, respectively, and the proportion of SCOD/COD increased from 0.82 to 0.93 following the CSDF process, which reduced the effect of particulates on ozonation and GAC adsorption. Furthermore, the removal rate of COD (26.7%) by CSDF was higher than that of DOC (6.5%), which is consistent with a previous study (Petronela et al, 2021) and likely related to the hydrophobic organics being more favorably removed by coagulation–sedimentation and filtration than by other fractions (Acero et al, 2016).
Removal of Organic Matter and Color by Coagulation–Sedimentation–Deep-Bed Filtration
Concentration unit was PCU455nm.
CSDF, coagulation–sedimentation–deep-bed filtration.
MW is an important physical index of organic matter. The apparent MW was characterized using liquid-phase exclusion chromatography, in which a high peak intensity represents a high concentration of organic components. The differences in the apparent MW distribution between the secondary effluent and effluent from the CSDF are shown in Fig. 2. The results indicate that the MW in the secondary effluent was centered at 0.8–3 kDa, and the apparent MW distribution of organic matter in the effluent of the CSDF was similar to that in the secondary effluent.
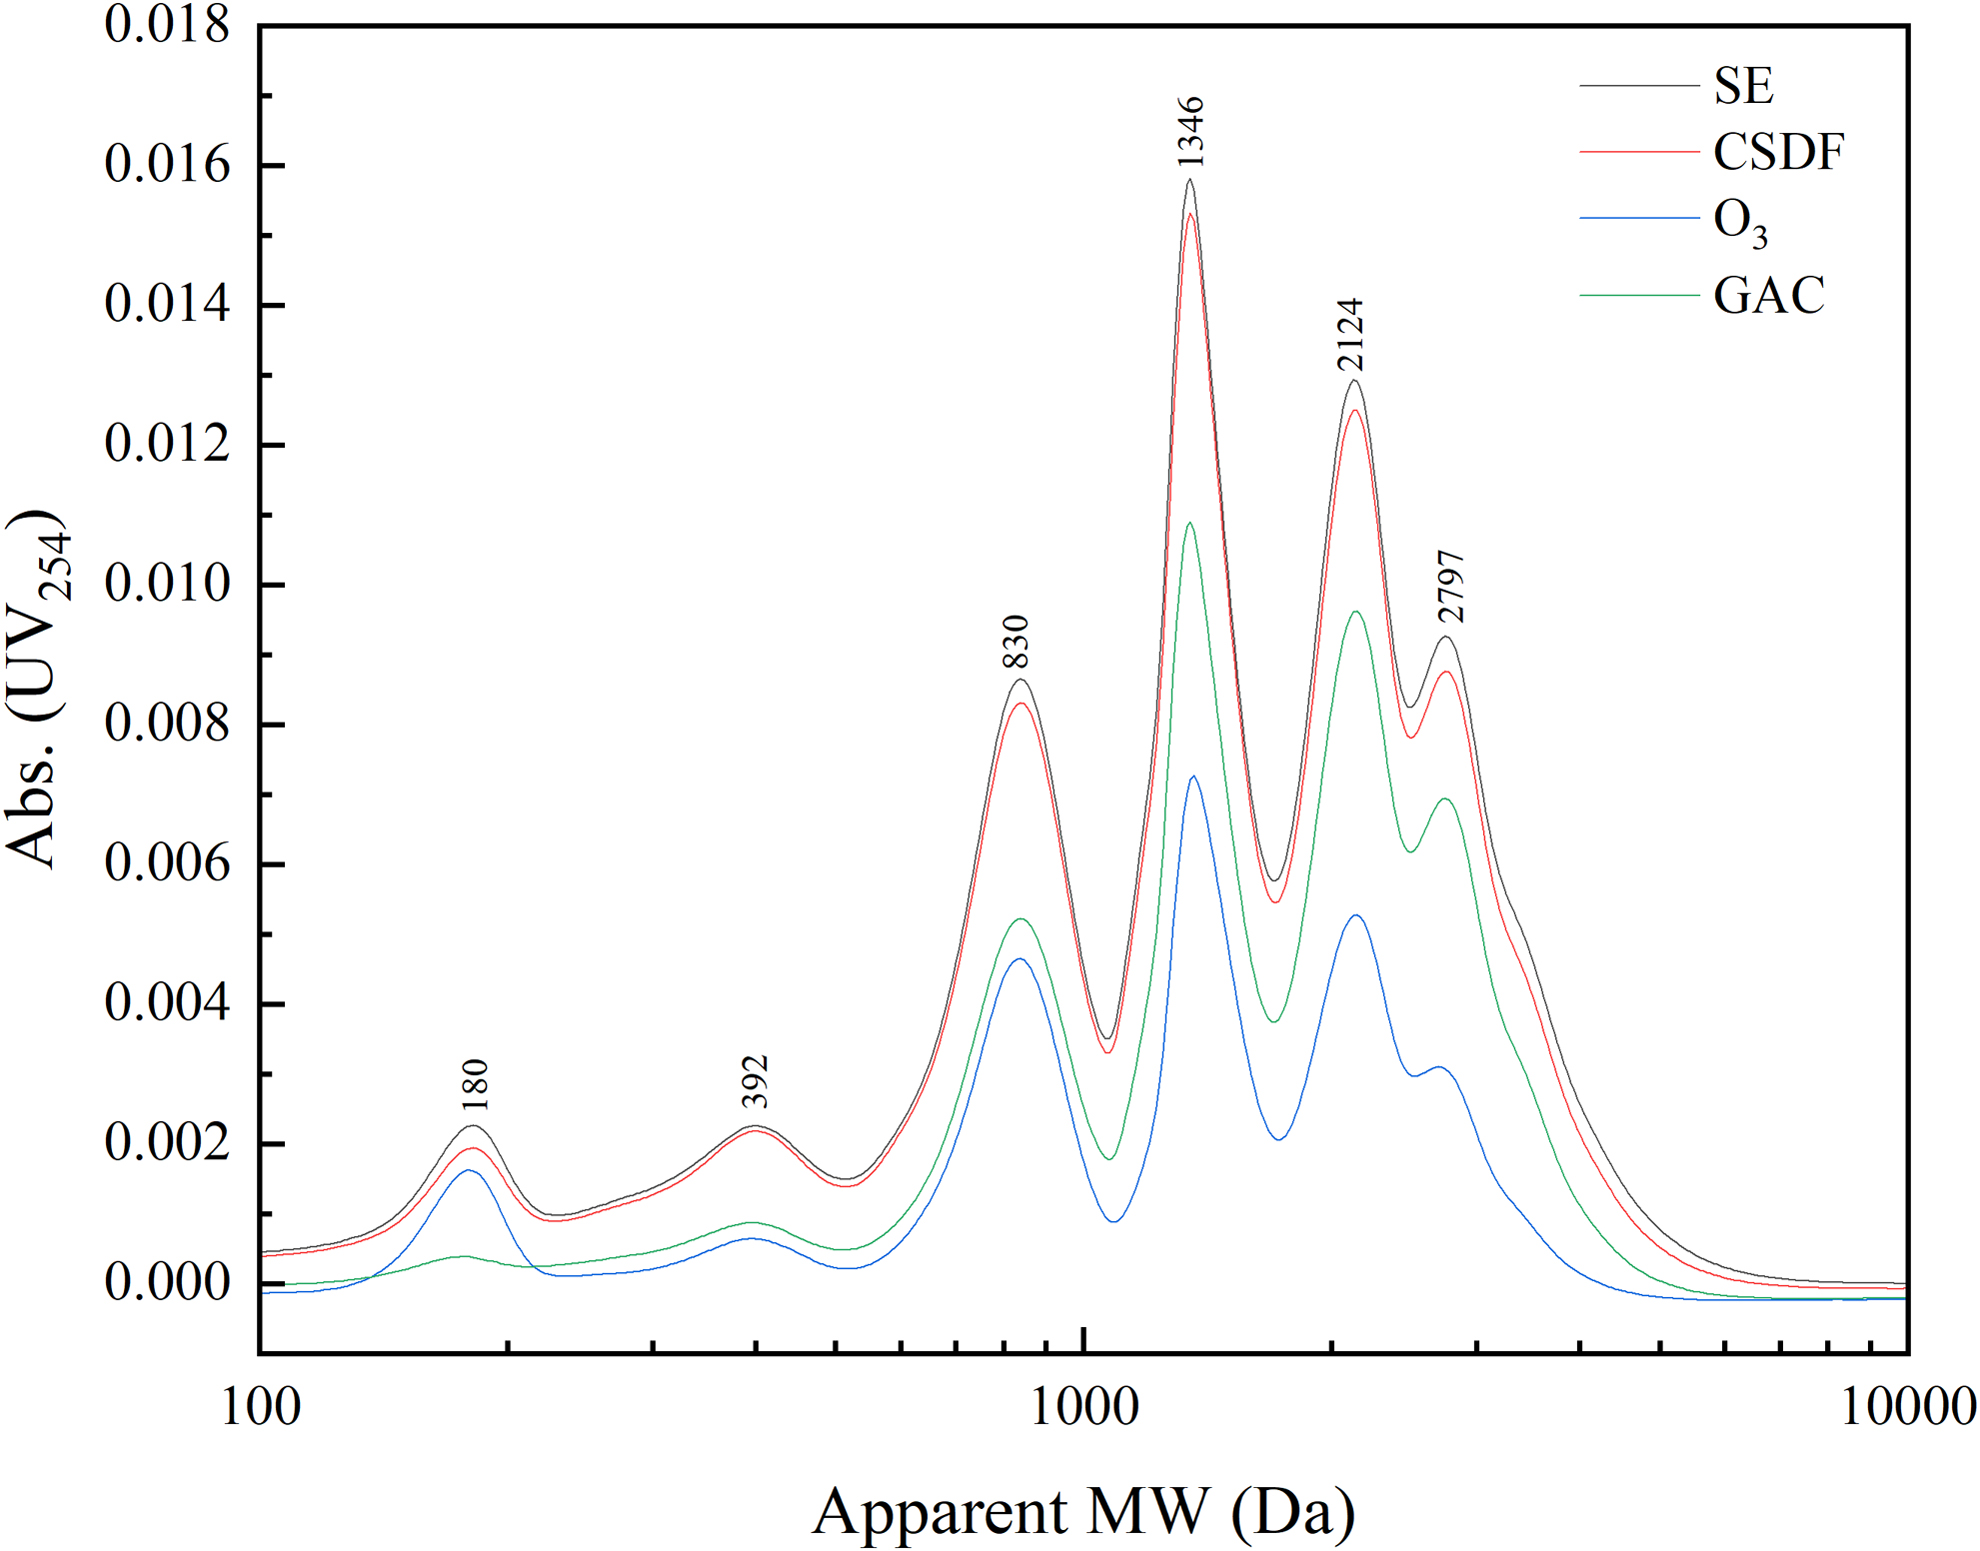
MW distribution of organic matter in secondary effluent, effluent of CSDF, ozonation, and GAC adsorption. CSDF, coagulation–sedimentation–deep-bed filtration; MW, molecular weight; SE, secondary effluent; UV, ultraviolet.
In addition, the intensities of the six peaks appeared in the following order from highest to lowest: 1.35, 2.12, 2.80, 0.83, 0.39, and 0.18 kDa. This result is consistent with that of Audenaert et al (2013), who revealed that DOM in secondary effluent had a major MW of 0.1–3 kDa. CSDF is an effective process for removing organic matter with a high MW (Zhang et al, 2008); however, organic matter with a low MW (0.8–3 kDa) was the major component, and the DOC removal rate by CSDF was only 6.5%.
Changes in fluorescent DOM
EEM spectra obtained using fluorescence spectroscopy provide important information on the chemical nature of fluorescent DOM (Chen et al, 2004; Li et al, 2014), such as the position, shift, and intensity of the fluorescence peaks, which can be correlated with structural information, such as functional groups (electron-donating or electron-accepting groups), polycondensation, aromaticity, heterogeneity, and dynamic properties related to their intramolecular and intermolecular interactions (Chen et al, 2003).
Generally, five regions can be identified based on the EEM: Region 1, tyrosine-like aromatic protein (Ex/Em 200–250/280–330); Region 2, tryptophan-like aromatic protein (Ex/Em 200–250/330–380); Region 3, fulvic-acid-like matter (Ex/Em 200–250/380–550); Region 4, soluble microbial by-product-like matter (Ex/Em 200–250/280–380); and Region 5, humic-acid-like matter (Ex/Em 250–400/380–550) (Jin et al, 2013; Mo et al, 2019). The tyrosine- and tryptophan-like fractions were classified as protein-like matter. The fulvic-acid- and humic-acid-like fractions were referred to as humus-like matter.
As presented in Fig. 3, humus-like matter was the major component in the fluorescent organics of the secondary effluent, which slightly contradicts a previous laboratory-scale study that focused on organic matter in secondary effluent obtained from China (Mo et al, 2019). The differences observed between our study and others (soluble microbial by-product-like matter and humic acid being the major fluorescent components) were most likely caused by the different raw waters used. The sludge retention time of the secondary biological system in our study was 15–18 days, which provided conditions for vigorous sludge growth.
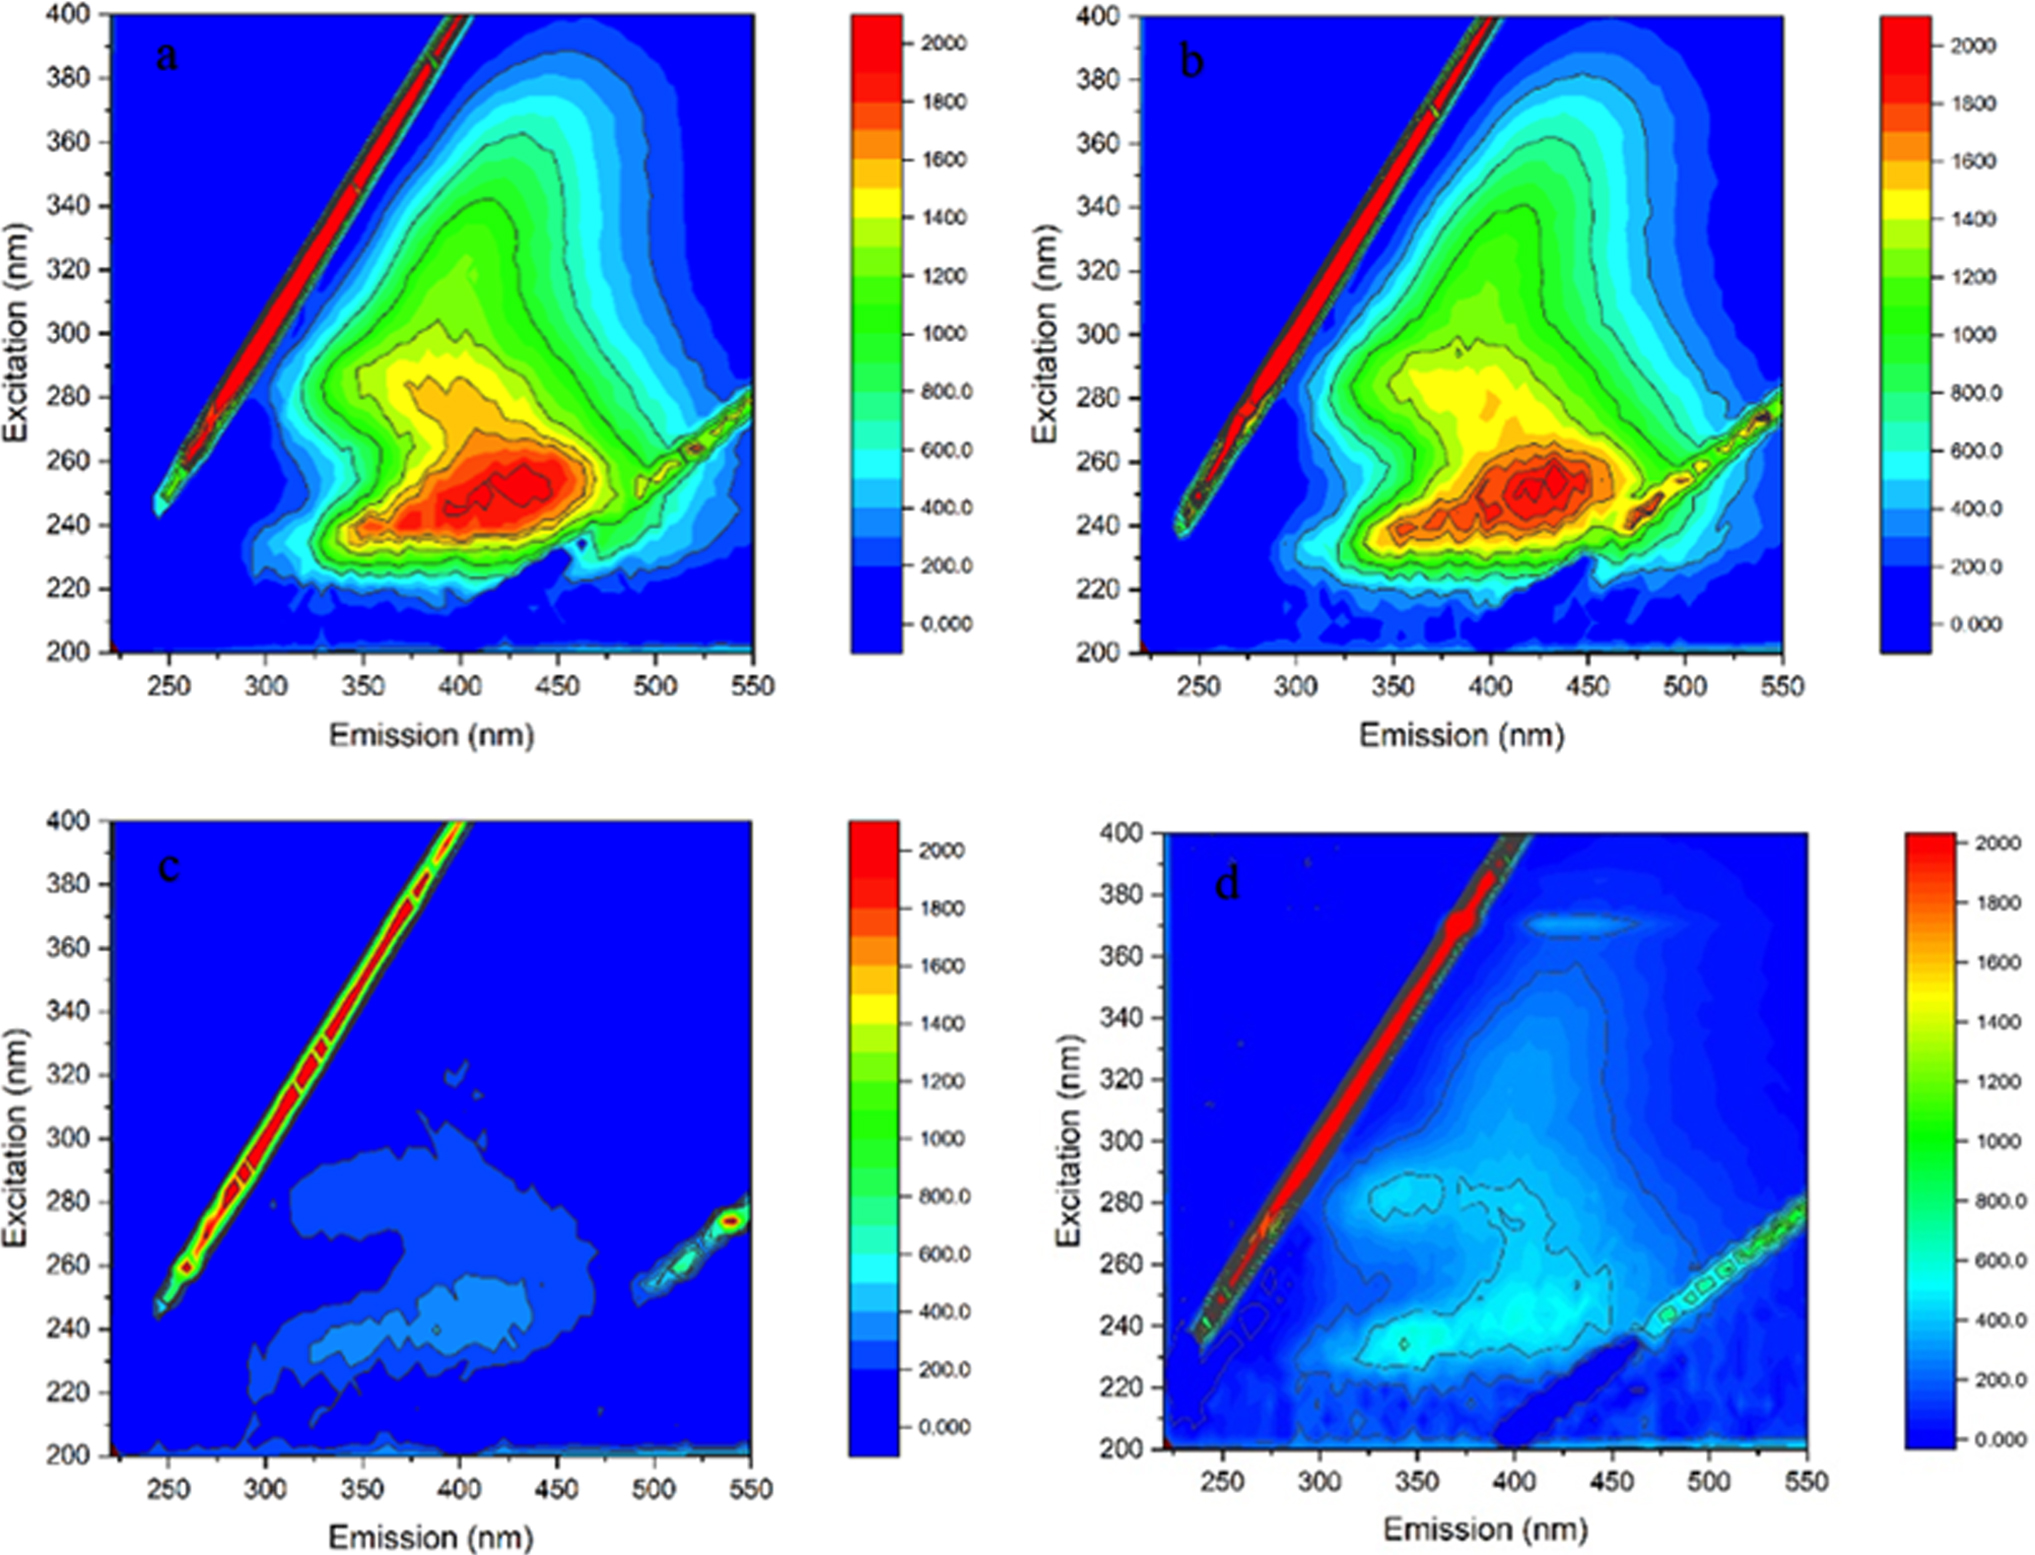
Fluorescence EEM of the secondary effluent
Thus, the concentrations of soluble microbial by-products-like matter from substrate metabolism and biomass decay in the secondary effluent were not high. After treatment, humus-like matter remained the major component of the fluorescent organics in the effluent from the CSDF, and its concentration slightly decreased. These changes in fluorescent organics during CSDF were consistent with the characteristics of color intensity and DOC removal; however, the efficiencies were not evident.
Comparison between ozonation and GAC adsorption
Removal of organic matter and color
Figure 4 shows the organic matter and color removal through ozonation at different ozone doses and the GAC adsorption of the effluent through CSDF. Both ozonation and GAC adsorption were found to be reliable for reducing organic matter and color. Comparing the treatment effects of the two processes, the results show that ozone had a significantly higher decolorization capacity, whereas organic matter removal was affected by ozone dose. For example, when the average ozone dose was increased to 9.1 mg/L, the average COD and DOC removal rates through ozonation were 27.3% and 15.0%, respectively, which are higher than those of GAC adsorption (23.7% and 13.2%, respectively). However, at the other two lower average ozone doses (4.7 and 6.3 mg/L), the removal rates of COD and DOC through ozonation were slight lower than those through GAC adsorption.
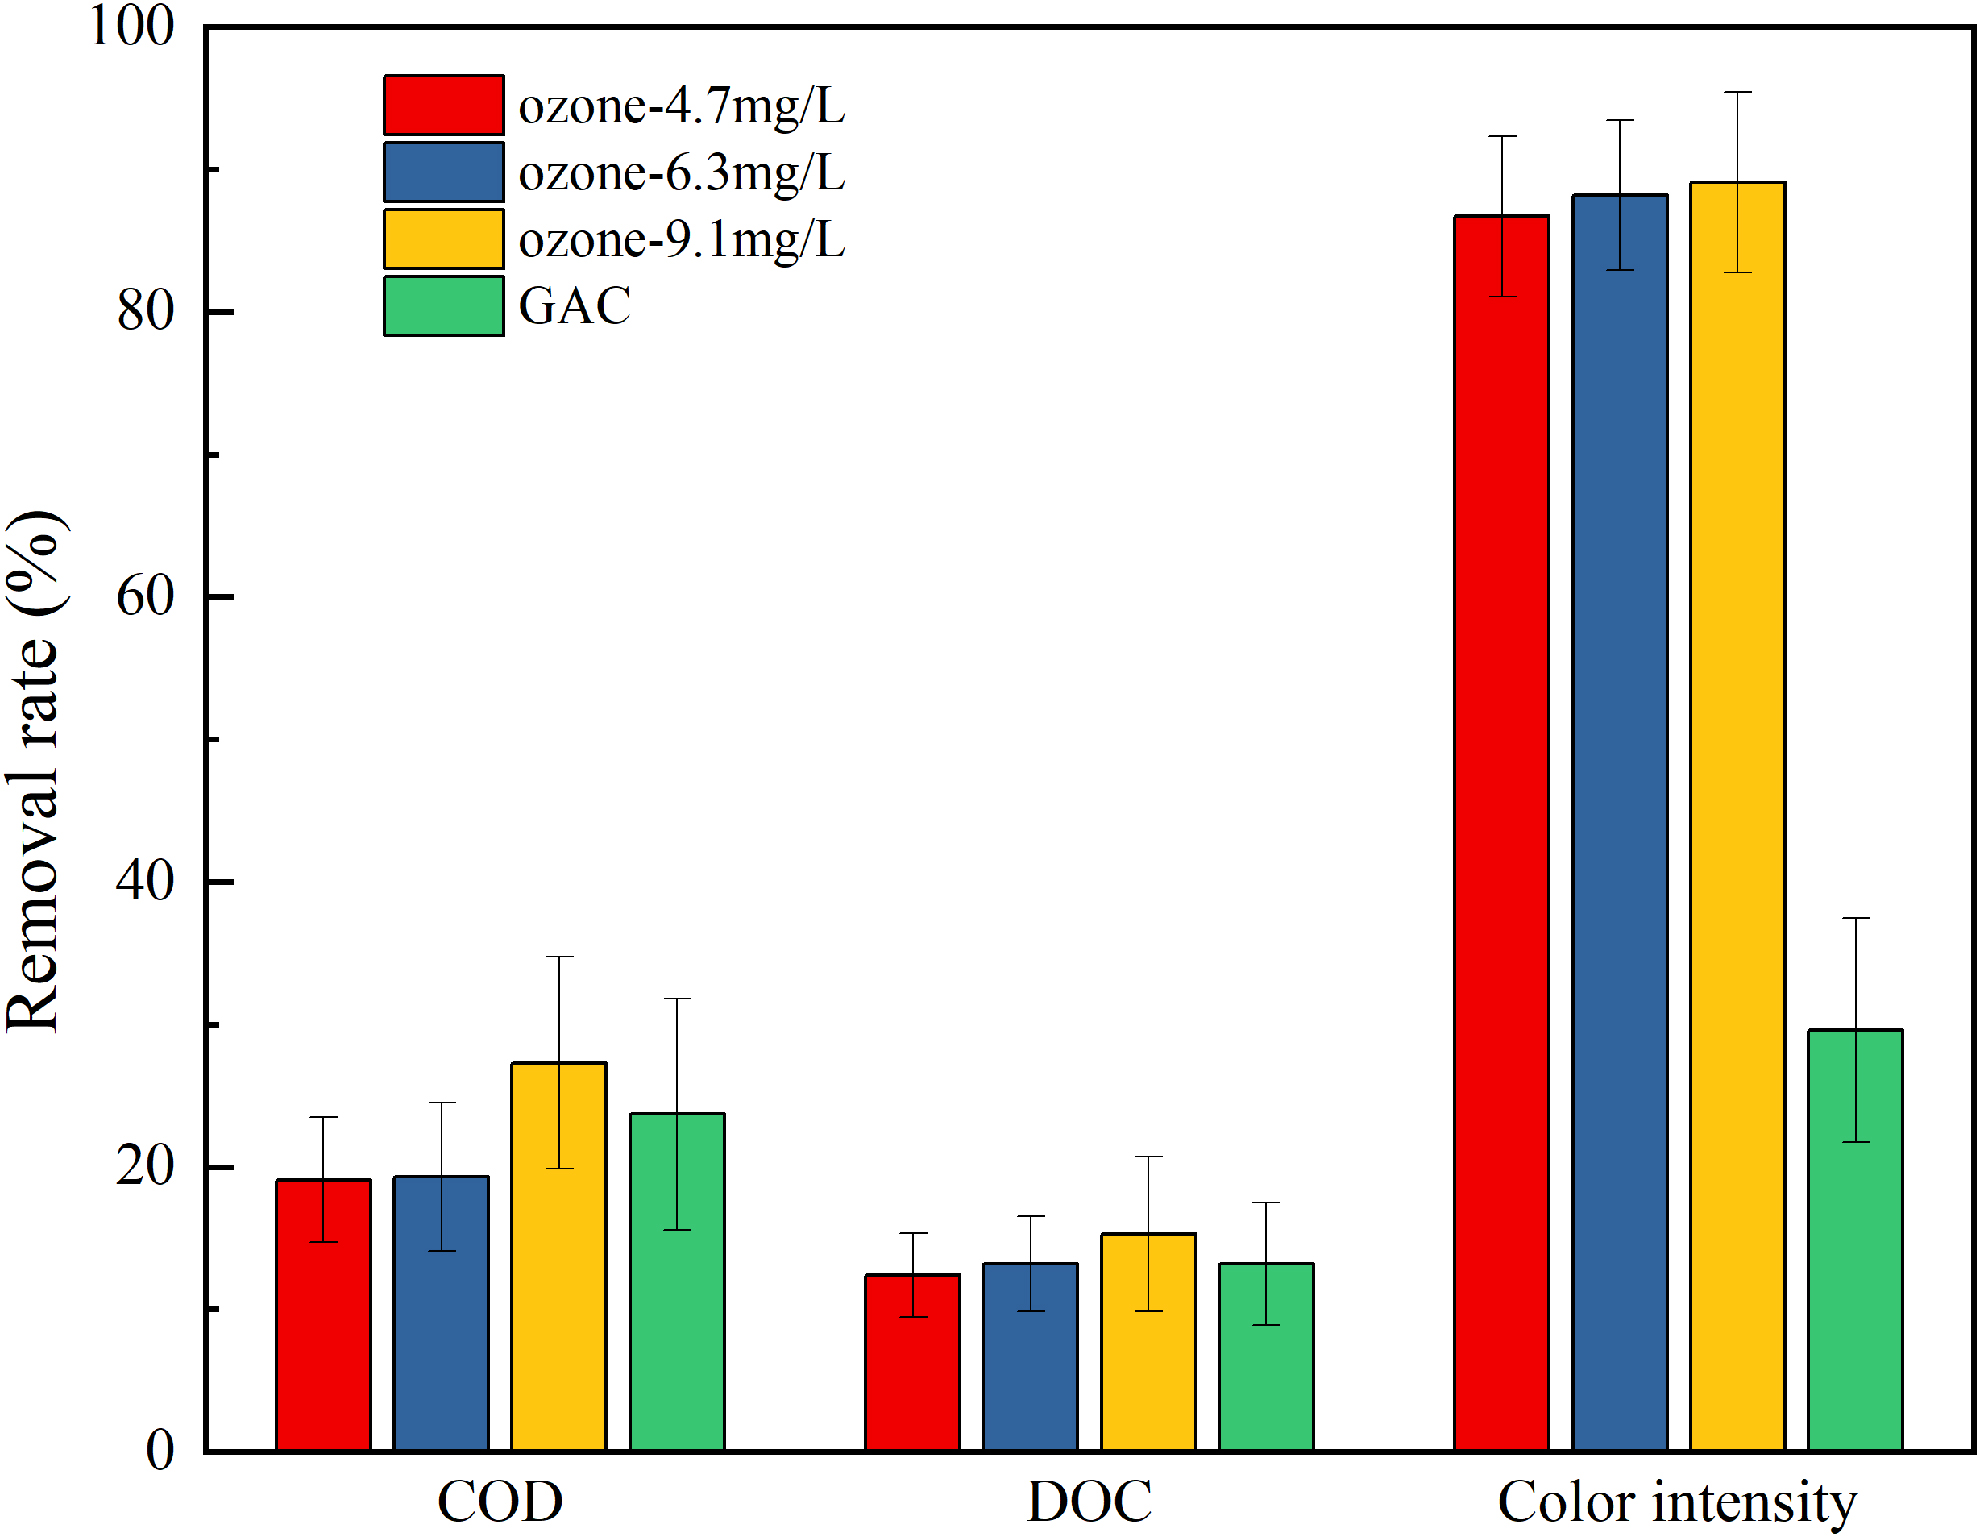
Removal of COD, DOC, and color through ozonation and GAC adsorption. COD, chemical organic demand; DOC, dissolved organic carbon.
Unlike COD and DOC, ozone showed significant decolorization ability in treating effluents through CSDF. The average removal rate reached 86.7% when the average ozone dose was only 4.7 mg/L. According to Turhan et al (2012), ozone is very effective for decolorizing because it can attack conjugated double bonds, which are typically associated with color. Compared with ozonation, GAC adsorption had a lower color removal ability; the average removal rate for color intensity by GAC was 29.2%, and its maximum removal rate was lower than the minimum removal rate of ozonation. In addition, the iodine adsorption value of carbon decreased from 660 to 620 mg/L when particles with 2- to 3-mm diameters were used for 4 months. This indicates that ozonation is more suitable considering the organic matter and color removal efficiencies of the two processes as well as the regeneration problem of GAC after saturated adsorption.
Comparing the results of this study with literature data for ozonation processes, the low removal efficiencies of COD and DOC might be related to the concentrations and main components of the influent. Gümüs and Akbal (2017) also reported that a DOC humic-acid removal of 21.4% was obtained at 10 mg/L of ozone, which was also the major component in the effluent from CSDF. Although both influents were municipal wastewater, Mo et al (2019) reported that the maximum DOC removal rate was 35.2% at 10 mg/L of ozone with an influent DOC of 8.8 mg/L, which was higher than those in this study. Furthermore, the influent categories also affected the ozonation effect.
Islam et al (2021) reported that ozonation, even at a dose of 40 mg/L, had a removal rate of 25.2% when treating the biological effluent of an industrial park (40% industrial). At such a high ozone dosage, the DOC removal efficiency through ozonation was still lower than that through GAC adsorption. This result contradicts the conclusions of this study. Therefore, the comparison results of organic matter removal efficiencies between ozonation and GAC adsorption were closely associated with the influent water quality. The DOC removal efficiencies of ozonation and GAC adsorption were not high at low influent concentrations.
The reduction in color was higher than that of DOC, indicating that the by-products are generally organic acids, aldehydes, and ketones (Hammes et al, 2006), which exhibited considerably less fluorescence than the precursors. Although DOC removal improved with an increase in ozone dose, the mass-specific consumption of ozone to DOC (△O3/△DOC) increased. When ozone consumption was calculated as the difference between the dose and exhaust gas emission, the △O3/△DOC at an average ozone dose of 9.1 mg/L was 1.62 times more than that at an ozone dose of 4.7 mg/L. The color intensity improvement rate was also not linear with increasing ozone dose, and the removal rates were 86.7 ± 5.6%, 88.2 ± 5.2%, and 89.1 ± 6.4% at average doses of 4.7, 6.3, and 9.1 mg/L, respectively. Therefore, for organic matter and color removal, increasing the ozone dose may lead to a reduction in ozone utilization efficiency.
Changes in MW characteristics and colored DOM
The apparent MW changes in the organic matter during ozonation (at a dose of 6.3 mg/L) and GAC adsorption are shown in Fig. 2. The results indicate that the strengths of the six major peaks (0.18, 0.39, 0.83, 1.35, 2.12, and 2.80 kDa) in the deep-bed filtration tank effluent were reduced by ozonation and GAC adsorption. However, the extent of reduction was not identical between the two treatments. Ozonation had a higher capacity to reduce organic matter at MW distributions of 0.39, 0.83, 1.35, 2.12, and 2.80 kDa, where its peaks were the strongest, whereas at 0.18 kDa, GAC adsorption ability was more significant. According to Andrew and Christina (2017), DOM has a higher MW, is more aromatic, less bioavailable, and more complex. Thus, it can be inferred that ozone has a better ability to remove more aromatic substances than GAC does.
The relationship between the color intensity and apparent MW of organic matter in the effluent from the secondary effluent analyzed using Gaussian nonlinear fitting is shown in Fig. 5, in which four MW fractions (<0.5, 0.5–1, 1–2, and 2–3 kDa) were determined. Examination of the correlation between color and apparent MW demonstrated that the strong correlation was in the MW range of 2–3 kDa (R2 = 0.88, p < 0.05). This implies that the colored substances may have an MW of 2–3 kDa. In terms of treatment efficiencies (Fig. 2), ozonation had a significantly higher removal efficiency for organic matter with an MW of 2–3 kDa than GAC adsorption. The coefficient of correlation between color intensity and apparent MW (<0.5 kDa) was the lowest among the four coefficients, whereas GAC was more efficient in removal in this MW range than ozonation. Hence, color intensity removal through ozonation was significantly higher than that through GAC adsorption.
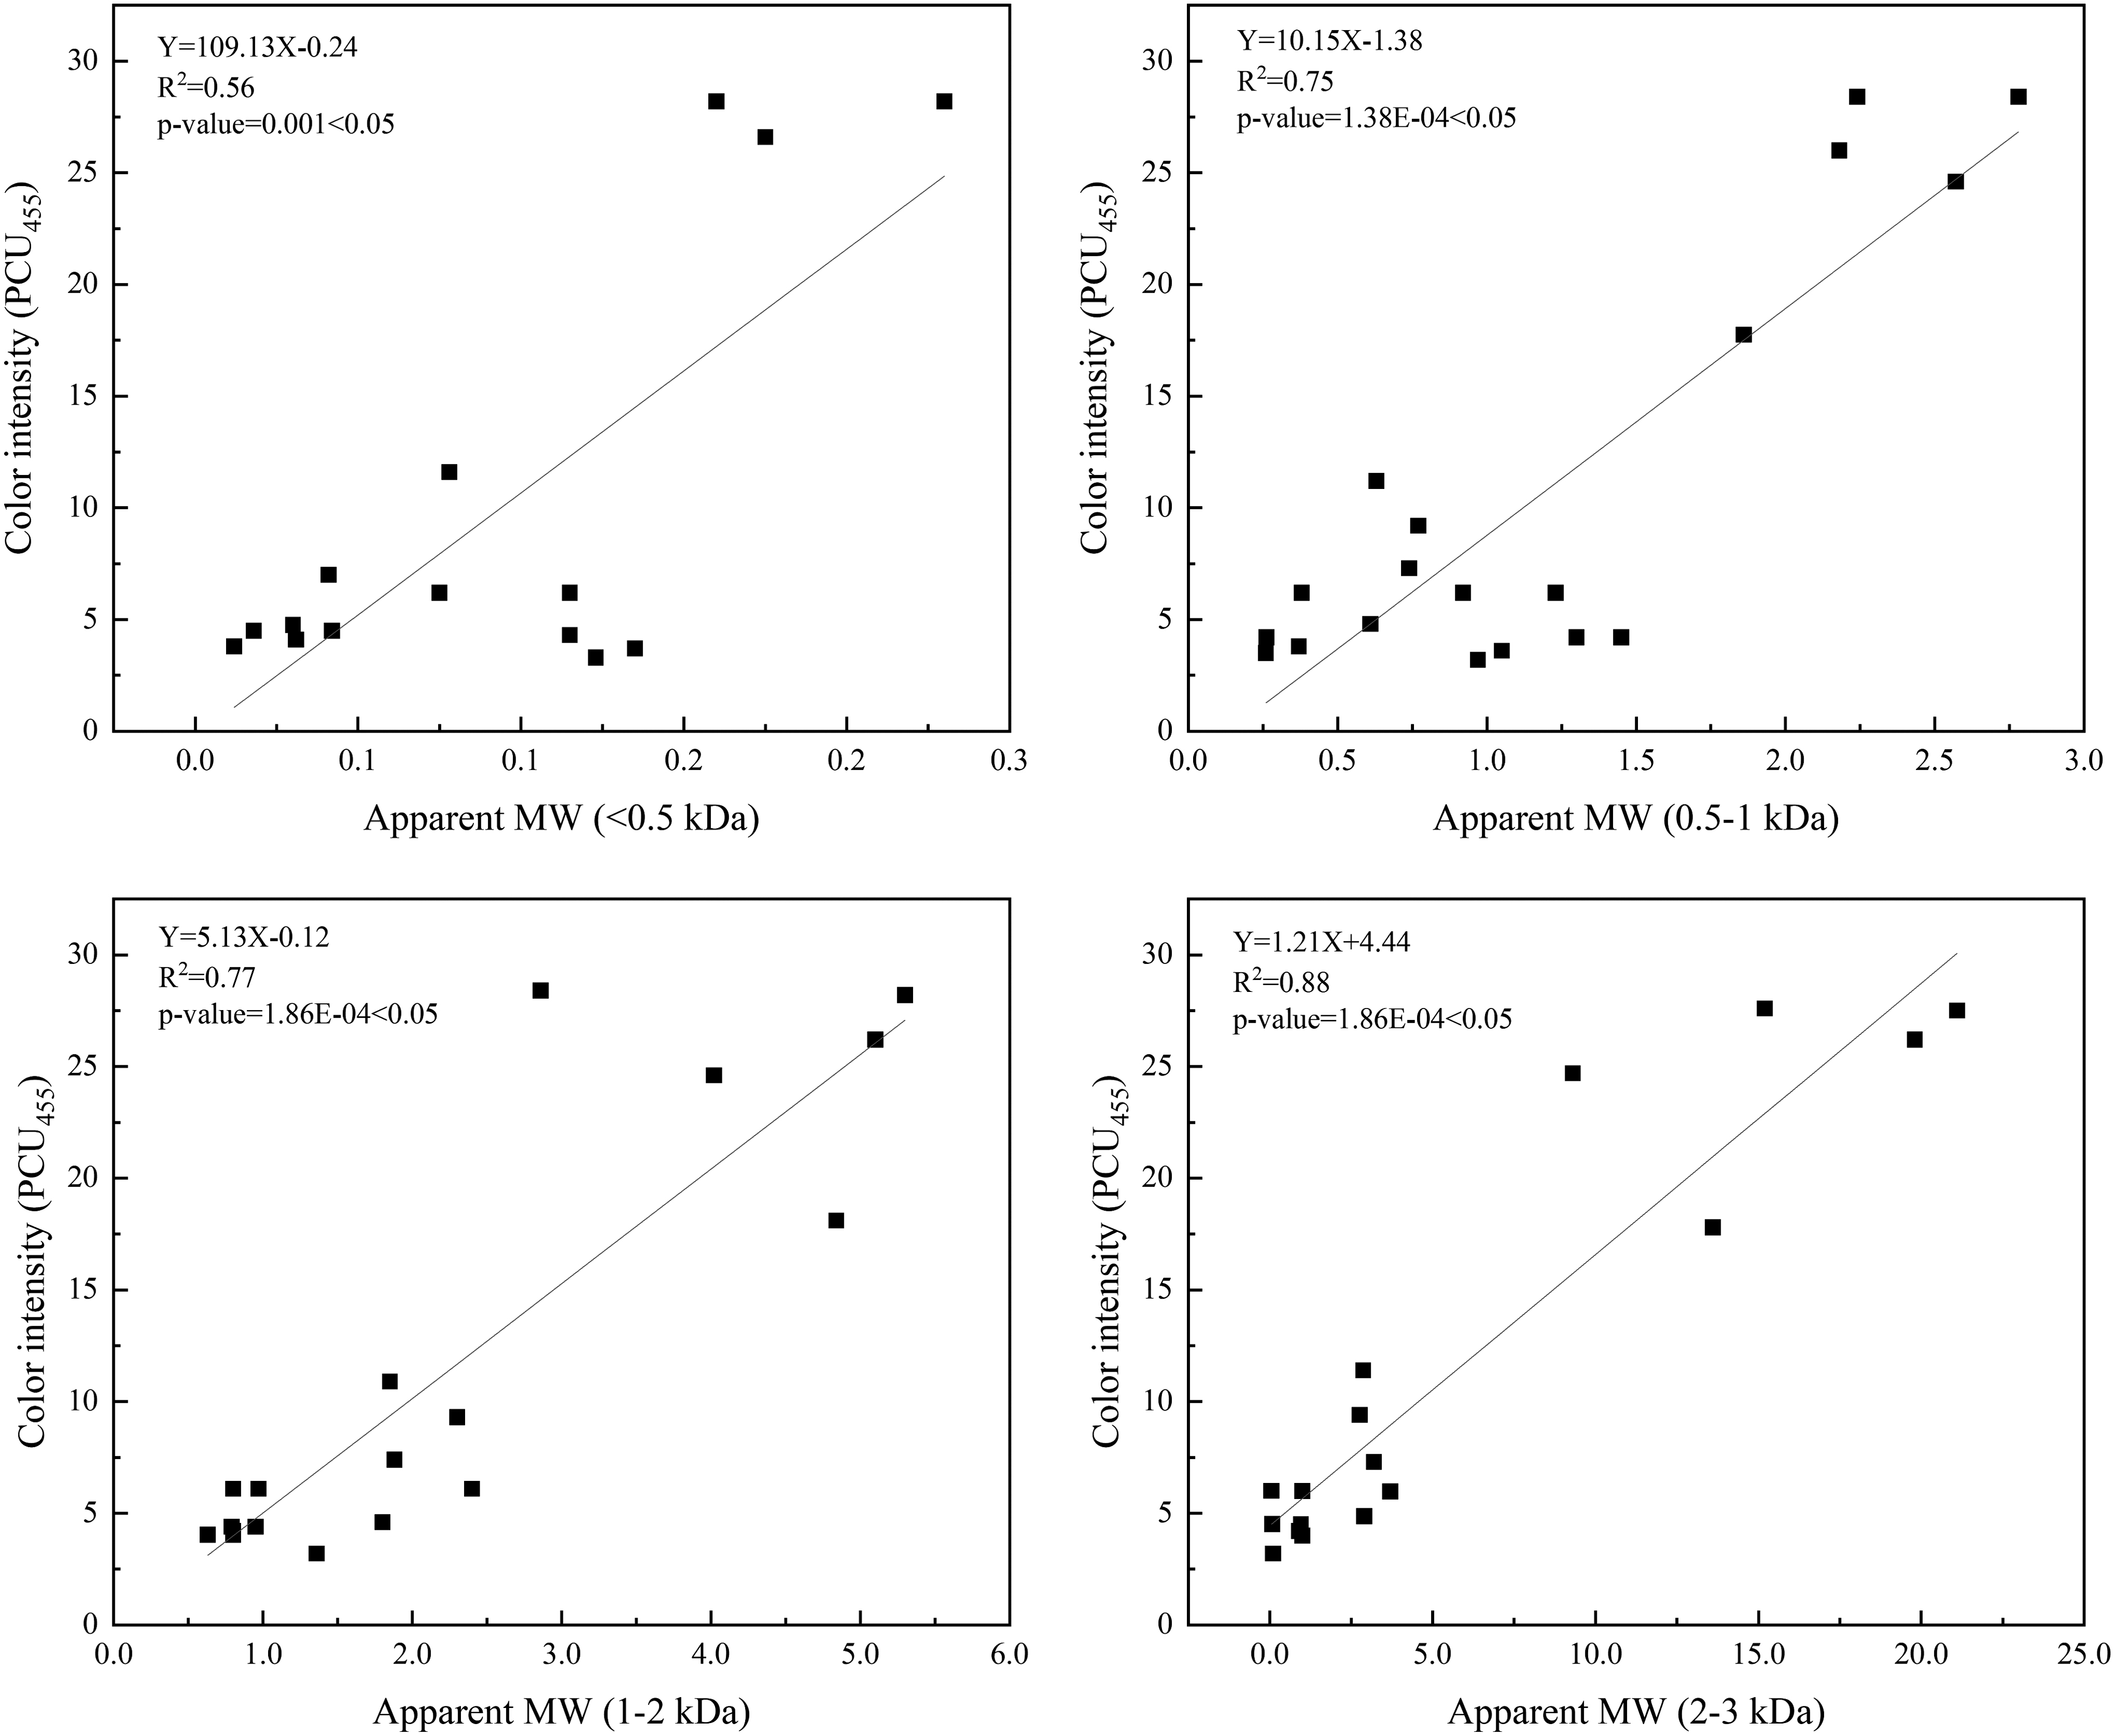
Relationship between color and organics at each DOM size. DOM, dissolved organic matter; PCU, platinum cobalt color unit.
No new peaks of apparent MW appeared after ozonation, indicating that no influence was exerted on the size distribution at low ozone doses, except for a decrease in the intensity. The results showed that ozone preferentially reacted with high-MW organics. Similar results were obtained by Chen et al (2017b) and Mo et al (2019). This could be attributed to the high depletion of conjugated bonds or aromatic rings in humus-like substances, as products with low-MW oxygen-containing organic compounds exhibit less UV absorption (Tang et al, 2014). Ozone preferentially reacts with high-MW organics, which is consistent with the finding that unsaturated bonds in aromatic organics are easily broken during ozonation (Turhan et al, 2012).
There was no transition to a low MW after ozonation, which contradicts the previously reported phenomenon of high-MW compounds transforming into low-MW compounds (Westerhoff et al, 1999). Jin et al (2016) revealed that organics with MW <1 kDa at the fluorescence detection wavelength of humic acid in second effluent could be completely removed. Therefore, the UV response of organics with a low MW did not increase after ozonation, which might be related to the higher removal of low-MW compounds than their formation.
Changes in fluorescent DOM
Comparing the fluorescence intensity of the effluents from ozonation, GAC, and CSDF, reductions were observed in the effluents from ozonation and GAC. However, the remaining humus-like matter distributed in the emission range of 280–550 nm was higher in the effluent from GAC than in that from ozonation. As mentioned earlier, humus-like matter distributed in the emission range of 280–550 nm was the major component of the fluorescent organics, which were the major contributors to the color in the CSDF effluent. As a result, the color intensity was significantly reduced by ozonation compared with GAC adsorption.
Conclusions
DOM was the main component of organic matter in the secondary effluent, and the apparent MW peak was centered at 0.8–3 kDa. In fluorescent DOM, humus-like matter was the major component distributed in the emission range of 280–550 nm. Among the chemical properties, the apparent MW of organic matter was found to be in the range of 2–3 kDa and was positively correlated with the color intensity in the secondary effluent. CSDF exhibited COD and DOC removal rates of 26.7% and 6.5%, respectively. The apparent MW and major fluorescent components in the DOM in the effluent from CSDF were similar to those in the secondary effluent.
The ozonation process had a greater ability for color removal than GAC adsorption, as the removal rate reached 86.7% at an ozone dose of only 4.7 mg/L, whereas 29.2% removal was achieved by GAC adsorption. In addition, a higher DOC removal was achieved by ozonation when the average ozone dose was 9.1 mg/L. As for the efficiency of ozonation and GAC adsorption with respect to apparent MW distributions, ozonation was found to have a greater removal ability for organic matter with an MW of 1–3 kDa, which covers the apparent MW range of colored DOM.
For fluorescent DOM, the remaining humus-like matter was considerably lower in the effluent from ozonation. The removal rates of COD and DOC through ozonation and GAC adsorption were not high at low influent concentrations. When the average ozone dosage was increased from 4.3 to 9.1 mg/L, the △O3/△DOC increased by 1.62 times, whereas the DOC removal rate only improved by 2.3%. Although both hybrid processes were found to be reliable for reducing organic matter and color, the results show that ozonation is more suitable for simultaneously removing refractory organic matter and color.
Footnotes
Acknowledgments
Authors thank PhD Ashraful Islam and Guangxi Sun for their technical assistance in the study.
Authors' Contributions
Writing of the article by L.Z. Supporting of the conceptualization in the article by W.S., Y.Z., and Y.C. Editing assistance of the article by M.G. Reviewing of the article by Y.S.
Author Disclosure Statement
No competing financial interests exist.
Funding Information
This study was funded by the Major Science and Technology Program for Water Pollution Control and Treatment (Grant Nos. 2017ZX07106005 and 2017ZX07107003) and Tianjin Science and technology project (Grant No. 16YDLJSF00320).