
Abstract
Gasification has become an effective thermal technology for combustible municipal solid waste (CMSW) treatment. The produced sulfur- and nitrogen-containing compounds during gasification are being paid attention to owing to derived corrosion and emission issues. In this study, the release behavior of nitrogen and sulfur species from gasification of CMSW was investigated in CO2 and H2O atmosphere in a fixed-bed reactor. The experiments were performed at different temperatures and the collected gas–liquid–solid samples were analyzed separately using various methods, of which the concentration of various gas species including NO x , NH3, SO2, and H2S were determined by flue gas tester or Nessler's reagent colorimetric approach, and the contained components in tar were analyzed through gas chromatography–mass spectrometer technique. It was found that the release of nitrogen and sulfur changes with temperature and higher temperature generally promotes the formation of their corresponding gas-phase species. Certain amount of nitrogen and sulfur remained in char after gasification when the temperature rises from 600°C to 800°C. The NH3 content in product gas is much higher than NO x , where the latter species are detected only in part per billion level. The mass balance calculation indicates a possible existence of hydrogen cyanide and carbonyl sulfide in product gas. The tar compounds over the detectable range mainly consisted of hydrocarbons as well as several types of nitrogen-containing molecules but without sulfur-containing organics. An immigration route and distribution scenario of gasification cases <800°C was concluded and further compared between CO2 and H2O atmosphere at last.
Introduction
Rapid development of urbanization and economy around the world has led to the increasing accumulation of municipal solid waste, which no doubt inflicts a series of environmental issues such as release of gaseous pollutants, contamination of water bodies, and occupation of land resources (Xie et al, 2014). Moreover, the massive municipal solid waste without timely treatment poses a great threat to the living environment and physical health of mankind. Hence, it is essential to dispose the municipal solid waste appropriately. Normally, the municipal solid waste will be sorted into different classifications according to its physical properties and an important fraction is called combustible municipal solid waste (CMSW), which refers to the contained inflammable components including plastics, rubber, paper, and food waste that is usually preremoved from municipal solid waste (Fotovat et al, 2015; Niu et al, 2018). The traditional disposal method of CMSW is merely confined to incineration, landfill, and fermentation.
However, the above methods naturally have some disadvantages that prohibit them from wide application. For example, the development of CMSW incineration is under great pressure owing to the formation of toxic dioxins. The landfill approach is not considered effective from a long-term perspective because of limited land resources. Besides, fermentation is regarded as a low-efficiency and unhealthy way for CMSW treatment. The unbalanced dilemma caused by urgent treatment of CMSW and lack of high-performance disposal method has driven researchers to turn to other technologies. Gasification, an increasing popular technology that converts carbonaceous materials into fuel gas, provides a competitive route for CMSW disposal.
This thermal conversion process represents an attractive approach to the recovery of energy from solid wastes and accords well with the sustainable waste disposal concept because of its satisfactory performance in waste-to-energy achievement (Li et al, 2013; Yu et al, 2018). According to a report by Liu et al (2022b), another highlight of gasification is its lower carbon dioxide emission into the atmosphere, which is no doubt beneficial to the ultimate goal of carbon neutrality that almost each country across the globe is striving to achieve.
Although gasification technology opens the future perspective for energy recovery from CMSW, the content of pollutants in the derived fuel gas is relatively high, which reduces its economic value and hinders further application to some extent. Previous research on CMSW gasification or municipal solid waste gasification mainly focused on process optimization and products upgrading (Hu et al, 2015; Kardani et al, 2021; Li et al, 2012), whereas the pollution problems remained unsolved during the gasification process. Among the diverse pollutants, sulfur and nitrogen containing pollutants are the most two common harmful elements. In general, the sulfur and nitrogen in the CMSW mainly exist in inorganic and organic forms (Wei et al, 2020), which are further chemically transformed and distributed in “gas–liquid–solid” three phases during the thermal conversion process.
The gaseous sulfur is mainly in the form of H2S and SO2, whereas the gaseous nitrogen mostly consists of NO x and NH3 (Schmidt et al, 2021; Xian et al, 2020). Besides, other nitrogen and sulfur-containing compounds with trace amount such as carbonyl sulfide (COS) and hydrogen cyanide (HCN) can also be detected. To purify the gas product of CMSW gasification, the S/N gaseous pollutants emission is one of the most concerning issues. Most of the published researches are mainly concentrated on the sulfur and nitrogen release during conventional thermal process such as combustion, torrefaction, and pyrolysis. For instance, Zhang et al (2021) investigated the impact of prior torrefaction on the S release during the pyrolysis process of wheat straw and found that high torrefaction temperature enhanced the percentage of released S.
Chen et al (2020) thoroughly examined the S and N releasing characteristics in the process of oil sludge pyrolysis combustion and concluded a complete transformation pathway of S and N functional groups. In addition, for municipal solid waste, the evaluation of gaseous sulfur and nitrogen related to combustion and pyrolysis process can also be found in some researches (Da Silva Filho et al, 2019; Tang et al, 2012). However, the exposed literatures concerning the release behavior of these pollutants exactly during CMSW gasification process are relatively scarce. The investigation on S/N release behavior is essential as it is a precondition step for case optimization and operation parameter selection of subsequent purification process (Luo et al, 2021).
Another scientific issue we attempt to address is the distribution characteristics of sulfur and nitrogen in the complete “gas–liquid–solid” three-phase products during gasification process. It is well known that a series of complex physical and chemical changes are involved in the gasification process, and the products are normally constituted by solid, gas, and liquid. The solid product is called char that mostly contains carbonaceous matters and the liquid product, usually named tar, is composed of macromolecules that are difficult to be decomposed during gasification process. However, at present, the distribution characteristics of sulfur and nitrogen are partially studied either in gaseous products or in undesired tar.
de Almeida et al (2020) investigated the main inorganic contaminants derived from S and N in the simulated waste-derived syngas to establish a reliable quantification method. Chan et al (2020) applied gas chromatography–mass spectrometer (GC-MS) technique to analytically assess the generated tar from municipal solid waste gasification under different operating conditions. Nevertheless, the specific distribution of sulfur and nitrogen pollutants in the tar is not given. Tursunov et al (2020) coupled GC-MS method with nuclear magnetic resonance analysis to characterize tar composition along with molecular structures. However, to the best our knowledge, the transformation pathway of S and N elements from the CMSW feedstock into complete three-phase products is unclear yet and the distribution characteristics of those pollutants still needs to be discovered to adjust gasification conditions for further purification.
Herein, this work collected multiple typical components of CMSW and mixed them as the raw materials for experiments. The release behavior along with the formation routes of S and N pollutants during gasification process were subsequently investigated in detail. For adequate understanding on the distribution characteristics of S and N pollutants, several analytical technologies were used such as Nessler's reagent colorimetric method, GC-MS, and scanning electron microscope (SEM) with energy dispersive spectroscopy (EDS) mapping. By combining these results, a more complete picture of the gasification process leading to the release and immigration of nitrogen and sulfur pollutants was able to be depicted.
Materials and Methods
CMSW feedstock and chemical reagents
The CMSW feedstock is typically composed of paper, rubber, food waste, wood, plastic, and textile. In this work, each component was represented by a common object that can be easily collected from the university campus. The newspaper (25%), rubber gloves (6%), rice (16%), sawdust (6%), polystyrene (PS) granule (35%), and cotton fabrics (12%) were thus selected as the experimental materials, among which the above composition is obtained by analyzing the components of CMSW sample collected in the campus. Before formal experiments, the newspaper, rubber gloves, and cotton fabrics were cut into small pieces, whereas the rice and PS granules were mechanically crushed into powders (given in Supplementary Fig. S1). Each component representative was then dried at 50°C overnight and stored for further tests.
The isopropanol (AR), sulfuric acid (H2SO4), and ammonium sulfate (AR) were purchased from Sinopharm Chemical Reagent Co., Ltd. and the Nessler's reagent (NaOH + HgI2 + KI) was acquired from Tianjin Kemiou Chemical Reagent Co., Ltd. Besides, the deionized water was produced by ultrapure water machine in the lab. The CO2 and N2 were provided by Nanjing Shangyuan Industrial Gas Co., Ltd.
Gasification experimental setup and procedure
The gasification experimental setup is given in Fig. 1. The horizontal fixed-bed reactor was wrapped by a two-fold furnace with a controllable temperature up to 1000°C. In this work, the gasification agent was CO2 or H2O. The CO2 stream was connected with the reactor inlet, whose flow rate was regulated by a mass flowmeter. For gasification cases using H2O, the water stream was introduced by an electric syringe pump. To ensure the successful horizon flow of generated steam, the N2 stream was used for assistance. Besides, a thermocouple was inserted from the reactor inlet and placed above the CMSW feedstock to measure the temperature. The CMSW feedstock was put into a ceramic container. At the reactor outlet, the product gas was first condensed and then collected by a gas bag. The pipe between the reactor outlet and the condenser was insulated by a heating tape at 200°C to prevent tar accumulation. The condensed tar was collected in a flask for further analysis.
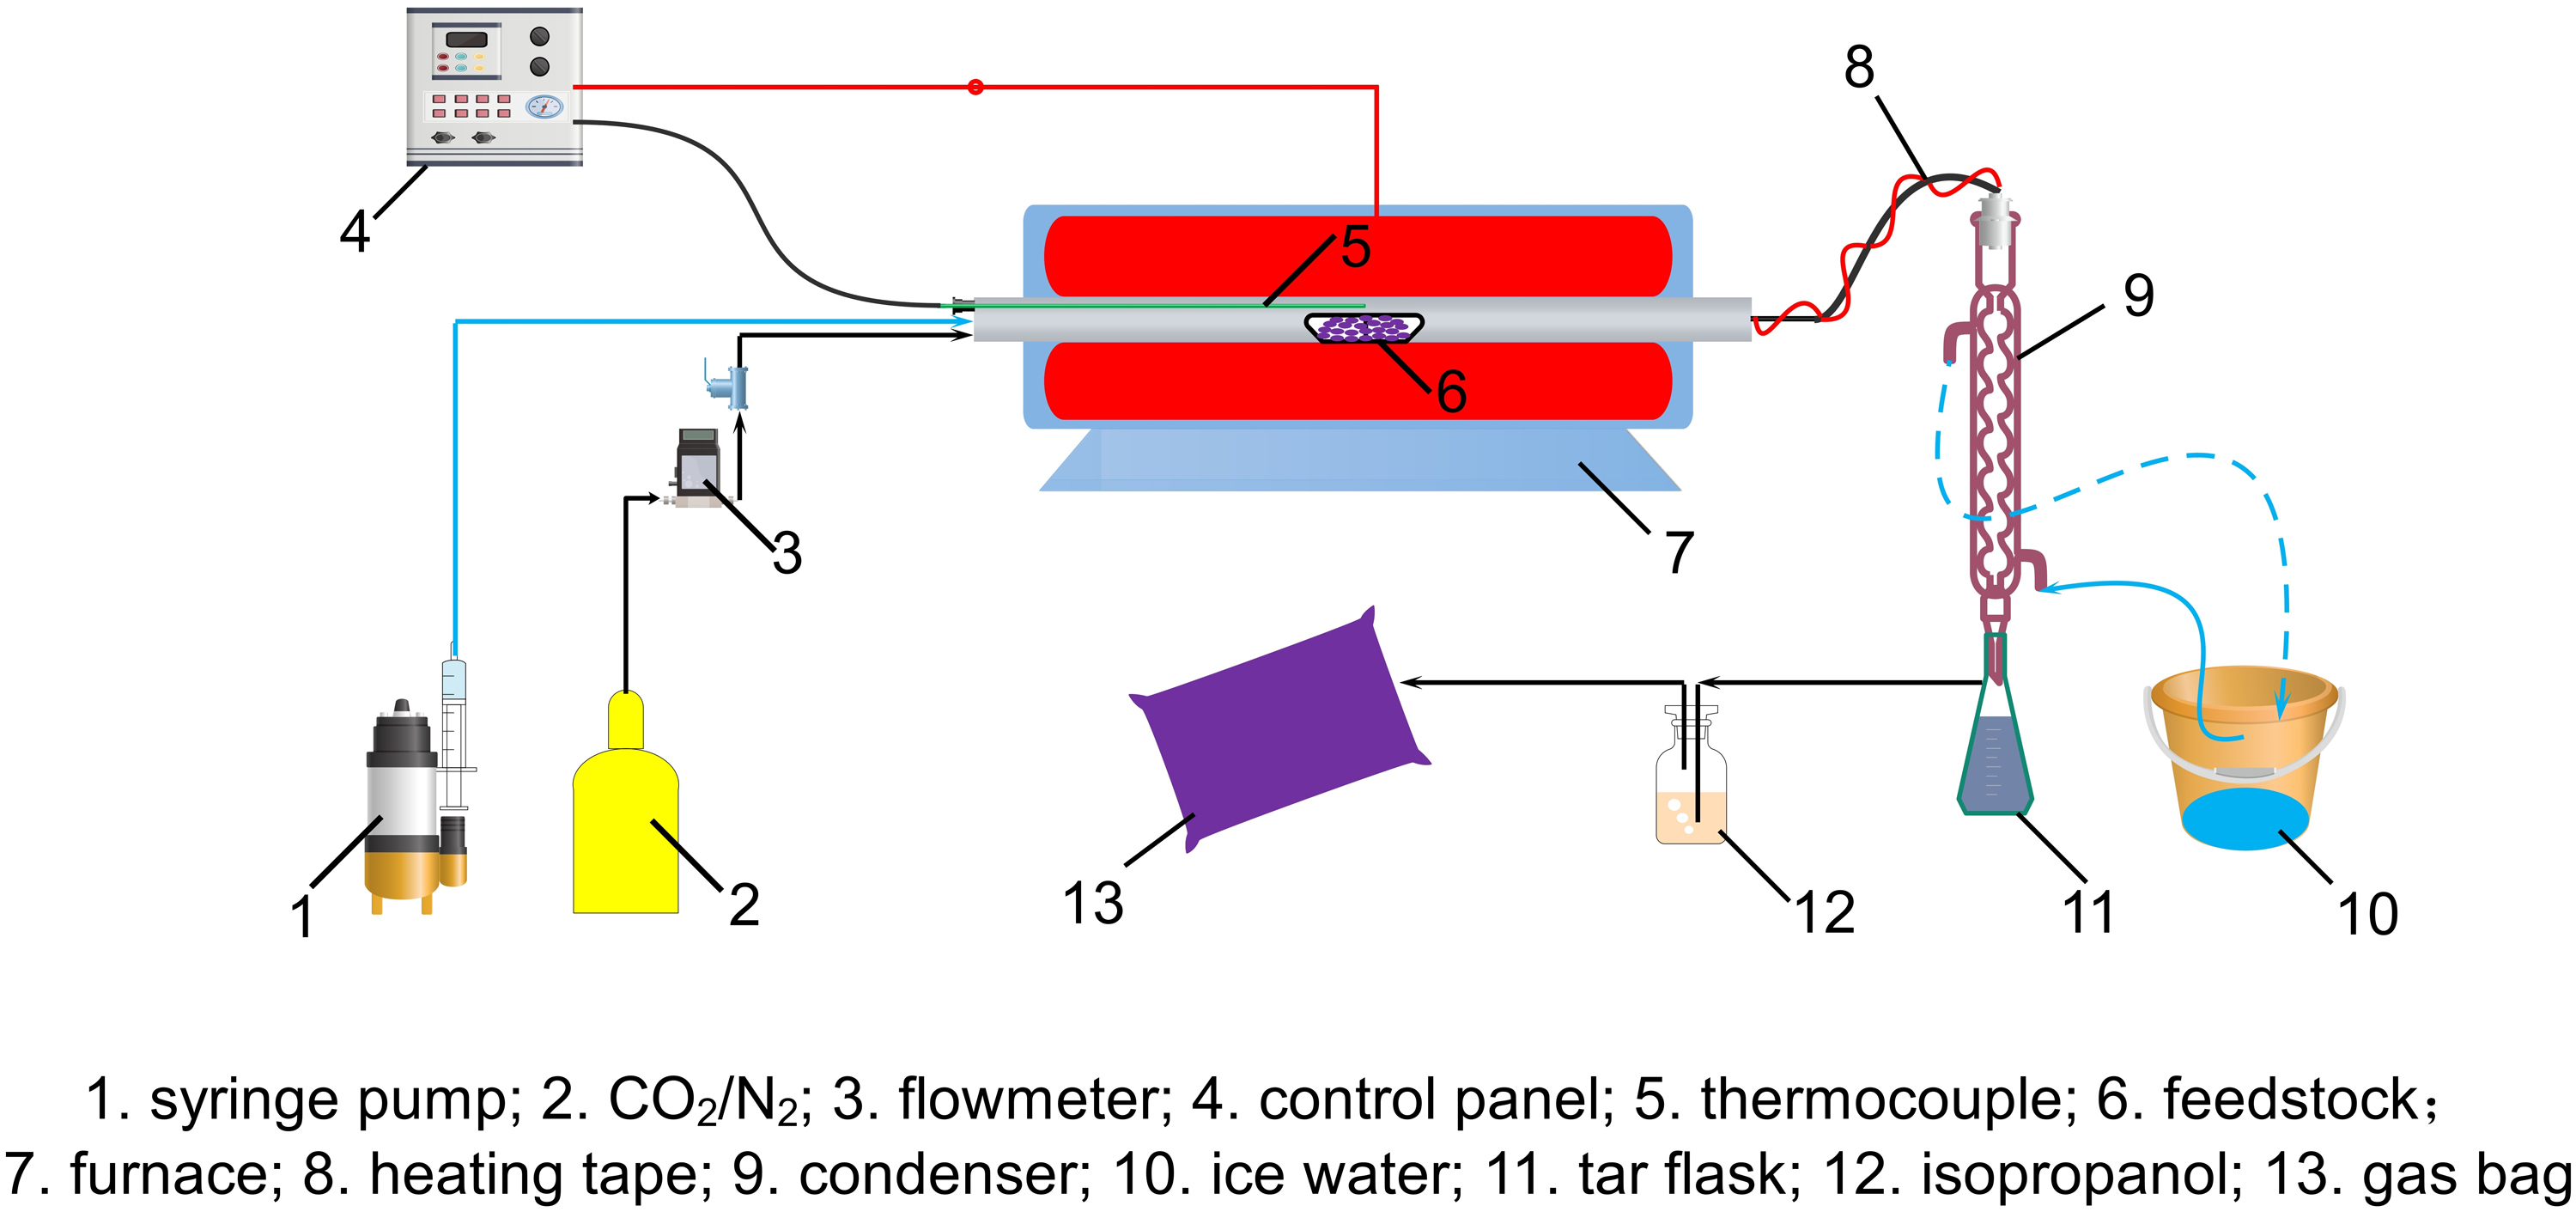
Schematic diagram of the gasification experimental setup.
Before the gasification tests, the tubular reactor without placing CMSW feedstock is first heated to desired temperature at a heating rate of 10°C/min under N2 flow. Then the feed gas was switched to gasification agent (CO2 or steam: 0.1 L/min) and 5.0 g CMSW feedstock composing of 25% paper, 6% rubber, 16% food waste, 6% wood, 35% plastic, and 12% textile was quickly introduced into the middle of the reactor tube. The reactor outlet was subsequently sealed and the gas bag was connected. The total gasification time was controlled for 10 min. In the gasification case for S detection, the product gas after condensing was first washed by isopropanol before entering into gas bag, whereas in the gasification case for N detection, the product gas after condensing first passed through 100 mL of 0.1 mol/L H2SO4 solution to absorb NH3 pollutants. Finally after gasification, the reactor was cooled to room temperature and the remained char was collected.
Three-phase product analysis and characterizations
The components of CMSW feedstock were all first characterized by proximate and ultimate analysis to acquire their basic physicochemical information (Sun et al, 2020). The proximate analysis was carried out according to the Chinese Standard GB/T 212-2008 for the determination of ash, moisture, volatile matter, and fixed carbon content, among which the fixed carbon content was calculated by mass balance (Chen et al, 2020). The ultimate analysis for C, H, O, N, and S element content was conducted using an element analyzer (Elementar UNICUBE).
To quantify the organic and inorganic nitrogen/sulfur proportion in the total nitrogen/sulfur element, the Kjeldahl technique (Ozbay and Durmusoglu, 2013) and leaching-precipitation approach (Chinese Standard NY/T 1121.18-2006) was applied first to determine the content of organic nitrogen and inorganic sulfur in CMSW, respectively. Then the content of inorganic nitrogen and organic sulfur is calculated through difference method, which can be referred to Equations (1) and (2). The YiN and YoN are the proportion of inorganic and organic nitrogen in the total nitrogen element, respectively. The CoN (mg/gCMSW) is the organic nitrogen content of CMSW measured by Kjeldahl method. The Ci,tN (mg/gi) is the total nitrogen content for component i from ultimate analysis and Xi is the mass percentage of component i in CMSW. Similarly, the parameters in Equation (2) have same meaning as above where the containing subscript S represents sulfur.

After gasification, the three-phase products were analyzed separately. For solid char, the remaining sulfur and nitrogen content was determined by the same element analyzer. For product gas, the H2S and SO2 content was analyzed by an automatic flue gas tester (Qingdao LaoYing 3012H) and the NO x content was directly obtained through another flue gas tester (MRU VARIO Plus Industrial). The NH3 content was quantified by an indirect approach called Nessler's reagent colorimetric method, which the gaseous NH3 was first absorbed by H2SO4 solution and then quantified by spectrophotometric determination.
The detailed principle for NH3 quantification was described in Supplementary Material. For collected tar, a rotary evaporator was first used to remove its contained moisture. The water bath was maintained at 60°C and the whole evaporation time was set as 0.5 h. Subsequently, 0.1 g condensed tar was dissolved in 10 mL isopropanol and further diluted 50 times for GC-MS analysis. Then the Agilent GC-MS facility (7890B-5977B) equipped with a 30 m × 0.25 mm × 1.4 μm RTX-VMS column was used to detect its composition. The ionization energy was set at 70 eV and the scanning range of mass charge ratio was 40–550 m/z (Liu et al, 2022a).
Results and Discussion
Feedstock characteristics
Table 1 presents the overall proximate and ultimate analysis results of each component in CMSW. It can be clearly seen that the rubber and plastic components have less moisture than the other four components, which may be related to their weak adsorption ability toward moisture. On the contrary, rubber and plastic components have relatively higher volatile content (91.62% and 99.77%) that is caused by their intrinsic chemical property of high C and H elemental percentage, as indicated by the ultimate analysis. Besides, it can be observed that the fixed carbon content of paper, food waste, wood, and textile is higher than rubber and plastic, which may constitute the main body of the remaining char after gasification.
Proximate and Ultimate Analysis Results of Components in Combustible Municipal Solid Waste
Calculated by mass balance.
The ultimate analysis for each component is also different. The H percentage differs to a small extent, mainly in the range of 6.0–9.0%, whereas the C and O contents present a different scenario. Especially for O content, the rubber and plastic components only have 5.98% and 1.54%, which seems quite little compared with the other components (>40%). This is because the rubber and plastic components used in this work are represented by nitrile glove and PS that naturally have less oxygen element. Finally, for nitrogen and sulfur elements, it is shown in Table 1 that rubber has the largest nitrogen and sulfur content, whereas plastic has the least among all the components.
As introduced in Gasification Experimental Setup and Procedure section, the CMSW feedstock consists of 25% paper, 6% rubber, 16% food waste, 6% wood, 35% plastic, and 12% textile. According to the ultimate analysis results in Table 1, the total nitrogen and sulfur content can be thus calculated as 7.161 mg/gCMSW and 1.178 mg/gCMSW, respectively. The organic nitrogen content measured by Kjeldahl method is 4.420 mg/gCMSW, which means that its proportion in total nitrogen content is 61.7%. In addition, the inorganic sulfur content detected by leaching-precipitation method is 0.578 mg/gCMSW, accounting for 49.1% of total sulfur content in CMSW. The above results show that the nitrogen and sulfur element in CMSW are more in organic form than in inorganic status (Zhou et al, 2018).
Gasification under CO2 atmosphere
The release behavior and distribution results of sulfur and nitrogen using CO2 as gasification agent under 600–800°C are given in Fig. 2. First for solid char product, as given in Fig. 2a, the obtained char amount decreases with gasification temperature, from 0.49 g at 600°C to 0.30 g at 800°C. This can be explained by higher temperature facilitates the release of volatile matter. In addition, the remaining nitrogen and sulfur element weight in char present a similar pattern, which also declines with gasification temperature. This indicates more nitrogen and sulfur will exist in other two-phase products (gas and tar) under higher temperature. It can also be noted that the reduction extent of nitrogen and sulfur amount in char from 700°C to 800°C is lower than 600°C to 700°C, implying partial nitrogen and sulfur element have strong bonding effect in char that cannot be vaporized by pure thermal treatment (Qi et al, 2021).
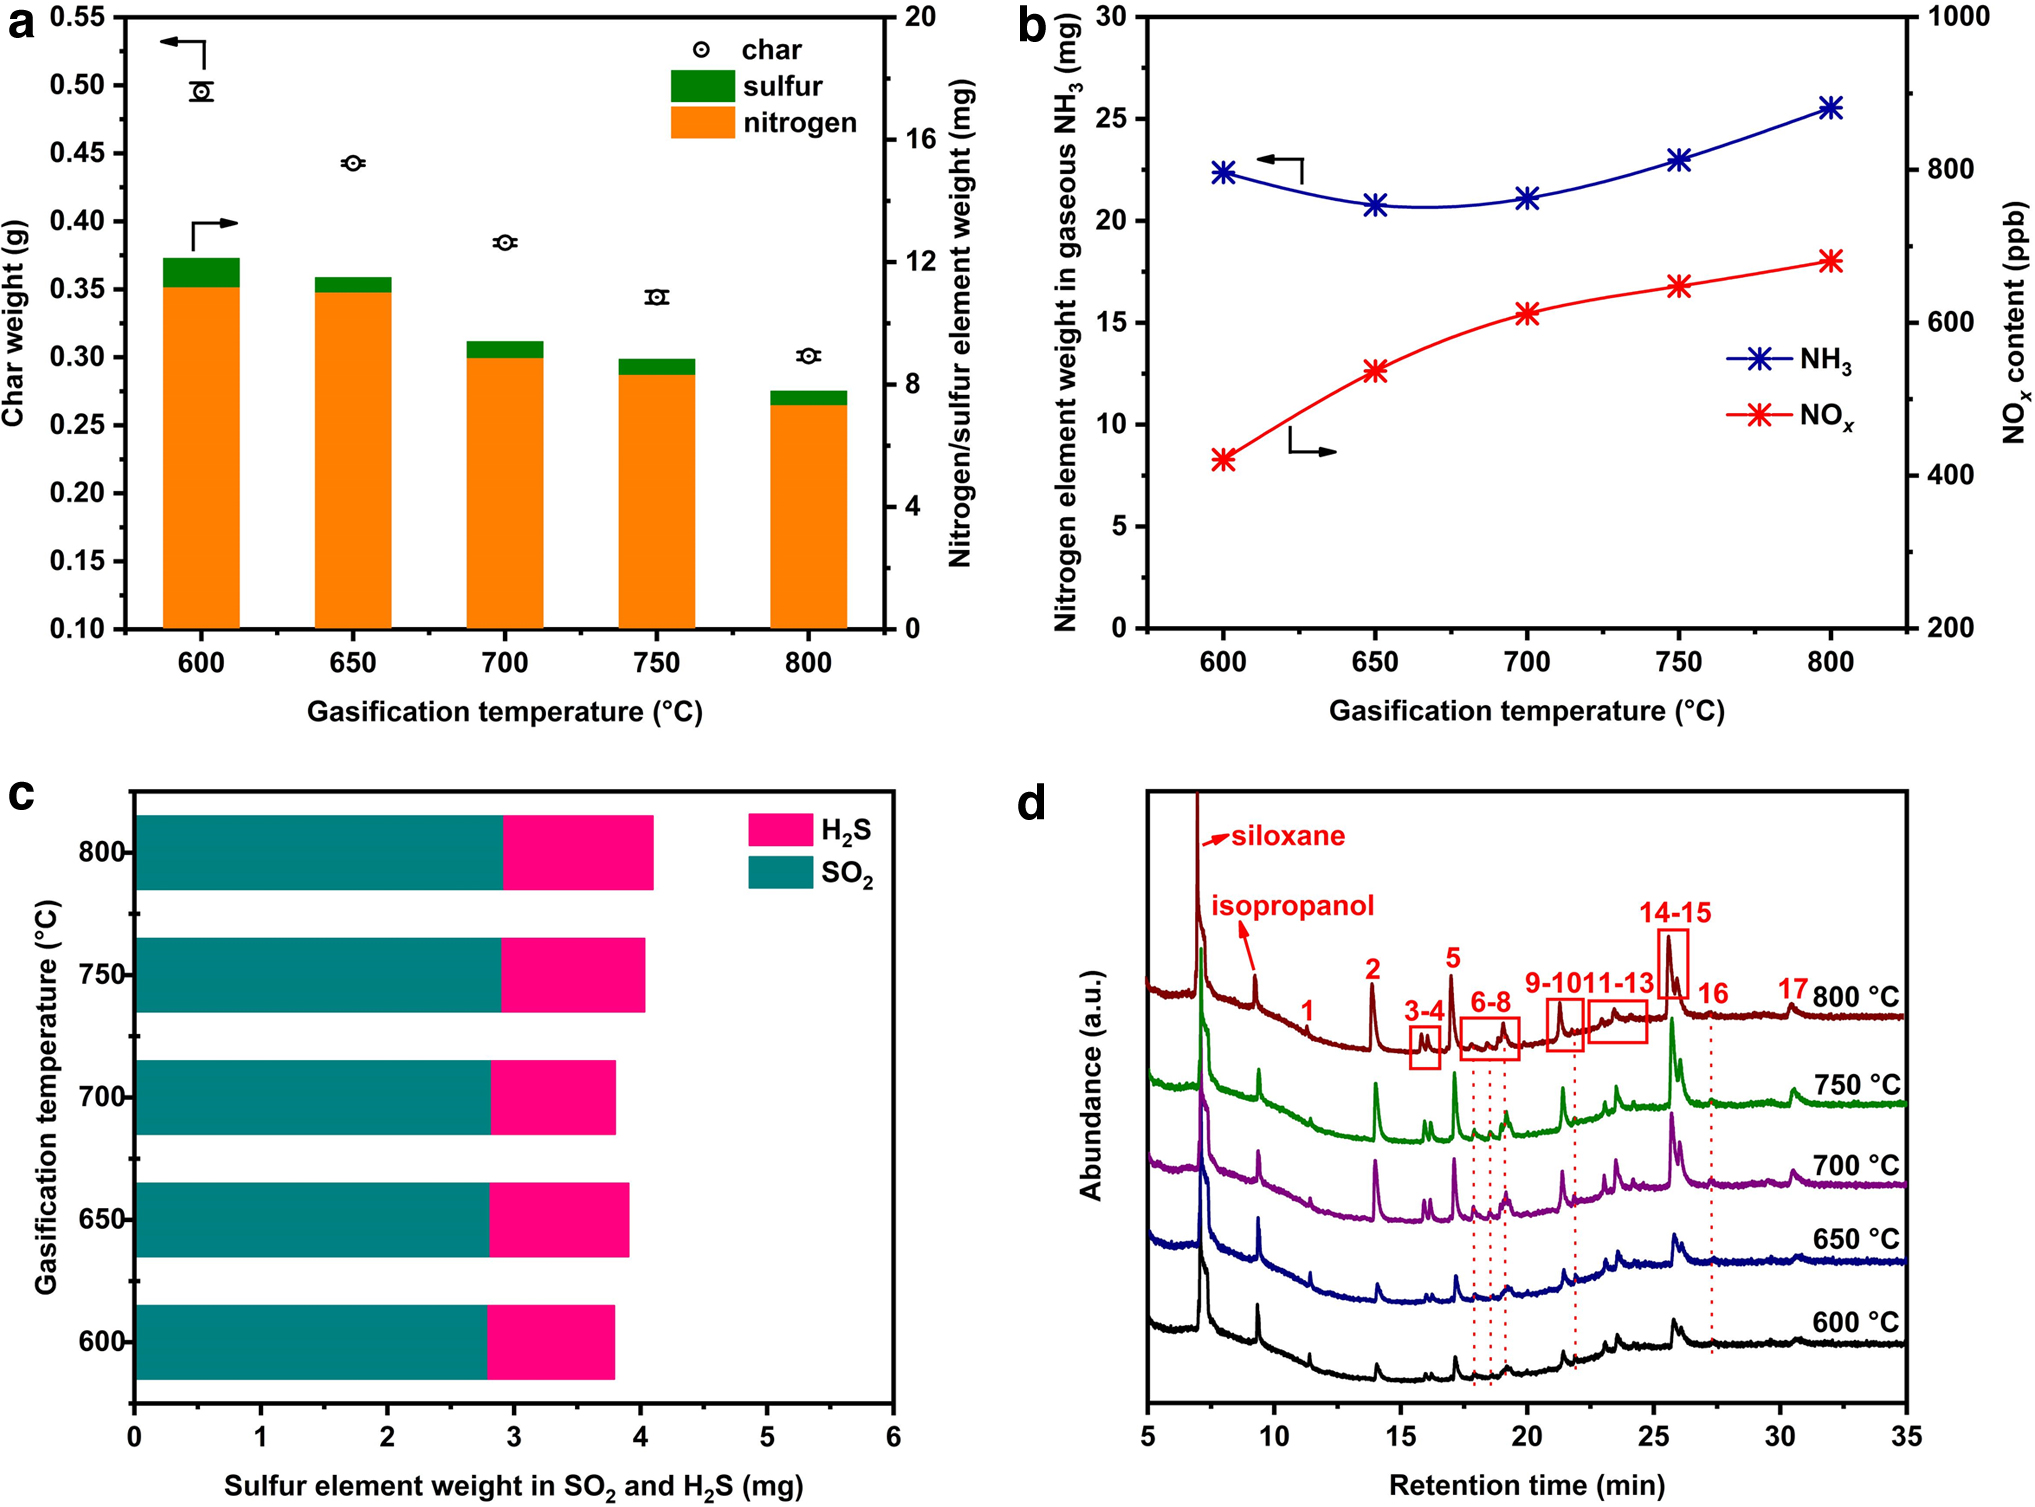
Sulfur and nitrogen release and distribution in three-phase products <600–800°C using CO2 as gasification agent:
For nitrogen element in gas product, as given in Fig. 2b, the nitrogen-containing compounds include NH3 and NO x . The NO x content in product gas is trace and only in part per billion (ppb) scale. This is different from combustion treatment of CMSW, where usually have considerate amount of NO x emission (Vamvuka et al, 2020). The largest NO x content locates at 800°C, possessing ∼700 ppb. As to the NH3 pollutant, its nitrogen element weight is first decreased from 600°C to 650°C slightly and then rises continuously from 650°C to 800°C. The relatively low NH3 content at 650°C and 700°C may be caused by its transformation into other gaseous nitrogen-containing compounds. Combining the results in Fig. 2a and b, the total nitrogen element weight in char and NH3/NO x is smaller than the original nitrogen content in CMSW feedstock (35.805 mg), which means that the other nitrogen-containing compounds such as HCN (Lu et al, 2016) are possible.
The sulfur emission of CMSW gasification under CO2 atmosphere is given in Fig. 2c. As can be seen, the main gaseous sulfur-containing components include SO2 and H2S, among which the SO2 content increases slightly in the whole gasification temperature range, whereas the H2S shows a different pattern. It seems that H2S content does not present a uniform rule but generally has larger value under high temperature. Besides, it can be observed that the total sulfur weight in SO2 and H2S rises with temperature, indicating that increasing temperature is beneficial for the release of sulfur element. For tar composition detection, the GC-MS spectra are given in Fig. 2d. It can be seen that the five GC-MS spectra under various temperatures resemble each other, suggesting the compositions of tar are similar. The only difference is the peak intensity that signifies the relative abundance of one certain compound. This demonstrates that changing gasification temperature is not helpful to alter the intrinsic component characteristic of the produced tar. The first two peaks in the 5–10 min of retention time are ascribed to the siloxane and isopropanol that derives from column loss (Luo et al, 2022) and tar solvent, respectively. The subsequent tar components labelled No. 1–17 are detected and compiled in Table 2. As shown, most of the tar components are hydrocarbon compounds and several nitrogen-containing matters (Nos. 6, 7, 10, 13, and 16) exist as well. This indicates partial nitrogen element is released and transformed into liquid products during gasification process. However, the sulfur element cannot be observed in the tar composition, possibly owing to the relatively large difficulty of S atom bond formation in the organic matters.
Tar Components Identified by Gas Chromatography–Mass Spectrometer
M.W., molecular weight.
Gasification under H2O atmosphere
The release behavior and distribution results of sulfur and nitrogen using H2O as gasification agent under 600–800°C are given in Fig. 3. The char information in Fig. 3a shows that increasing temperature promotes the gasification process as indicated by the decreased char weight. Compared with Fig. 2a, it can be observed that the obtained char weight using H2O as gasification agent is smaller than CO2 under the same temperature. This is owing to the lower activation energy of H2O molecule that can cause larger reactivity toward char (Scala, 2015). Besides, the sulfur element weight in char under all temperatures is larger than that in Fig. 2a, implying that H2O atmosphere inhibits the release of sulfur element.
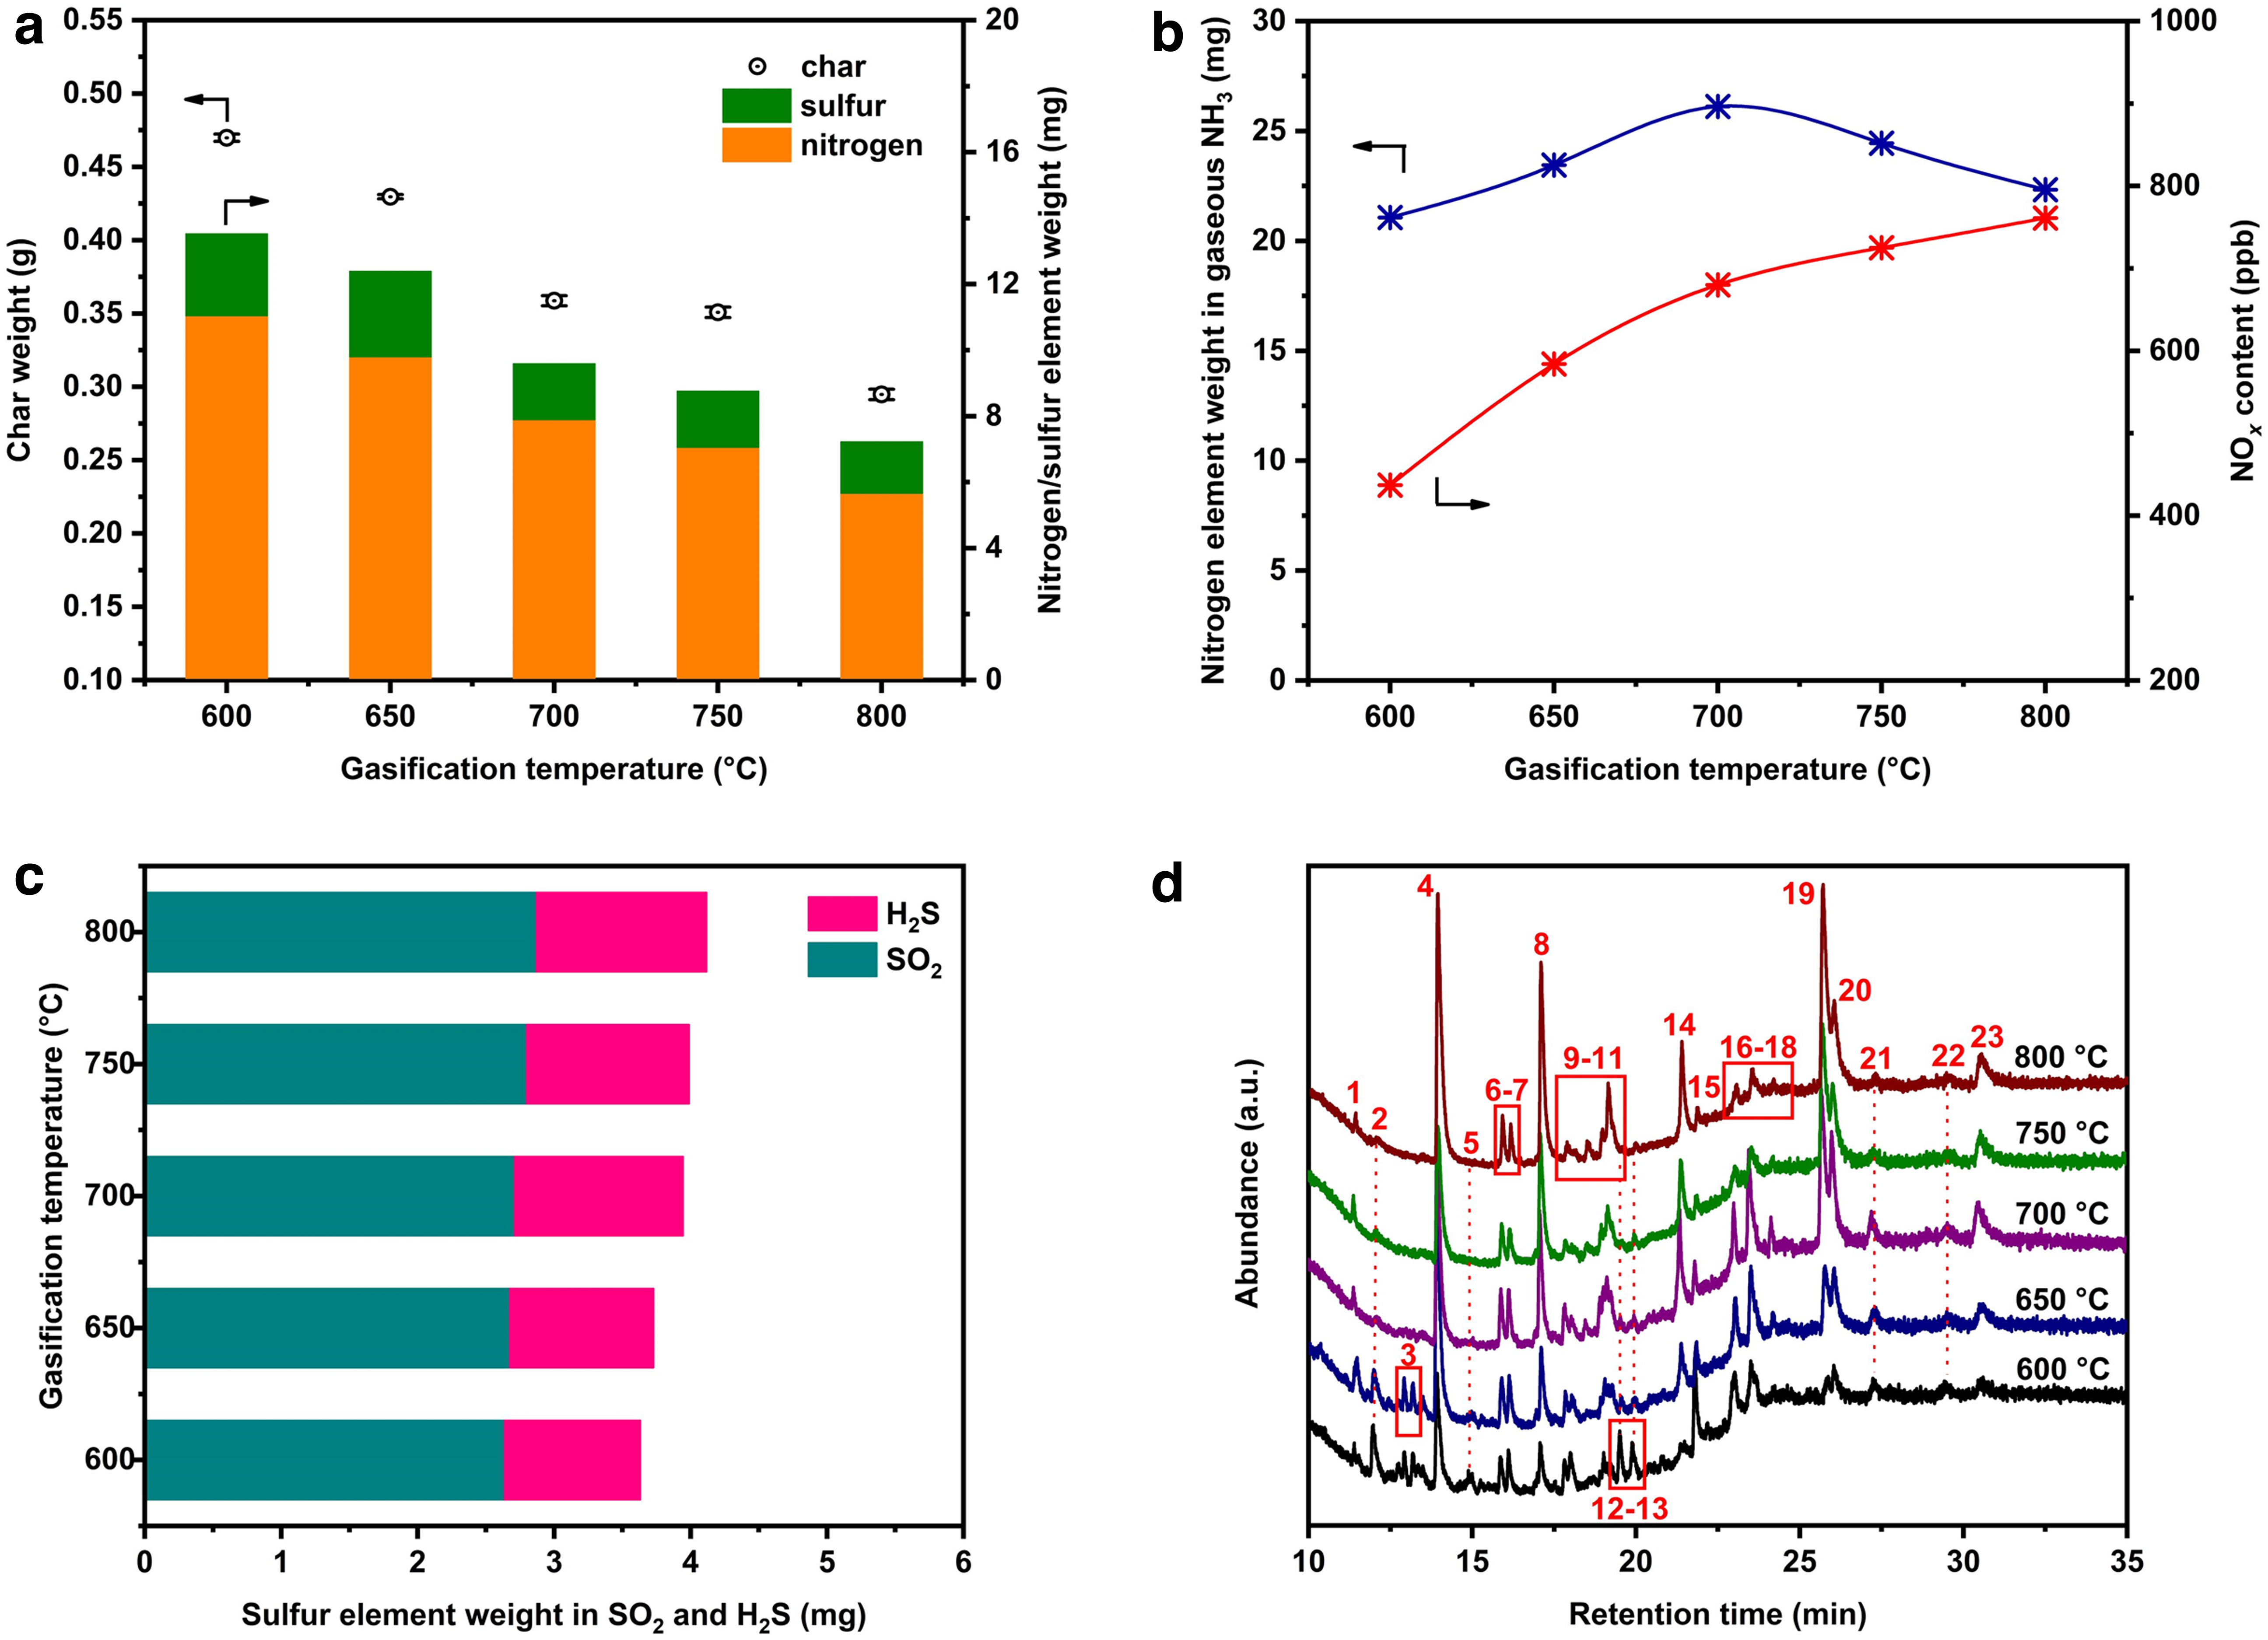
Sulfur and nitrogen release and distribution in three-phase products <600–800°C using H2O as gasification agent:
However, the scenario of nitrogen element is opposite. As can be seen, the nitrogen element weight in char is lower than that in Fig. 2a, especially at high temperature, which can be explained by the fact that H2O atmosphere accelerates the char-N conversion than CO2 atmosphere (Tu et al, 2015). The nitrogen release behavior in gaseous product is given in Fig. 3b. It can be noted that the NH3 emission presents a reverse pattern in comparison with Fig. 2b, where the nitrogen content in NH3 first rises from 600°C to 700°C and then declines until 800°C. The decrease in NH3 emission when ramping temperature >700°C may be caused by the conversion of NH3 molecule into other nitrogen-containing molecules such as HCN. In addition, the NO x content in product gas using H2O as gasification agent is still in ppb level but is slightly larger than CO2 atmosphere, which is owing to enhanced char-N oxidization under H2O atmosphere (Lei et al, 2018).
The sulfur emission of CMSW gasification under H2O atmosphere is given in Fig. 3c. Similarly, the total sulfur element weight in H2S and SO2 is increased with temperature. The SO2 content is smaller than that in Fig. 2c under same temperature, demonstrating the inhibition effect of H2O atmosphere on SO2 formation compared with CO2 atmosphere. Combining the results in Fig. 3a and c, the total sulfur element weight in char and SO2/H2S is smaller than the original sulfur content in CMSW feedstock (5.890 mg), indicating the possible existence of other sulfur-containing components. Given the analysis results of tar composition in Supplementary Table S4, the detectable components of tar include no S-containing molecules, which suggests that the immigration of sulfur element during gasification mostly occurs from feedstock to solid char and gas product. The differentials between the original sulfur element weight in CMSW and obtained sulfur element weight in char and SO2/H2S may be attributed to low-level S-containing organic matters like COS. As pointed out by Morrin et al (2014), the COS content produced from gasification of municipal solid waste is relatively small compared with notable SO2 emission, and its level can increase quite quickly and proportionately with an increase in feed-sulfur concentration. Finally, the GC-MS spectra of obtained tar under various temperatures using H2O as gasification agent is given in Fig. 3d. The change in gasification temperature cannot greatly alter tar compositions, but compared with Fig. 2d under CO2 atmosphere, there are distinct difference between them, particularly in the low retention time range. This shows that the gasification agent plays a vital role in the tar. Supplementary Table S4 shows that several new compounds with small molecular weight emerged under H2O atmosphere including phenol and isopropyl alcohol.
Postgasification characterization and S/N distribution
The pictures of obtained char after gasification are given in Supplementary Fig. S3. To probe the microstructures of the char, the SEM analysis was conducted and the distributions of carbon, sulfur, and nitrogen element in char were further investigated by EDS mapping. As given in Fig. 4, the microstructure of the char under CO2 and H2O atmosphere appears different. For CO2 atmosphere case, the obtained char is more compact with obvious aggregation of particles. This may be caused by the chemical adsorption of CO2 by the contained inorganic matters, which converts gaseous CO2 molecule into solid carbonates (Mei et al, 2020) that appears in particle form. However, for H2O atmosphere case, the char looks sparser with distinct pores and carbon in a morphology of whiskers. The ample pore channels in the char can induce a satisfactory specific surface area (Supplementary Fig. S4), which is potential to be activated carbon material for versatile applications such as adsorption and catalyst support. In addition, the element distribution of C, N, and S in the char can be observed through EDS mapping. The three elements are all distributed uniformly in the char for both CO2 and H2O atmosphere cases, of which the carbon element plays a dominant role (much denser than N and S) in the whole weight. The EDS spectra in Fig. 4c and d prove the above conclusion and further show that the nitrogen in char for H2O atmosphere case is less than CO2 atmosphere, whereas the sulfur situation is reverse, which is in accordance with the results in Figs. 2a and 3a.
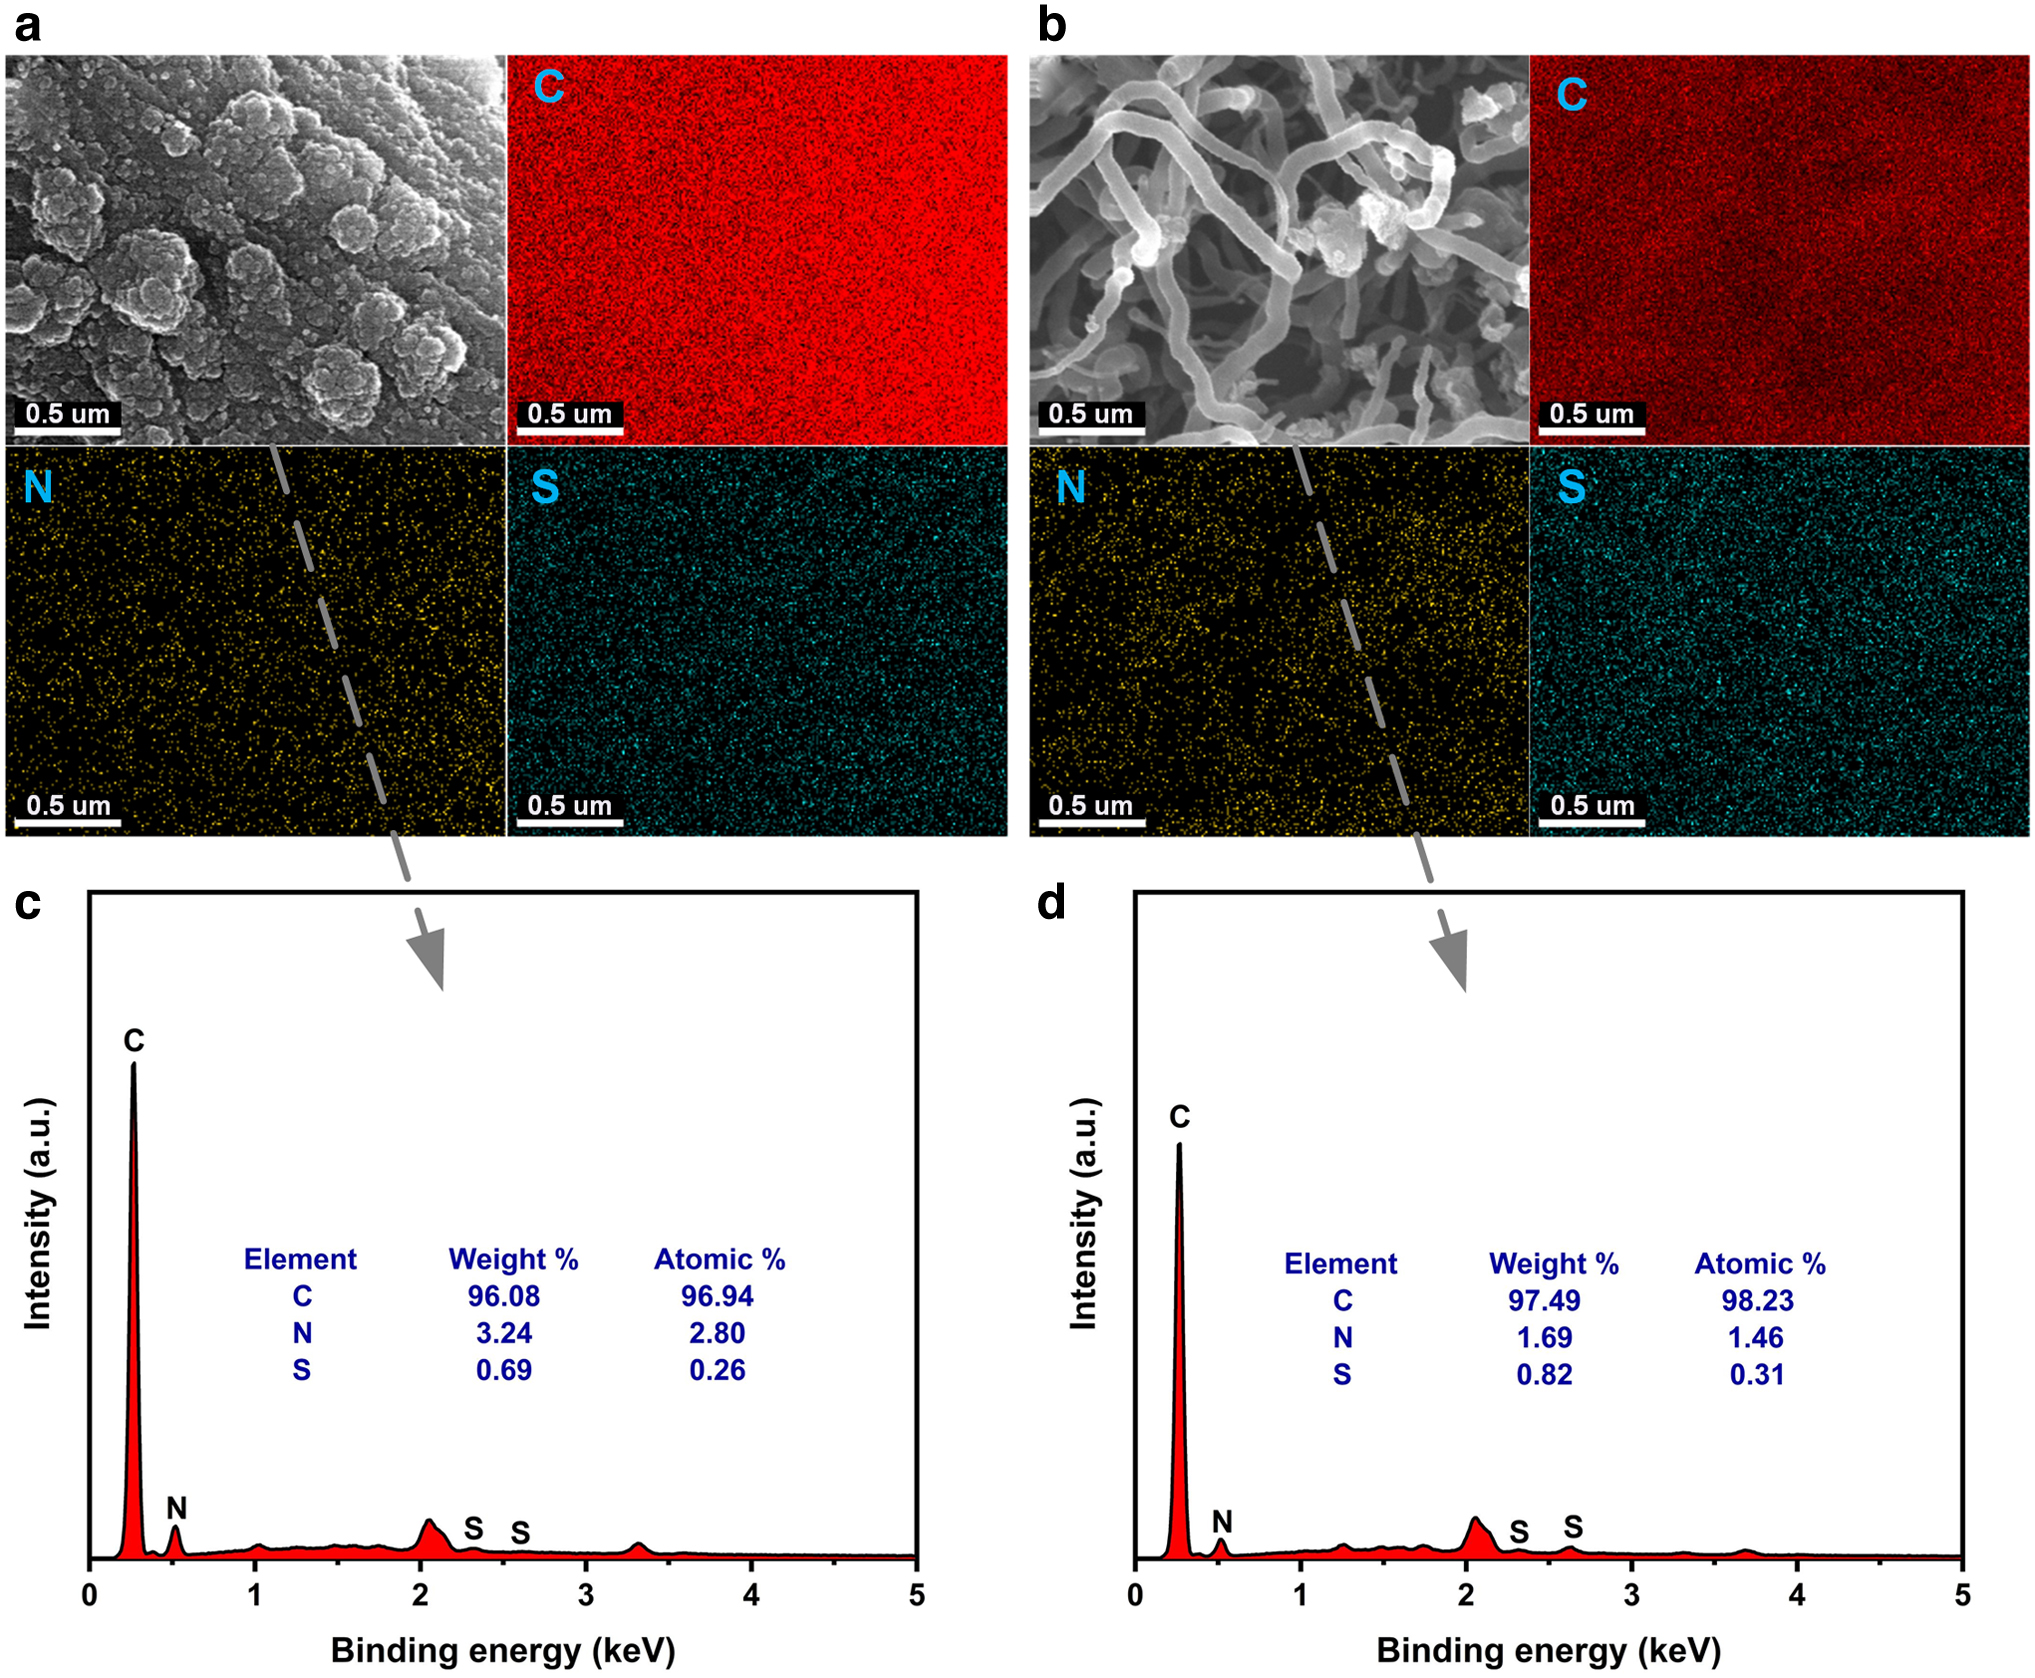
SEM images and corresponding C/N/S element distribution of obtained char after 800°C gasification:
The complete sulfur and nitrogen element immigration from CMSW feedstock to gasification products is given in Fig. 5 (a calculation example can be found in Supplementary Material). As the influential factor of gasification can be varied depending on the CMSW composition, gasification temperature, and agent, in the Sankey diagram we only depicted the scenarios of one gasification temperature (800°C) under CO2 and H2O atmosphere as an example owing to their relatively sufficient release of nitrogen and sulfur. It can be seen that from components to mixed CMSW feedstock, paper and rubber are the major sources of sulfur element, accounting for 34.0% and 39.7% of total sulfur in CMSW, respectively. The two main sources of nitrogen element in CMSW are rubber and food waste, which occupy >80% of the total nitrogen. Besides, it can be noted that even the plastic component has a heavy proportion (35%) in CMSW, its contribution to sulfur and nitrogen in CMSW is limited, owing to its lowest sulfur and nitrogen content among the six components (Table 1). The nitrogen and sulfur content in CMSW are fixed as long as the composition of CMSW is determined.
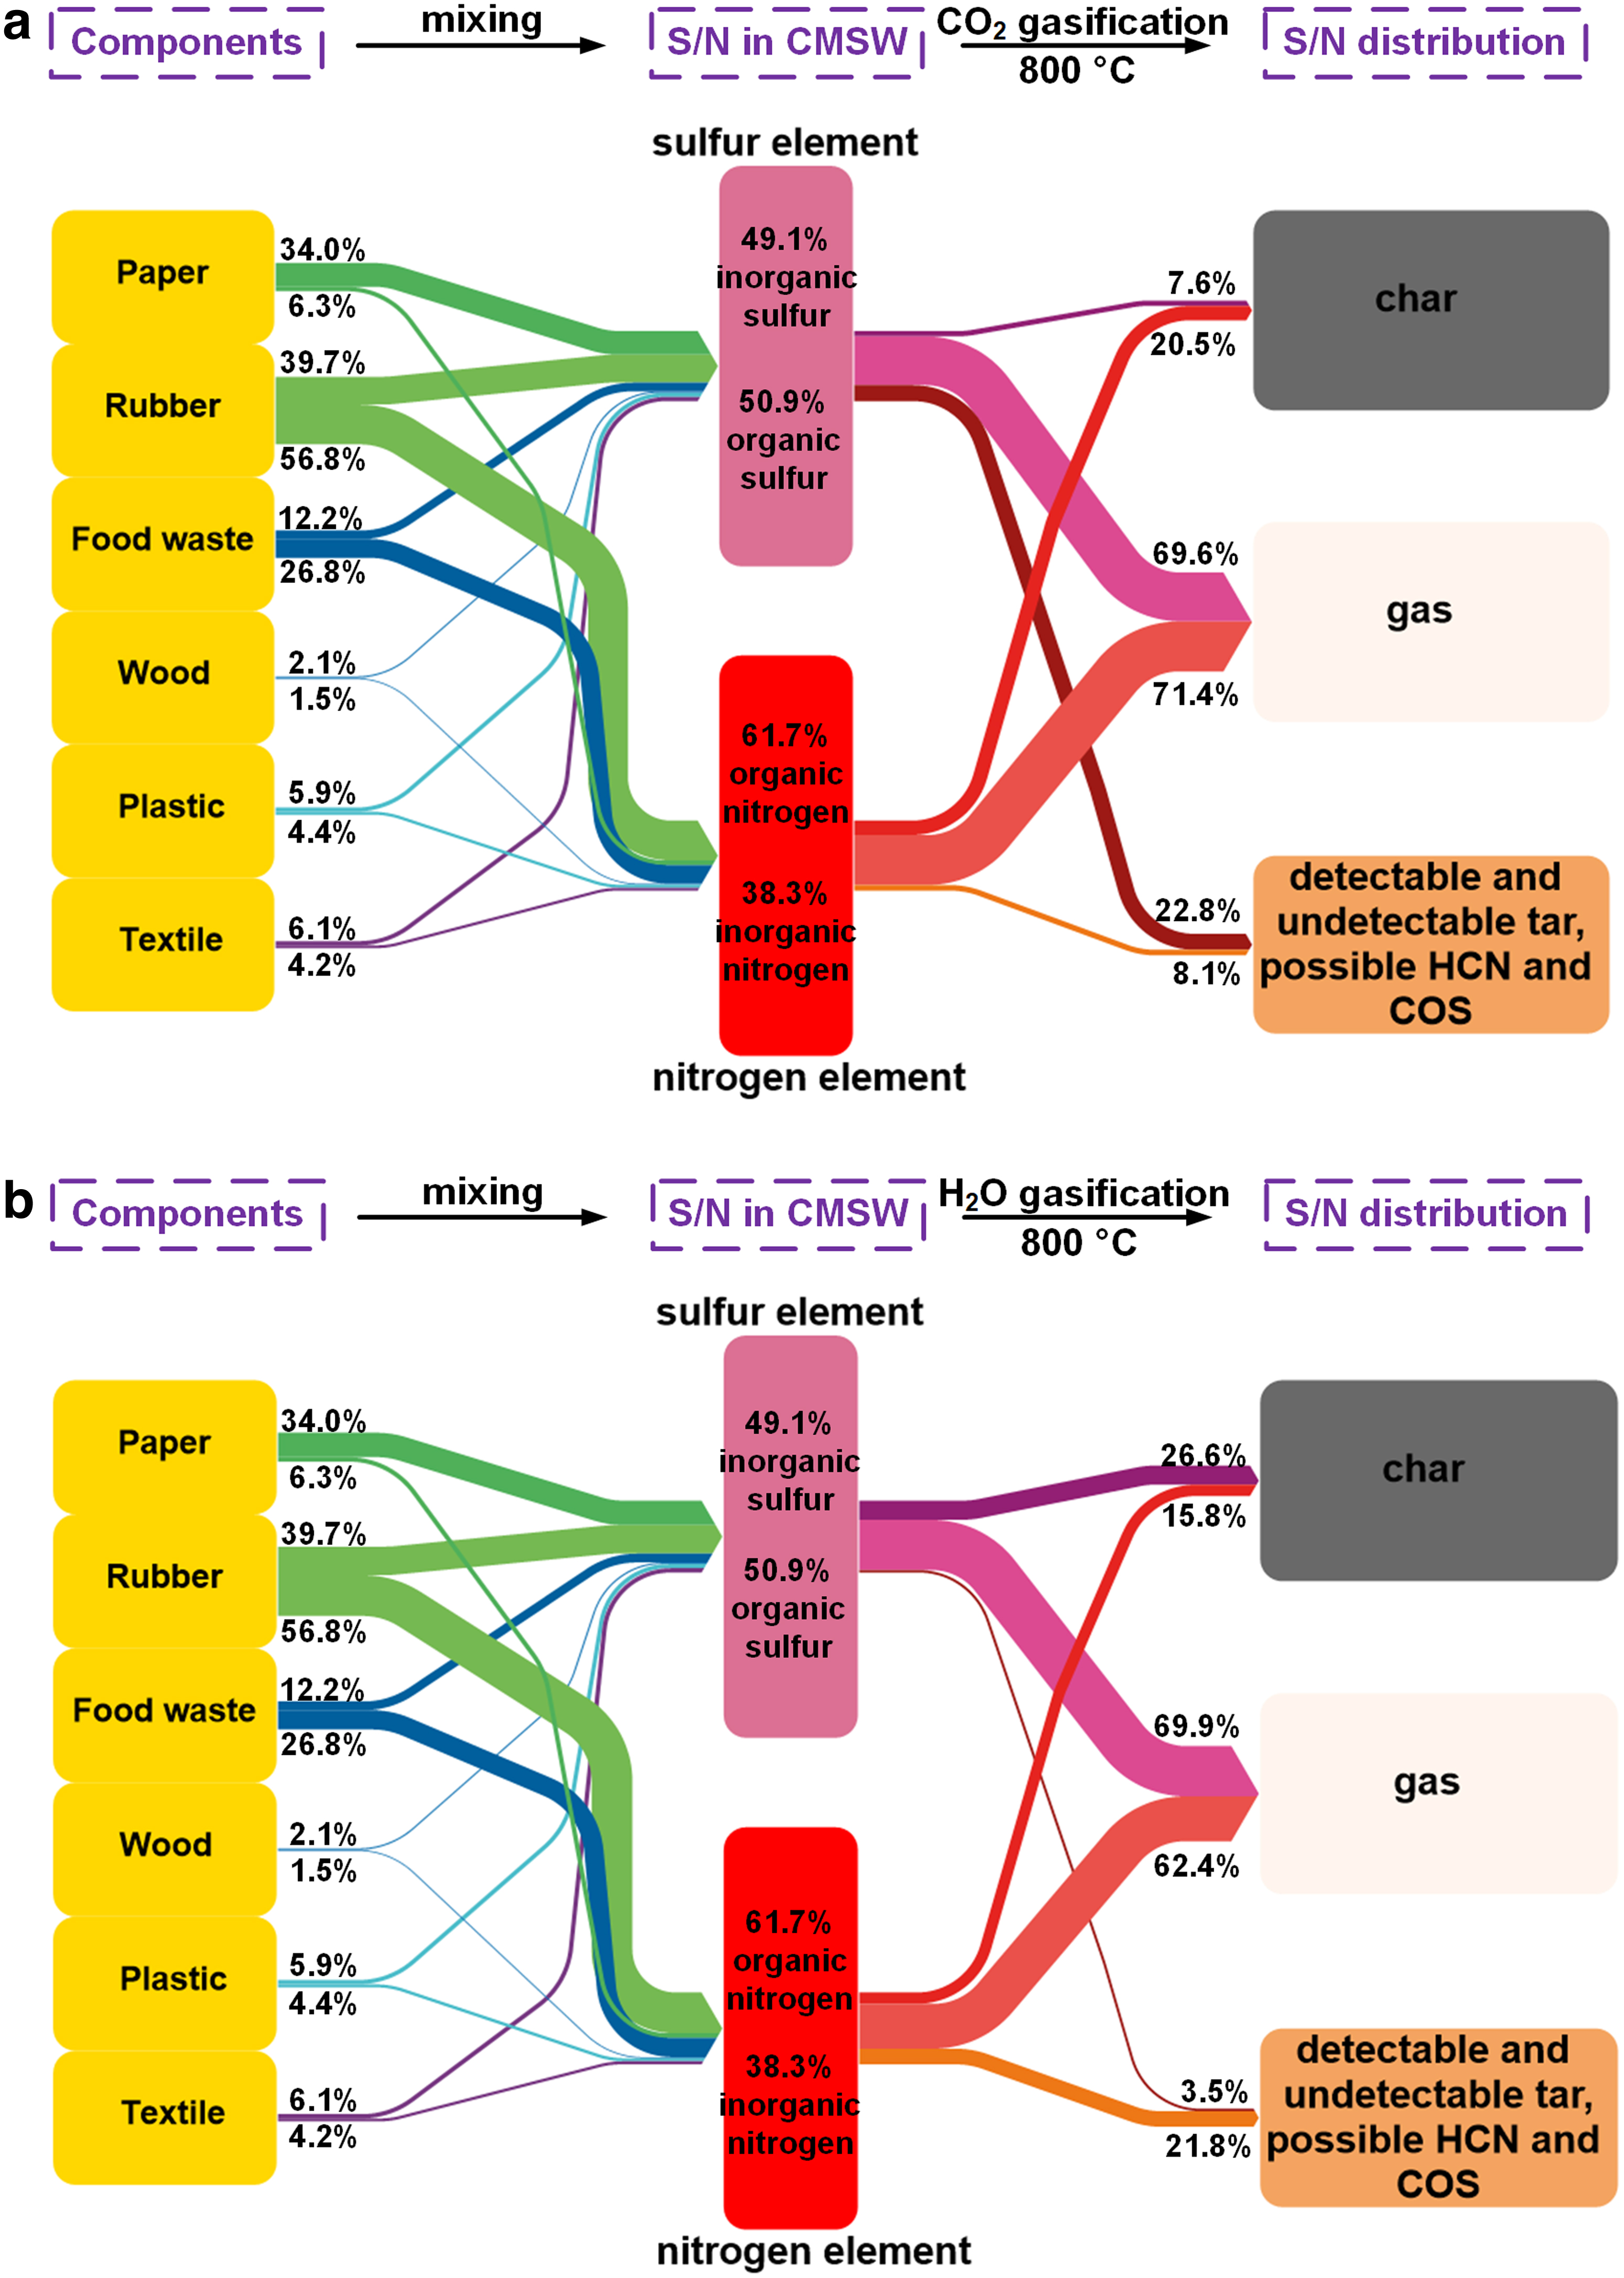
Sankey diagram of sulfur and nitrogen element immigration from initial components to final gasification three-phase products:
However, their distribution in gasification three-phase products differs. The S/N mass in tar is calculated by subtracting the S/N mass in char and gas product from the total S/N mass in feedstock. Both Fig. 5a and b distinctly show a large portion (60–70%) of nitrogen and sulfur immigrated from CMSW to gas product, no matter under CO2 or H2O atmosphere, which is understandable that the S/N element can be easily released and forms common SO2, H2S, NH3, and possible HCN/COS gaseous molecules.
Nevertheless, their distribution in char and tar is reverse. It can be observed that under CO2 atmosphere, less sulfur element and more nitrogen element will remain in char than tar and possibly HCN/COS, whereas for H2O gasification, more sulfur element and less nitrogen element flee to char. This obviously demonstrates the effect of gasification agent on the distribution. The reason for the opposite situation can be explained by the two following aspects: (1) H2O gasification agent usually can rebuild char structure, which further activates the nitrogen in char and promotes the formation of amine groups in tar as hydrogen donor; (2) CO2 gasification agent is inclined to be reduced by the carbon element in char under high temperature (CO2 + C → CO), which increases the contact chance of produced CO radicals with sulfur in char to form secondary COS.
Conclusion
In this study, gasification of CMSW collected from university campus was carried out in a fixed-bed reactor under CO2 and H2O atmosphere at temperatures between 600°C and 800°C. The proportions of organic nitrogen and inorganic sulfur in the CMSW feedstock were first determined and the release behavior of nitrogen and sulfur element during gasification was then investigated. At last the immigration and distribution characteristics of nitrogen and sulfur from feedstock to gas–liquid–solid three-phase products was sketched in Sankey diagram, using 800°C gasification case as example. The following major observations were made:
The overall released nitrogen and sulfur from CMSW feedstock generally increases with gasification temperature both under CO2 and H2O atmosphere, evidenced by the declined nitrogen and sulfur element weight in obtained char. The NO
x
content in product gas for both CO2 and H2O gasification cases is only in ppb scale, which is negligible compared with NH3 content. The sulfur element in product gas mainly exists as H2S and SO2, whose total content increases with gasification temperature as well. The detectable tar consisted of multiple components, the majority of which are large hydrocarbon compounds. Several nitrogen-containing compounds can be detected in the tar, whereas no sulfur-containing molecules can be discovered. The composition of tar is less influenced by gasification temperature than gasification agent. Nitrogen and sulfur balance calculation between the feedstock and products implies that partial nitrogen and sulfur element possibly exist in gas product as HCN and COS, and also in tar product that is beyond detectable range. The Sankey diagram of 800°C gasification example shows that the majority of sulfur and nitrogen in the CMSW is transferred to gas, whereas more sulfur element and less nitrogen element immigrate into char for H2O gasification case than CO2 gasification case.
Footnotes
Authors' Contributions
Conceptualization, X.D., Y.H., and B.J.; experiment and methodology, X.D., Y.L., and X.D; statistical analysis, X.D., Y.L., and X.D; writing—original draft preparation, X.D; writing—review and editing, Y.H., and B.J; funding acquisition, X.T., Y.H., and B.J.
Author Disclosure Statement
No competing financial interests exist.
Funding Information
This work was supported by the National Key R&D Program of China (Grant No. 2019YFC1906803).
References
Supplementary Material
Please find the following supplemental material available below.
For Open Access articles published under a Creative Commons License, all supplemental material carries the same license as the article it is associated with.
For non-Open Access articles published, all supplemental material carries a non-exclusive license, and permission requests for re-use of supplemental material or any part of supplemental material shall be sent directly to the copyright owner as specified in the copyright notice associated with the article.