
Abstract
Watersheds with relatively higher concentrations of disinfection by-product (DBP) precursors are of concern for public water systems (PWSs) seeking to control DBP exposure risk. In this study, the occurrence of bromide and total organic carbon (TOC), which are important DBP precursors, was evaluated in PWS source waters on a watershed basis at the hydrologic unit code 2 (HUC2) level. Variations were examined across source water type (e.g., surface water or groundwater) and watershed, and temporally based on seasonality as well as differences between the late 1990s and the years 2018–2020. The median bromide concentrations were higher in groundwater systems compared with surface water (by 25 μg/L), whereas the median TOC concentrations were higher in surface water systems compared with groundwater (by 1.7 mg/L). Surface water sources in multiple midwestern and western watersheds had a combination of elevated bromide and TOC (relative to median values of 21 μg/L and 2.5 mg/L, respectively), which was especially pronounced in the Texas-Gulf and Rio Grande watersheds. None of the HUC2 watersheds had elevated levels of both bromide and TOC in groundwater sources (median values of 50 μg/L and 1.0 mg/L, respectively). Source water bromide median watershed concentrations for very large systems were ∼20% lower in 2018–2020 than in 1998, however, more than 40% higher at the 90th percentile, whereas source water TOC median watershed concentrations for very large systems were ∼25% higher in 2018–2020 than in 1998 but less than 10% higher at the 90th percentile. These temporal differences may be related to the influence of climate change and other anthropogenic effects. In addition, many individual PWSs showed substantial change in bromide and TOC concentrations between those time periods. For example, about 7% of the PWSs had at least double the bromide concentrations, and 5% at least double the TOC concentrations, in 2018–2020 than in 1998.
Background
Disinfection by-products (DBPs) are different from many of the other chemical contaminants found in drinking water in that they are formed as an unintended consequence of the process of treating water to inactivate microbial pathogens. In public water systems (PWSs) where chemical disinfectants are added to source water, reactions between the disinfectants and dissolved precursors lead to the formation of many DBPs, including the regulated trihalomethanes (THMs) and haloacetic acids (HAAs) (Richardson et al, 2002). There are a broad range of DBP precursors, including aromatic organic compounds (e.g., natural humic matter) and inorganics such as bromide (Krasner et al, 2022; Summers et al, 2020; Tafvizi and Husain, 2022). Source water bromide is oxidized by chlorine and chloramine to form brominated oxidants, which subsequently can react with natural organic matter to produce brominated DBPs (Hua and Reckhow, 2012).
Brominated DBPs are reported to have greater toxic potency than their chlorinated analogues (DeMarini, 2020; Richardson et al, 2007; Wagner and Plewa, 2017), and research about control of brominated and other DBPs is ongoing (Kidd et al, 2018; Tafvizi and Husain, 2022; Wang et al, 2022). Organic DBP precursors are often monitored using total organic carbon (TOC) as an indicator (Assmann et al, 2017; Summers et al, 2020). Under U.S. Environmental Protection Agency (USEPA) regulations (40 CFR 141.135, “Treatment technique for control of disinfection byproduct precursors”), all conventional surface water treatment plants (i.e., those using coagulation, flocculation, sedimentation, and filtration) must measure and control TOC in their source water (USEPA, 2020a). DBP concentrations, including THMs and HAAs, generally increase with increasing concentrations of bromide and/or TOC (Chowdhury et al, 2009; Westerhoff et al, 2004).
Bromide and TOC concentrations in source waters are affected by natural and anthropogenic processes, including those associated with climate change. For example, concentrations of organic carbon were found to increase with higher levels of precipitation and runoff (Correll et al, 2001; Volk et al, 2002). A 19% increase in groundwater TOC in urban areas was attributed to the combined impacts of climate change and urbanization (McDonough et al, 2020). Mattsson et al (2015) examined seasonal influences on TOC in 30 Finnish rivers and found that TOC was highest during fall and lowest during winter. Anthropogenic processes (e.g., coal-fired power plants equipped with wet flue gas desulfurization systems, fossil fuel extraction) are associated with increased bromide levels and increased brominated DBP formation at downstream drinking water treatment plants (Cadwallader and VanBriesen, 2019; Cornwell et al, 2018; Good and Van Briesen, 2016).
Good and Van Briesen (2019) identified specific regions in the United States, which are most likely to see effects of power plant bromide discharges on populations served by surface water; these regions were the Ohio, South Atlantic Gulf, and Missouri regions. An occurrence survey of bromide and iodide in water supplies for 228 U.S. PWSs found elevated bromide concentrations in the Texas-Gulf, southeast, and southwest regions (Sharma et al, 2023). Other anthropogenic sources such as de facto wastewater reuse may also be relevant to a consideration of spatial variations in DBP precursors (Furst et al, 2019; Rice and Westerhoff, 2015; Rice et al, 2015; Weisman et al, 2021).
Identifying regions of the United States with relatively high bromide and TOC concentrations in source waters is an important consideration for public health researchers and regulatory officials concerned with DBP risk assessment (Bergman et al, 2016; Cantor et al, 2010; Freeman et al, 2017; Regli et al, 2015). The last major monitoring effort for bromide and TOC in the United States was the USEPAs Information Collection Rule (ICR), which required monitoring in 1997–1998 from all PWSs serving more than 100,000 people (296 systems at that time).
During those years, source water concentrations for ∼8,000 monitoring samples varied for bromide (median = 36 μg/L, 90th percentile = 160 μg/L, number of results = 7,959) and TOC (median = 2.4 mg/L, 90th percentile = 5.3 mg/L, number of results = 7,504) (McGuire et al, 2002). The relevance of these data for current bromide and TOC levels across the full range of U.S. water systems is unknown. Bromide concentrations in particular are expected to have increased in many U.S. source waters due to the aforementioned reasons. Consequently, more recent information about source water bromide and TOC concentrations from PWSs of all sizes is helpful in considering excessive DBP exposure risk.
The present study examines the occurrence of bromide and TOC in source waters for U.S. community water systems (CWSs) (i.e., PWSs that supply water to the same population year-round) and nontransient non-CWSs (i.e., PWSs that regularly supply water to at least 25 of the same people at least 6 months per year) between 2018 and 2020. First, we evaluated bromide and TOC levels across source water type (e.g., surface water or groundwater), watershed, water system population size, and season.
Second, we identified watersheds with elevated concentrations of both bromide and TOC, as PWS in these watersheds could have the highest brominated DBP formation potential. Finally, we evaluated the extent to which source water bromide and TOC levels differed between the 1997–1998 ICR and the 2018–2020 Unregulated Contaminant Monitoring Rule (UCMR4) recently completed by USEPA. The findings of this study are important for understanding the national extent of DBP precursors as well as variations in DBP precursors among watersheds and in those two time periods for those parts of the United States that may have elevated risk to drinking water consumers.
Methods
Data set
The concentrations of bromide and TOC were assessed at the intake locations for ∼3,400 PWSs in the United States and categorized based on source water type, watershed at the hydrologic unit code 2 (HUC2) level, water system size, and seasonality. The primary source for bromide and TOC data for this study was the USEPAs UCMR4 (USEPA, 2016). UCMR4 sampling was conducted at PWSs throughout the United States (all 50 states, Puerto Rico, Guam, Northern Mariana Islands, and Tribal nations) subject to USEPA's drinking water regulations for DBP monitoring, that is, CWSs and nontransient non-CWSs that add a chemical disinfectant.
Under UCMR4, PWSs were classified as surface water systems if they draw source water from a surface source such as a river or lake, a groundwater source under the direct influence of surface water (GWUDI), or a mix of surface and groundwater (MX). For a given surface water system, sampling was required to take place for four consecutive quarters over the course of 12 months (i.e., a total of four sampling events that occurred 3 months apart).
For example, a surface water system may have conducted sampling for bromide and TOC in March, June, September, and December. For a given groundwater system, sampling was required two times over the course of 12 months (i.e., a total of two sampling events that occurred 5 to 7 months apart). All U.S. PWSs serving more than 10,000 people (referred to as large systems) and a nationally representative subset of PWSs serving less than or equal to 10,000 people (referred to as small systems) were sampled during UCMR4. Samples for bromide and TOC were collected at source water influent locations that represented untreated water entering the water treatment plant (PWSs with multiple treatment plants collected source water samples at each plant influent; each was considered as a separate record). PWSs that purchased 100% of their water were not required to collect source water samples for bromide or TOC.
The monitoring period for UCMR4 was calendar years 2018–2020; sampling for each system was required to be completed within that 3-year period. This study uses the final DBP precursor data set for UCMR4, which was made available as of February 2022 (USEPA, 2022), and includes more than 49,000 records from all 50 states and other primacy agencies (e.g., tribal nations). Bromide and TOC records for a total of ∼2,900 large and 500 small PWSs were included in the study (data are reported by PWS identification number or PWSID).
All samples were assigned to a monitoring quarter to represent seasonality (Quarter 1: January–March; Quarter 2: April–June; Quarter 3: July–September; Quarter 4: October–December); these correspond to winter, spring, summer, and fall, respectively. Three PWSs that were understood to be treating seawater were removed from this study (bromide levels in seawater are significantly higher than those in fresh water). Individual PWSs with source water bromide and TOC data were matched to their watershed (at the HUC2 level) as identified in the Drinking Water Mapping Application to Protect Source Waters (DWMAPS), an online mapping tool (USEPA, 2020b). DWMAPS provides the identity of PWSs with sources of drinking water within a given watershed.
The UCMR4 minimum reporting level (MRL) for TOC was 1.0 mg/L (based on the TOC concentration needed to demonstrate reduced monitoring under USEPAs DBP rules) and for bromide was 20 μg/L (a level determined to be reliably measured by participating laboratories). Measured concentrations below the MRLs were replaced with their respective reporting limit. Study findings also were tested with an alternate assumption of replacing results reported as below the MRLs with one half of their respective reporting limit (Supplementary Text S1).
Statistical methods
Statistical modeling was performed using R (R Core Team, 2017). To evaluate whether differences in bromide and TOC concentrations were statistically significant between PWS categories, the nonparametric Kruskal–Wallis test was used to test whether samples originate from the same distribution (i.e., whether or not there is a difference between independent groups), and Dunn's test was used to identify which specific groups significantly differ from the others. Variations in the concentrations of bromide and TOC were separately evaluated based on source water type (e.g., surface water or groundwater) and watershed. The relation of bromide to TOC was evaluated through use of linear and multilevel regression models (MLMs). Such a relation would be helpful to those PWSs seeking to control DBP precursors but are constrained in their availability of source water quality data. For example, a PWS may have source water TOC data from an organization such as the U.S. Geological Survey but not have bromide data.
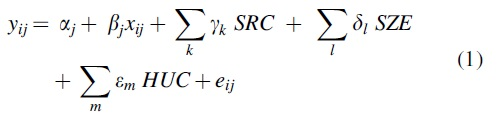
MLMs account for variance between groups (i.e., PWSs), which is not explained by other variables in the model (e.g., source water type [SRC], system size [SZE], and watersheds [HUC]) (Furst et al, 2021). Using pooled models such as classic linear regression that ignore this group-level variance in hierarchically structured data sets such as UCMR4 underestimates the error and can skew results. Thus, an MLM was developed [Eq. (1)] where the dependent variables yij and xij are the bromide and TOC concentrations, respectively, for each paired sample i from PWS j, coefficient
Paired samples consisted of PWS-specific monitoring results for both bromide and TOC in a given monitoring season and year (i.e., summer 2020). Intercept
Evaluation of differences between 1998 and 2018–2020
Potential differences between 1998 (referred to as historic) and 2018–2020 (referred to as recent) in bromide and TOC concentrations for PWS source waters were evaluated for a set of ∼250 very large PWSs (each serving >100,000 people) that were included in both the ICR (McGuire et al, 2002) and UCMR4 data sets (USEPA, 2022) (i.e., common systems, located in 46 states plus Puerto Rico). For the ICR data set, the average concentrations of bromide and TOC were estimated at a system level for calendar year 1998 and assigned to a season.
Average bromide and TOC concentrations were calculated for each common system in 1998 and 2018–2020 and grouped by HUC2 watershed. Watershed average concentrations were estimated for bromide and TOC and compared for the two time periods; additional evaluation was made for those PWSs that showed substantial differences between periods. In addition, systems identified as surface water sources in the ICR data set were evaluated for seasonal variations (approximately two thirds of the common systems had surface water sources).
Results and Discussion
Variations in bromide and TOC concentrations
Source water bromide concentrations in the UCMR4 data set varied (10th to 90th percentiles) from ∼20 to 190 μg/L (median = 37, mean = 112 μg/L) and TOC concentrations varied (10th to 90th percentiles) from ∼1.0 to 3.84 mg/L (median = 1.0, mean = 1.85 mg/L) (median TOC of 1.0 mg/L reflects that a majority of measurements were reported as below the MRL). The concentrations of bromide (Fig. 1A) and TOC (Fig. 1B) varied by source water type, with median bromide concentrations relatively higher in groundwater systems (in large systems by 26 μg/L) and median TOC concentrations relatively higher in surface water systems (in large systems by 1.7 mg/L).

Raw water concentrations relative to source water type—
These results are consistent with those found in previous studies (McGuire et al, 2002). The Kruskal–Wallis test showed that there were significant differences in bromide and TOC concentrations by source water type (p = 2.2 E-16 for both bromide and TOC). For bromide, Dunn's test showed that surface water differed significantly from both groundwater and GWUDI but not MX. For TOC, it showed that surface water differed significantly from all other source water types.
Large PWSs of certain source water types had relatively higher bromide (Fig. 1A) and TOC (Fig. 1B) concentrations than small PWSs of the same source water type. For example, large groundwater systems had 7 μg/L higher median bromide concentrations and large surface water systems had 0.4 mg/L higher median TOC concentrations. The reason for the larger systems having relatively higher DBP precursor concentrations is unclear; however, larger systems are typically located closer to large population centers and areas with increased development where there may be additional anthropogenic inputs to source waters (Brown et al, 2021; McDonough et al, 2020).
Seasonal variations were observed in bromide concentrations (surface water only) and TOC concentrations (surface water and groundwater). Bromide varied by season in surface water (Kruskal–Wallis test, p = 0.0005498) but not for groundwater (Kruskal–Wallis test, p = 0.6924). Surface water bromide in summer was slightly higher from that in either winter or spring (3 μg/L for each). TOC varied by season in both surface water (Kruskal–Wallis test, p = 0.0006503) and groundwater (Kruskal–Wallis test, p = 9.012 E-8). Surface water TOC was lower in winter compared with the other three seasons by 0.4 mg/L (Supplementary Fig. S1).
Groundwater TOC was higher in spring than either summer or fall, and winter was higher than fall; however, the median concentrations were not different by season, because >50% of groundwater TOC samples were below the MRL of 1.0 mg/L (Supplementary Fig. S2). Surface waters tend to exhibit greater variations in water quality across seasons (Ouyang et al, 2006). The reason for seasonal variations for TOC in groundwater sources is unclear but may be related to some groundwater sources having higher withdrawal rates and/or less bioactivity during the spring and winter seasons (van Driezum et al, 2018; Yager and Heywood, 2014).
Comparison of DBP precursors across HUC2 watersheds
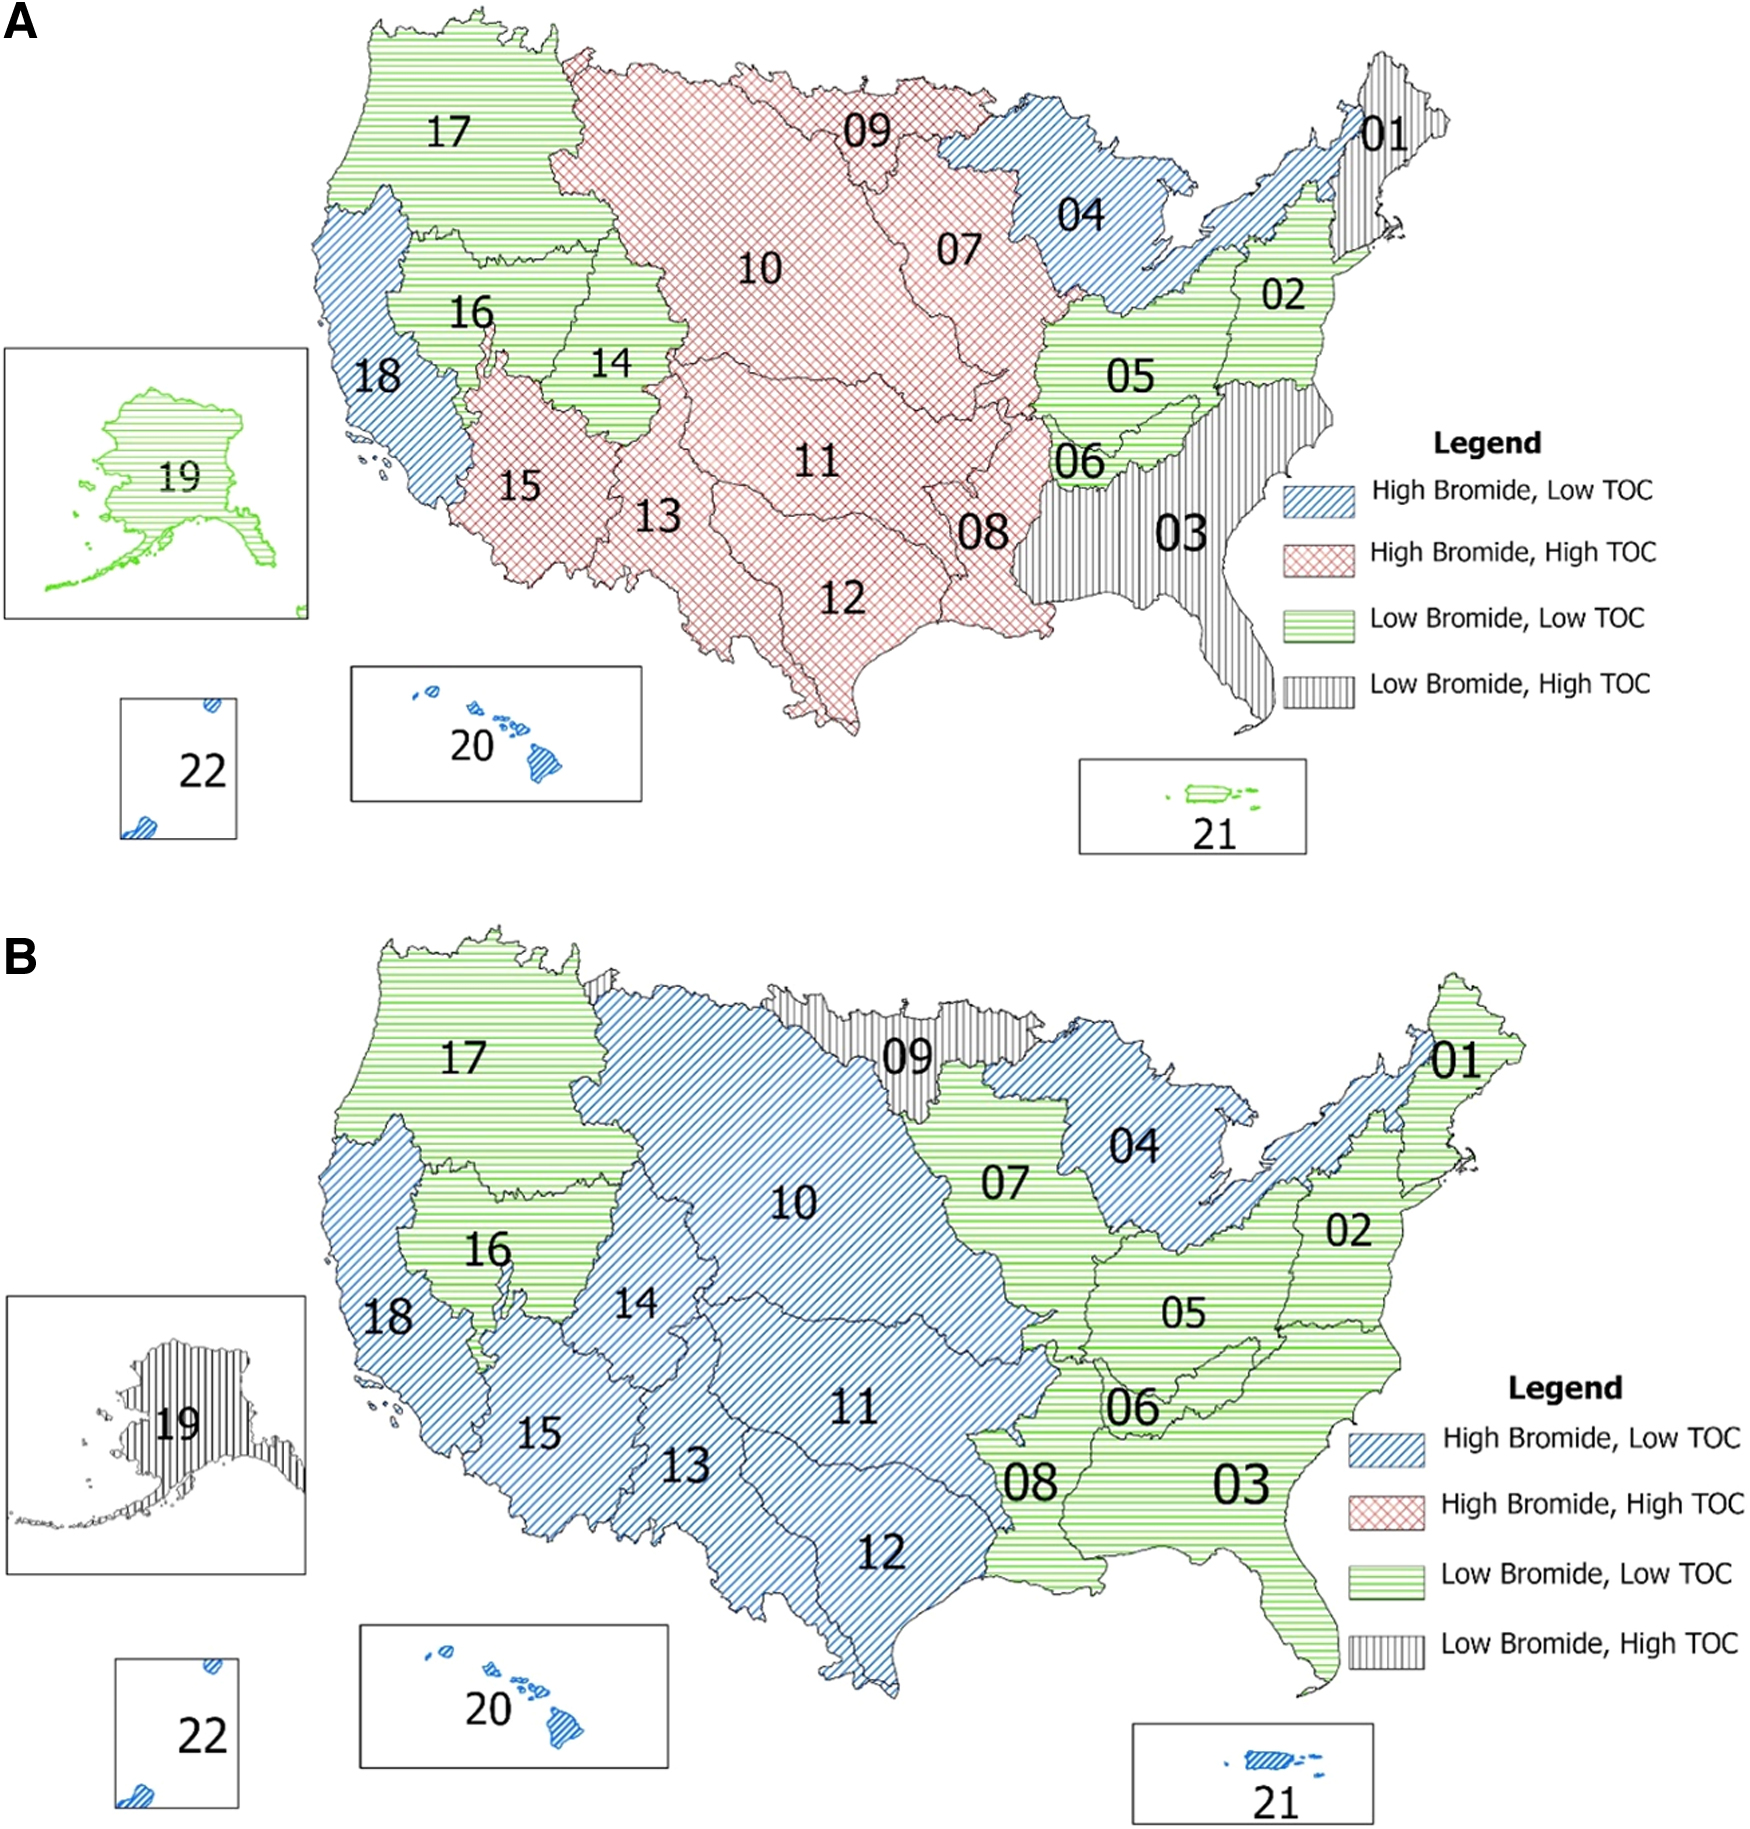
Source waters with elevated concentrations of both bromide and TOC may have higher levels of brominated DBP formation and subsequent risk to drinking water consumers, absent use of control measures. Watersheds at the HUC2 level with elevated concentrations of bromide and TOC were identified using median concentrations as the threshold (Fig. 2A, B). The median bromide concentrations in surface water and groundwater were 21.4 and 50.2 μg/L, respectively, and the median TOC concentrations in surface water and groundwater were 2.5 and 1.0 mg/L, respectively. Details for each HUC2 watershed, including number of PWSs and records captured in the UCMR4 data set, and bromide and TOC percentile values, are provided for surface water (Supplementary Table S1) and groundwater (Supplementary Table S2).
Occurrence of bromide and TOC in
The concentrations of bromide and TOC varied by watershed at the HUC2 level for all source water types. The Kruskal–Wallis test showed that there were significant variations across watersheds for bromide concentrations and TOC concentrations (p = 2.2 E-16 for both surface water and groundwater). The results for bromide were generally consistent with findings from a recent occurrence survey of bromide and iodide in PWS supplies (Sharma et al, 2023); their findings showed that EPA regions with elevated bromide concentrations were consistent with HUC2 watersheds shown in Figure 2A and B as having elevated bromide concentrations.
For surface waters, Sharma et al (2023) found elevated bromide concentrations (based on a cutoff of 70 μg/L) in the south-central, mountain, and southwest regions; the results from the watershed study also found elevated bromide concentrations in those areas as well as in the Great Lakes region. For groundwater, Sharma et al (2023) found elevated bromide concentrations (based on a cutoff of 100 μg/L) in the south-central, midwest, mountain, and southwest regions; the results from the watershed study also found elevated bromide concentrations in those areas as well as in the Great Lakes region.
Approximately one third of the HUC2 watersheds had elevated concentrations (relative to medians) of both bromide and TOC in surface water sources (Fig. 2A), whereas none of the HUC2 watersheds had elevated levels of both parameters in groundwater sources (Fig. 2B). Notably, surface water sources in most HUC2 watersheds in the midwestern and southwestern regions of the United States had elevated bromide and TOC levels (Upper Mississippi [HUC 07], Lower Mississippi [HUC 08], Souris-Red-Rainy [HUC 09], Missouri [HUC 10], Arkansas-White-Red [HUC 11], Texas-Gulf [HUC 12], Rio Grande [HUC 13], and Lower Colorado [HUC 15]). PWSs using surface waters in those watersheds may be susceptible to formation of higher concentrations of DBPs and associated risk from brominated DBPs.
This is corroborated by an evaluation of the UCMR4 HAA data showing that PWS in the Texas-Gulf region was responsible for 30.5% of all 90th percentile brominated HAA concentrations nationwide, despite accounting for only 14.0% of the PWS sampled (Personal communication; Furst; 2022). Based on median bromide and TOC concentrations, predicted concentrations of THMs (not sampled under UCMR4) would be approximately double in the Texas-Gulf watershed, and 30–40% higher in the Rio Grande watershed compared with the median value for all watersheds (Sohn et al, 2004). The increase in brominated THM levels resulting from a 50 μg/L increase in bromide could be associated with a potential 10-fold increase of excess lifetime bladder cancer risk, from 1 in 1,000 to 1 in 10,000 (Regli et al, 2015). Other researchers also reported increased DBP risks with increasing bromide (Kolb et al, 2017; Wang et al, 2017).
Further evaluation of the South Atlantic-Gulf watershed showed that systems in a portion of that watershed (i.e., the state of Florida) had bromide and TOC concentrations substantially higher than in other parts of that watershed. Bromide was ∼130 μg/L higher in surface water system sources and 590 μg/L higher in groundwater system sources, and TOC was ∼10.3 mg/L higher in surface water system sources and 1.7 mg/L higher in groundwater system sources. This is consistent with findings from the ICR (McGuire et al, 2002). Overall, bromide was approximately an order of magnitude higher and TOC 50% higher at PWSs in the state of Florida than other PWSs in the South Atlantic-Gulf watershed.
In this study, the number of PWSs and records for both bromide and TOC within each HUC varied by over three orders of magnitude, with some HUCs having only a very small number of records (shown in Supplementary Tables S1 and S2). HUCs with a small number of records may be a source of uncertainty in the study's findings. Another potential source of uncertainty is that samples were collected once per quarter (i.e., once per season) at most, while the concentrations of those precursors may vary over the course of a season. For example, source water TOC concentrations collected twice each month for 5 years (2014–2018) at a surface water PWS in the mid-Atlantic region varied substantially within each season, with a range of 2 mg/L in winter and summer, and a range of 4 mg/L for spring and fall (Weisman et al, 2021). Bromide has also been found to vary significantly within a single season for some surface water sources (Regli et al, 2015).
Relation of bromide to TOC concentrations
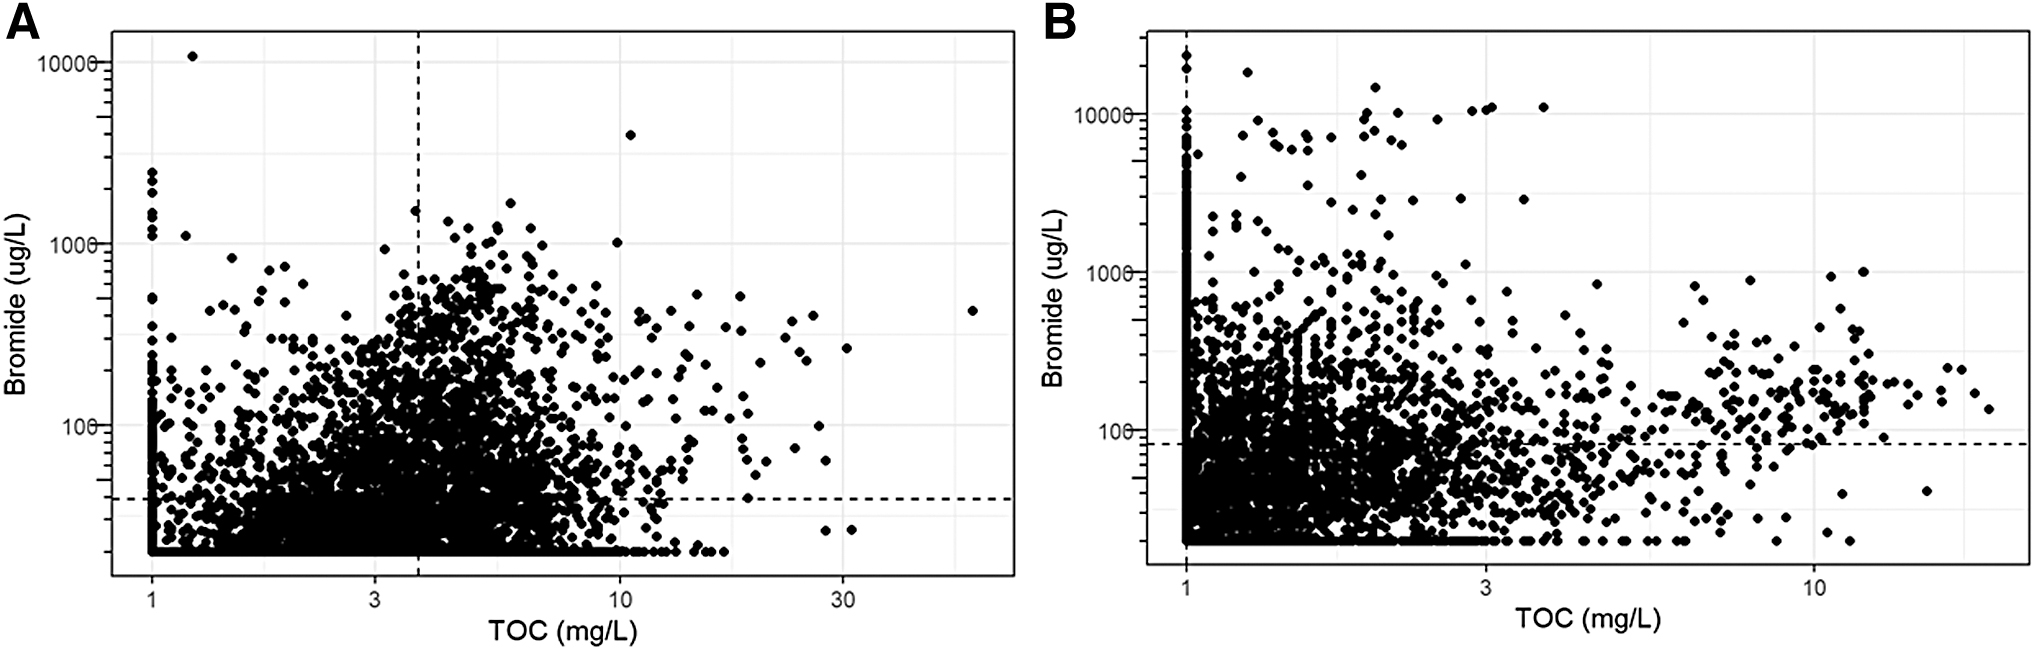
The relationship between source water bromide and TOC concentrations varied substantially for both surface water (Fig. 3A) and groundwater (Fig. 3B). Co-occurrence of elevated bromide and TOC concentrations was more commonly seen for surface water than groundwater systems, with ∼15.3% of the surface water records having bromide and TOC concentrations in surface water sources greater than their 75th percentile values (i.e., 39 μg/L and 3.7 mg/L, respectively). This contrasts with the ∼6.9% of groundwater records having bromide and TOC concentrations greater than their 75th percentile values (i.e., 82 μg/L and 1.0 mg/L, respectively). PWSs with both elevated bromide and TOC concentrations may be susceptible to formation of higher concentrations of brominated DBPs. For groundwater systems, very high bromide concentrations (e.g., >1,000 μg/L) did not co-occur with high TOC concentrations (e.g., >10 mg/L), but many PWSs had either very high bromide or very high TOC.
Relation of paired bromide and TOC concentrations for
The pooled linear regression of bromide on TOC concentrations showed an estimated slope of negative 1.6 with an intercept of 115 μg/L, and very low correlation. Surface water systems had an estimated slope of 8.4 with an intercept of 32 μg/L, with an adjusted R-squared = 0.01474, whereas groundwater systems had an estimated slope of 15 with an intercept of 112 μg/L, with an adjusted R-squared = 0.000729. However, the pooled linear regression approach ignores systematic variance between PWSs, which is accounted for in MLMs. For large surface water systems, the MLM showed an estimated slope of negative 50.1 with an intercept of 197 μg/L. The negative slope is likely related to the many systems that either had very high bromide with low TOC or low bromide with high TOC. For groundwater systems, the MLM showed an intercept ∼57 μg/L higher, whereas for small systems the intercept was ∼56 μg/L lower; however, >80% of the groundwater TOC concentrations were below the 1 mg/L MRL, which severely biases the results.
When watersheds were added as a group-level variable in addition to PWS in the MLM for surface water, the standard deviation for effects associated with PWSs was more than seven times that for watersheds, indicating that differences among PWSs explain significantly more systematic variance in the TOC versus bromide concentrations than differences among watersheds. Additionally, there was substantial residual variance that remained unaccounted for by any of the variables included in the model.
Historical differences in bromide and TOC concentrations
Source water bromide median watershed concentrations for very large systems were ∼20% lower in 2018–2020 than in 1998, however, more than 40% higher at the 90th percentile, whereas source water TOC median watershed concentrations for very large systems were ∼25% higher in 2018–2020 than in 1998 but less than 10% higher at the 90th percentile (Fig. 4 shows results for surface water systems [n = 193]; supporting data are given in Supplementary Table S3). Watershed-level bromide concentrations were statistically different between these two time periods (Kruskal–Wallis test, p = 0.01221), whereas corresponding TOC concentrations were not statistically different (Kruskal–Wallis test, p = 0.08694).
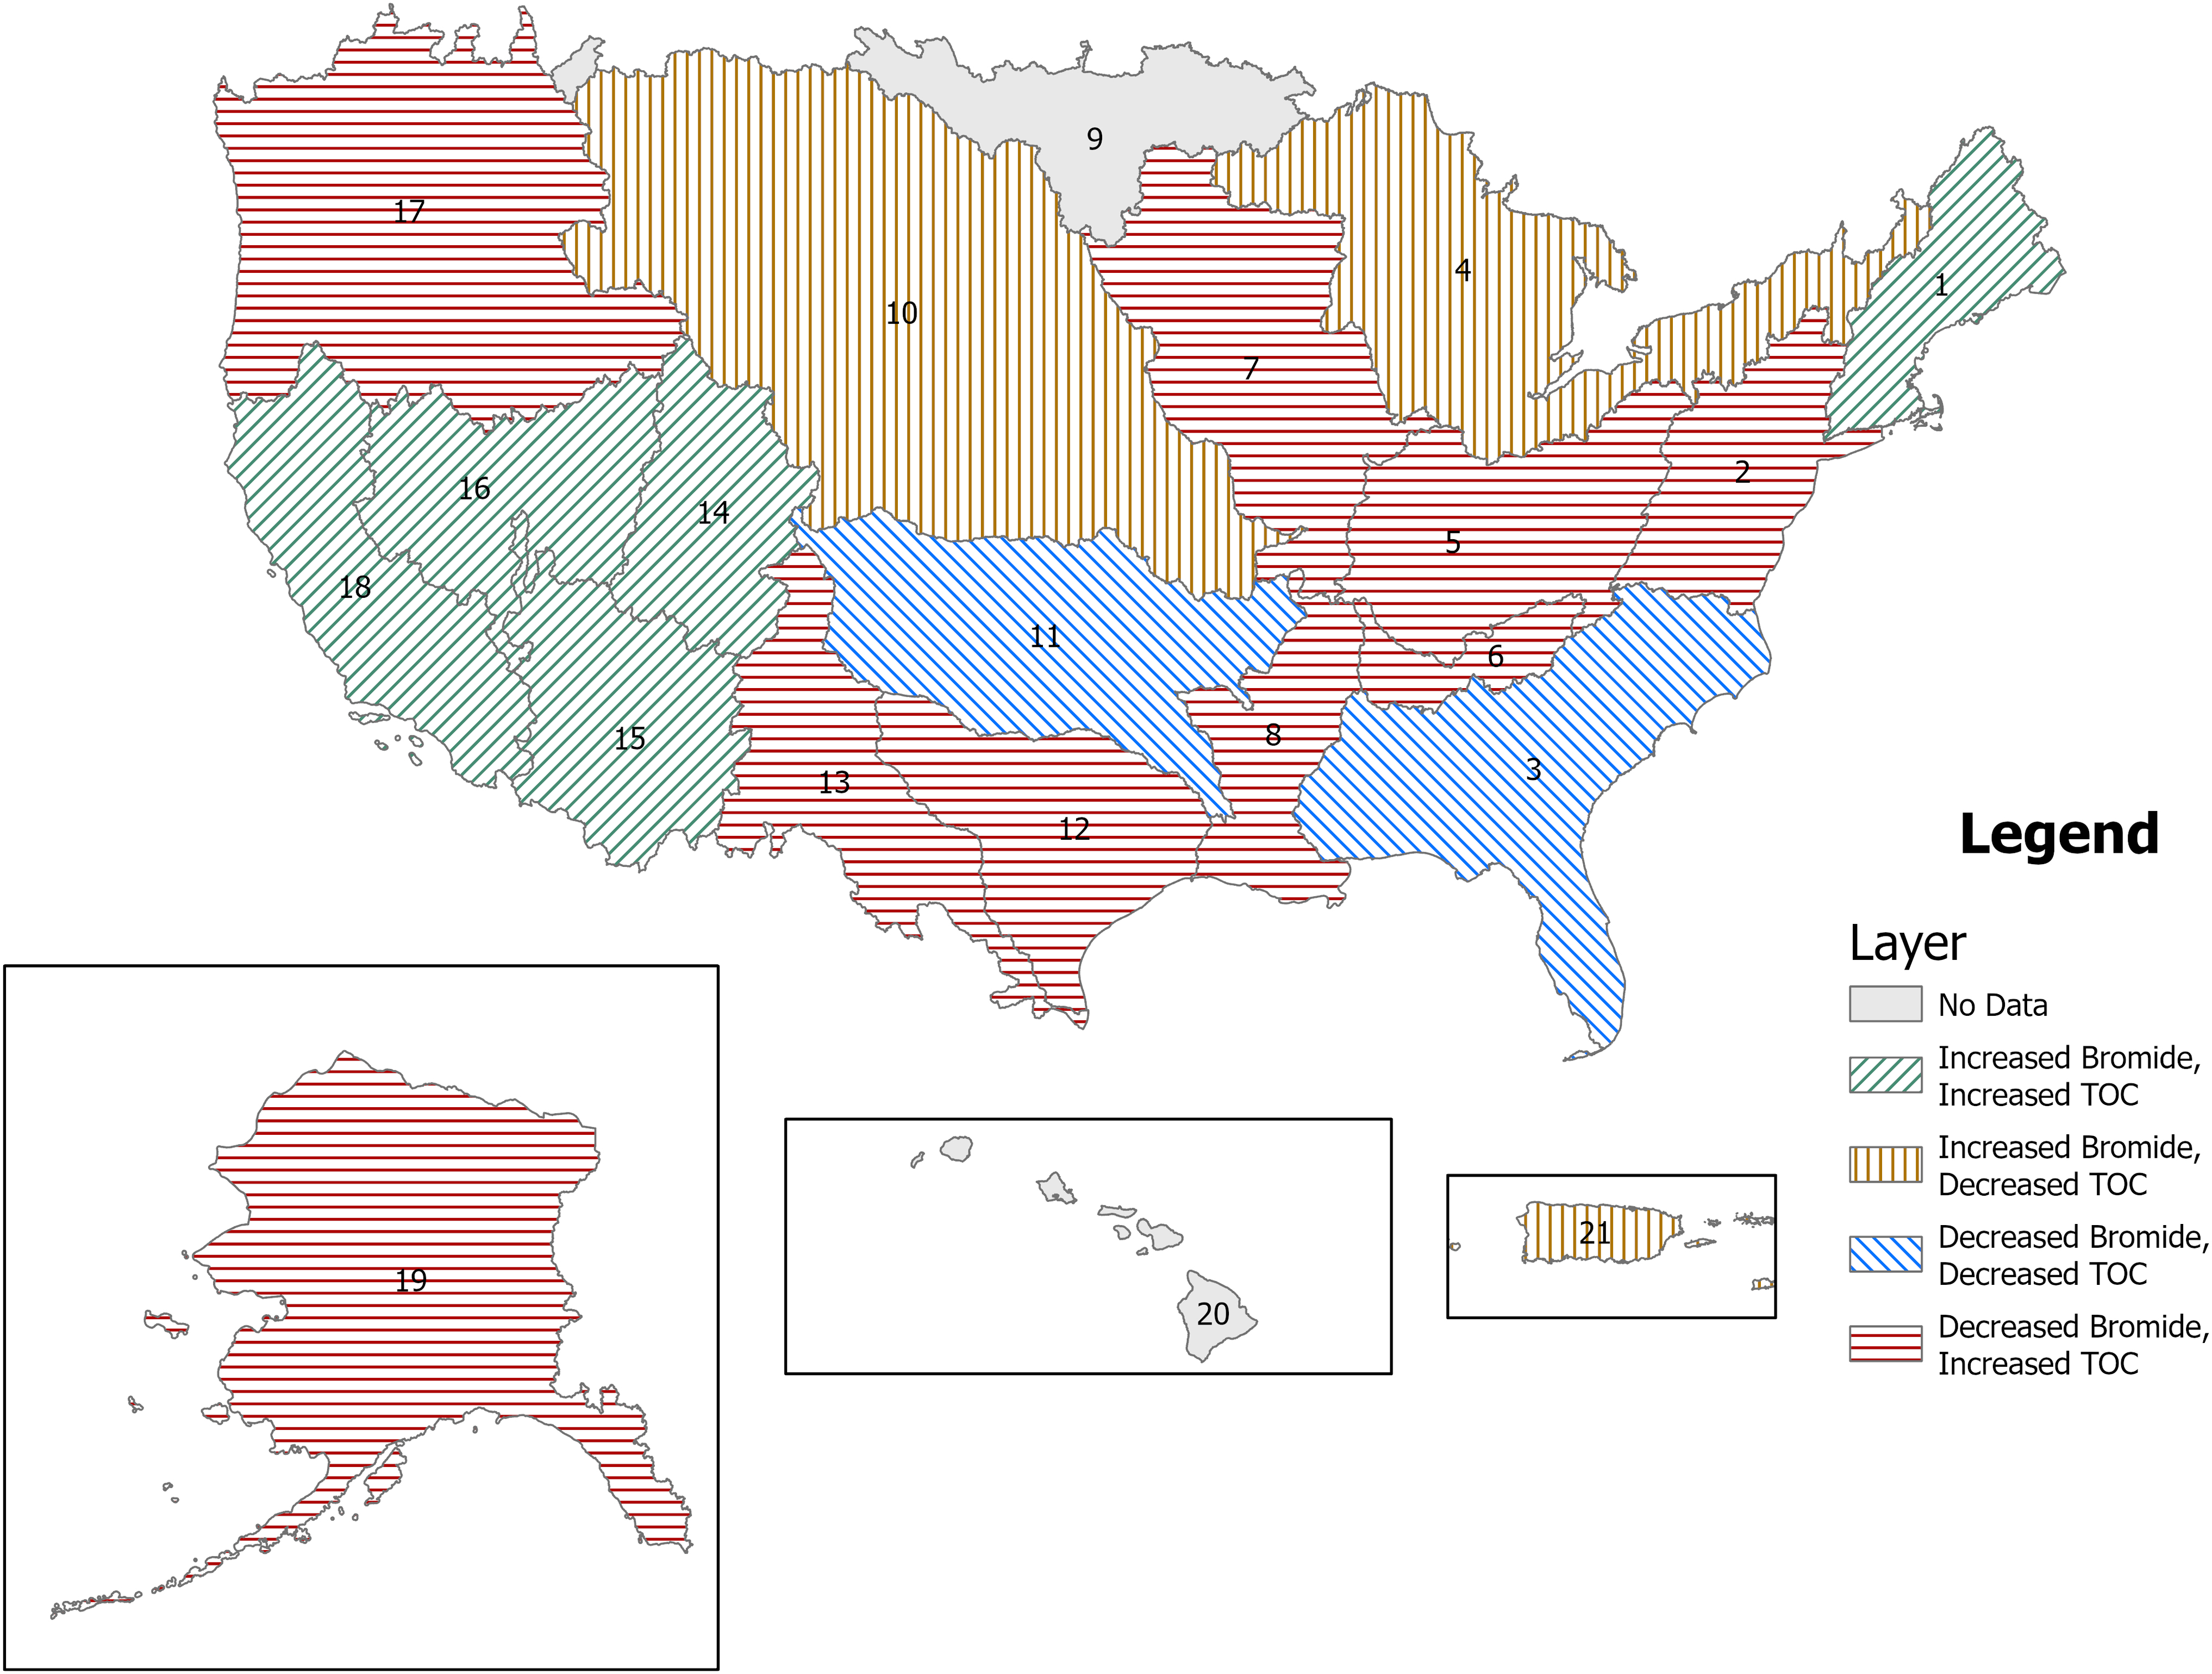
Differences in median watershed concentrations of bromide and TOC for very large surface water system between 1998 and 2018–2020.
In addition, many individual PWSs showed substantial change in bromide and TOC concentrations between those time periods. For example, about 7% of the PWSs had at least double the bromide concentrations, and 5% at least double the TOC concentrations, in 2018–2020 than in 1998. Seasonal variations for systems served by surface water sources in the ICR did not show statistically significant differences between 1998 and 2018–2020 (Kruskal–Wallis test, p = 0.3916) for either bromide or TOC. Bromide showed about a 10% increase in the winter season, and about 10–20% decrease in the summer and fall seasons (Supplementary Fig. S3). TOC showed about a 10% increase during the spring and winter seasons (Supplementary Fig. S4).
The reasons for the variations in bromide and TOC concentrations between the 1998 and 2018–2020 time periods are unclear. For TOC, increased storm intensities and precipitation associated with climate change over the past 20 years may be leading to greater runoff of dissolved organic matter (Correll et al, 2001; Volk et al, 2002). Bromide concentrations may have increased in some watersheds due to its use in power generation and coal-fired power plants or due to saltwater intrusion. Substantial increases in bromide were found for the South-Atlantic Gulf, Hawaii, and Puerto Rico watersheds, and for individual PWSs located in California, Colorado, Connecticut, Florida, Hawaii, Puerto Rico, and Texas.
Good and Van Briesen (2019) identified the South-Atlantic Gulf as likely to see effects of power plant bromide discharges on populations served by surface water systems. The other areas found to have substantial increases in bromide may be related to other energy extraction activities, saltwater intrusion, or other factors. Substantial increases in TOC were found for the Rio Grande and Lower Colorado watersheds, and for individual PWSs located in Arizona, California, Georgia, Idaho, New Jersey, New Mexico, and Texas. Some of these areas may be seeing effects associated with higher levels of precipitation or other factors such as increased urbanization.
Implications for individual PWSs
An evaluation of watershed-level bromide and TOC concentrations is helpful for examining broad variations in those precursors such as for national or regional study; however, watershed-level results should not be inferred as applicable to individual PWSs. Individual PWSs may have bromide and TOC concentrations that are substantially different from those found at a watershed level. PWSs seeking to control for exposure and public health risks from DBPs would benefit from an examination of all the factors relevant to DBP formation including bromide and TOC as well as other indicators for organic matter such as ultraviolet absorbance, algal matter, and de facto wastewater (Li and Mitch, 2018; Richardson and Plewa, 2020; Weisman et al, 2021).
The unfiltered source water TOC reported for UCMR4 may be less representative of the true DBP precursor content than dissolved organic carbon for the surface water systems in which particulate organic matter is substantially removed before disinfection (Stevens et al, 1976). However, the percentage of TOC that is particulate in surface waters is typically low (e.g., less than 20%) (Karanfil et al, 2002). It is important to recognize that factors other than high bromide and TOC concentrations may lead to elevated exposure and subsequent health risks. For example, there may be systems with low bromide and high TOC that have similar public health risks as other systems operating in areas with relatively warmer temperatures. In addition to factors such as precursors and temperature, factors such as disinfectant type and dose, pH, residence time, and system operation can affect DBP formation and subsequent exposure and risk.
Engineering or operational practices that have been used to remove precursors and control DBP formation and exposure include granular-activated carbon, more aggressive coagulation processes, or switching to an alternate disinfectant (McGuire et al, 2014). Systems should evaluate their source water bromide and TOC on a regular basis, along with other operational factors and use the data from those evaluations to inform daily operations. This would be of particular concern in cases where source water bromide and TOC are substantially higher than the median values shown in this study.
Conclusions
This study showed that there are significant variations in source water bromide and TOC concentrations across watersheds and system types and that such variations are relevant when considering the potential for DBP exposure and risk. Variations were found to vary by source water type and watershed, with approximately one third of the HUC2 watersheds found to have elevated levels of both bromide and TOC in surface water system sources. Elevated levels of source water bromide and TOC were especially pronounced for surface water systems in the Texas-Gulf and Rio Grande watersheds.
PWSs with both elevated bromide and TOC concentrations may be susceptible to formation of higher concentrations of brominated DBPs and thus may have greater difficulties mitigating public health risks from DBPs such as THMs and HAAs absent further controls. Further evaluation of watersheds with elevated concentrations of bromide and TOC may be beneficial for PWSs who are seeking to further understand the potential for DBP formation and subsequent risk to drinking water consumers.
Footnotes
Acknowledgments
The authors wish to acknowledge the contributions from Dr. Jimmy Chen, Chandler Klawitter, Alex Porteous, Melissa Simic, Terrell Tiendrebeogo, Stig Regli (retired), and Holly Young at USEPA, and other reviewers who helped improve the article's quality. Any use of trade, firm, or product names is for descriptive purposes only and does not imply endorsement by the U.S. Government.
Authors' Contributions
The authors declare that they contributed to the writing, review, and editing including preparation, creation, and/or presentation of the published work.
Author Disclosure Statement
The authors declare that they have no actual or potential competing financial interests.
Funding Information
This research did not receive any specific grant from funding agencies in the public, commercial, or not-for-profit sectors.
References
Supplementary Material
Please find the following supplemental material available below.
For Open Access articles published under a Creative Commons License, all supplemental material carries the same license as the article it is associated with.
For non-Open Access articles published, all supplemental material carries a non-exclusive license, and permission requests for re-use of supplemental material or any part of supplemental material shall be sent directly to the copyright owner as specified in the copyright notice associated with the article.