
Abstract
With the lack of city-level Greenhouse Gas (GHG) inventories, clear evaluation criteria, and periodic feedback of evaluation indicators, it is challenging to understand well the low-carbon cities' development processes. To achieve the low-carbon cities' GHG emission reduction targets, it is necessary to pay attention to the connection between spatial planning and GHG inventory. Based on Intergovernmental Panel on Climate Change (IPCC) GHG inventory, this article sets up a four-step evaluation system with 32 indicators. The evaluation indicators together with qualitative and quantitative assessment methods were applied to the low-carbon case study of the Chinese city of Shenzhen. Our main findings include that (1) Shenzhen's low-carbon score was 39 in 2018, 21 in 2019, and 71 in 2020. The magnitude of its low-carbon score change is very large, which emphasizes the importance of timely and periodic feedbacks of evaluation indicators; (2) based on IPCC GHG inventory, GHG emission/sink sources are clarified into point sources, line sources, and area sources. To mitigate the GHG impacts from point sources, line sources, and area sources, such spatial planning and land-use management measures as adjusting the land intensity, optimizing the land structure and land layout, and controlling the land scale can be, respectively, considered.
Introduction
In 2019
Cities are the major sources of Greenhouse Gas (GHG), accounting for 75% of total emissions (Jiang et al, 2014). Thereby, cities play a crucial role in reducing GHG emissions. The low-carbon city has been regarded as a core and tended to be a top priority strategy to mitigate the impacts of climate change by more and more countries (Li et al, 2018; Tan et al, 2017). On account of the low-carbon cities' different development statuses, diverse local objectives (Du et al, 2021), and various evaluation indicators (Zhou et al, 2015a), the national government cannot know well the cities' general low-carbon levels in practice.
Simultaneously, the municipal governments are struggling to cope with all kinds of sectoral and fragmented targets, confused by overly broad policy scopes, and failing to achieve the proposed strategies' effectiveness with the lack of periodical evaluation and feedback of the low-carbon indicators (Khanna et al, 2014). In addition, GHG inventory is the basis of setting up evaluation indicators by providing detailed sector-based information on how to quantify GHG emissions/sinks and help identify the influencing factors of GHG emissions/sinks (Li et al, 2017). Thereby, to reduce the GHG emissions, the policy tools of spatial planning and land-use management may be seriously considered when it is regarded as a crucial strategy, rather than the current measures mainly relying on industrial policies and emission reduction technologies at the energy supply end (Gu et al, 2009; Guo, 2018; Pan et al, 2008).
As a spatio-temporal and top-level national governance strategy (Liu and Zhou, 2021), spatial planning is a transformative strategy led by the public sector-socio-spatial process (Zhou et al, 2017). In addition, spatial planning can help reduce GHG emissions by optimizing land use structure and spatial space (Persson, 2013; Remoy and Street, 2018). Meanwhile, it can help mitigate the locking effect of urban spatial structure on carbon emissions (Jiang et al, 2013). Furthermore, the spatial planning management measure of monitoring and evaluation (NYC, 2015; PRC, 2021; Stelzenmüller et al, 2013) will ensure cities know well their dynamic feedbacks of low-carbon indicators. Finally, to achieve low-carbon cities' emission reduction targets through spatial planning, it is necessary to pay attention to the docking of spatial planning and GHG inventory (Yip, 2011a; Yip, 2011b).
In a word, it is meaningful and profound to evaluate low-carbon cities based on GHG inventory in the context of spatial planning. The main contributions of the article include theoretical and practical aspects. In theory, it enriches the current evaluation system, especially with the supplement of the spatial planning management measure of monitoring and evaluation; in practice, the research first helps to evaluate different cities' low-carbon statuses with the same evaluation criteria at a city level; second, it contributes to judge cities' low-carbon process on a national scale; and finally, it enlightens how to set up a complete evaluation system applicable to local conditions on an international scale.
This article first reviews the current literature on low-carbon cities' evaluation systems. And then, the city of Shenzhen is introduced as a low-carbon city case study. Next, the GHG inventory is elaborated in GHG source classification, GHG emission/sink calculation, GHG influencing factor identification, and management policy factor analysis. To correspond to the GHG influencing factors, many spatial planning and land-use management documents have been read through. Based on the studies discussed above, a set of solution-based indicators are established and then applied to the case study of Shenzhen. To know its low-carbon status more comprehensively, many assessment methods and models are adopted in the article. After analyzing the case study both qualitatively and quantitatively, the article ends with some policy implications from the perspective of space optimization and land-use management. Our research framework is shown in Fig. 1.

Research framework. GHG, Greenhouse Gas; IPCC, Intergovernmental Panel on Climate Change.
Literature Review
Although low-carbon cities have been studied and implemented for a few decades (Gomi et al, 2010), there is no universal and literal definition of low-carbon cities (Li et al, 2018). Thereby, low-carbon cities' evaluation criteria and development targets have been studied in different perspectives (Munda, 2005). Simultaneously, on account of the difference of low-carbon cities' locations, urban forms, technology development, and economic factors, the analysis and calculations of GHG emissions have been various (Kennedy et al, 2009). When calculating the city-level GHGs, the spatial impact factors should be also considered fully (Yang et al, 2022). In the context of spatial planning, a low-carbon city in the article is defined as focusing on reducing GHG emissions in energy-consumed activities, and increasing GHG sinks from the perspective of improving environmental quality. It is built to achieve the targets of a low-carbon city's sustainable development.
According to these studies (Azizalrahman and Hasyimi, 2018; Greater London Authority, 2021; Hak et al, 2017; Zhou et al, 2015b), evaluating a low-carbon city includes four key steps. First, it is vital to build a set of scientific evaluation indicators with clear evaluation criteria. Second, it is necessary to evaluate these indicators qualitatively and quantitatively based on multiple scientific methods. Third, evaluation results are analyzed accordingly. Last, but not least, one should examine and monitor the follow-up implementation of these indicators.
On account of the limited practice in multiple-plan integration pilots and urban physical examination and evaluation (Gomi et al, 2010), there is very little academic literature concerning low-carbon cities evaluated with a set of multiple-plan integrated, evaluation period-unified, and periodically monitored indicators. Furthermore, insufficient attention has been paid to the GHG emission reduction strategy on the demand side of man-land (Qiu, 2012), the docking of spatial planning and GHG inventory (Yip, 2011a; Yip, 2011b).
Regarding the present low-carbon city evaluation system, there are some further studies to carry out. First, evaluation criteria should be more scientifically and comprehensively set, considering the convergence of national and local targets (Chen et al, 2013; Huang and Feng, 2016; Yang and Li, 2012). Furthermore, more attention should be paid to the indicators concerning land use (Lou et al, 2019; Tan et al, 2017; Zhao and Hao, 2011) to enrich the GHG emissions' reduction strategies. At last, diversified assessment methods should be adopted to learn about the cities' low-carbon statuses of individual indicators and the whole city (Lin et al, 2014; Price et al, 2013; Zhang et al, 2011).
Materials and Methodology
Study area
China launched low-carbon province and city pilot programs in 2010 (Cai et al, 2019). Shenzhen became one of the first batches of low-carbon pilot cities. With the development of carbon emissions trading, green transportation, strategic emerging industries, green buildings, intensive and economical use of land, and low-carbon pilot demonstration area, Shenzhen has rich experience and excellent achievements in the constructing of a low-carbon city. To achieve the anticipated targets of carbon peak and carbon neutrality, Shenzhen's near-zero carbon emission zone pilot construction and implementation plan issued in 2021. In the same year, Shenzhen city's overall territory spatial planning (2020–2035) (draft) was announced. However, there is no systematic low-carbon evaluation indicator mentioned in such spatial planning draft, which may lag or hamper the process of its low-carbon future development.
China's spatial planning is characterized by multiple-plan integration, including two kinds of assessment indicators: constraint indicators and anticipatory indicators (PRC, 2019); and three types of planning: overall planning (the 14th Five-Year Plan, the Outline of Long-Term Goals for 2035, Carbon Peak Action Plan for 2030, etc.), detailed planning (Space Utilization Controlling Plan, Village Planning, Detailed Urban Planning, etc.), and related special planning (Energy Conservation Plan, Modern Comprehensive Transportation Plan, Industrial Green Development Plan, etc.) (PRC 2019).
In this article, the low-carbon pilot city of Shenzhen is selected as a model city to study its low-carbon process in the context of spatial planning. To improve the universal applicability of the low-carbon city evaluation system put forward in the article, unique indicators of Shenzhen are not discussed.
Establishment of evaluation indicators
Although there is a lack of city-level GHG inventory in China, its national and provincial GHG inventory is set up similar to Intergovernmental Panel on Climate Change (IPCC) GHG inventory (IPCC, 2006). In addition, the city's primary statistical data sources are originated from sectors. Therefore, IPCC GHG inventory is applied to the city (Yip, 2011b). The process of GHG inventory analysis is explained in Table 1.
The Process of Analyzing Intergovernmental Panel on Climate Change Greenhouse Gas Inventory in the Context of Spatial Planning
The formulas in the sector of Energy, Industry, and Waste are compiled from IPCC (2006).
It can be studied in Chapter 3: Consistent Representation of Lands from IPCC (2006).
GHG, Greenhouse Gas; IPCC, Intergovernmental Panel on Climate Change.
It is worth noting that sources of GHG are classified into point sources, line sources, and area sources. Thereby, the GHG sources can be closely combined with land-use management and easily integrated into spatial planning (Wang et al, 2020; Zhang et al, 2018). In line with the scope of the city's spatial planning (Zhang and Feng, 2017), GHG emissions from scope 1 and scope 2 are accounted for in the article (Cai et al, 2019). Based on the current studies (IPCC, 2006; Wassmann et al, 2019; Yu et al, 2019), GHG emissions/sinks are calculated. Finally, influencing factors of GHG emissions/sinks are identified. The influencing factors provide the focusing-on objectives for the establishment of low-carbon city evaluation indicators.
To cover the influencing factors as comprehensively as possible, many spatial planning and land-use management documents have been studied. According to these documents, attributes of low-carbon evaluation indicators are first specified. In spatial planning, the attributes of evaluation indicators are classified into constraint indicators and anticipatory indicators.
Constraint indicators are those that cannot break or must be completed by the national and local government to achieve the planning goals during the planning period; and anticipatory indicators refer to the indicators that should be achieved or not break through during the planning period according to the expectation of economic and social development. Thereby, based on the principles of solution based (IPCC, 2017), attributes specified, criteria clearly clarified, planning period unified, and easily quantified, 32 evaluation indicators are put forward. These evaluation indicators correspond to five sectors of IPCC GHG inventory and 24-type land classification (PRC, 2020). The evaluation indicators are illustrated in Table 2.
Low-Carbon Cities' Evaluation Indicators of Shenzhen
Sources of evaluation indicators:
The People's Republic of China (2021b).
The People's Republic of China (2022).
The People's Republic of China (2021c).
The People's Republic of China (2021d).
The People's Republic of China (2021e).
The People's Republic of China (2017).
The People's Republic of China (2021f).
National Development and Reform Commission (2021).
The People's Republic of China (2021g).
The People's Republic of China (2021h).
The People's Republic of China (2021i).
The People's Republic of China (2010).
The People's Republic of China (2020).
Furthermore, to know the dynamic states of low-carbon cities and guarantee their scientific management, the baseline years and benchmark years are chosen as assessment periods. In the article, according to Urban physical examination and evaluation procedures (PRC, 2020), the years of 2018 and 2019 are regarded as assessment baseline. And the Year of 2020 is selected as assessment benchmark. The Year of 2025 is chosen as a plan target in line with the target year of the 14th Five-Year Plan.
Finally, on account of the availability and accuracy of data, the 32-indicator's data are collected from Shenzhen statistical yearbook, Shenzhen Municipal Government Report, Guangdong statistical yearbook, and official government website. The values of plan targets are originated from the official spatial planning and land-use management documents. The sources of indicators' original values and plan targets are elaborated in Table 3.
Evaluation Results of Shenzhen
Note:
The values with an * are accounted by the authors based on Tables 1 and 3 in the article and a carbon emissions database (IPE, 2021).
The left plan target values of 2025 are originated from their corresponding spatial planning and land-use management documents in Table 3 in the article.
The target value of X23 is Shenzhen's local target decomposing from the national target.
Sources of data:
Shenzhen Government. Shenzhen Statistical Yearbook. www.sz.gov.cn/cn/xxgk/zfxxgj/tjsj/tjnj.html
IPE (2021).
Guangdong Government. Guangdong Statistical Yearbook. http://stats.gd.gov.cn/gdtjnj/index.html
Shenzhen Government. Shenzhen Municipal Government Report. www.sz.gov.cn/cn/xxgk/zfxxgj/zwdt/content/post_9092949.html
Ministry of Ecology and Environment of the People's Republic of China. Summary report on the pilot work of Shenzhen waste-free city. https://www.mee.gov.cn/home/ztbd/2020/wfcsjssdgz/sdjz/ldms/202105/t20210518_833252.shtml
Shenzhen Municipal Bureau of Transportation. Shenzhen Transportation Annual Report. http://jtys.sz.gov.cn/gkmlpt/content/9/9030/post_9030881.html#1514
Shenzhen Government. Shenzhen Yearbook. http://www.sz.gov.cn/cn/zjsz/nj/
Ministry of Housing and Urban-Rural Development of the People's Republic of China. Statistical Yearbook of Urban Construction. https://www.mohurd.gov.cn/gongkai/fdzdgknr/sjfb/tjxx/jstjnj/index.html
Shenzhen Government. Shenzhen Municipal Social Development and Economic Statistical Bulletin. http://tjj.sz.gov.cn/zwgk/zfxxgkml/tjsj/tjgb/
Water Authority of Shenzhen Municipality. Shenzhen Water Resources Bulletin. http://swj.sz.gov.cn/sjfb/szygb/content/post_9113900.html
Shenzhen Municipal Bureau of Urban Management and Comprehensive Law Enforcement. Statistical data report on urban management in Shenzhen. http://cgj.sz.gov.cn/zwgk/tjsj/content/post_8915029.html
Ministry of Ecology and Environment of the People's Republic of China. Shenzhen waste-free city construction pilot report. https://www.mee.gov.cn/home/ztbd/2020/wfcsjssdgz/sdjz/sdtx/202102/t20210208_820867.shtml
Guangdong Provincial Bureau of Statistics. Guangdong Rural Statistics Yearbook. http://stats.gd.gov.cn/gdnctjnj/index.html
Shenzhen Government. Shenzhen Municipal Ecological Environment Status Bulletin. www.sz.gov.cn/zfgb/2021/gb1200/content/post_8818680.html
Qualitative assessment methods
When assessing the evaluation indicators qualitatively, the method of index comparison is chosen to learn about the low-carbon progress of individual indicators. As to the method of index comparison, the completion descriptions of indicators in the benchmark year can be illustrated clearly after comparing the values between the benchmark year and the target year. In the article, the descriptions of well completed, completed, and not completed (NYC, 2015) are applied to assess the statuses of individual indicators.
Quantitative evaluation models
Entropy weight model
Entropy was proposed to measure the uncertainty in information (Shannon and Weaver, 1947), which can help provide objective weight determination for the policy makers. The larger the amount of information, the smaller the entropy, and the higher the weight of the evaluated indicators is (Wang et al, 2021). In the article, the entropy weight model is applied to calculate the weights of 32 indicators and the five sectors based on the 32-indicator's original values. The main steps are followed as below:
Considering the 32 indicators with different dimensions and units, it is necessary to normalize their original values first. While Eq. (1) is assumed to normalize those indicators with positive effects on carbon emission levels, Eq. (2) is proposed for those with negative effects.
where, rij is the normalized value of indicator i in year j (j is assumed to be the assessment periods, such as the year of 2018, 2019, and 2020), and xij is the original value of indicator i in year j. The max(xij) and min(xij, respectively, represent the maximum value and minimum value in the set of data in the same year.
Second, the entropy value of each indicator can be calculated as follows.
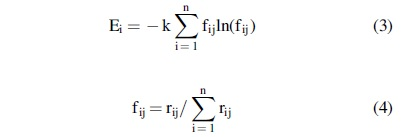
where Ei is the entropy value of indicator i, n is the number of study objects in the article (n = 32), and fij is the standardized value of rij. If fij = 0, then ln(fij) = 0 is assumed to be established. k is the coefficient of the calculation process.
Finally, the weight value of each indicator wi can be calculated in Eq. (6). Accordingly, each indicator's aggregate entropy weight in the corresponding year wij is illustrated in Eq. (7), and the sectors' aggregate entropy weight wc is calculated in Eq. (8).
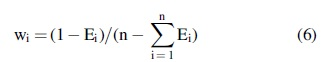
where m is the total number of indicators in the same sector.
Multicriteria evaluation model
Multicriteria evaluation is also a kind of method to deal with uncertainty. It can commonly employ parameters to demonstrate certain attributes with specific scoring based on entropy weight evaluation (Becker et al, 2017). According to the results of Eq. (8), the sectors' integrated weights can be quantitatively demonstrated. To learn the city's development trends quantitatively in the assessment periods, multicriteria evaluation model (Tan et al, 2017) is introduced into the article.
To calculate the city's score in the corresponding year, it is necessary to normalize the 32 indicators between their original values and target values. The standardized results can be obtained from the equalities of Eqs. (9) and (10).
where Eij is normalized data of indicator i in j year, xij is the original value of the indicator i in j year, and xit is the ith indicator's planning target of year 2025 (it is assumed to be the year of 2025). Equation (9) is for positive impacts on carbon emissions and Eq. (10) is for negative impacts on carbon emissions.
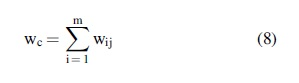
The city's score Sj in jth year can be calculated as below.
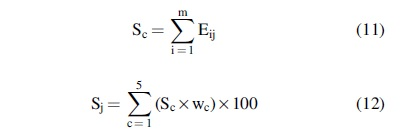
where wc is the weight of c sector [wc is obtained from Eq. (8)], Sc is the total score of Eij in sector c, and m is the total number of indicators in the same sector.
To illustrate the process of the quantitative calculation process, Fig. 2 is given as below.
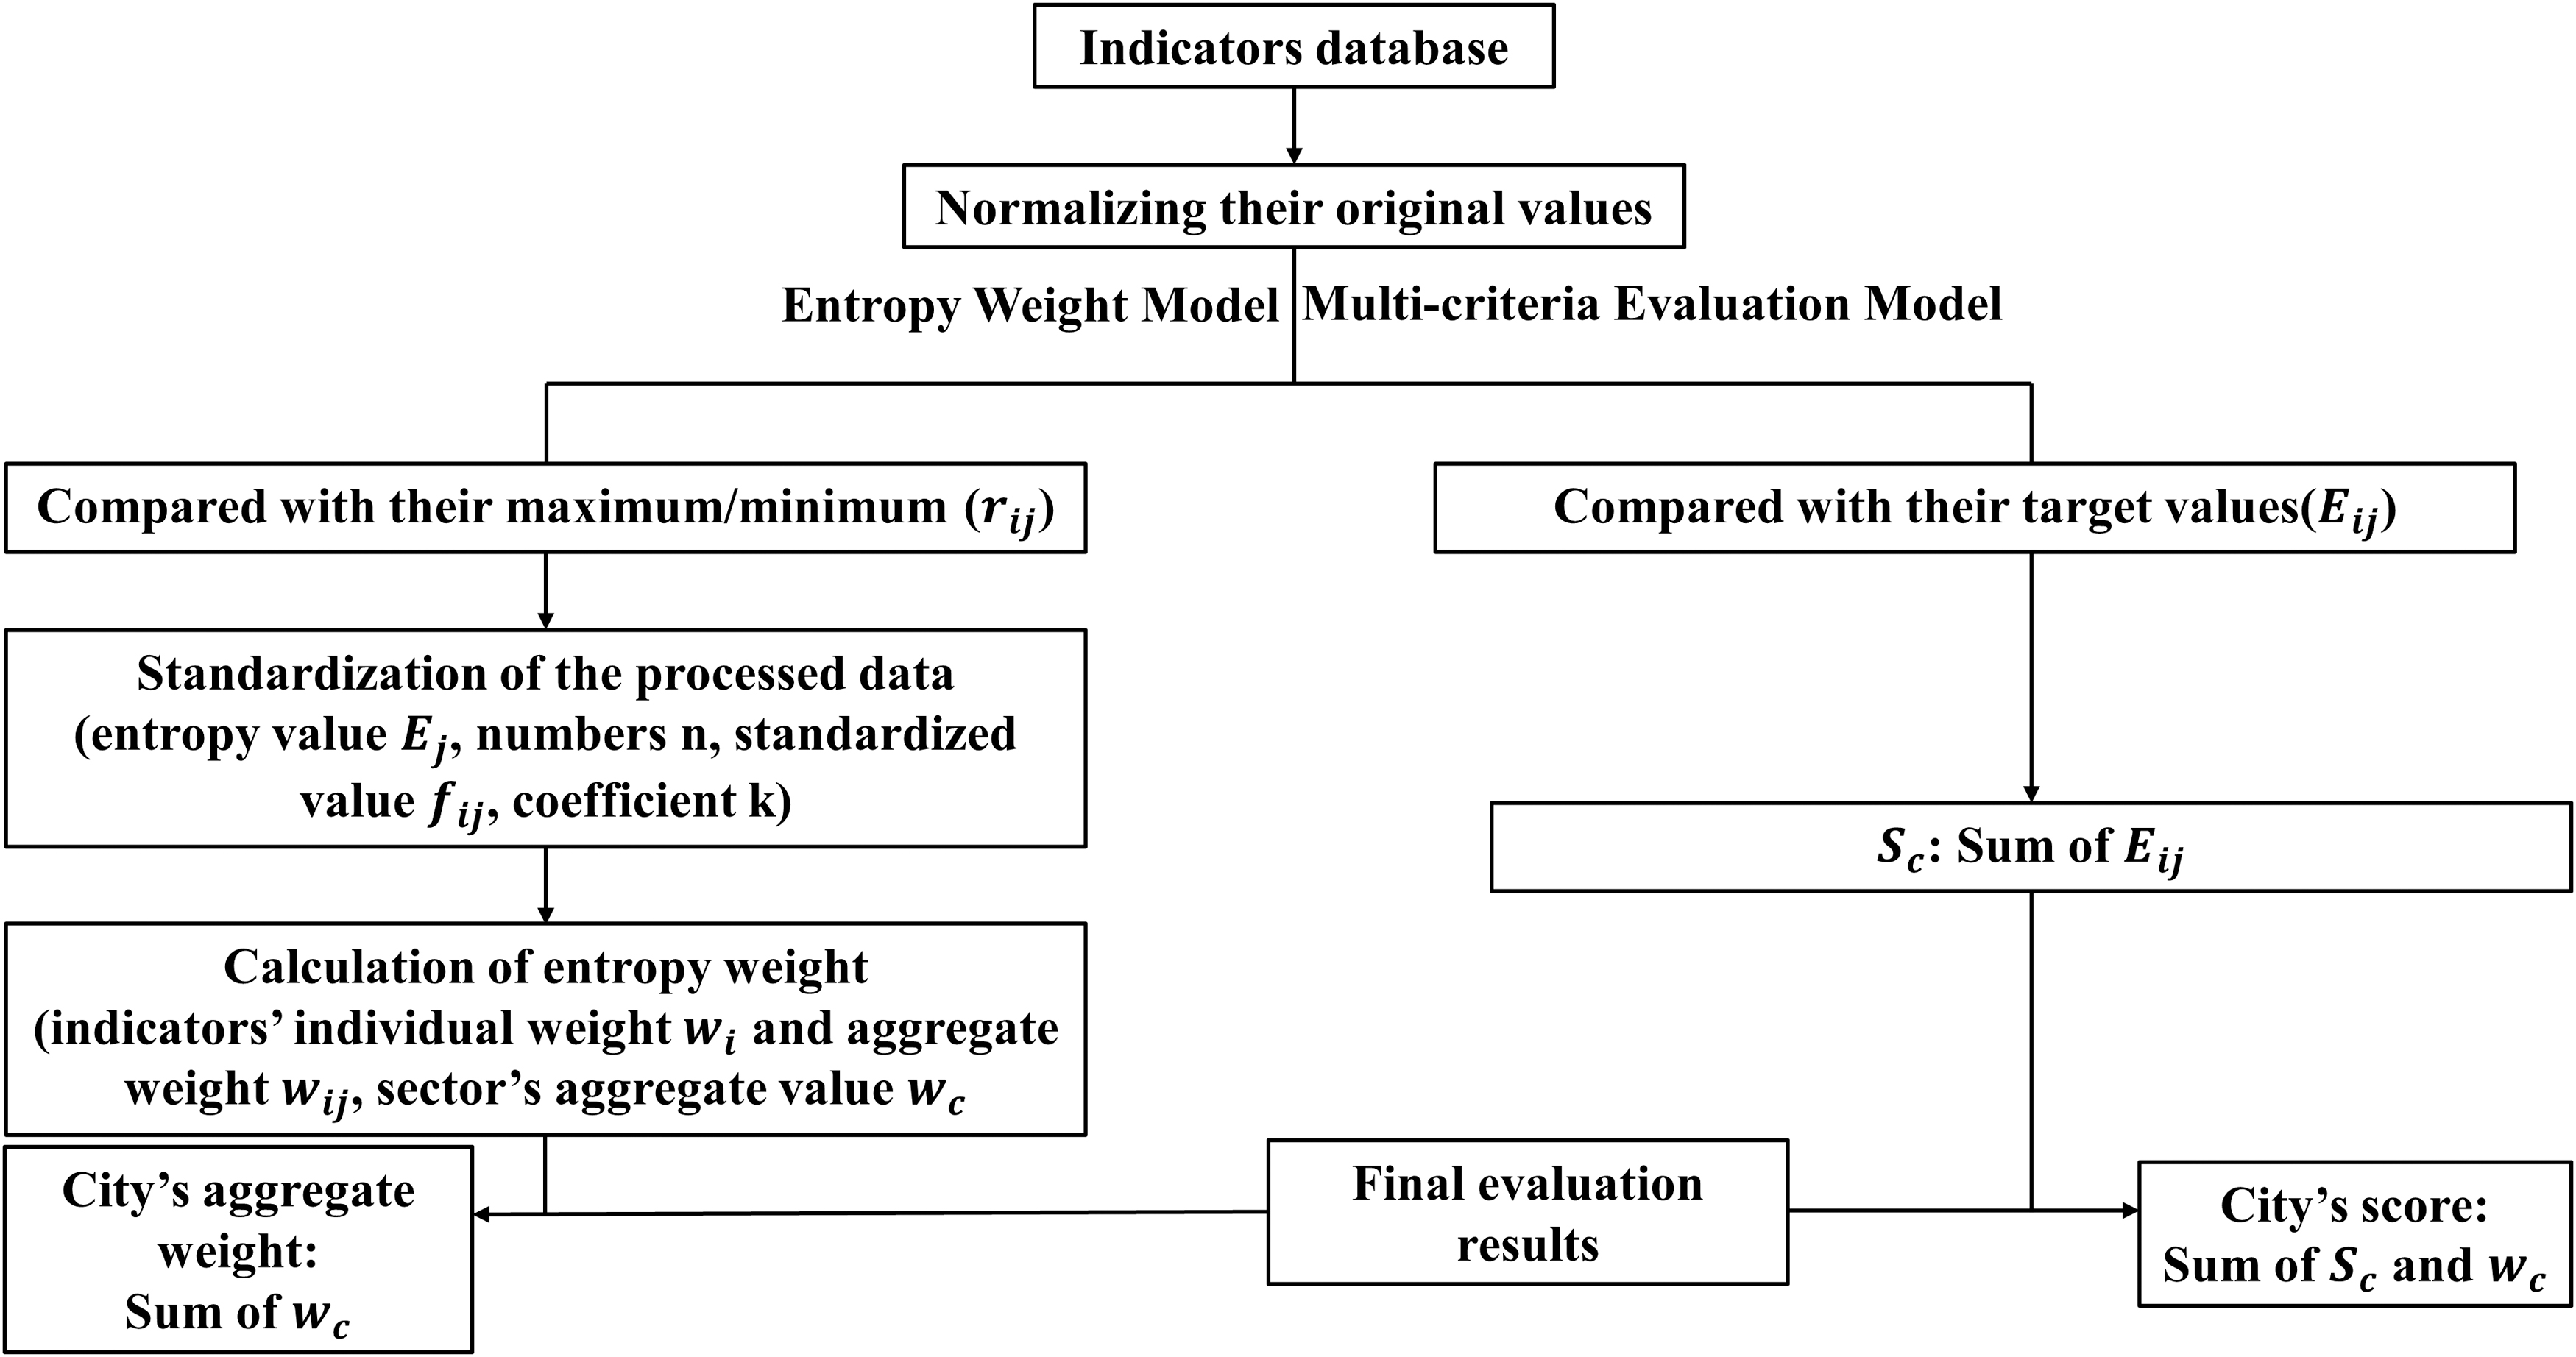
The process of quantitative calculation.
Monitoring and evaluation of evaluation indicators
The management measure of monitoring and evaluation can both help explain the extent to which the set targets have been achieved and provide evidence-based feedbacks concerning what is working and what is not (Stelzenmüller et al, 2013). In China, urban physical monitoring and evaluation is an important policy to ensure the effective and scientific implementation of spatial planning, in which monitoring and evaluation indicators are the core parts. Therefore, if the low-carbon city evaluation indicators set up in the article were integrated into urban physical monitoring and evaluation, the policy could help ensure the low-carbon indicators conducting physical monitoring once a year and assessment once every 5 years, and then promote the low-carbon cities to develop with more reasonable goals.
Results
The qualitative and quantitative results of Shenzhen are listed in Table 3. It is worth noting that the target of indicator X23 is decomposed from the corresponding national goal. In addition, X7, X13, X24, and X25 are special indicators with qualitative target descriptions, because these indicators are difficult to be assigned a specified quantitative value on a national scale or at a city level. However, they are very fundamental solutions to improve cities' low-carbon statuses.
Qualitative assessment results
In 32 indicators, there are 12 constraint indicators and 20 anticipatory indicators. Meanwhile, 21 indicators were described with the assessment statuses of well completed, 7 indicators with the results of completed, and the remaining 4 not completed indicators (2 constraint indicators and 2 anticipatory indicators). To summarize the qualitative results, the agriculture sector was in the best low-carbon status with all 7 indicators well completed on account of its limited agricultural land resources, modern and corporatized management. Concerning the four not completed indicators, they were, respectively, the indicators of nonfossil energy, road network density, solid waste recycling, and surface water quality.
The value of nonfossil energy was incredibly approaching the plan target of the Year 2025. However, there were more significant gaps in the left three indicators when comparing the values of 2020 with 2025. Based on the multicriteria evaluation model (Azizalrahman and Hasyimi, 2018), the gaps of the remaining three not completed indicators were, respectively, 29%, 30%, and 21%. Therefore, the city has to focus on how to improve the indicators of road network density, solid waste recycling, and surface water quality.
Quantitative assessment results
Of 32 indicators, only eight indicators cause negative effects on GHG emission reduction, and the remaining 24 indicators play a positive role in reducing GHG emissions. Those indicators with positive effects can be the basic solutions for low-carbon cities to reduce GHG emissions and increase GHG sinks. In addition, six indicators of X4, X8, X21, X22, X23, and X26 had the largest weight values of 0.0521. On the contrary, there were four indicators of X6, X9, X11, and X18, with the least weight values of 0.0192. On account of the downward changes in the industry sector and the drastic weight fluctuation in the forestry sector in 2019, the city's aggregate entropy weight decreased suddenly in 2019 compared with 2018 and 2020. The aggregate entropy weights of the left three sectors kept upward. In particular, the weight values of the waste sector had the biggest change in the assessment periods.
The magnitude of Shenzhen’ low-carbon scores change is very large during the assessment periods. In 2018, its low-carbon score was 39; in 2019, the score dropped to 21; and in 2020, the score suddenly rose to 71. These changes demonstrate the importance of timely and periodical feedbacks of evaluation indicators. The construction of low-carbon cities is a long-term process, not just to meet the planned goals in the final appraisal year.
Comparison of two assessment results
After comparing the two assessment results, it was found that the agriculture sector had the largest aggregate entropy weight, which was in line with the qualitative assessment result. It was worth noting that the industry sector should also be the future work focus. Although the qualitative assessment results of industry sector were well completed, its quantitative low-carbon process was downward in the assessment periods. Under such conditions, it was actually more arduous to reduce GHG emissions from industry sector by merely relying on current industrial policies and emission reduction technologies.
In the future, the low-carbon city of Shenzhen should pay more attention to improving the indicators of road network density, solid waste recycling, and surface water quality. Meanwhile, it may have great difficulty increasing the proportion of nonfossil energy and reducing industry GHG emissions.
Summarization of assessment results
To summarize the assessment results, Shenzhen has made outstanding achievements in the construction of low-carbon city because its low-carbon score was 71 in 2020 compared to the planned targets set in 2025. Based on its current urban renewal planning, such representative indicators as X2 (point sources of GHGs), X11 (line sources of GHGs), and X31 (area sources) are selected to illustrate how to combine the assessment results with the low-carbon city's spatial planning and land-use management. They have been demonstrated in Fig. 3.
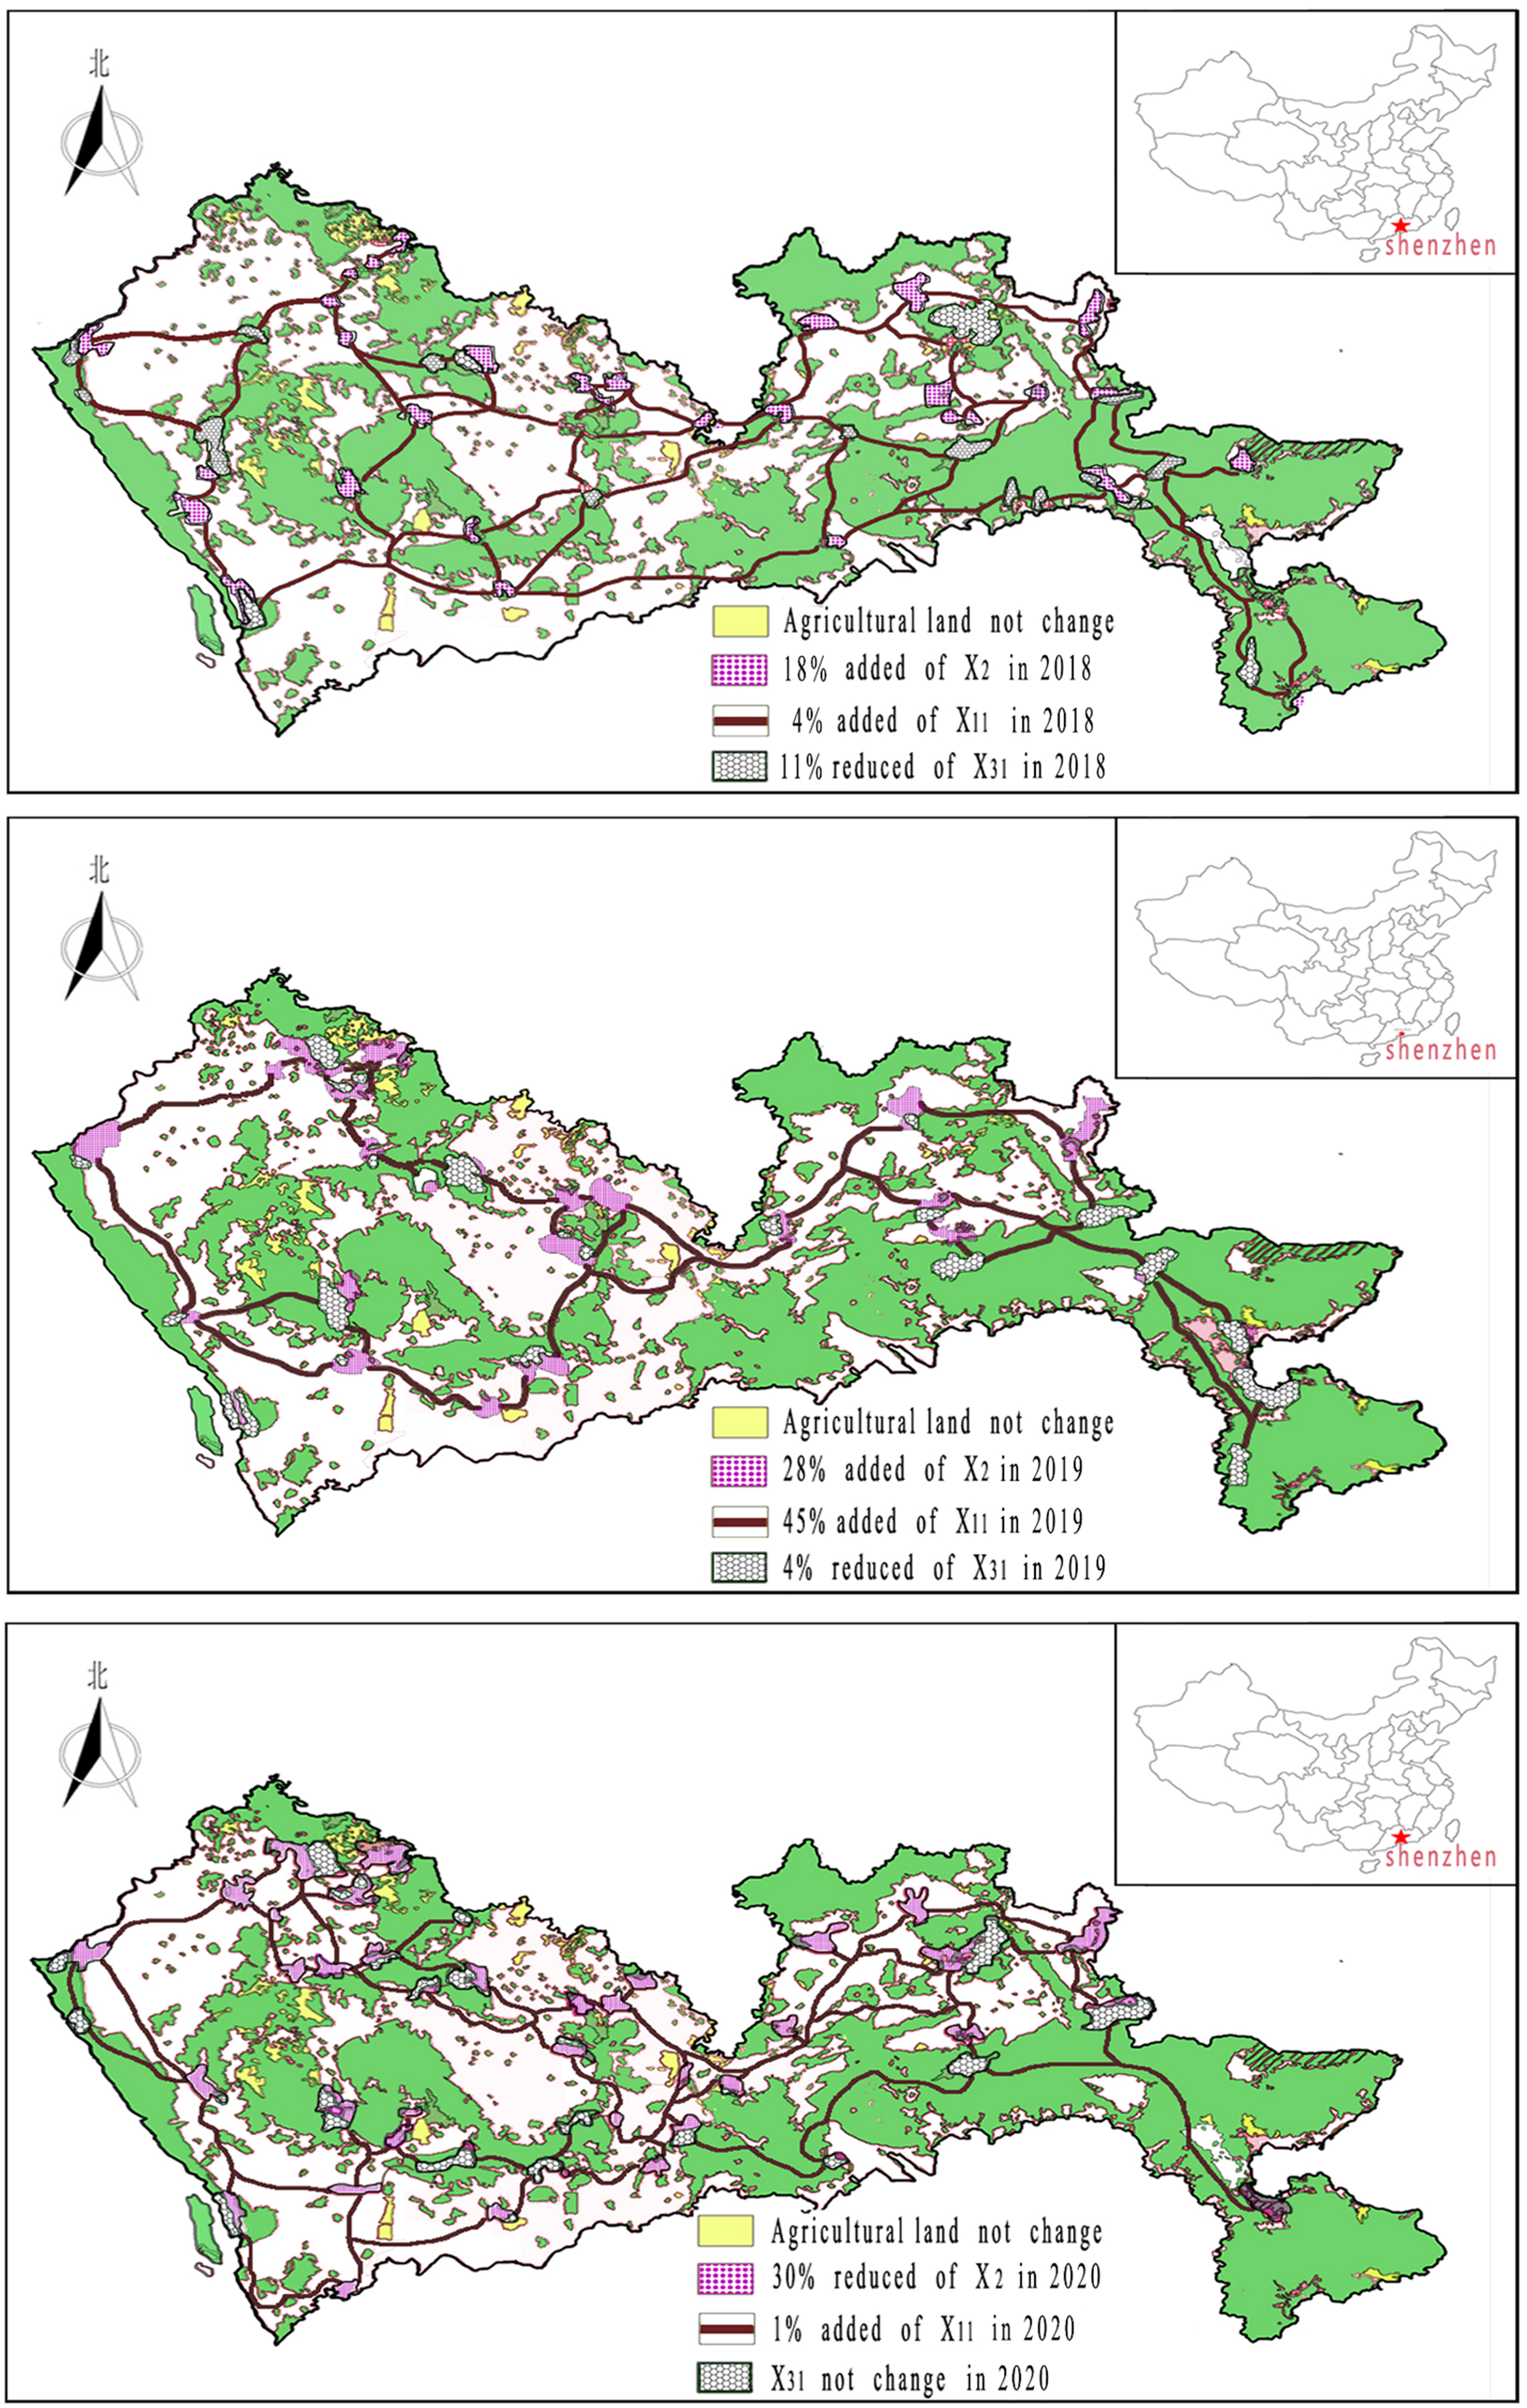
The assessment results illustrated in Shenzhen's land-use.
Conclusion and Policy Implications
This study concentrates on how to evaluate the low-carbon cities' dynamic states and ensure their following effective and scientific management. This article first identified the influencing factors of GHG emissions/sinks on the basis of IPCC GHG inventory, and then specified the low-carbon cities' development targets based on the GHG emissions/sinks' closely related spatial planning documents, and finally integrated the evaluation results into the cities' land-use management with the application of qualitative and quantitative evaluation models. The main conclusions are drawn as follows:
The four-step evaluation system set up in the article is applicable and feasible. The quantitative results obtained from the evaluation models can both demonstrate Shenzhen's dynamic low-carbon development process and be integrated into its land-use management. Of Shenzhen's 32 evaluation indicators, X4, X8, X21, X22, X23, and X26 had the largest weight values of 0.0521; and X6, X9, X11, and X18 had the least weight values of 0.0192. In addition, the agriculture sector was in the best low-carbon status with 7 indicators well completed; the four not completed indicators were, respectively, the indicators of nonfossil energy, road network density, solid waste recycling, and surface water quality. In the 3-year assessment period, the fluctuate trends of Shenzhen's aggregate weight and score kept the same. In particular, Shenzhen's low-carbon score was 39 in 2018; in 2019, the score dropped to 21; and in 2020, the score suddenly rose to 71. Compared to the planned targets set in 2025, Shenzhen has made outstanding achievements in the construction of low-carbon city because its low-carbon score reached 71 in 2020. In addition, Shenzhen could fulfill the national yearly assigned carbon emission tasks. However, it is essential to implement timely and periodic feedbacks of evaluation indicators. The construction of low-carbon cities is a long-term process, not just to meet the planned goals in the final appraisal year. In Fig. 3, four representative indicators of X2 (point sources of GHGs), X11 (line sources of GHGs), and X23 and X31 (area sources) were selected to illustrate how to combine the assessment results with the low-carbon city's spatial planning and land-use management. The yearly conversion g of land-use in land scale, land structure, land layout, and land intensity (Yan and Yang, 2021) could be clearly demonstrated with the corresponding types of evaluation indicators.
Corresponding to the above conclusions, the following policies were proposed to promote the cities' low-carbon development.
When evaluating low-carbon cities, systemic and effective evaluation system play a crucial role in both learning the low-carbon cities' dynamic states and then helping ensure the completion of urban low-carbon development goals. Therefore, it is essential to consider spatial planning and land-use management to set up a complete evaluation system and simultaneously applicable to local conditions.
After learning the evaluation results of individual indicators, sectors, and the whole city, it is more feasible to take effective and efficient management measures. As to Shenzhen, it should pay more attention to improving the indicators of road network density, solid waste recycling, and surface water quality. Meanwhile, it can increase the proportion of nonfossil energy and optimize the industry land structure to reduce its industrial carbon emissions.
The spatial planning management measure of monitoring and evaluation can both help judge the gaps between cities' current low-carbon statues and their planning targets, and help specify their future management focus. To achieve the national and local GHG reduction goals, it is profound to integrate monitoring and evaluation into the current low-carbon evaluation system and then promote the low-carbon cities to develop with more reasonable goals.
The process of low-carbon cities' development is complex and comprehensive. To achieve the final GHG reduction goals, it is crucial to clarify how the GHG inventory, land use planning, and the policy factors are well connected. In Fig. 3, four representative indicators were selected. First, Shenzhen's agriculture sector had the largest weight value, its land scale kept unchanged in the assessment periods; and second, X2 was regarded as point sources of GHGs. Compared to 2018, its value decreased about 11% in 2020 by adjusting the industrial land intensity. In addition, X11 was line sources of GHGs. It kept upward year after year by optimizing the land structure and land layout of Shenzhen’ road network. Finally, X31 was area sources of GHGs. It kept downward year after year, which led to its corresponding sector's weight value downward.
Therefore, Shenzhen could expand its forest land scale to improve the weight value of X31. In four indicators, only X2 played a negative effect on reducing GHGs. Improving the left three indicators could contribute to the GHG reduction. In a word, to reduce GHG emissions and increase GHG sinks, it is essential to consider such a strategy as integrating the city's low-carbon development with the urban land-use management strategies by controlling the land scale, optimizing the land structure, improving the land layout, and restraining the land intensity.
In conclusion, the research results of this article can help learn the low-carbon cities' dynamic statues and provide a reference for low-carbon cities' future management.
Footnotes
Authors' Contributions
X.C.: methodology, data processing, visualization, writing-original draft, and writing-review and editing. X.L.: funding acquisition and supervision. Y.Z.: visualization and data processing. All authors read and approved the final article.
Data Availability
The datasets used or analyzed during this study are available from the corresponding author on reasonable request.
Author Disclosure Statement
The authors declare that they have no known competing financial interests or personal relationships that could have appeared to influence the work reported in this article.
Funding Information
This research was funded by the National Natural Science Foundation of China (Grant No. 718741920) and Key Projects of Jiangsu Social Science Fund (Grant No. 19GLA006).