
Abstract
The thermophilic anaerobic fermentation of mixed materials for simultaneously producing biohydrogen and methane has become a research hotspot. In this study, thermally treated kitchen waste (KW) and municipal sewage sludge (MSS) were used as substrates for a thermophilic two-stage anaerobic digestion process. The effects on gas production performance were investigated in both the hydrogen-producing stage and methane-producing stage under different organic load rates (OLRs). The production rates, volume, removal rates, and energy yields of volatile solids (VS) were optimal under higher OLRs for both the hydrogen (OLR = 12.5 g VS/L·day) and methane stages (OLR = 5 g VS/L·day). These conditions also provided the optimal average removal rate and total energy yield of VS for the entire anaerobic fermentation system (65.4% and 30.9 kJ/g VS, respectively). Overall, the results demonstrate the superior efficiency of VS removal and hydrogen and methane production in a two-stage thermophilic anaerobic co-digestion of KW and MSS with a high solid content under proper material mix ratio and higher OLRs. This study provides the basis for material mass ratio, mixtures' pretreatment, and operation control for future pilot tests.
Introduction
With the rapid development of the economy and improvements to living standards in China, increasing amounts of municipal solid waste (MSW) and municipal sewage sludge (MSS) are being generated. In 2017, the amount of MSW produced in 202 large and medium-sized cities reached 210.94 million tons (MT), of which kitchen waste (KW) accounted for more than 50% (Gao et al., 2018; Wang et al., 2018; Xiao et al., 2018). In similar years, the generation of KW was larger in high-income countries, for instance, the total amount in the European Union (EU) was 98 MT (Xu et al., 2018), and that in the United States of America (USA) was 63.1 MT (EPA, 2018; Kumar et al., 2021). MSS production was ∼36 MT (based on 80% moisture content) in 2016 (Han et al., 2017; Xie et al., 2017). Currently, the production of sludge solids in the EU and the USA are 10 MT and 7.2 MT, respectively (Oladejo et al., 2018; Syed-Hassan et al., 2017).
Nowadays, China has implemented large-scale source classification of MSW, which includes KW as wet waste. KW contains rice, noodles, oils, vegetables, meats, facial tissues, plastics, and other substances; thus, the content of water and organic matter in KW is high.
The moisture content of KW is above 75%. From the perspective of its microscopic chemical composition, KW predominantly contains inorganic salts, trace elements, and macromolecular organic matter such as starch and fat (Yang et al., 2017). Crude protein and crude fat in KW account for ∼20% and 28% on a dry weight basis, respectively (Wu et al., 2018; Yang et al., 2017). The physical and chemical properties of KW determine its characteristics of perishable spoilage. The carbohydrate content in MSS is high, whereas the amount of protein, fat, and other substances is relatively low. In addition, MSS also contains many nutrients that can be used by microorganisms, such as N, P, and K (Xie et al., 2017). The organic matter content of MSS is as high as 60–70% on a dry weight basis, and that of N, P, and K are also high at ∼40–90 g/kg (Li et al., 2018). If not appropriately treated, KW and MSS pose hazards to the ecological environment. Therefore, whether in China, the USA, or the EU, the reduction, safety, and resource treatment of KW and MSS have become an urgent problem to be solved (Edwards et al., 2017; Kacprzak et al., 2017).
The anaerobic digestion of organic waste is a highly sustainable process as it both reduces environmental pollution related to waste and generates energy in the form of biogas (such as hydrogen and methane) (Berninghaus and Radniecki, 2022; Edwards et al., 2017; Kacprzak et al., 2017). However, most anaerobic digestion studies have focused on low-solid-content waste (<15%), mesophilic (30–50°C) or normal temperature (<30°C) digestion, and methane production, with few studies on high-solid-content waste (>15%), thermophilic digestion (50–60°C), and the synergistic production of hydrogen and methane (Bjerg-Nielsen et al., 2018; Dhar et al., 2016; Giwa et al., 2021). Compared with the anaerobic digestion of waste with low solid content, dry anaerobic digestion (of waste with a high solid content) has many advantages, including a higher organic load rate (OLR), more efficient gas production per unit volume, and easier disposal of digestive residues in the form of fertilizer (Liu et al., 2021; Nguyen et al., 2016; Pagés-Díaz et al., 2018).
The temperature of anaerobic digestion is an important factor that determines the design of the digester, with thermophilic conditions more reliable for the anaerobic digestion of high-solid-content waste than mesophilic conditions, enhancing the aerobic digestion process and increasing the efficiency of the digester (Liu et al., 2017; Matsunami et al., 2017; Micolucci et al., 2018). Moreover, high-temperature (thermophilic) anaerobic digestion can influence the activity of enzyme hydrolysis and the types of microorganisms active during the process of anaerobic digestion, thereby overcoming some of the disadvantages of dry anaerobic fermentation, such as slow startup, a lower organic load, less gas production, poor operation stability, and more harmful bacteria (Grimberg et al., 2015; Hayes et al., 2022; Nguyen et al., 2016). However, there are currently few studies on the synergistic production of hydrogen and methane in a two-stage thermophilic anaerobic digestion system by the co-digestion of KW and MSS with a high solid content under different OLRs.
Based on several previous anaerobic serum bottle tests, this study employed two-stage anaerobic digestion devices to perform the collaborative anaerobic digestion of KW and MSS. By regulating the OLRs in the hydrogen-producing and methane-producing stages, respectively, the potentials of hydrogen production and methane production for mixed substrates of KW and MSS were studied to acquire the optimal gas production and contents of H2 and CH4. Furthermore, the removal ability of organic matter and bioenergy yields in the two-stage anaerobic digestion system were analyzed and assessed, respectively. Thus, combined with the results of the previous studies, it is expected that the findings herein can aid in achieving the optimal H2 and CH4 gas production and contents under appropriate OLRs, respectively, by co-anerobic thermophilic digestion of KW and MSS with a high solid content (∼20%).
Materials and Methods
Substrates and inoculum
KW was collected from the canteen of a university in Ningbo, China. The main ingredients of the KW were rice, cooked wheat food, vegetables, bean products, meat, and bones. After removing the impurities, such as paper towels, plastic, and bones, KW was crushed by a small grinder and stored in a refrigerator at 4°C for subsequent use (Supplementary Fig. S1a). MSS was taken from an urban domestic sewage treatment plant in Ningbo, China. The MSS was the dewatered sludge of secondary sedimentation tank after plate and frame pressure filtration and was in the shape of a hardened plate; it was crushed by the same grinder then stored in the same refrigerator at 4°C for subsequent use (Supplementary Fig. S1b).
The inoculation solution for anaerobic digestion was obtained from an anaerobic digestion tank in the laboratory. In the hydrogen-producing stage, the inoculation solution was treated thermally (100°C, 30 min) to inactivate methanogens. In the methane-producing stage, the inoculation solution was used directly. The main physical and chemical parameters of KW, MSS, and inoculum are shown in Supplementary Table S1.
Experimental design
The devices in the hydrogen-producing stage and methane-producing stage were all thermostatically controlled, airtight, anaerobic digestion reactors fabricated using plexiglass (Supplementary Fig. S2). Their effective volumes were 2.5 L (total volume of 3 L) and 8 L (total volume of 10 L), respectively. The tank parts all adopted a double-layer design, and the middle parts of the interlayer were arranged to circulate hot water to create the required thermophilic conditions for the digestion. Hot water was provided by an automatic temperature-controlled water bath and was transferred to the interlayers by a circulation pump; the temperature of the hot water was set to 55°C (as the operating temperature of the reactors). Solid waste samples were taken from the upper, middle, and lower sampling ports, which were all arranged on the side of the devices. The gas sampling ports of the two devices were arranged on the top part of the devices, and electronic temperature detectors were installed to display the digestion temperature of the two stages in real time.
Small motors located in the middle of the top of the two devices provided stirring. The stirring speed in the hydrogen-producing stage was 160 r/min, whereas that in the methane-producing stage was 150 r/min. Gases of the two stages were collected by the drainage method.
Experimental schemes
The experimental schemes were formulated based on the results of hydrogen production in previous serum bottle experiments.
In previous experiments, the material mass ratios of the KW and MSS (including 1:0, 1:1, 2:1, 3:1, 4:1, 5:1, and 0:1, calculated as volatile solids [VS]) were studied. The results showed that the production of hydrogen was optimal at a mass ratio of 3:1. Then, pretreatment method studies (including acid treatment, alkali treatment, and heat treatment) were conducted using the optimal ratio. The results indicated that hydrogen production through the heat pretreatment method afforded the best result. Subsequently, based on the previous two experiments, the initial pH of mixtures containing KW and MSS influence on hydrogen production was studied. Four initial pH values were considered: 4.0, 6.0, 8.0, and 10.0. The study results indicated that the hydrogen production was optimal when the initial pH of mixtures was 10 (Yue et al., 2018).
Pretreatment
In the hydrogen-producing stage and methane-producing stage, a high-temperature (55°C) anaerobic fermentation process was adopted. Reactors in the two stages were purged of nitrogen for 5 min to expel air. In the hydrogen-producing stage, the KW and MSS were mixed at a mass ratio of 3:1 (calculated as VS). The mixtures were heat treated (105°C, 35 min) by an autoclave and the total solid (TS) content was adjusted to about 20% (Sun, 2014).
Hydrogen-producing stage
The inoculum was added to the hydrogen-producing device, to make up to 5% of the device's effective volume, and the initial pH of mixtures containing KW and MSS was adjusted to 10.0. The feed was started after 2 days of device startup, the materials were fed and discharged once a day, and the OLR was gradually increased to 15 g VS/L·day in stages. The scheme of OLRs and the duration is shown in Table 1.
Scheme of Organic Load Rates and the Duration
OLR, organic load rate; VS, volatile solids.
Methane-producing stage
The inoculum was added to the methane-producing device, to make up to 5% of the device's effective volume, and residues after hydrogen production were fed after 15 days of acclimation. The materials were fed and discharged once a day and the OLR was gradually increased to 5.5 g VS/L·day in stages (Table 1).
The duration of each OLR was planned to be about 14 days, but the duration at subsequent feed loads was increased because too many parameters had to be tested throughout the experiment so that the control of durations was not so precise.
Sampling and analysis
The properties of substrates containing KW and MSS, and inoculum were analyzed experimentally, including pH, total carbon, total nitrogen, TS, VS, fat, and crude protein. All these were analyzed in the solid samples (MEEC, 2008), and air-dried samples (except pH in the latter). Fat was measured using the method for determination of fat in food set by the Standardization Administration of China (SAC) (SAC, 2016). Crude protein was measured using the method for determination of crude protein in feeds set by the SAC (SAC, 2018). The temperature of the injection port and detector (K626; Drick, Shandong, China) was maintained at 240°C during detection. For pH measurement, water extracted from the waste mixture, including KW, MSS, inoculum, and the interior sludge of the reactors, was prepared at a 1:10 waste:water ratio (w/v) stirred for 0.1 h and then centrifuged at 4,000 r/min. The pH was measured with a pH meter (S220-K; METTLER TOLEDO).
After the experiment started, solid samples and biogas were sampled every day, and all solid samples were measured in triplicate. Solid samples (∼50 g) were used for the analysis. Analytical methods of pH and VS are the same as above.
Biogas samples were collected in 300-mL aluminum foil airbags and the biogas content (H2 and CH4) was measured periodically every day by a gas chromatograph (SP2100; Beifen-Ruili, Beijing, China) equipped with a thermal conductivity detector with a Unibeads C 60/80 column (GL Sciences, Inc., Tokyo, Japan). Helium was used as the carrier gas. The temperatures of the injection port and the detector were 150°C and 80°C, respectively.
Statistical analysis
The Statistical Analysis System 19.0 for Windows was used for the variance analysis. The data analysis charts were drawn using OriginPro 9.1.
Results and Discussion
Gas production in the hydrogen-producing stage
pH value
Figure 1 shows the pH variation in the hydrogen-producing stage of the binary mixture of KW and MSS. The pH of the digestion system is a critical parameter that affects the anaerobic digestion process, where a pH within 5–6 is often deemed ideal to avoid over-acidification, maintain the stability of the acidogenic system, inhibit methanogenesis, and increase H2 generation (Jamil et al., 2013; Whitmore et al., 1987). When the OLR was 7.5 or 10 g VS/L·day, the pH in the hydrogen-producing stage was between 5.3 and 5.8. However, when the OLR was increased to 12.5 g VS/L·day, the pH suddenly dropped below 5 and fluctuated around 4.7. When the OLR was increased again to 15 g VS/L·day, the pH continued to decrease, fluctuating around 4.3, which reflected the easy acidification characteristics of the binary mixture of KW and MSS. Therefore, excessive OLR led to the accumulation of organic acids in the hydrogen-producing stage, resulting in a decrease in the pH of the system (Wang et al., 2022b; Xia et al., 2020).
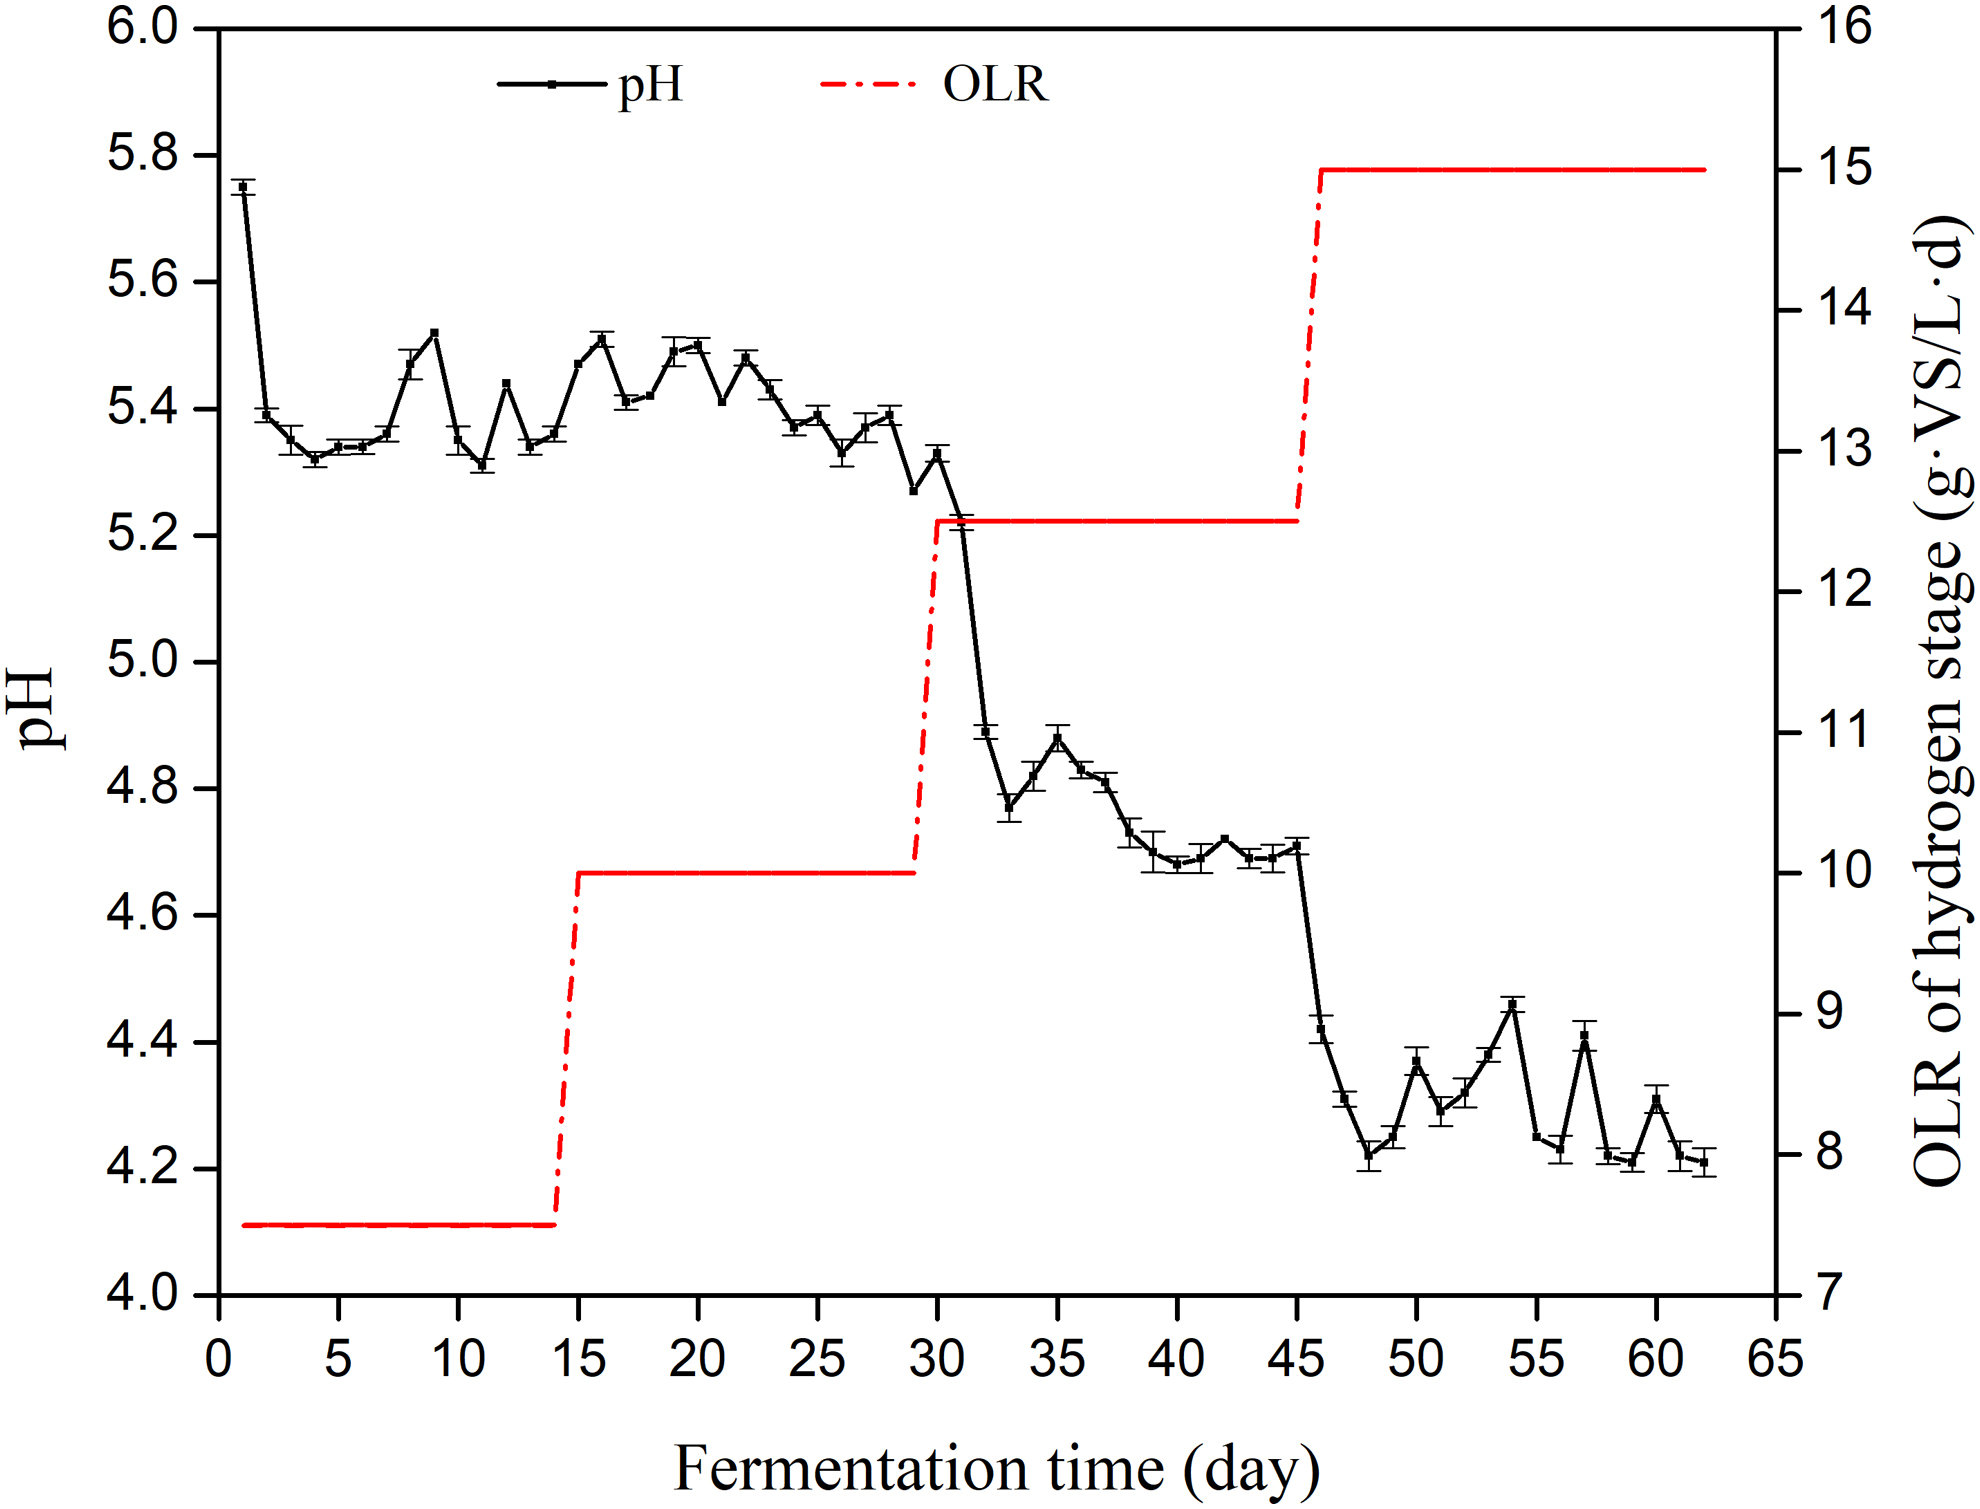
pH variation in the hydrogen-producing stage.
Hydrogen and gas production
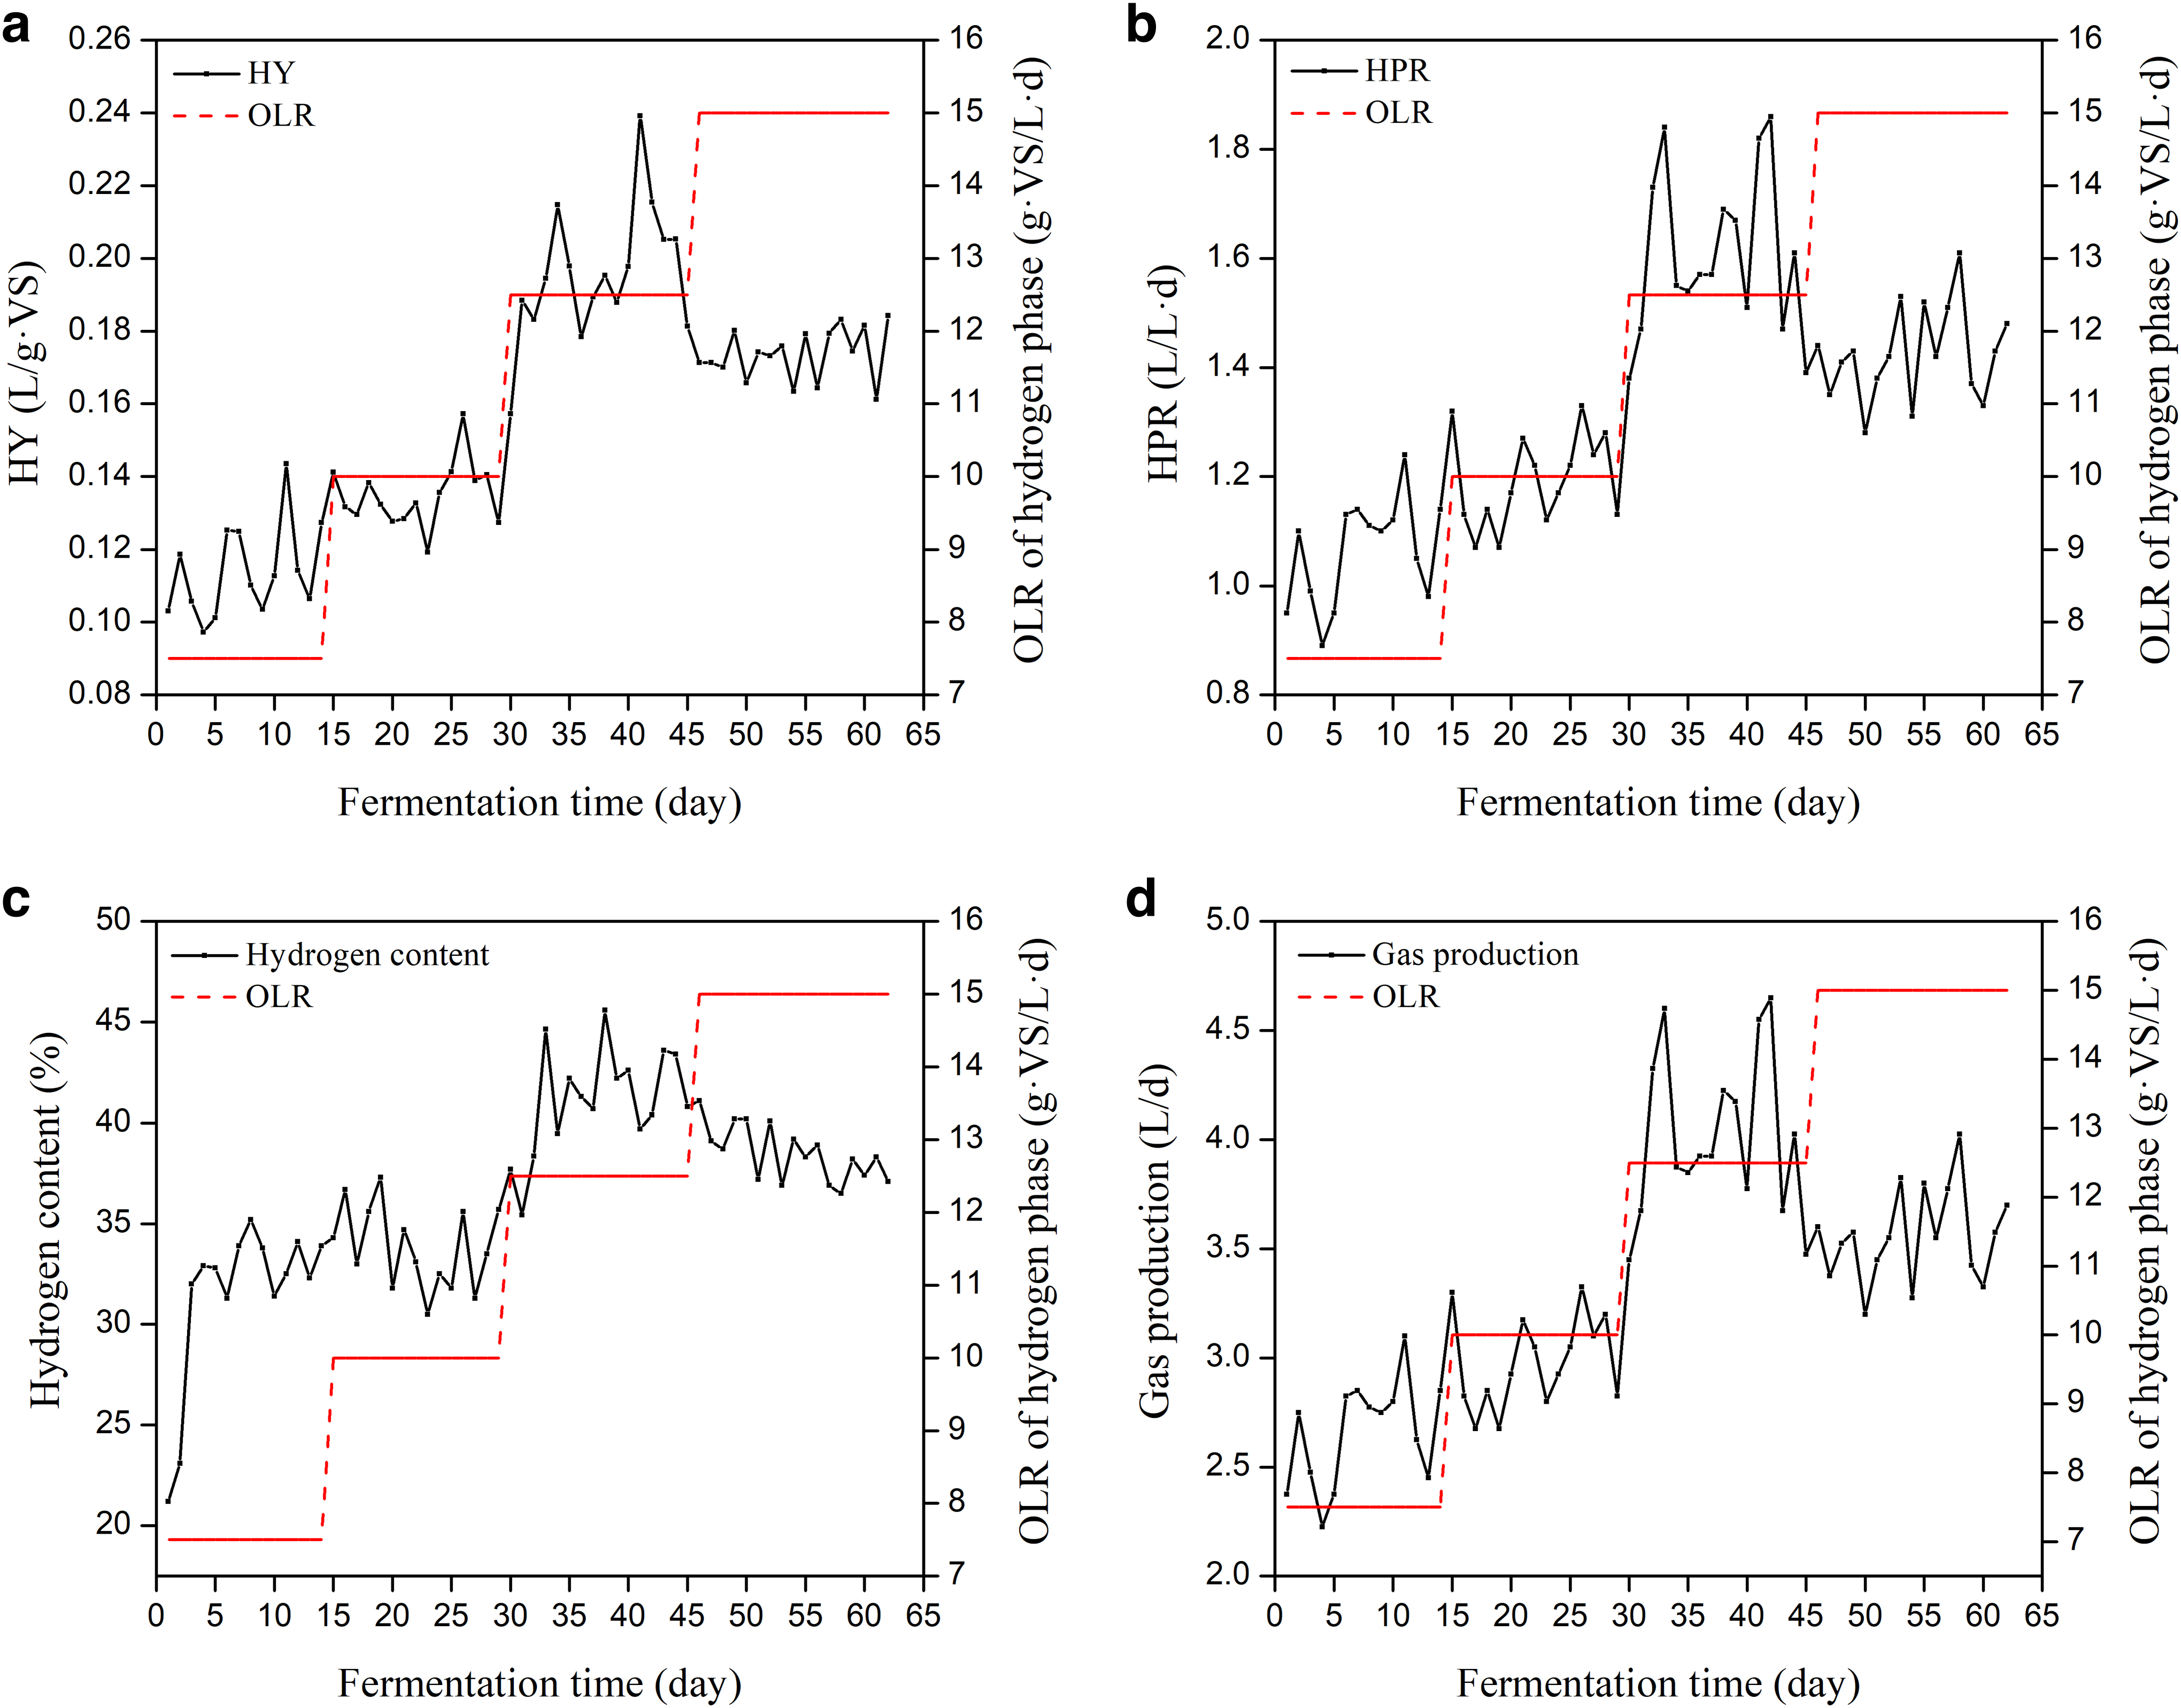
The hydrogen production rates (HPRs) according to the VS content and volume demonstrate the gas-producing efficiency per unit mass of VS and per unit volume, respectively. As a rule, HPR per unit mass of VS is called hydrogen yield (HY), and HPR of unit volume is just HPR (Liu et al., 2021). Figure 2a and b shows that HY and HPR exhibited similar changes with an increase in the OLR, indicating that the HPR increased when the OLR increased from 7.5 to 12.5 g VS/L·day, and was highest when the OLR was 12.5 g VS/L·day. Furthermore, HY rapidly declined when the OLR reached 15 g VS/L·day. The average HYs ranged from 0.11 to 0.20 L/g VS when the OLR increased from 7.5 to 12.5 g VS/L·day. At the initial stage of hydrogen production, the average HY increased with the increase in OLR until an OLR of 12.5 g VS/L·day, when it reached a maximum of 0.24 L/g VS.
HY
With further increase of the OLR, the average HY decreased, indicating that the OLR in the hydrogen-producing stage was too large to fully hydrolyze and acidify soluble organic matters at this stage, which affected the hydrogen production performance (Suwimon et al., 2017). In addition, the average HYs was 0.20 L/g VS with the OLR of 12.5 g VS/L·day, which was significantly higher than the previous studies (Liu et al., 2021; Silva et al., 2018).
After the hydrogen-producing stage operated for 29 days and the OLR was increased from 7.5 to 10.0 g VS/L·day, HPR fluctuated, but generally increased from 0.89 to 1.28 L/L·day. Therefore, the increase in OLR played a role in improving the hydrogen production performance in the two OLR stages, which can be regarded as the lifting period. When the hydrogen-producing stage continued to operate for 45 days, HPR increased significantly compared with the previous stages, reaching a maximum of 1.86 L/L·day, which indicated that the OLR at this stage was conducive to efficient and stable operation during the hydrogen-producing stage, which can be regarded as the stable operation period. When the hydrogen-producing stage ran continuously to 62 days and the OLR was 15.0 g VS/L·day, HPR was significantly lower than when the OLR was 12.5 g VS/L·day, owing to a reduced anaerobic digestion efficiency caused by the excess OLR, which can be regarded as the excess stage of OLR.
Furthermore, the average HPR was about 1.61 L/L·day with the OLR of 12.5 g VS/L·day, which was basically consistent with previous research findings results of 1.54 L/L·day (Suwimon et al., 2017). Therefore, an OLR of 12.5 g VS/L·day was the most beneficial for hydrogen production.
Figure 2c and d describes the gas production and hydrogen content in the hydrogen-producing stage per day. Similar to HPR according to the VS and volume, the hydrogen production and hydrogen content per day increased and fluctuated when the OLR was 7.5 and 10.0 g VS/L·day, respectively, and reached a maximum range (∼4.25 L/day and 42.5%, respectively) when the OLR was 12.5 g VS/L·day, before decreasing rapidly in the fourth OLR stage. The pH value was not in the optimal range (pH = 5–6); however, the optimal OLR was 12.5 g VS/L·day.
Gas production in the methane-producing stage
pH value
Figure 3 shows the variation in pH during the methane-producing stage for the residues after hydrogen production. pH values within 6.5–7.8 are often considered optimal values conducive to maintaining the stability of the methane-producing stage and yielding methane (Edgar et al., 2005; Pagés-Díaz et al., 2018). Under all four stages of OLR in the methane-producing stage, the pH values were within the optimal range during the experimental period of 62 days, except for day 52 (pH = 6.47) when the OLR was 5.5 g VS/L·day; however, the system adapted rapidly, and the pH value increased again. These results indicate that the system can run stably under all four OLR values. However, if the OLR continued to increase, the pH value might become lower than 6.5; thus, the methane-producing stage could become over-acidified and not beneficial to the production of methane. This is consistent with Liang et al. (2021).
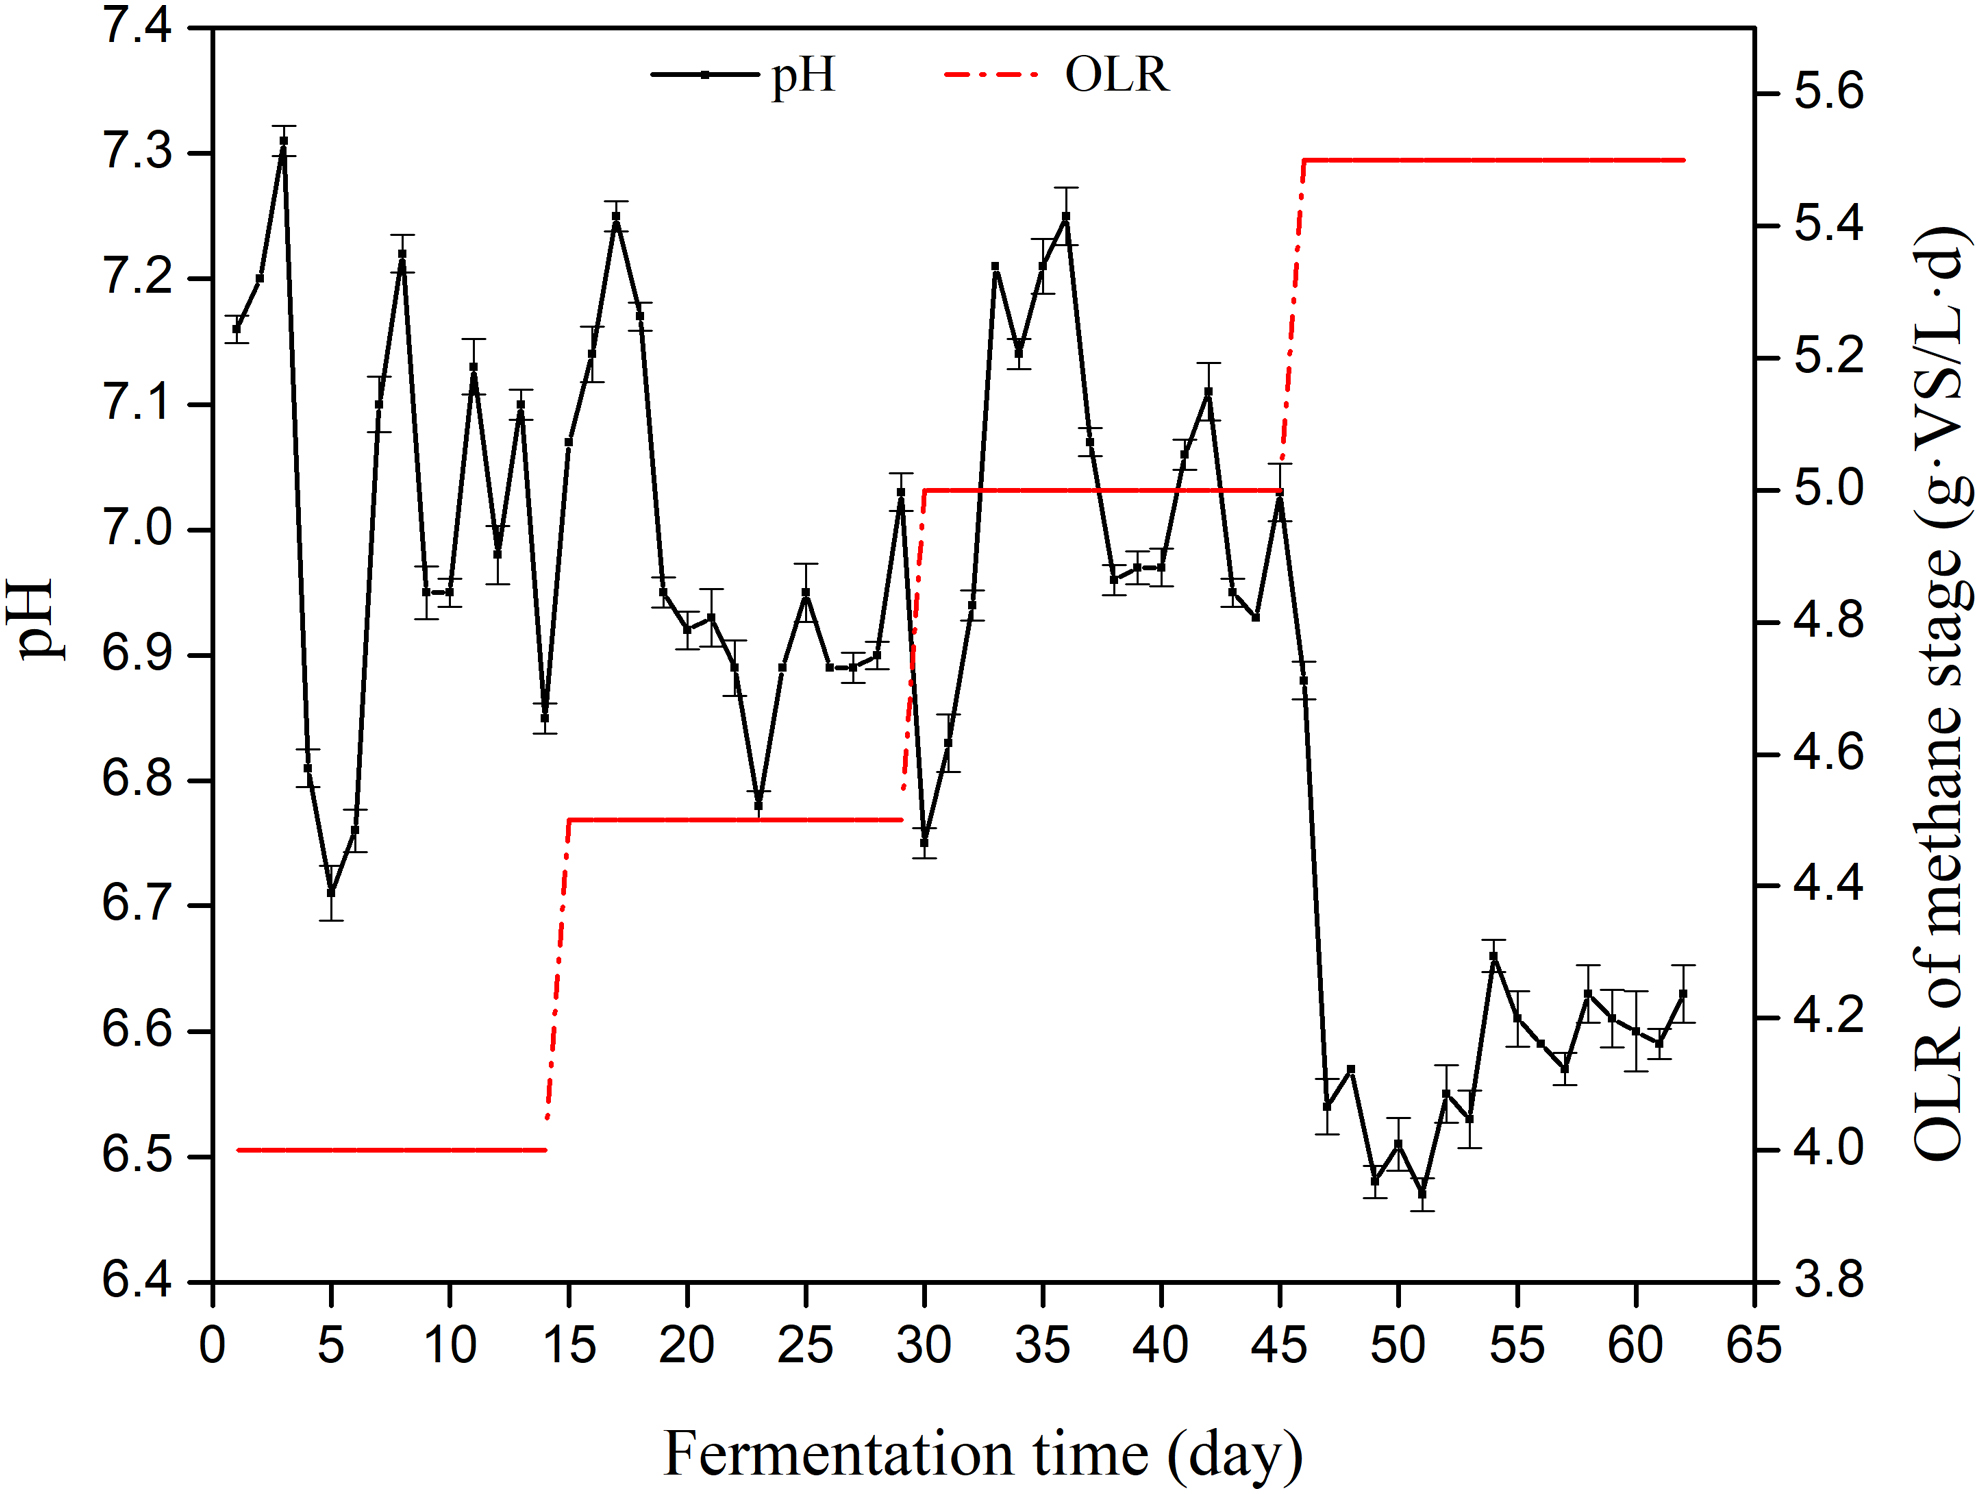
pH variation in the methane-producing stage.
Methane and gas production
Methane production rate (MPR) per unit mass of VS is called methane yield (MY), and MPR of unit volume is just MPR (Prajapati and Singh, 2020). Figure 4a and b shows that MY and MPR had similar change in rules with increasing OLR, indicating fluctuations in the methane production as the OLR increased from 4.0 to 5.0 g VS/L·day, reaching a maximum when the OLR was 5.0 g VS/L·day. Subsequently, the methane production decreased slightly when the OLR reached 5.5 g VS/L·day, indicating that this OLR might have an inhibitory effect on methane production. The average MYs were 0.56, 0.66, 0.73, and 0.65 L/g VS from the first to the fourth OLR stage, respectively. When the OLR was 5.0 g VS/L·day, the average MY reached a maximum 0.73 L/g VS, indicating that the OLR at this time was the most conducive to methane production, and the average MYs in all four OLR stages were obviously higher than the previous experimental results (Liu et al., 2013; Silva et al., 2018).

MY
During the first three OLR stages, the average MPR continuously increased and fluctuated from 1.71 L/L·day to ∼3.54 L/L·day, with a maximum of 3.82 L/L·day, which showed that the methanogenic microbes could quickly grow and multiply after rapid adaptation to the three OLR stages, and the gas production capacity was greatly enhanced. When the OLR was 5.5 g VS/L·day, the MPR declined, but was still higher compared with the first two OLR stages. This indicates that, although this OLR was larger and could partially inhibit microbial activity (Sun et al., 2022), it still resulted in a higher MPR. Even more, the average MPR of 3.54 L/L·day in the third OLR stage (5.0 g VS/L·day) was far higher than the experimental results of about 0.66 L/L·day (David et al., 2018), and similar to the results of 3.10 L/L·day (Wang et al., 2020).
Figure 4c and d illustrates the gas production and hydrogen content in the methane-producing stage. Consistent with the change in gas production rate per unit volume, during the first three OLR stages, gas production also continuously increased and fluctuated from 11.9 L/day to ∼23.5 L/day, with a maximum of 26.8 L/day. When the OLR was 5.5 g VS/L·day, the gas production per day declined, but was greater than that in the first two OLR stages. However, in the second OLR stage, the hydrogen content was significantly higher compared with the other three stages, with a maximum value of 49.5%, indicating that the OLR in the second stage was more beneficial for converting the organic substances contained in residues after hydrogen production into methane. However, the maximum value of 49.5% was still significantly lower than the previously reported values of 60–70% (Linville et al., 2017; Zahedi et al., 2016; Zhen et al., 2016). Therefore, a higher OLR did not necessarily lead to more efficient methane conversion in this experiment; thus, it is necessary to improve methane conversion efficiency under higher OLRs in future research.
VS removal rate and energy yield in the two stages
The VS removal rates in the hydrogen-producing stage were significantly higher than those in the methane-producing stage, as shown in Fig. 5a. This illustrates that the large amounts of organic substances that constitute the binary mixtures of KW and MSS participated in the biochemical reactions of hydrolysis, acidification, and degradation in a remarkably short period of time (2 days), were converted to H2, CO2, and other matter, then accumulated numerous substrates for the methane-producing stage (Wood et al., 2021).

VS removal rate
In the first three OLR stages of the hydrogen-producing and methane-producing stages, the VS removal rates increased with an increase in the OLR. In the fourth stage, the VS removal rates in both decreased significantly, indicating that the two OLRs were excessive and exceeded the processing capacity in the two stages. In the third OLR stage of the two stages, the average VS removal rates reached a maximum of 36.7% and 25.3%, respectively, and the total VS removal rate in the two stages was 65.4%. The total removal rate was closely in agreement with previous findings (Giwa et al., 2021; Wang et al., 2022a).
To comprehensively analyze the effectiveness of the two stages for generating biomass energy under different OLRs, the biogas produced in each stage was converted into a calorific combustion value in the standard state (at 20℃ and one atmospheric pressure). The result, shown in Fig. 5b, indicates that the vast majority (more than 92%) of biomass energy originated from the methane-producing stage, other than from the hydrogen production stage, under different OLRs. These were confirmed by previous studies (Sunyoto et al., 2016; Zhu et al., 2008). Total biomass energy varied from 23.0 to 30.9 kJ/g VS, with the maximum (30.9 kJ/g VS) occurring in the third OLR stage, which was absolutely higher than the previous findings (Kim et al., 2013; Nipon et al., 2014). The results indicate, under these substrate conditions, biomass energy recovery is more efficiently obtained in a two-stage thermophilic anaerobic digestion system by co-digestion of KW and MSS with a high solid content.
Therefore, in terms of the experimental data, the third OLR stage exhibited the optimal results, that is, total biomass energy production, VS removal rate, methane content, gas production rate per unit mass of VS and per unit volume, etc. If the methane conversion rate can be further improved in the third OLR stage, the biomass energy can be further increased; and if the technical and economic analysis of the two-stage thermophilic anaerobic digestion system is carried out, this study would be more meaningful.
Conclusion
In this study, the gas production rates per unit mass VS and per unit volume, VS removal rates, and energy yields in the hydrogen-producing and methane-producing stages were optimal under a higher OLR (OLR = 12.5 g VS/L·day in the hydrogen-producing stage and OLR = 5 g VS/L·day in the methane-producing stage). Under these two OLR conditions, the average VS removal rate and total energy yield of the entire anaerobic digestion system were also optimal (65.4% and 30.9 kJ/g VS, respectively). This indicates that the separation of the hydrogen-producing stage and methane-producing stage may be suitable for treating binary organic mixtures of KW and MSS with high pollution potentials and beneficial for producing biogas energy through anaerobic co-digestion under a higher OLR.
If the methane conversion rate can be further improved at higher OLR stages, the biomass energy could be further increased, which could become the focus of future research. Hydrogen production and methane production in the process of anaerobic fermentation are all dominated by their own functional microorganisms. Thus, identification and analysis of those functional microorganisms should be conducted in further research to gain a firm understanding of the process underlying biogas production and two-stage thermophilic anaerobic digestion. This study provides the basis for material mass ratio, mixture pretreatment, and operation control for future pilot tests.
Footnotes
Authors' Contributions
Author Disclosure Statement
No competing financial interests exist.
Funding Information
This work was supported by the One Health Interdisciplinary Research Project, Ningbo University (HY202203).
References
Supplementary Material
Please find the following supplemental material available below.
For Open Access articles published under a Creative Commons License, all supplemental material carries the same license as the article it is associated with.
For non-Open Access articles published, all supplemental material carries a non-exclusive license, and permission requests for re-use of supplemental material or any part of supplemental material shall be sent directly to the copyright owner as specified in the copyright notice associated with the article.