
Abstract
Supersaturation of total dissolved gas (TDG) is a common occurrence in high dams during the spill process, which can lead to fish bubble disease and threaten aquatic organisms. As a result, many scholars have taken a keen interest in this issue. Research into the gas-liquid mass transfer mechanism has improved the accuracy of TDG prediction models. This article investigates the factors affecting TDG dissipation through laboratory experiments. Especially, the mass transfer coefficient across the bubble interface based on the slip penetration model was calibrated, and the coaxial bubble coalescence added to the coefficient was studied. The results show that the aeration rate has the most significant impact, followed by water depth, and then the aeration aperture. The TDG dissipation rate increases with the parameter β, and the parameter of 0.35 shows the highest correlation with the experimental data. Furthermore, the concentration change rate after coalescence is lower than before, suggesting that aggregation negatively impacts mass transfer. This study improves TDG concentration prediction accuracy and proposes measures for mitigating supersaturation to avoid fish bubble disease.
Introduction
Dissolved gas is a common phenomenon in the natural environment. The presence of total dissolved gas (TDG) in the ecological environment can affect the biodiversity of fish in rivers and other water bodies (Pleizier et al., 2020). Water naturally contains dissolved gases such as oxygen, nitrogen, and carbon dioxide, collectively known as TDG. Each gas has a different solubility rate in water, leading to varying rates of dissolution. TDG supersaturation occurs under specific conditions such as increased water temperature, photosynthesis, or dam spillage (Kamal et al., 2020; Lin et al., 2022; Shen et al., 2014), where the TDG concentration may exceed the equilibrium concentration at a given temperature and pressure, leading to TDG supersaturation. TDG supersaturation due to dam discharge has become more frequent recently as a result of the ongoing construction of cascade hydropower stations.
This phenomenon is particularly prevalent in the middle and lower reaches of high dams, where levels of supersaturation can exceed 140% saturation (Lu et al., 2021; Pulg et al., 2018). If aquatic organisms inhale an excessive TDG, it can cause emphysema, tissue bleeding, and even death, significantly impacting the aquatic environment (Weitkamp and Katz, 1980). Therefore, the study of TDG is very important for the river's ecological environment.
Previous research has investigated TDG supersaturation in two-phase liquid. However, the ecological environment downstream is still at risk due to the construction and operation of high dams (Cao et al., 2019; Wan et al., 2020). It's generally accepted that the development of an accurate prediction concentration model can help mitigate TDG supersaturation and facilitate the construction of environmentally friendly hydropower projects (Heddam et al., 2020). Research on TDG supersaturation in two-phase liquids focuses on the source term of the transport equation, which is defined as the sum of bubble-liquid and free-surface mass transfer (Feng et al., 2013). Bubble-liquid mass transfer coefficients are typically expressed using several equations (Geldert et al., 1998; Takemura and Yabe, 1998; Thompson et al., 1997), and the free-surface coefficient also has some typical expressions (Cheng et al., 2009; Duan et al., 2010; Lamont and Scott, 1970).
Nevertheless, the universality of mass transfer coefficients is poor due to the use of numerous original observations. To improve this point, a sensitivity analysis that includes a dimensionless parameter β in the mass transfer formula was proposed (Ou, 2019; Wei, 2013; Yang et al., 2017). Nevertheless, the gas-liquid mass transfer coefficient is typically based on the eddy cell model, which may not accurately represent turbulent flow conditions in high-turbulence regions (Wang et al., 2007). Higbie (1935) proposed the penetration model in 1935 and has been widely applied in various turbulence compared with the eddy cell model (Wei et al., 2015).
Previous studies showed that the slip penetration model has a good prediction for mass transfer in bubble column experiments (Guo et al., 2017; Pohorecki et al., 2001; Yang et al., 2018). The mass transfer coefficient is meaningful for calculating TDG. However, a few studies investigated the sensitivity analysis of the mass transfer coefficient in the slip penetration model.
TDG generation occurs with the coalescence of bubble clusters, making their existence crucial. Current studies of bubble rise coalescence mainly focus on coaxial and noncoaxial bubbles. Chesters and Hofman (1982) established the model for two spherical bubbles and discussed the bubble interface parameters. Anwar (2019) studied coalescence-shape characteristics and found that bubbles assume a dumbbell shape upon contact, and the forms would gradually evolve into an independent bubble with the increase of the drainage channel. Researchers also studied the coalescence characteristics using a numerical simulation method (Liu et al., 2014; Shi et al., 2011). Therefore, studying bubble coalescence behavior in water is essential. Dissolved gas saturation can exceed 120% when the TDG is generated (Wang et al., 2020; Yuan et al., 2018), leading to bubbles in supersaturated water.
Thus, there is a need for more research on the coalescence of supersaturated TDG. This article discussed the effect of aggregation on TDG dissipation, considering the importance of understanding the coalescence of bubbles in supersaturated water.
In this study, the concentration prediction model is based on the slip penetration model, wherein the bubble-liquid mass transfer coefficient is determined by the slip velocity and bubble size. To enhance the analysis, the sensitivity analysis method is applied by incorporating a dimensionless parameter β into the model. Furthermore, the relationship between bubble coalescence and mass transfer was investigated by adding the parameter to the coaxial bubbles can research.
Material and Experiment
Experimental approach
As shown in Fig. 1, the TDG device consists of two main components: the TDG generator and the TDG dissipator. The generator has a height of 1.3 m and a diameter of 0.6 m, and it includes a carbon-steel high-pressure vessel, bracing rings, a pressure gauge, and a Venturi tube. The vessel is equipped with three-spaced windows of varying heights, with one air inlet and one water outlet positioned 10 cm above the vessel's bottom. In addition, four control valves are situated at the top of the vessel. The dissipator is made up of acrylic boards, measuring 550 mm in length, 440 mm in width, and 2000 mm in height, and includes a pinhole tray aerator located 20 cm from the bottom of the tank.

Experimental device of TDG.
Three experimental factors are discussed, including aeration aperture, water level, and aeration rate. The tray aeration aperture sizes are 0.6, 0.9, and 1.2 mm, while the aeration rates are 0.5, 1.0, 1.5, and 2.0 m3/h. Water levels are 0.4, 0.8, and 1.2 m. In total, 36 experiments are conducted.
Methods of numerical simulation
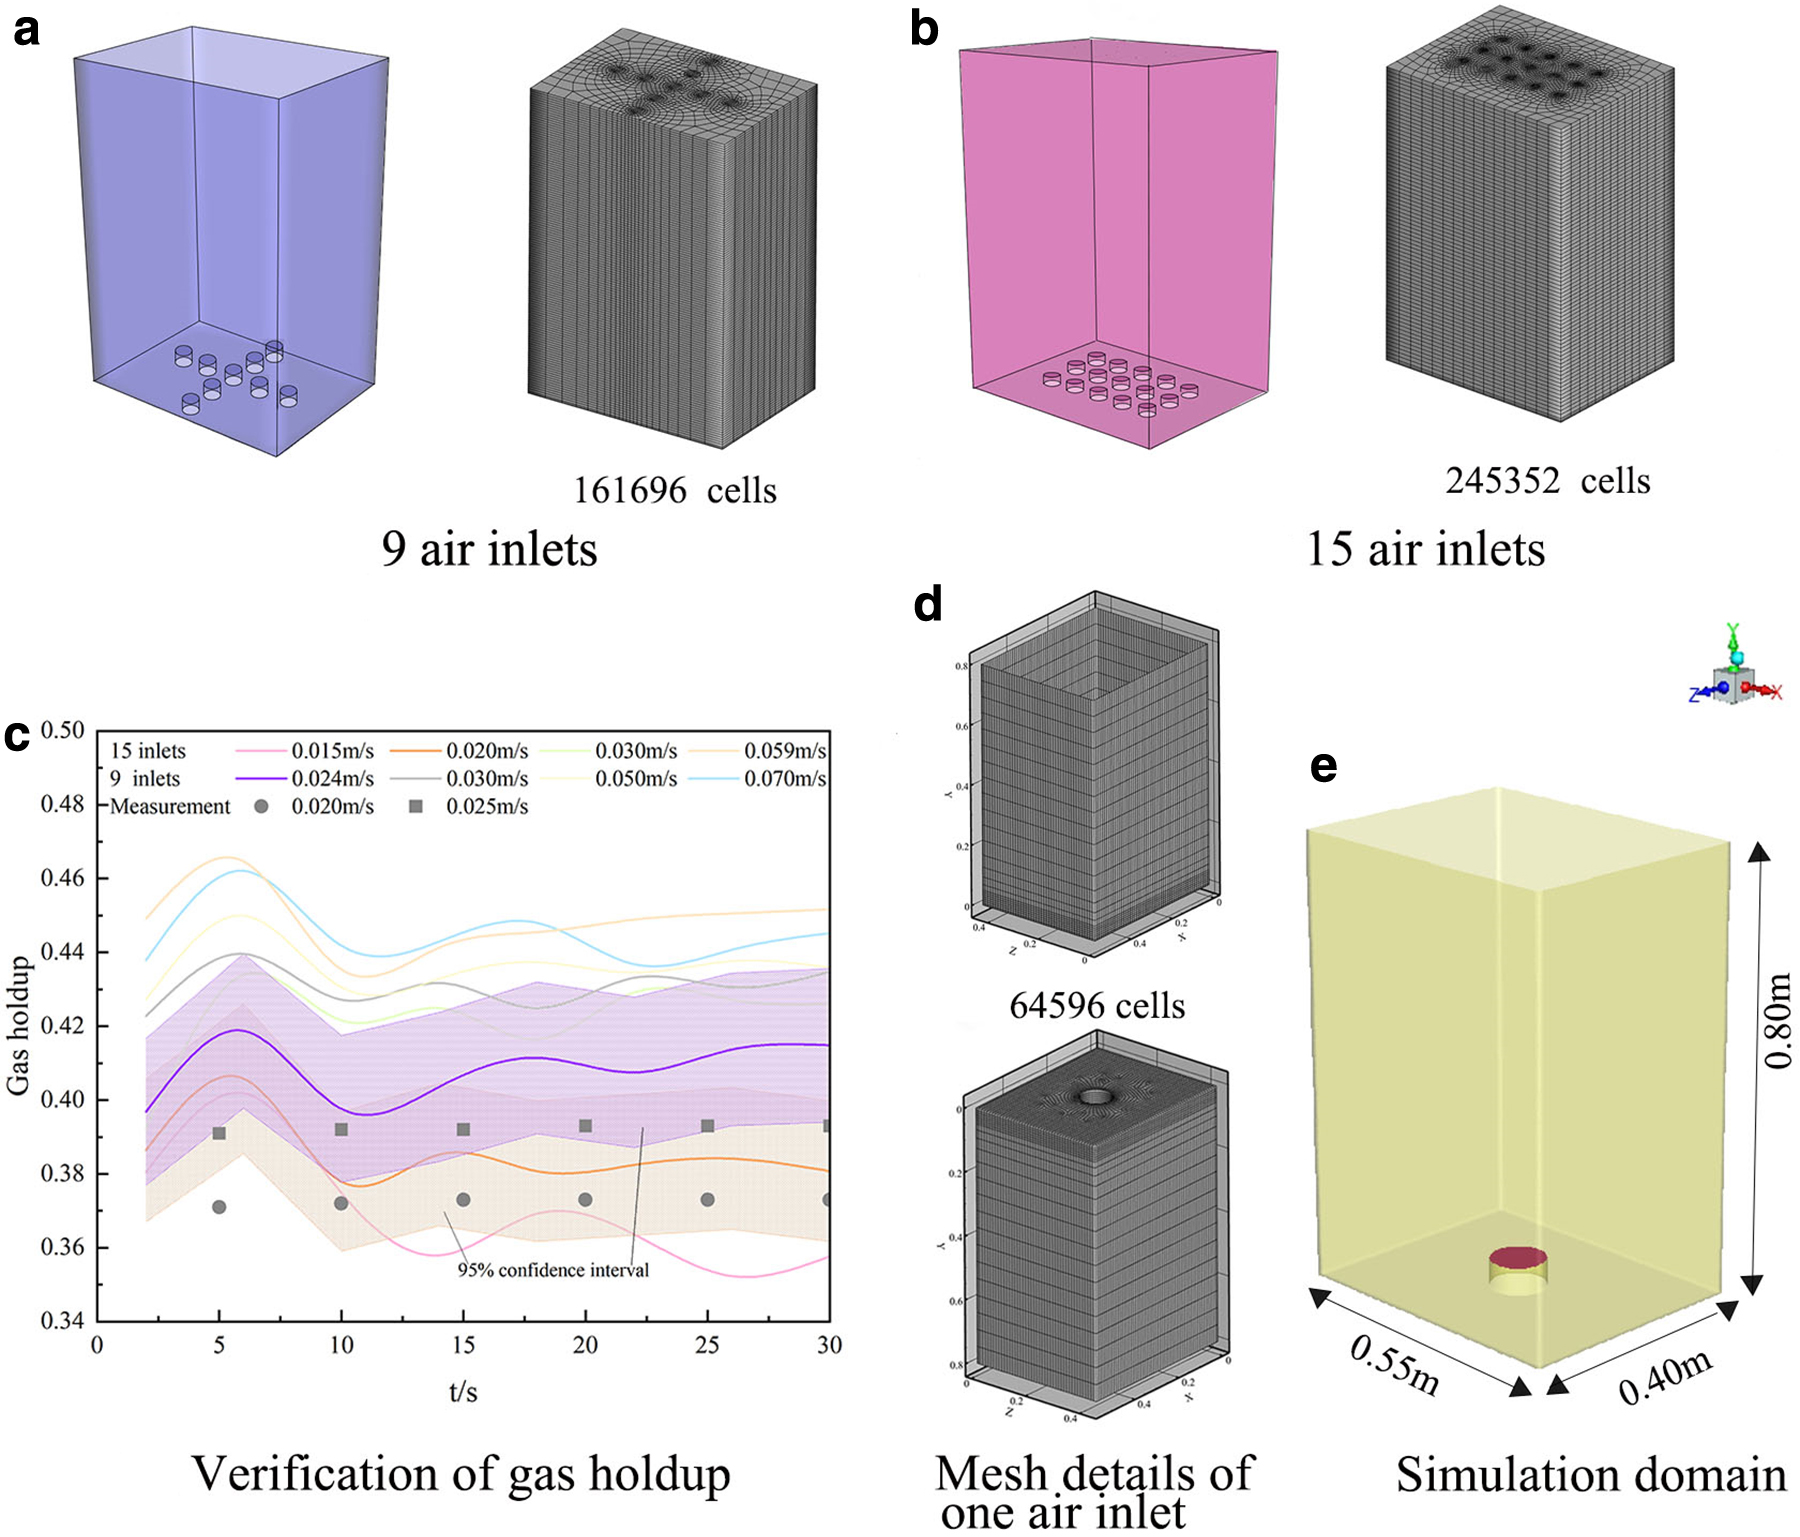
The gas holdup is an essential factor that reflects the gas-liquid contact state and influences gas-liquid mass transfer (Shah et al., 2012), so it is used as a verification factor for the numerical simulation in this study. Figure 2a and b illustrate 9 and 15 inlet calculation models, respectively. Figure 2c shows the verification of gas holdup at various inlet velocities. The static pressure method was used to measure gas holdup every 10 s, taking the average value of the three measurements. The experimental values (at inlet gas velocities of 0.020 and 0.024 m/s) were compared with the numerical simulations (at inlet gas velocities of 0.020 and 0.025 m/s). The experimental values were within the 95% confidence interval of numerical simulation.
Numerical simulation.
In addition, the gas holdup (at these two gas velocities) is basically in the range of 0.3–0.4, which is close to the simulation of (Fan, 2018) (at inlet gas velocities of 0.015 and 0.030 m/s, respectively). It can be concluded that the simulation models exhibited a reasonable degree of agreement with the experiments, with gas holdup differences between simulation and experiment being <5% for both the 15- and 9-inlet cases, where the inlet gas velocities were ∼0.020 m/s. Moreover, gas holdups increased initially, decreased over time, and stabilized, and the superficial gas velocity was found to be proportional to gas holdup.
When the inlet gas velocities are concentrated at 0.020 m/s (with 9 inlets at gas 0.024 m/s and 15 inlets at 0.020 m/s), the gas holdup of the two models is very similar, indicating the feasibility of simplifying the inlet. In addition, the two models had over 150,000 cells (Fig. 2a, b), significantly increasing the calculation time. To reduce the simulation level, the pinhole of the air inlet is simplified to a center section, resulting in a model with about 64,596 cells that has significantly improved computational efficiency. This approach has been adopted by other researchers (Xiao, 2014; Xing, 2014). The percentage of gas holdup in the liquid phase was high due to the mixing process of the Venturi tube. Therefore, the Eulerian method was used to analyze the mass transfer mechanism. The mesh details are shown in Fig. 2d, and the boundary condition is displayed in Fig. 2e.
Hydrodynamics equations
Fluid mechanics follow the fundamental law of mass conservation, momentum, and energy conservation. According to the principle of conservation of mass and momentum, the rate of change of the system with respect to time is equal to the net flow rate of mass and momentum into and out of the control volume (Wei and Ye, 2010). Energy conservation can be ignored as there is no heat transfer involved.
The continuity and momentum equations are shown as follows (Shen et al., 2019):
where i is the phase name,
Where
where l represents the liquid phase,
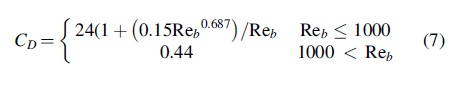
This article focuses on the drag force as the main interaction between the liquid and air phases, which can be calculated using the Schiller and Naumann model (Schiller, 1933).
where
and
This article considers RNG
where Gk represents the production of turbulence kinetic energy:
Gb is the generation of turbulence kinetic energy due to buoyancy, calculated as:
where a
Significantly, the eddy viscosity in the RNG
Transport model
The transport model for TDG supersaturation was proposed by Weber and Mannheim (1997).
where C (%) is the TDG saturation,  is the source term.
The transfer process includes that bubble liquid and free surface so that the source term can be expressed.
where
where
The mass transfer coefficient across the bubble interface
where β is a dimensionless calibration coefficient as a primarily academic focus,
The area as the ratio of the total area of the entrained bubbles to the total volume of the mixture aB can be expressed with gas holdup, and Sauter means diameter.
where the gas holdup can be expressed as 0.004,
where kl (m2/s2) is the turbulent kinetic energy of the liquid phase, V (m3) is the volume, and
The source term is compiled with the user-defined file and solved in Fluent 19.0 by adding it to the TDG transport model.
Dissipation coefficient
A one dimensional model for the supersaturated TDG dissipation process follows the first-order kinetics theory (Engineers US, 2005).
The formula of deformation is as follows:
where Gt (%) is the TDG saturation at time t, G0 denotes the percent saturation of TDG initially,
Boundary and initial conditions
The boundary conditions are depicted in Fig. 2e. The velocity inlet was applied to maintain a constant aeration rate, while the degassing outlet was used to model a free surface, allowing gas bubbles to escape. The modeling and solving methods were based on Fluent 19.0, and the default settings were used globally. The initial conditions included a TDG saturation of 138.5%, with turbulent kinet ic energy and turbulent dissipation rate set to 0, and an air volume fraction of 1. The time step was set to 0.001 s, and the solving time was 100 s, resulting in 100,000 iteration steps.
Results and Discussion
Analysis of experimental data
As shown in Fig. 3, TDG saturation levels gradually decreased with time. The dissipation rate increases with decreasing pore size and water level (Fig. 3a, b), while it decreases with increasing aeration rate (Fig. 3c). Based on the bubble interface transfer theory (Zhao et al., 2003), a small diameter aerator could increase aB [Eq. (20)] and the mass transfer coefficient across the bubble interface [Eq. (19)], thereby enhancing the transfer rates. Water level directly affects the bubble size. Increasing the water level reduces the bubble size and increases the total contact area between the bubble and water (Li, 2007), thereby increasing the transfer rate. Lee (2018) also proposed that increasing the water depth prolongs the contact time of the bubble and water, which promotes gas depletion in the water.

Relationship between TDG and impact facts.
The transfer rate increases with an increase in the aeration rate, and a strong positive correlation between the aeration rate and transfer coefficient was reported by Fan et al. (2017). The increase in the aeration rate indirectly enhances the contact area of the bubble and water, while also strengthening the degree of turbulence. According to the surface renewal theory (Danekwerts and Kenndy, 1958), turbulence in the liquid phase can replace old vortices on the internal surface and provide a new cover for the gas phase, leading to an increase in the degree of water turbulence and an acceleration of the transfer rate.
To analyze the entire experimental data, the cases can be divided into 36 categories based on the aperture size. Figure 3d and e illustrate the results obtained with an aperture of 0.6 mm, while the other aperture sizes are shown in the Supplementary Fig. S1. During the experiments, the TDG saturation level decreased from 137.5 ± 2.5 to 107.5 ± 2.5 within 30 min in most cases.
Previous studies have indicated that the dissipation process of supersaturated TDG is lengthy and complicated (Feng et al., 2014; Qu et al., 2011; Wang et al., 2019). Li et al. (2013) observed that turbulent acceleration dissipation was not significant when the stirrer speed was less than 400 rpm, and it took ∼2 h for the TDG saturation to change from 140 to 110. Shen et al. (2014) reported that the dissipation process in the hydrostatic column can take up to 24 h. These results demonstrate that an aeration is an effective tool for promoting TDG dissipation.
Referring to the dissipation formula [Eq. (23)], Fig. 3e shows the linear correlation between TDG dissipation and time [Eq. (24)]. Table 1 presents 36 dissipation results, indicating a direct correlation between the natural logarithm of TDG and time, as the entire square sums of the linear regression are >0.9. Comparing different water levels, apertures, and aeration rates, TDG dissipation decreased by 30%, 50%, and 300%, respectively. Thus, the aeration rate has the highest influence, while the water depth has the lowest. Therefore, the most influential factor is the aeration rate, and this conclusion can be used as a reference for small-scale experiments due to the limited cases.
Linear Fitting of Dissipation Coefficients of 36 Experiments
Application of the dissipation coefficient in numerical simulation
Calibration parameter β of the concentration prediction model
Regarding TDG prediction models, previous research has produced complex and limited formulas. However, the TDG saturation is closely linked to the source term [Eq. (17)], with saturation levels over 120 having a substantial impact. To enhance prediction model accuracy, a calibrated dimensionless parameter β can be added. In this study, the duration of TDG dissipation in supersaturated water was set to 100 s. Figure 4a shows the distribution of TDG saturation at the slice position for a dimensionless parameter value of 0.35, with TDG concentration ranging from 133.45% to 133.90%. As indicated in Fig. 4b, our findings that the TDG dissipation rate increases with the parameter. Ma et al. (2016) and Yang et al. (2016) examined this parameter and also had the same conclusion. Wan et al. (2021) also utilized this parameter to calibrate TDG levels.

Calibration parameter with numerical simulation and experiment from t = 0 s to t = 100 s.
This study is based on the slip penetration model, which aligns well with bubble column experimental results (Zhang et al., 2017). Finally, we compared TDG concentrations with different parameter values and experimental data and found that the best fit for the experiment occurred when the parameter was 0.35.
When observing the three cross-section planes at x = 0.15 m, x = 0.45 m, and x = 0.75 m, the gas phase distribution radius is found to be similar (see Fig. 5a, b). Figure 5c illustrates that the gas holdup saturation is higher near the inlet and the overall distribution is symmetrical. As the distance in the y direction increases, the gas holdup changes significantly, with a difference of 10% between the inlet and outlet. This is because, the molecular diffusion coefficient increases significantly with the flow rate, and the diffusion coefficient is positively correlated with the diffusion rate (Kamholz et al., 2001). Consequently, the diffusion effect in the vertical direction is more significant than that in the horizontal direction. This explains the strong mass transfer effect of the interface near the air inlet.
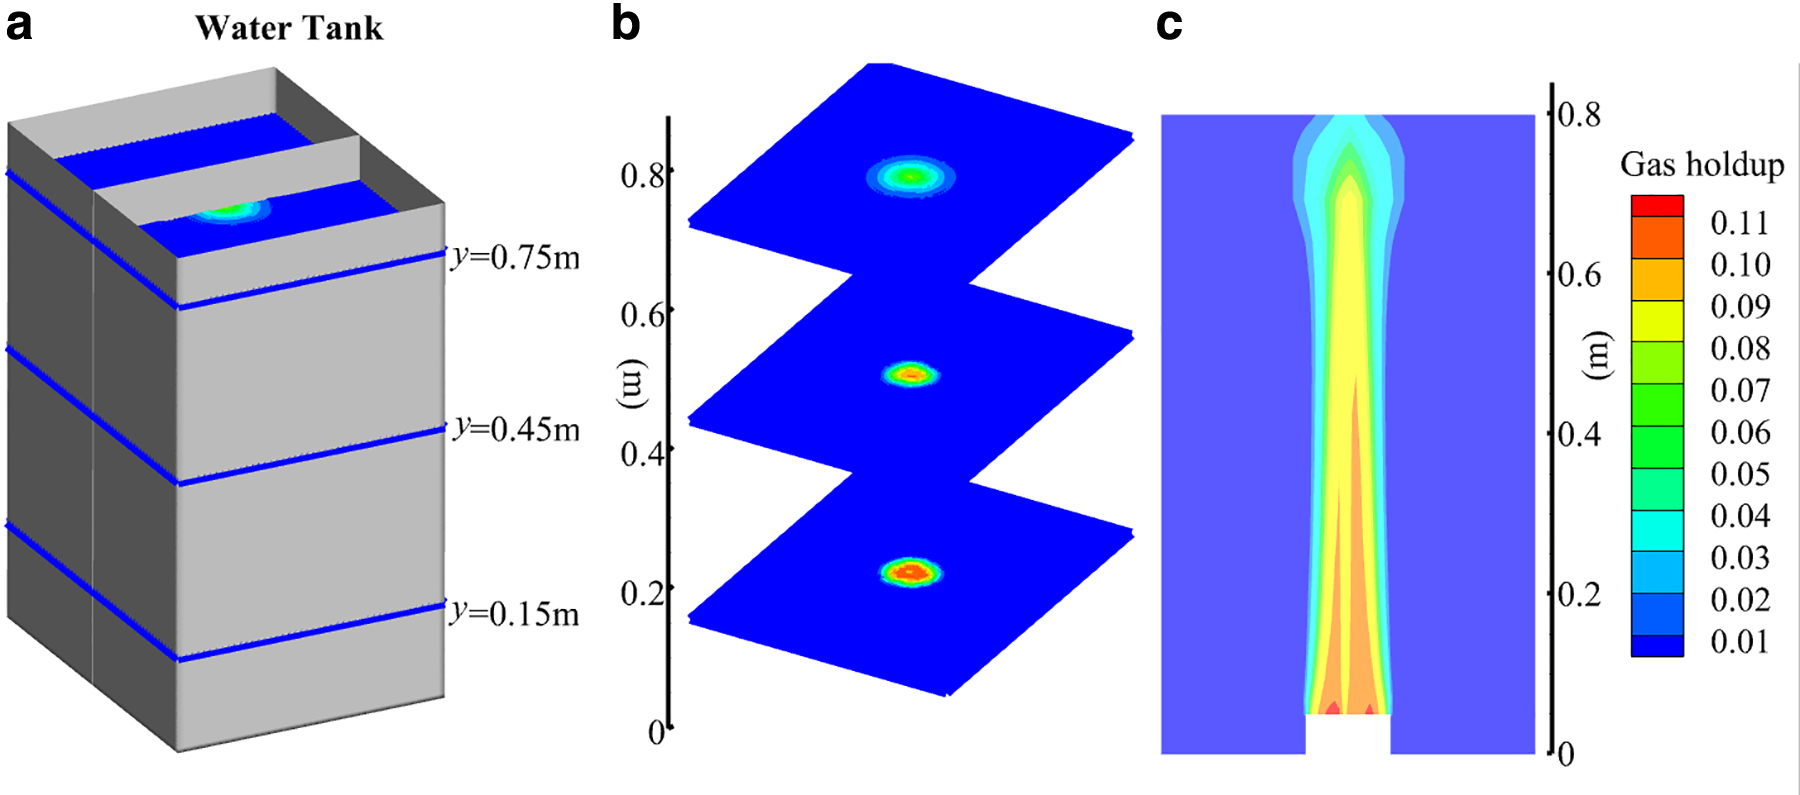
Gas holdup distribution at t = 100 s.
Figure 6a shows that the y-direction velocity near the central axis is higher, reaching a maximum of about 1 m/s, while the velocity near the wall is lower, sometimes even zero. The maximum speed in the x direction is much lower than that in the y direction. In previous experiments (Behnoosh et al., 2009), researchers found that gas velocity increases with gas holdup because higher gas holdup produces more buoyancy (Kim et al., 2017). In this study, the central axis region has a higher gas holdup saturation, resulting in higher velocities than in other regions. As the liquid is squeezed, two velocity vortices are formed around the upper and lower bubbles (Fig. 6b). Lin et al. (2009) and Sun and Jia (2017) also observed this liquid vortex phenomenon and noted that bubble size can affect the squeezing effect and rising velocity in the wake region.
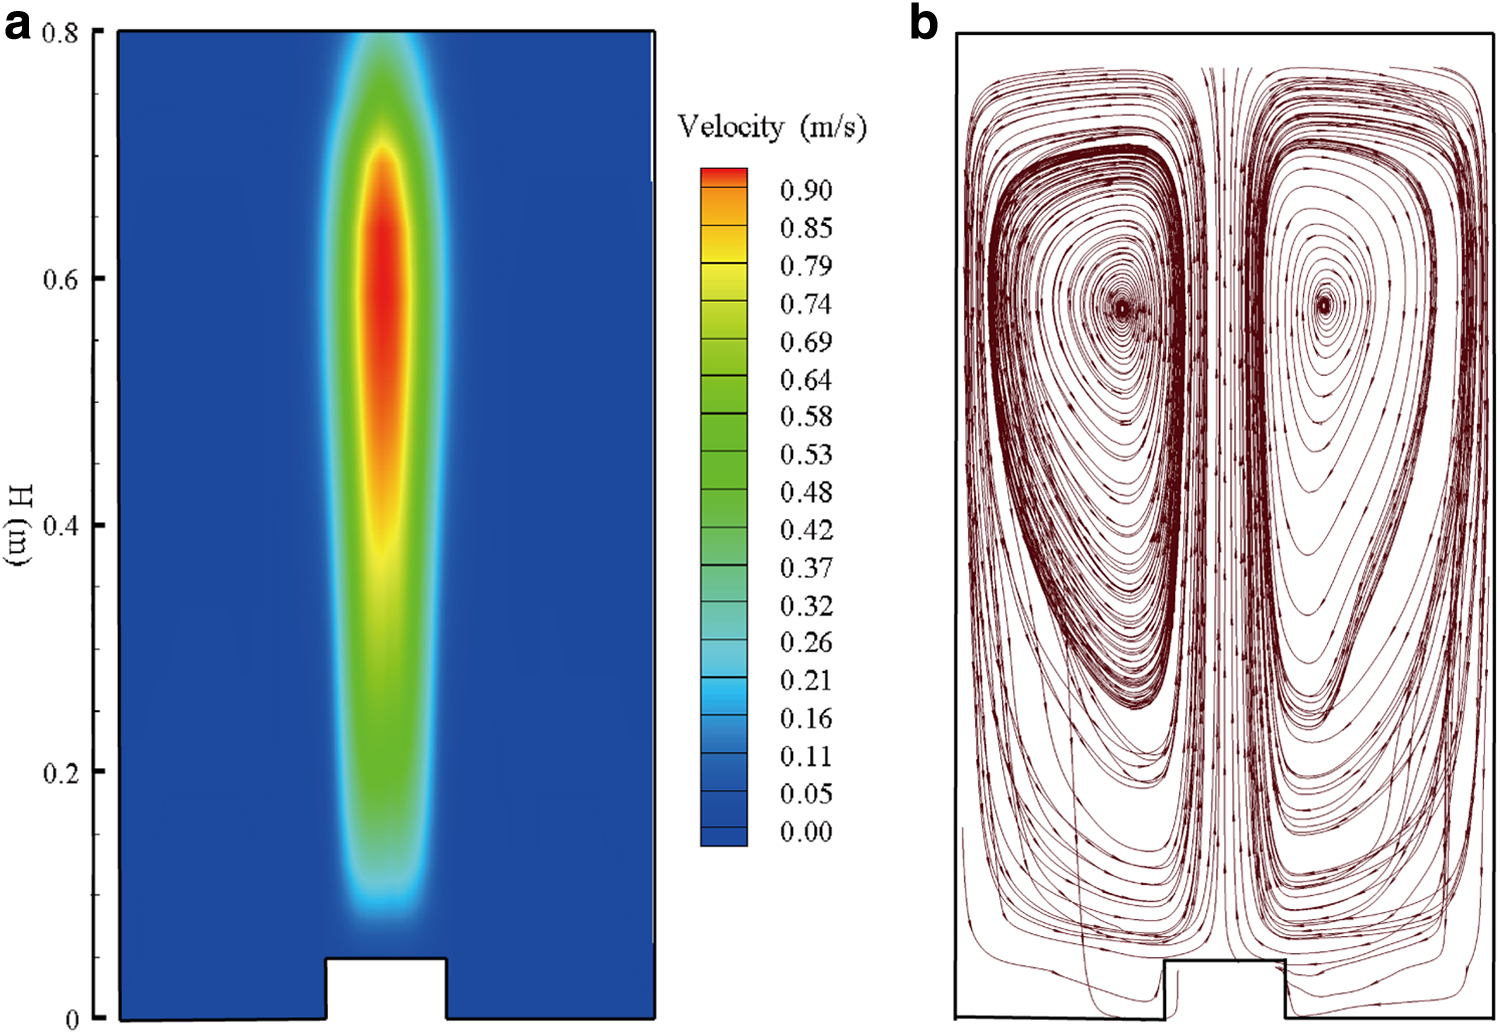
Velocity field of liquid phase at t = 100 s.
Simulation of coaxial bubble rise
The phenomenon of coaxial bubbles rising was studied. Two bubbles, each with a radius of 8 mm, were placed on the central axis with a centroid distance of 21 mm. The coalescence process is as follows: the coaxial bubbles initially rise due to buoyancy (t = 0–60 ms), after which the trailing bubble rises faster, eventually approaching the leading bubble (t = 60–120 ms). Finally, the two bubbles merge to form a large bubble at 300 ms (see Fig. 7a). Analysis of the velocity field can help understand the characteristics of bubble motion in the flow field (Fig. 7b).
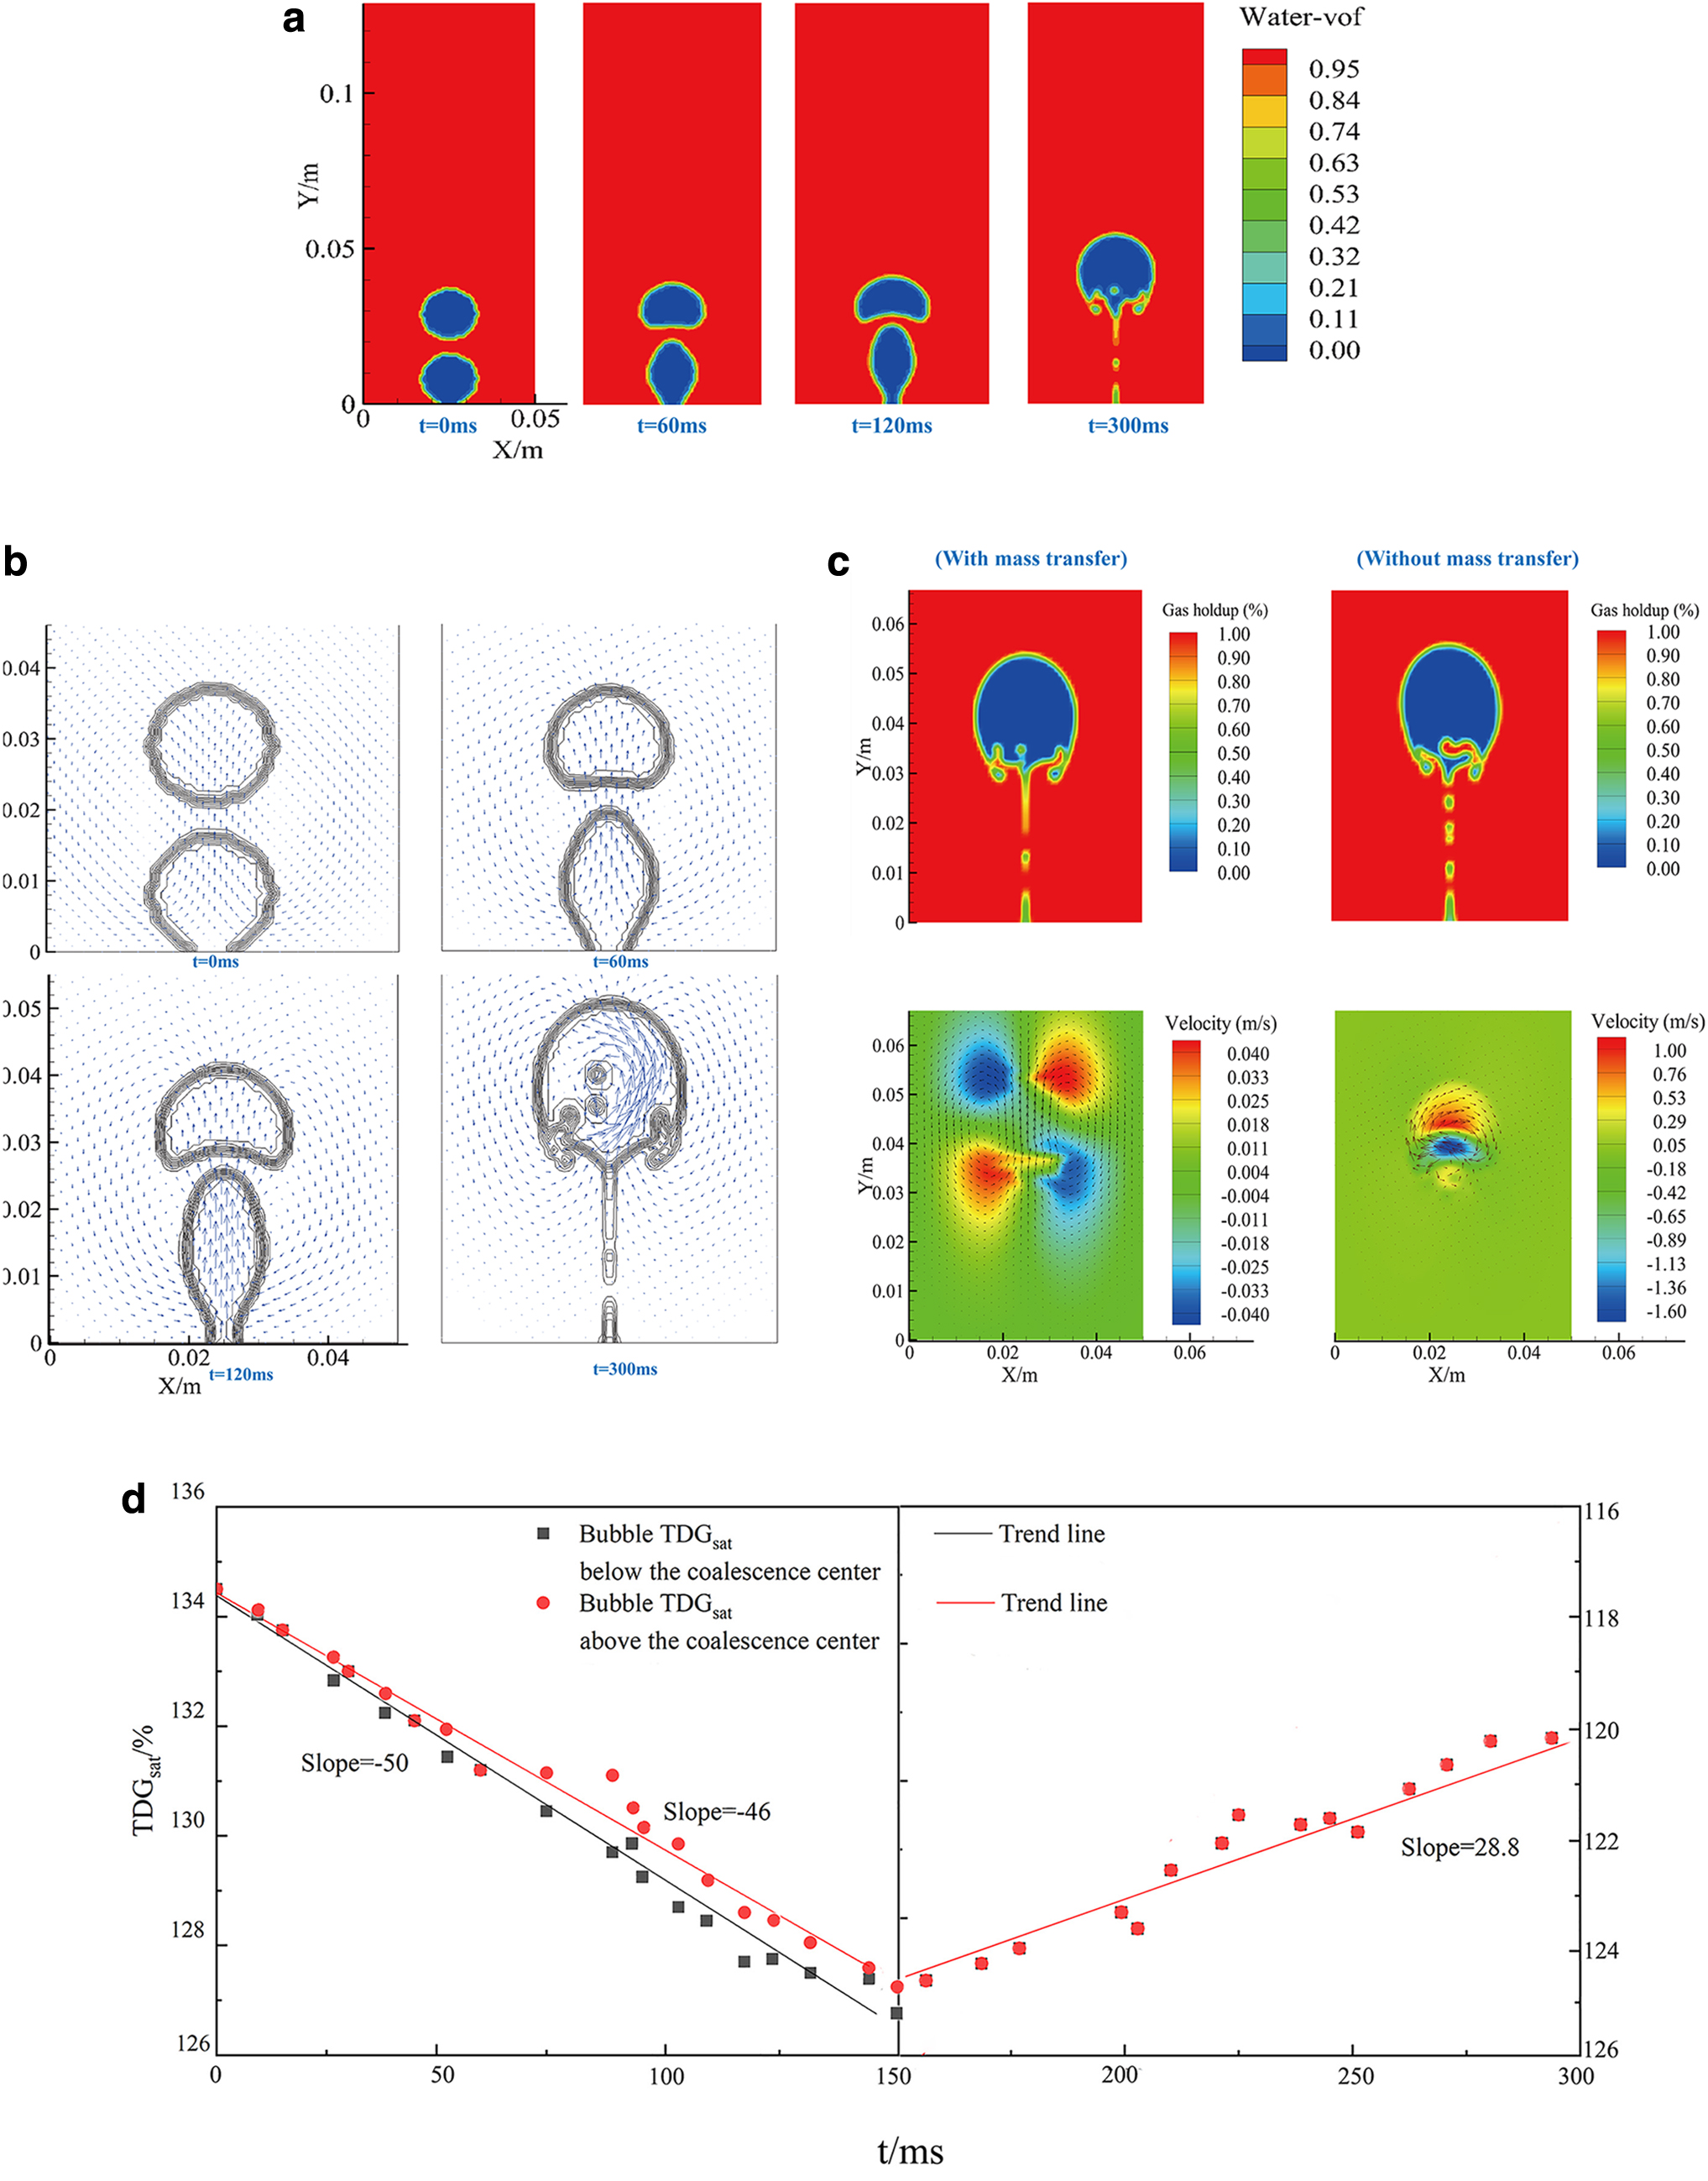
Bubble coalescence process from t = 0 ms to t = 300 ms.
In the first stage (t = 0–60 ms), the rising velocity of the leading bubble gradually increases due to the presence of the wake zone. From t = 60 to 120 ms, the velocity of the leading bubble is higher than that of the trailing bubble. Coalescence occurs at t = 300 ms, and the merged bubble obtains a higher velocity than the two individual bubbles.
The gas holdup and velocity field are depicted in Fig. 7c. A comparison of velocity contours at the same computation time reveals that coalescence without mass transfer occurs earlier, and the velocity contour distribution differs. At t = 300 ms, the top position of bubbles with the mass transfer is y = 0.53 m, whereas the top position of droplets without mass transfer is y = 0.56 m, indicating that bubbles without a mass transfer coefficient rise faster. Furthermore, the maximum value of bubble velocity calculated without mass transfer is higher than that with mass transfer. The maximum bubble velocity appears at the junction of bubble coalescence and is typically called the bubble approach velocity (Katz and Meneveau, 1996).
Bao et al. (2015) and Feng et al. (2016) proposed that bubbles with a diameter greater than 0.35 mm tend to coalesce. Also, the location of the bubble approach velocity is the same as our findings. In addition, the velocity distribution shows that the bubble velocity value with the mass transfer is smaller than that with mass transfer. The results suggest that the velocity field with the mass transfer is closer to the real value.
From t = 0 ms to t = 150 ms, the saturation of the leading bubble differs from that of the trailing drop. After t = 150 ms, the bubbles merge into a giant bubble, and their saturation is represented by mixed saturation as shown in Fig. 7d. The TDG dissipation coefficient is calculated using Equation (24), and the relationship between TDG saturation and dissipation time is illustrated in Fig. 3e. During bubble coalescence, TDG saturation gradually decreases, displaying two different dissipation rates. Before bubble coalescence, the slope of the TDG concentration change for the upper and lower bubbles is 50 and 46, respectively. When two bubbles come into contact at 0.15 s, the internal concentration can be expressed as a single concentration after 0.15 s, with a slope of 28.8. The results demonstrate that the concentration change rate before coalescence is greater than that after coalescence.
Hence, it can be concluded that bubble coalescence negatively impacts mass transfer. While bubble coalescence can renew the surface, it significantly reduces transfer efficiency and has an adverse effect on the mass transfer process.
Conclusions
In this article, the dissipation process of TDG was analyzed by 36 experiments. In addition, the mass transfer effect of coaxial bubbles in supersaturated water was studied. Especially,
The sensitivity analysis of three aeration factors revealed that the aeration rate has the greatest influence on TDG dissipation, followed by water depth, and then the aeration aperture. All three factors significantly accelerated the TDG dissipation process and improved the efficiency of gas-liquid mass transfer.
With the increase in parameters β, the dissipation rate of TDG also increases correspondingly. When the calibration parameter is 0.35, the fitting degree with the experimental data is the best.
The distributions of flow velocity and gas holdup with or without mass transfer coefficient are studied. The results show that the simulated mass transfer coefficients agree with the measured ones. Comparing with the concentration gradient of TDG indicates that bubble accumulation can cause surface renewal. Still, it reduces the mass transfer area, so bubble coalescence has a negative effect on mass transfer.
A dimensionless parameter β is added to the model to improve the prediction accuracy of the model. At the same time, the effect of bubble coalescence and mass transfer was discussed. It can lay the foundation for TDG mitigation measures to avoid the gas bubble disease. Future efforts should combine with the coalescence and breakup of bubbles because the bubble cluster is meaningful. Taking this into numerical simulation can make the results more scientific and promote the research of TDG supersaturation in two-phase liquid to protect the river ecosystem.
Appendix Table A1 presents a summary of the referenced notations in our paper.
Footnotes
Acknowledgment
Thanks to Dr. Ou for assisting with the numerical simulation and theoretical analysis.
Authors' Contributions
D.Z. and H.Y. developed the idea for the study; D.Z. and Y.O. conducted the analyses; D.Z., C.L., J.L., and Y.Y. performed the experiments; and D.Z. wrote the article.
Author Disclosure Statement
No competing financial interests exist.
Funding Information
This material was supported by the National Natural Science Foundation of China (Grant No. 51709053), and the Department science and Technology of Guizhou Province (20191117).
Notations
| aB | The area is the ratio of the total area of the entrained bubbles to the total volume of the mixture, 1/m | Mass transfer coefficient across the bubble interface, m/s | |
| aS | Specific free water surface area as the ratio of the total area of the free surface to the total volume of the mixture, 1/m | Mass transfer coefficient across the water interface, m/s | |
| Cs | Equilibrium saturation, % | Viscosity, | |
| Effective saturation, % | The density of the liquid phase, kg/m3 | ||
| g | Acceleration of gravity, | kL | Turbulent energy of the liquid phase, m2/s2 |
| G 0 | Percent saturation of TDG initially,% | Dissipate rate of turbulent Energy, m2/s2 | |
| Gt | Percent saturation of TDG at t time, % | SC | Source term |
| effective saturation of TDG, % | β | Dimensionless parameter |
This table includes the main notations. Others used are explained when they appear.
TDG, total dissolved gas.
References
Supplementary Material
Please find the following supplemental material available below.
For Open Access articles published under a Creative Commons License, all supplemental material carries the same license as the article it is associated with.
For non-Open Access articles published, all supplemental material carries a non-exclusive license, and permission requests for re-use of supplemental material or any part of supplemental material shall be sent directly to the copyright owner as specified in the copyright notice associated with the article.