
Abstract
The flow patterns of bioreactors are influenced by superficial gas velocity (SGV), substrate types, and concentration, which in turn affect the properties of aerobic granular sludge (AGS). This study used three-dimensional computational fluid dynamics to simulate the flow pattern in the bubble column reactor under the SGV of 1.2–5.0 cm/s and reactor ratio of height to diameter (H/D ratio) of 120/6, different substrate types, and concentration. The SGV was more significant to the flow pattern. The flow pattern transformed from single-cell circulation to small-scale vortices with the increase of SGV. Five sequencing batch reactors were employed to cultivate the AGS with an SGV ranging from 1.0 to 5.0 cm/s and an H/D ratio of 120/6. The mature AGS was performed under the SGV of 2.0–5.0 cm/s. The combination of simulation and experiment showed that the flow pattern of transverse rotation was a vital factor in the formation of AGS with an SGV of 1.2 cm/s. The flow pattern of multiple spiral vortices was necessary for the stability of AGS, with an SGV of 2.0–5.0 cm/s. The substrate types and concentration influenced the liquid viscosity and then affected the diameter, properties, and formation time of AGS.
Introduction
Aerobic granular sludge (AGS), with compact structure, good settling performance, high resistance to organic loading rate (OLR), and better pollutant removal efficiency, is extensively cultivated in laboratory-scale column-type sequencing batch reactors (SBRs). Later, it is used at the municipal wastewater treatment plant (WWTP) named Garmerwolde in the Netherlands, which shows that the energy usage is 58–63% lower than the average conventional activated sludge (CAS) treatment plant (Pronk et al., 2015). So AGS technology is thought to be an alternative option to CAS technology in the future. However, aerobically activated sludge granulation is a complex process based on the interaction of physical, chemical, and microbiological reactions. As a result of various operation conditions, the appearance and characteristics of reported AGS differed from each other (Ferreira et al., 2022; Sadiye et al., 2022).
In terms of the fed substrate for aerobic sludge granulation, real wastewater and synthetic wastewater of sodium acetate, glucose, starch, and ethanol can be used (Chen et al., 2016; Ferreira et al., 2022). Substrate types and concentrations influenced the bacterial species of AGS and the viscosity associated with the hydrodynamic behavior of the bioreactor. Furthermore, the reactor ratio of height to diameter (H/D ratio) and hydrodynamic shear force affected the flow pattern in the bioreactor. However, the experiments of hydraulic factor demand an immense amount of time, and the results at the macro level cannot be satisfied to investigate the formation mechanism of AGS in hydrodynamics.
Numerical simulation is an efficient functional approach. Computational fluid dynamics (CFD) forecasts fluid flow, heat and mass transfer, reactions, and other related phenomena by solving a set of appropriate mathematical equations, and then describing the processes of mass, momentum, energy, and species balance (Gresch et al., 2009; Wang et al., 2010a). CFD simulation can visualize the evolution of the flow patterns with less time. Joshi et al. (2002) and Rampure et al. (2007) investigated the flow pattern of gas-liquid of two dimensional or three dimensional (3D), at different superficial gas velocities (SGVs) and configurations of reactors, respectively.
The homogeneous regime occurred at relatively low SGV, and the heterogeneous at high SGV. In recent years, CFD visualized the specialty of flow patterns in bioreactors (Díez et al., 2007; Ding et al., 2010; Ren et al., 2009; Wang et al., 2010b; Zima et al., 2008). However, these simulations focused on only one operational condition or parameter. Fan et al. (2021) studied the sludge-rising process during denitrification, especially its hydrodynamics, with experiments and CFD modeling. The rising process was observed and divided into three stages: bubble-forming, sludge particles rising with isolated bubbles, and sludge blanket rising. The development of CFD was more and more comprehensive.
The formation of AGS involved physical, chemical, and microbiological processes, which correlated to the hydrodynamic behavior of the bioreactor. Fan et al. (2019) simulated the flow patterns of gas-liquid-sludge three-phase flow under different SGV, H/D ratios, and sludge characteristics. The gas-liquid-sludge simulation results illustrated that the sludge with a diameter lower than 0.2 mm had little influence on the flow pattern in the bubble column reactor (BCR). In this condition, the gas-liquid-sludge three-phase flow could be simplified to a gas-liquid two-phase flow.
The above-mentioned studies found that the CFD simulation is an efficient way to describe the hydrodynamic factor of aerobically activated sludge granulation. Nevertheless, except for SGV and H/D ratio, the substrate type and concentration could affect the flow pattern of the bioreactor as well. However, how do they influence to? In addition, the flow pattern of the formation and stability of AGS is not clear, and how can we control it in an experiment?
In this study, 3D transient CFD models of gas-liquid two-phase flow were constructed to investigate the evolution of the flow pattern under various combinations of SGVs, substrate types, and concentrations. Furthermore, real experiments were established to cultivate the AGS in SBRs with an SGV of 1.0–5.0 cm/s and an H/D ratio of 120/6. The combination of simulation and experiments, on the one hand, was used to explore the flow pattern for AGS formation and stability and the corresponding range of SGV, and on the other hand, it was used to discuss the relationship of sludge diameter, flow pattern, and viscosity. All the results in this study hope to contribute to optimizing the cultivation of aerobic sludge granulation.
Materials and Methods
Numerical description
Reactors
The BCR used in the model was the same one used in experiments, the internal diameter was 0.06 m and the working height was 1.2 m (Fig. 1B.a). The air was introduced into the reactor through a diffuser with a height of 3 cm and a diameter of 2 cm, which was located at the bottom of the reactor.

The structure diagram of SBR
Numeral model
A transient CFD model was used to simulate the flow pattern of gas-liquid two-phase flow using a 3D Eulerian-Eulerian model. The liquid was treated as the primary phase, while the air bubbles were treated as the secondary phase. The numeral model was established, and the continuity and momentum equations, interphase mass transfer, turbulence closure, initial and boundary conditions, numerical solution, and bubble size distribution were the same as our previous work (Fan et al., 2019; Fan et al., 2018). The governing equations for gas-liquid flow are described in Table 1.
Governing Equations for Gas-Liquid Two-Phase Flow Using Three-Dimensional k-ɛ Model
Initial and boundary conditions
In the beginning, it was assumed that the liquid phase and gas phase were all stationary. The gas holdup was zero in the reactor. The air has the physical properties of air at 25°C, and it was obtained entirely from the diffuser, the velocity inlet was set on the whole diffuser surface; besides, the outflow outlet was set on top of the bioreactors. The fluid synthetic wastewater was modeled as pure water, sodium acetate, glucose, and starch with a temperature of 25°C, the feature is described in Table 2, and the simulated condition of SGV is 1.2, 2.0, 2.5, 3.0, 4.0, and 5.0 cm/s, respectively.
Substrate Types and Concentration (25°C)
Unstructured meshes of tetrahedral elements were generated (Fig. 1B.b), and the mesh size was 2, 3, 4, and 5 mm, respectively. It found that the time step size of 0.1 s and the amount of mesh of 2603055 gave the best result.
Experiment
Tracer experiment
The measured methods of gas holdup and liquid velocity were according to Fan et al. (2018, 2019).
Viscosity is a very important property of the fluid. The apparent viscosity (μ) is related to the shear stress and shear rate subjected to fluid. For Newtonian fluids, the correlation between shear stress (τ) and shear rate (γ) per unit area of the fluid was linear. The shear rate and shear stress will vary in the process of fluid movement. The apparent viscosity of the fluid was measured at 25°C by viscometer under different conditions (LVDV-II+Pro; Brookfield). And the shear stress was 12.2, 14.7, 24.5, 36.7, 61.2, 73.4, and 122 1/s, respectively. At last, the apparent viscosity was fitting and calculated according to the Newtonian fluid, as shown in Supplementary Fig. S1.
Aerobic sludge granulation
Reactor
Five SBRs were made of cylindrical Plexiglas, with a working volume of 3.4 L. The working height of the bioreactor was 1.2 m, while the inner diameter was 0.06 m (Fig. 1A). The exchange volume was fixed at 50%. The SBRs were operated sequentially as 2 min of influent, 155 min of aeration (increased to 172 min with a decrease in settling time), 20 min of settling, then decreased gradually to 3 min according to the settling ability of sludge, and 3 min of effluent withdrawal.
The inoculated sludge was obtained from an aerobic tank of a local municipal WWTP of Xi'an, China. The sludge fed with synthetic wastewater, and the composition was (mg/L) 1,000 CH3COONa; 160 NH4Cl; 50 KH2PO4; 100 MgSO4·7H2O; 60 CaCl2; and 0.5 mL/L trace solution.
The five reactors operated at identical conditions. Mixed liquor suspended solids (MLSS) in the reactors was 3,500 mg/L initially, and the OLR was 3.12 kg chemical oxygen demand (COD)/m3·day. The room temperature was 25°C ± 2°C. The pH ranged from 7 to 8. Airflow rate of 100 L/h (1.0 cm/s), 200 L/h (2.0 cm/s), 300 L/h (3.0 cm/s), 400 L/h (4.0 cm/s), and 500 L/h (5.0 cm/s) was applied to the bioreactor, respectively.
Analytical methods
MLSS, settling velocity of 5 min (SV5), settling velocity of 30 min (SV30), and sludge volume index of 30 min (SVI30), were measured according to standard methods (APHA, 1998). The diameter of the sludge was measured by a laser particle size analysis system (LS230/SVM; Beckman). The morphology of sludge was observed using an optical microscope (Nikon ECLIPSE 50i). The microbial structure of granules was examined with a scanning electron microscope (SEM, JSM-6510LV).
Results
Gas holdup
Under various substrate types and sodium acetate concentrations, the volume-averaged overall gas holdups of model-simulated and experiment-measured are shown in Supplementary Tables S1 and S2. The simulations were in good agreement with experimental measurements, and the error was smaller than 10%, verifying the validity of the model. The overall gas holdup maintained around 0.025–0.275. With the increase of the SGV, the overall gas holdup increased; it resulted in the size of the gas bubble decreasing, which generated inside the cell (Sarhan et al., 2016). In addition, the overall gas holdup decreased with the increase in sodium acetate concentration, which was also reported by Sarhan et al. (2018).
The Z/Hmax was defined as a ratio of the vertical coordinate of BCR Z to the maximum liquid level Hmax. The transverse distribution of time-averaged local gas holdup at Z/Hmax = 0.25, 0.5, and 0.75 was predicted under different operation conditions, and the results are shown in Supplementary Figs. S2 and S3. The local gas holdup was maintained around 0–0.40. Under the different substrate types and sodium acetate concentration, the value of local gas holdup was different, but the variation law was similar, which was off-center with the increase in SGV. And it was more influenced by SGV rather than the substrate.
When the SGV was 1.2 cm/s, the local gas holdup was the central peak, which was already reported by Besagni et al. (2017). While the SGV was higher than 2.0 cm/s, the distribution of local gas holdup developed into two different peaks. And the position of the peak was where the bubble burst. It was the reason that the coalescing and breaking of bubbles were vigorous along with the increase of SGV, and then, the local motion of liquid was chaotic, and the turbulence was violently accelerated. In addition, the peak values were off-center with the increase in SGV; this was also the result of turbulence increase.
Liquid velocity
Supplementary Figures S4 and S5 show the comparisons of liquid velocity between experiment measured and model simulated, along with the operating time under different SGVs, substrate types, and sodium acetate concentrations. The relative error between the predicted and measured values was within 10%, indicating that the model provided a good description of the hydraulic behavior of the bioreactor. Also, the SGV rather than the substrate influenced the liquid velocity more.
When the SGV was 1.2 cm/s, the liquid velocity was decreasing-increasing-decreasing along with the running time. After the 20 s, it maintained a relatively stable state or minor fluctuation, implying that the liquid of BCR mixed completely. The magnitude and fluctuation of liquid velocity enhanced with the increase of SGV. It was the result that bubbles coalesced and broke in the reactor vertical. In a homogeneous regime (SGV <2.0 cm/s), the hindrance would reduce the bubble velocity, and then influence the liquid velocity. However, at the SGV higher than 2.0 cm/s, the fluctuation of liquid velocity was evident, and the flow pattern was the dominant vortices (Figs. 2 and 3). The motion of the liquid intensified due to the bubble coalescence and crush.
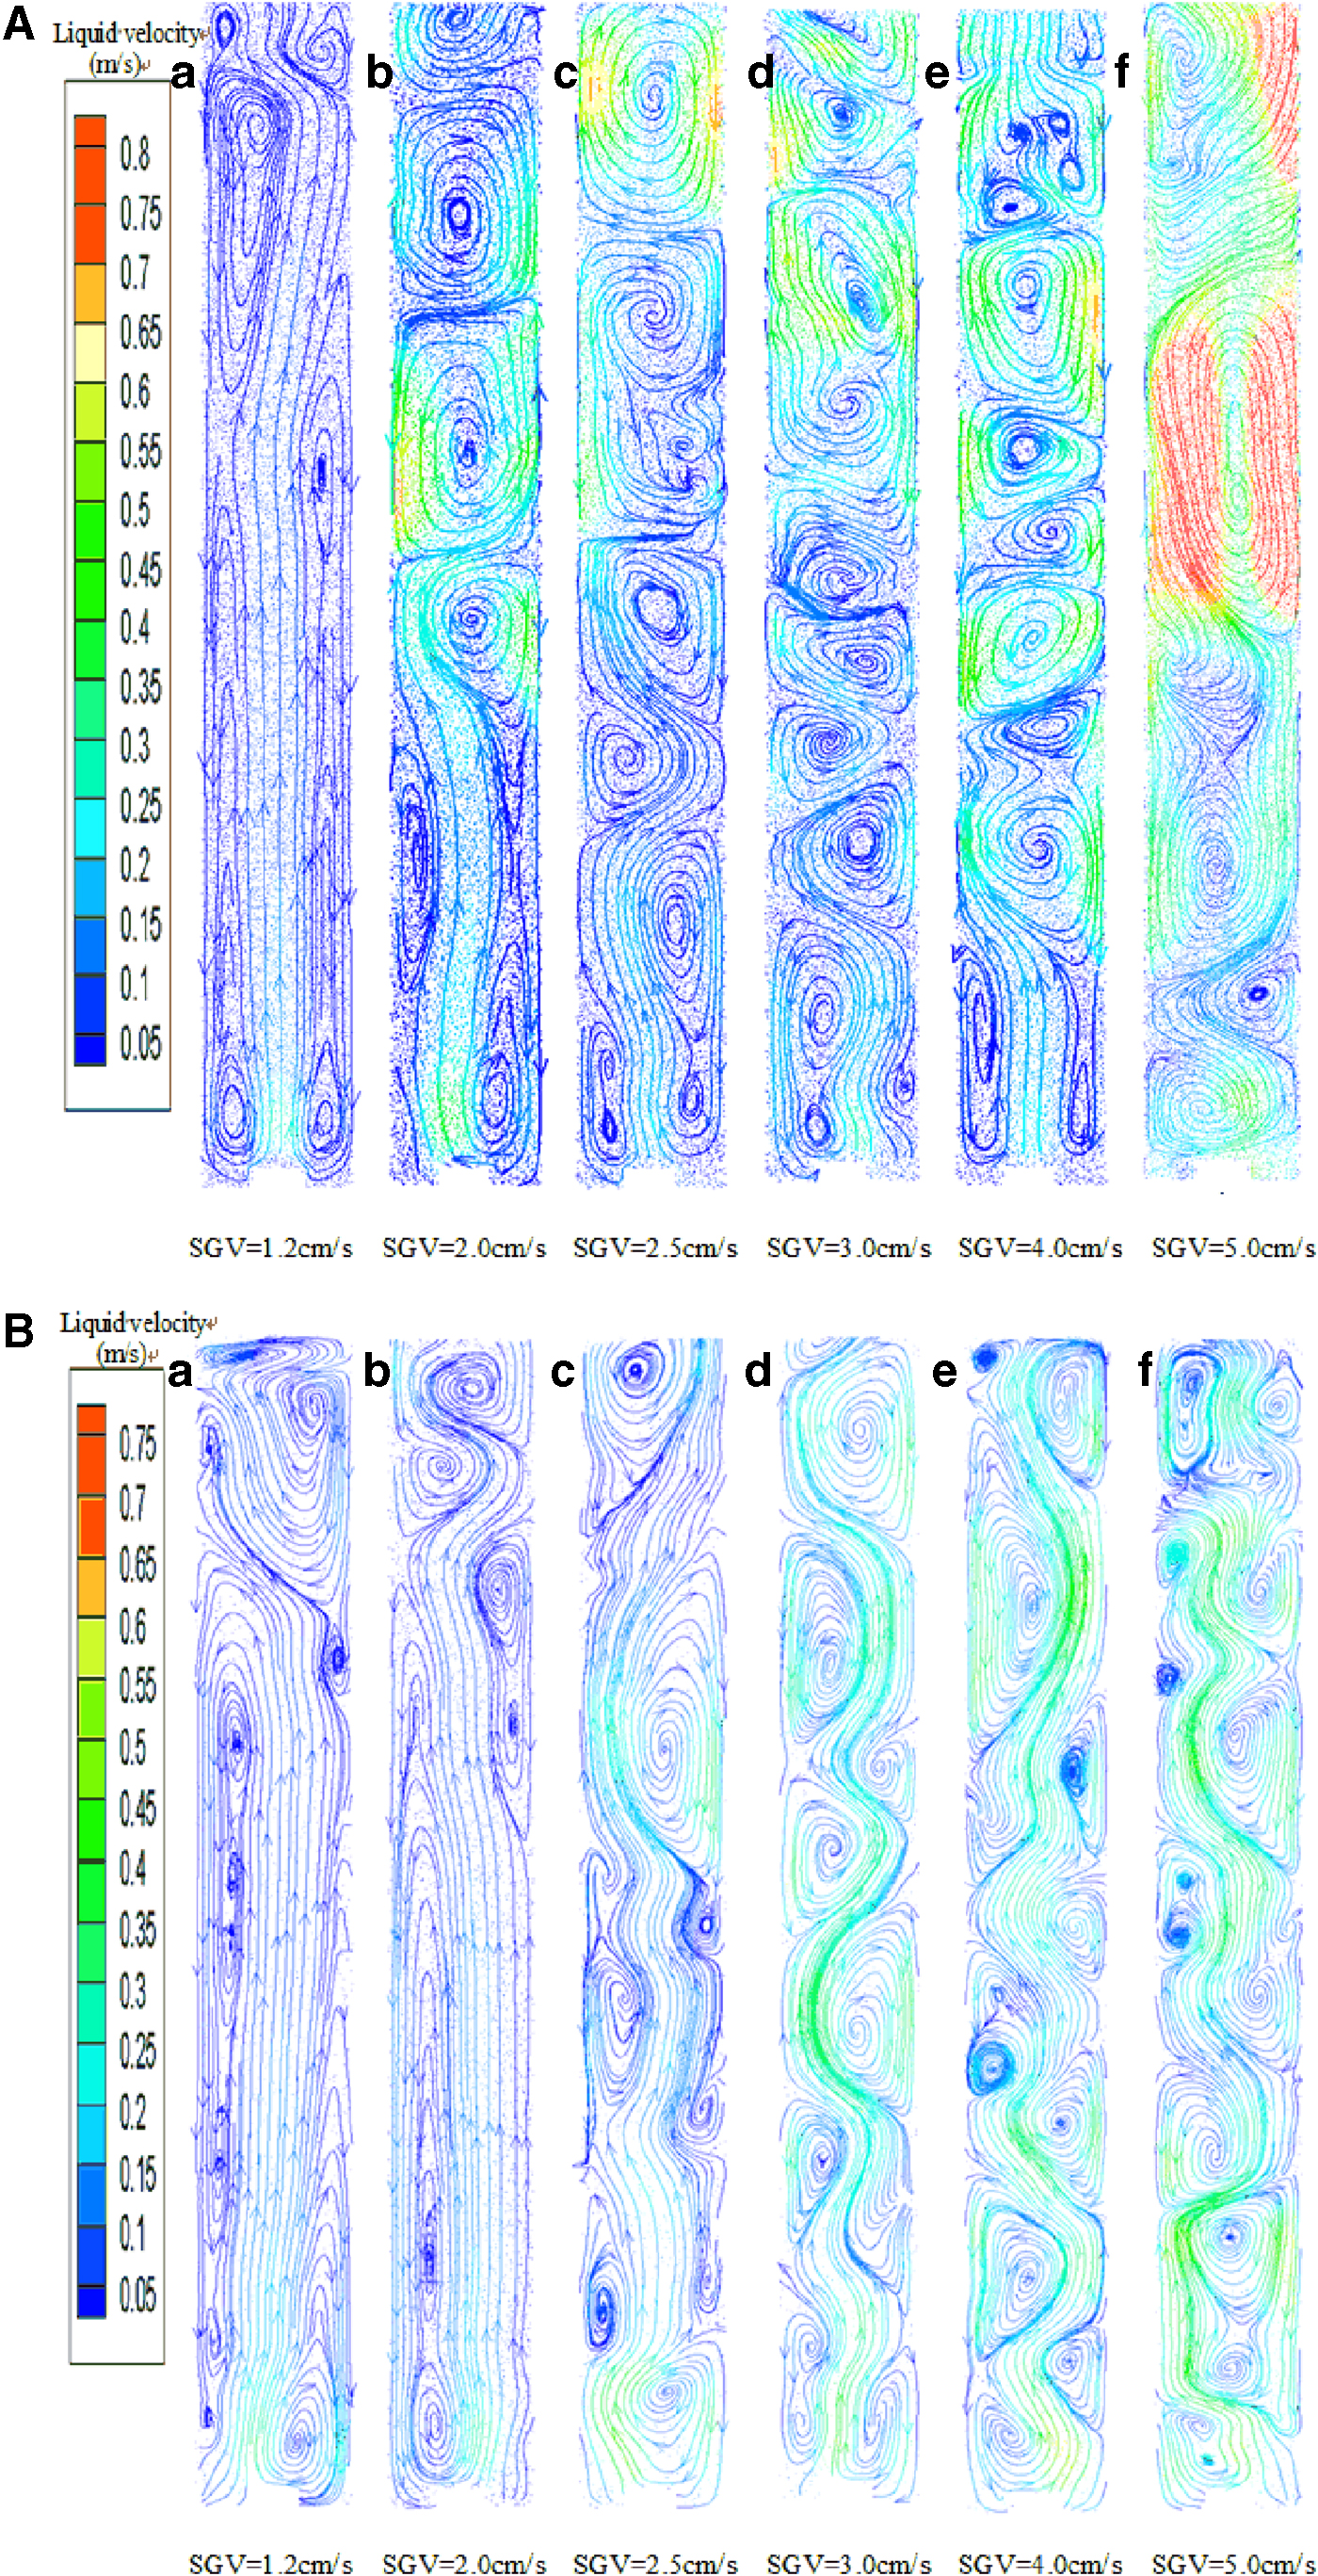
The velocity vectors of liquid at the vertical section (Y = 0),
The velocity vectors of liquid at the vertical section (Y = 0),
The transverse distribution of time-averaged axial velocity at Z/Hmax = 0.25, 0.5, and 0.75 was predicted, under different operating conditions, as shown in Supplementary Figs. S6 and S7. The local liquid axial velocities were maintained around −0.4 to 0.5 m/s. Under the different substrate types and sodium acetate concentration, the distribution of axial velocity was various, but the development law was similar with the increase of SGV. The positive or negative peak of the axial velocity represented the direction and magnitude of liquid circulation. They upflowed and downflow, generating circular cell to promote the movement of sludge. The asymmetry of axial velocity was related to the development of vortices.
The increase of the axial velocity corresponded to the color development of the flow line in Figs. 2 and 3. By contrast, with the higher SGV and the larger Z/Hmax, the asymmetry of axial velocity was more evident. However, it did not mean that the value of axial velocity enhanced with the increase of SGV; it related to the coalescing and breaking of bubbles. In general, gas holdup hurts liquid phase velocity. However, the rule did not perfectly follow at the SGV >2.0 cm/s, which may be caused by hydraulic friction between liquids during turbulent motion. The liquid viscosity influenced the hydraulic friction, which correlated with the substrate types and concentration. Moreover, the hydraulic friction was variable with the operating time.
Visualization of flow pattern
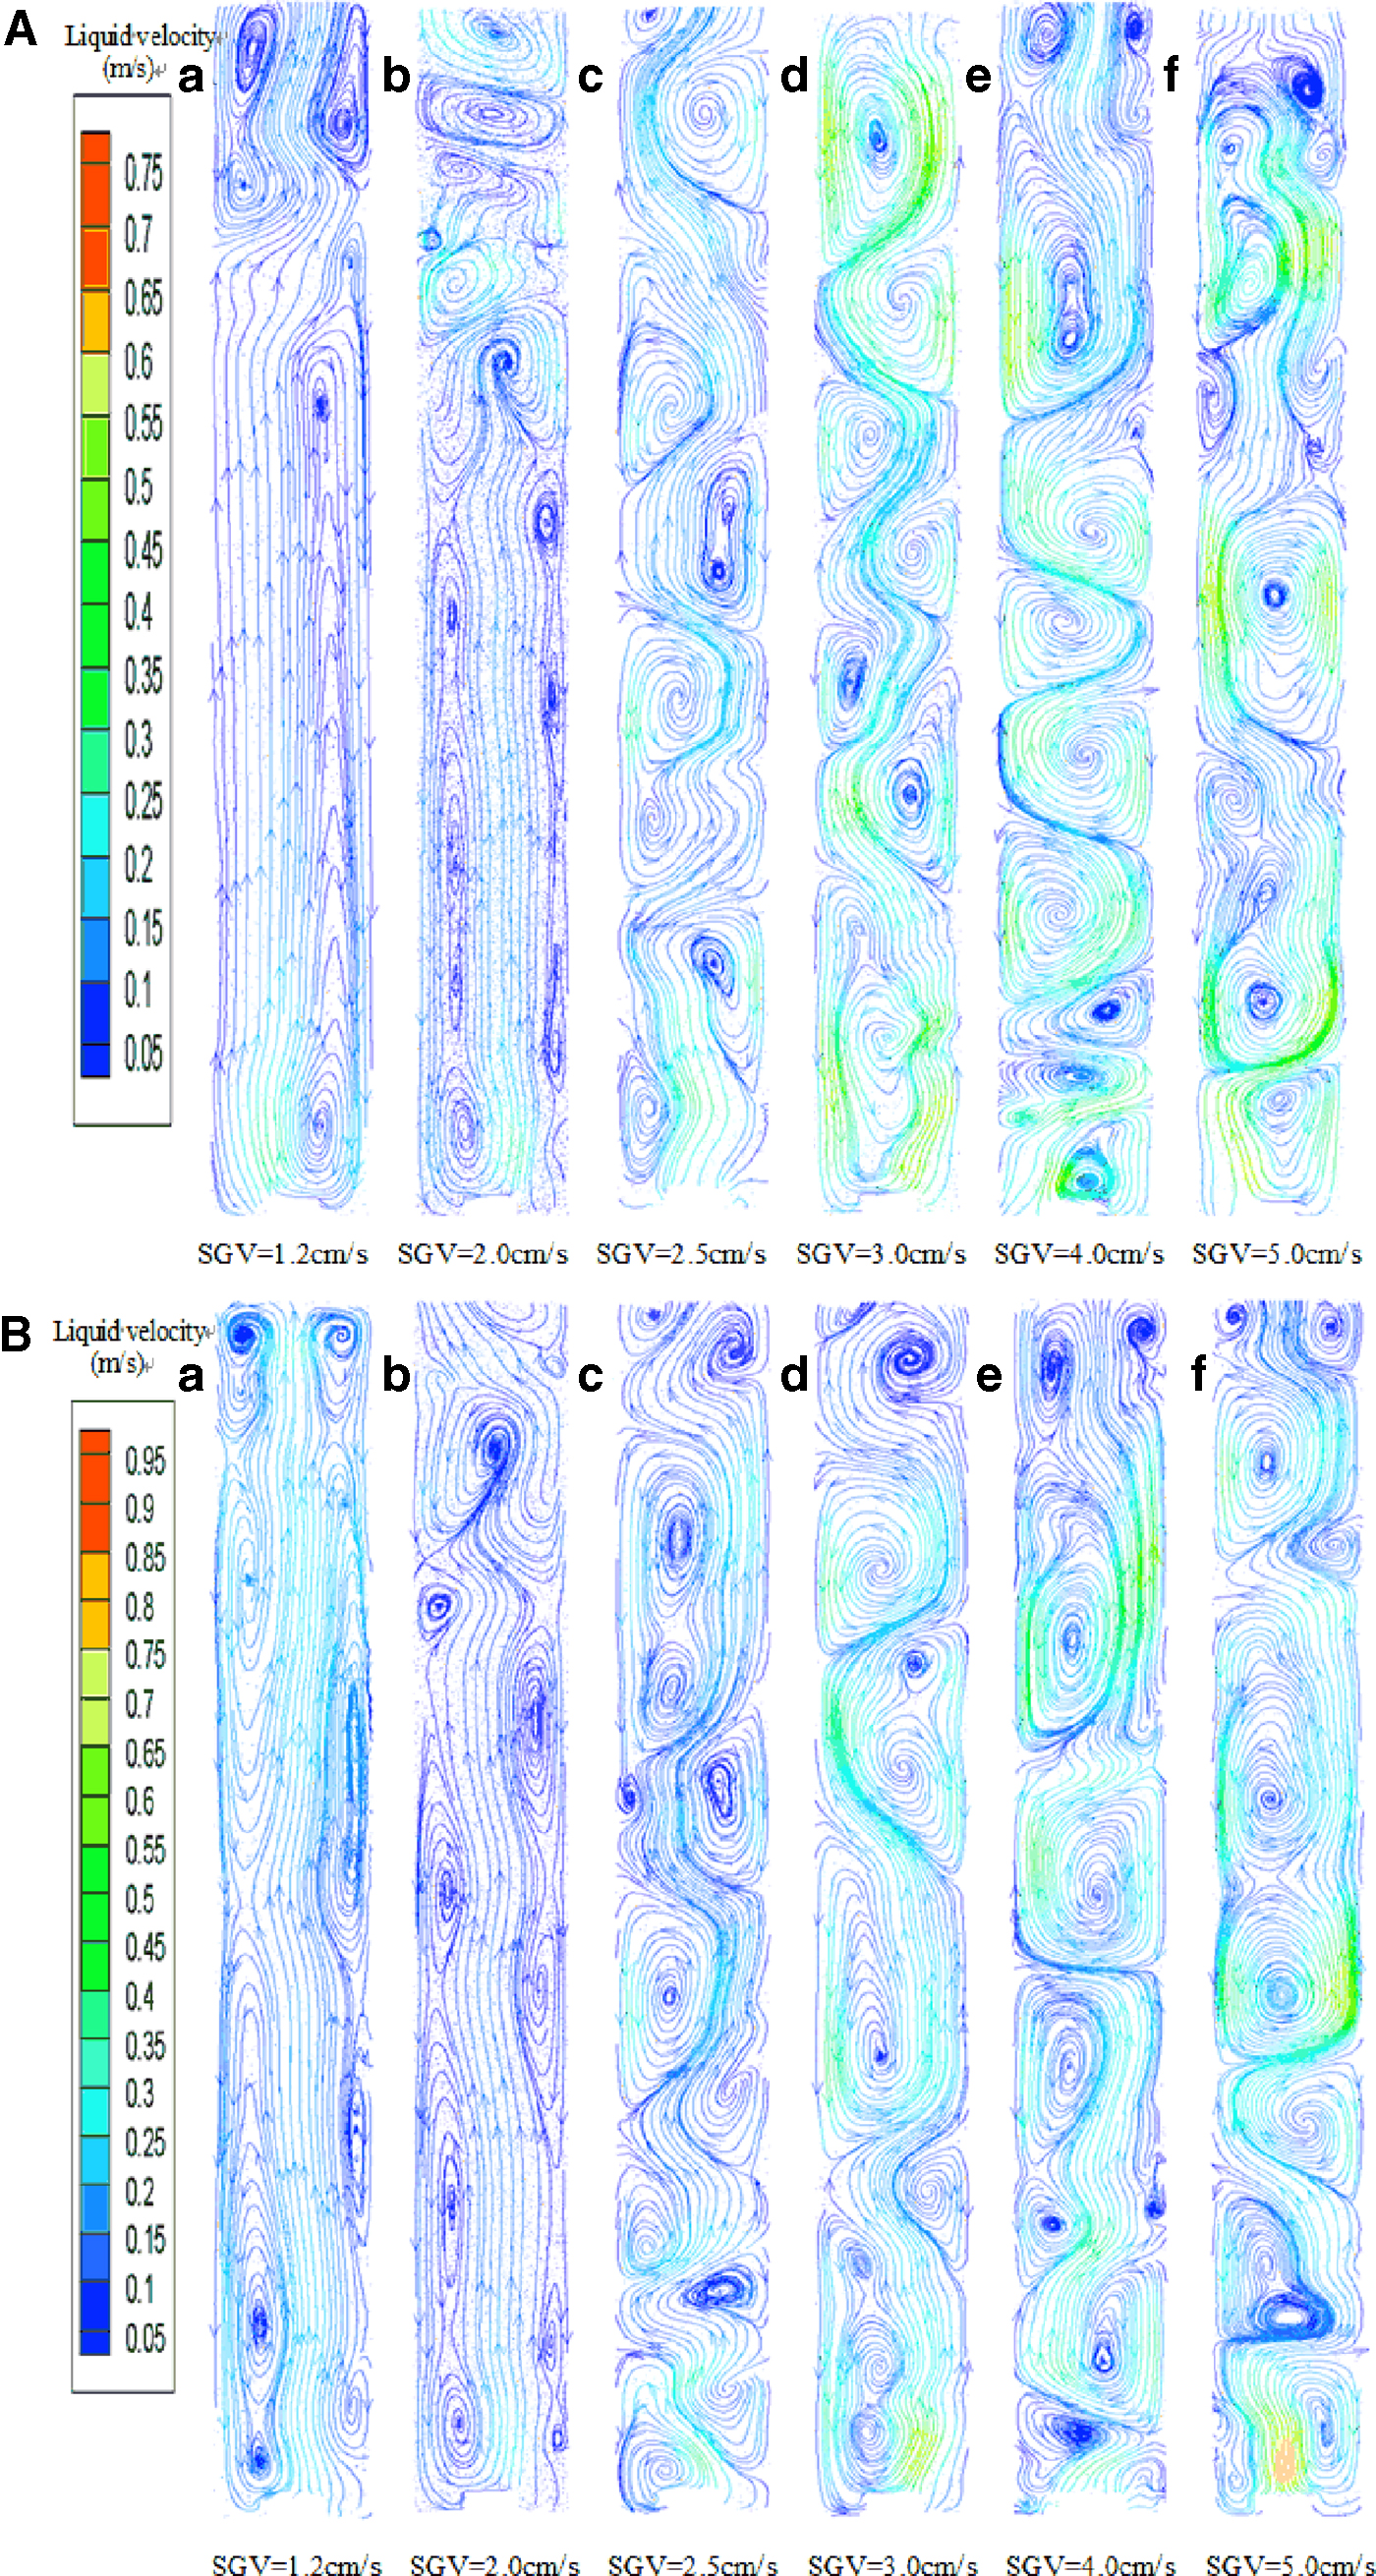
For the figure of velocity vectors, the left is the velocity magnitude and the right is the flow pattern. Figures 2 and 3 show the liquid flow pattern under different substrate types at the vertical section in BCRs (Y = 0), where the SGVs are 1.2–5.0 cm/s. Figure 4 shows the liquid flow pattern under different sodium acetate concentrations with an SGV of 3.0 cm/s.
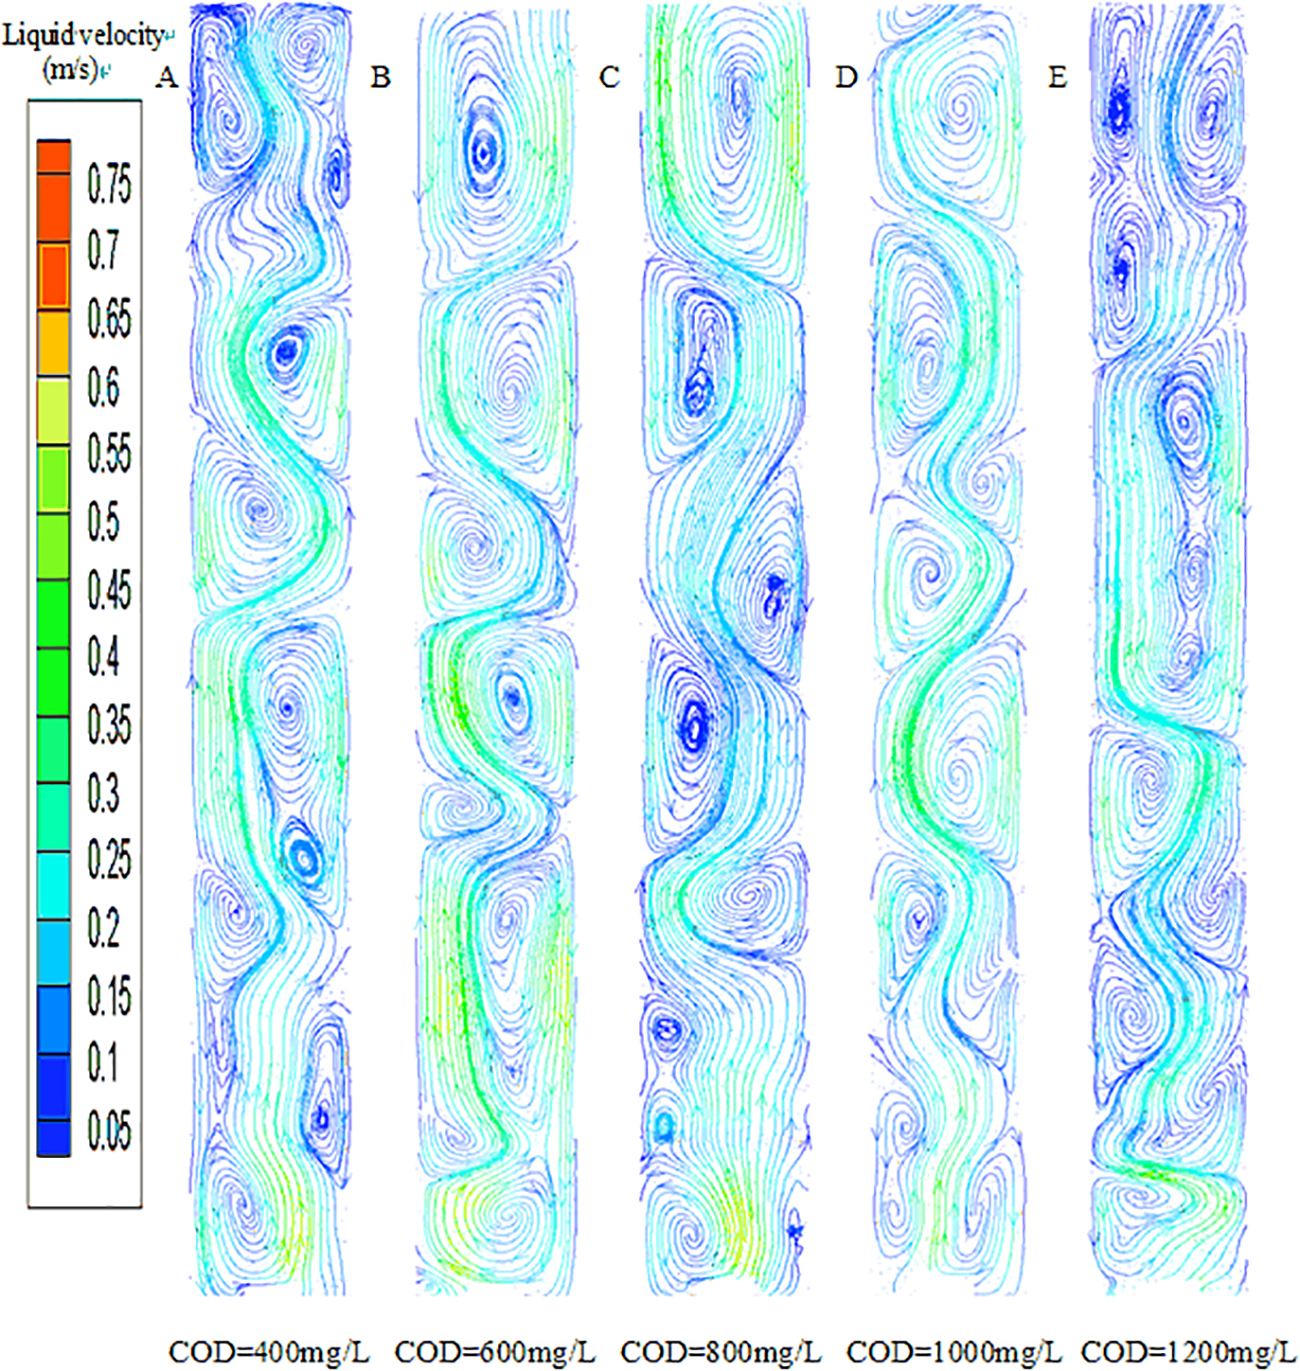
The velocity vectors of liquid at the vertical section (Y = 0), SGV = 3.0cm/s,
It was found that the distributions of flow patterns, under different operation conditions, were composed of circulation and vortical cells. For the water, the flow pattern transformed with the increase of SGV. At an SGV of 1.2 cm/s (Fig. 2A.A), a single-cell circulation developed at the bottom of the reactor, while the multiple eddies cell emerged at the middle and the top of the reactor, which differed from the flow pattern of lower H/D ratio (Fan et al., 2019), implying that the multiple cells were easier to be generated at the upper than at the bottom of the bioreactor.
The further increase of the SGV, the flow pattern tansited from single-cell to multiple vortices cell, which was also observed by Chen et al. (1994). The flow pattern of multiple small-scale vortices becomes the main structure of the fluid movement. They formed arrays in the vertical direction; meanwhile, the upflows formed alternately between clockwise and counterclockwise, and one by one had different sizes. The development of instantaneous flow patterns under various operation conditions was also according to Kolmogorov (1941). The analysis of the flow pattern demonstrated that an increase of SGV enhanced the number of vortices, but decreased the size of the vortex, implying that the SGV greatly contributes to the development of flow structure.
When the substrate types changed to sodium acetate, glucose, and starch, the distribution of the liquid flow pattern transformed, and they were different from each other (Figs. 2B, 3A, and 3B), which was the result of increase in viscosity. However, the development of vortices still accorded with the regulation that the flow pattern transited from single-cell circulation to small-scale vortices. And the vortices were easier observed at low SGV. Especially, at SGV of 1.2 cm/s, the small-scale vortices instead of large-scale circulation emerged at the bottom of BCR.
Compared with sodium acetate and glucose, the number of small-scale vortices of starch was more at the same SGV. The distribution of flow patterns was diverse because of various concentrations of sodium acetate (Fig. 4). However, the flow patterns developed as multiple small-scale vortices. The distributions of the flow pattern demonstrated that the SGV takes a more significant influence on the evolution of the flow pattern than the substrate type and concentration.
The liquid flow pattern of the lateral cross-section is showed in Supplementary Fig. S8, in which the Z/Hmax is 0.25, 0.5, 0.75, and the SGV is various. A flow pattern of lateral rotation emerged at the SGV of 1.2 cm/s. Finally, the flow pattern of the bioreactor transited to spiral with an increase in SGV, which was the same reason discussed in the vertical section.
Discussion
The aerobic sludge granulation
The AGS cultivated in actual reactors, and the experimental setup is shown in Fig. 1A. The sludge properties at different SGVs are shown in Fig. 5. When the SGV was 1.0 cm/s, there was no formation of AGS; besides, the mean diameter, SVI30, and SV30/SV5 varied continuously. When the SGV ranged from 2.0 to 5.0 cm/s, AGS was successfully formed and was dense with good settling ability. The maximum mean diameter was 0.65 mm with an SGV of 3.0 cm/s, and the minimum was 0.35 mm with an SGV of 5.0 cm/s. D2 was employed to characterize the compactness, and calculated by Serra and Casamitjana (1998). It found that the D2 rose with the increase of SGV, which was consistent with the result that a high shear force, and then a smaller and more compact granule (Liu and Tay, 2002).
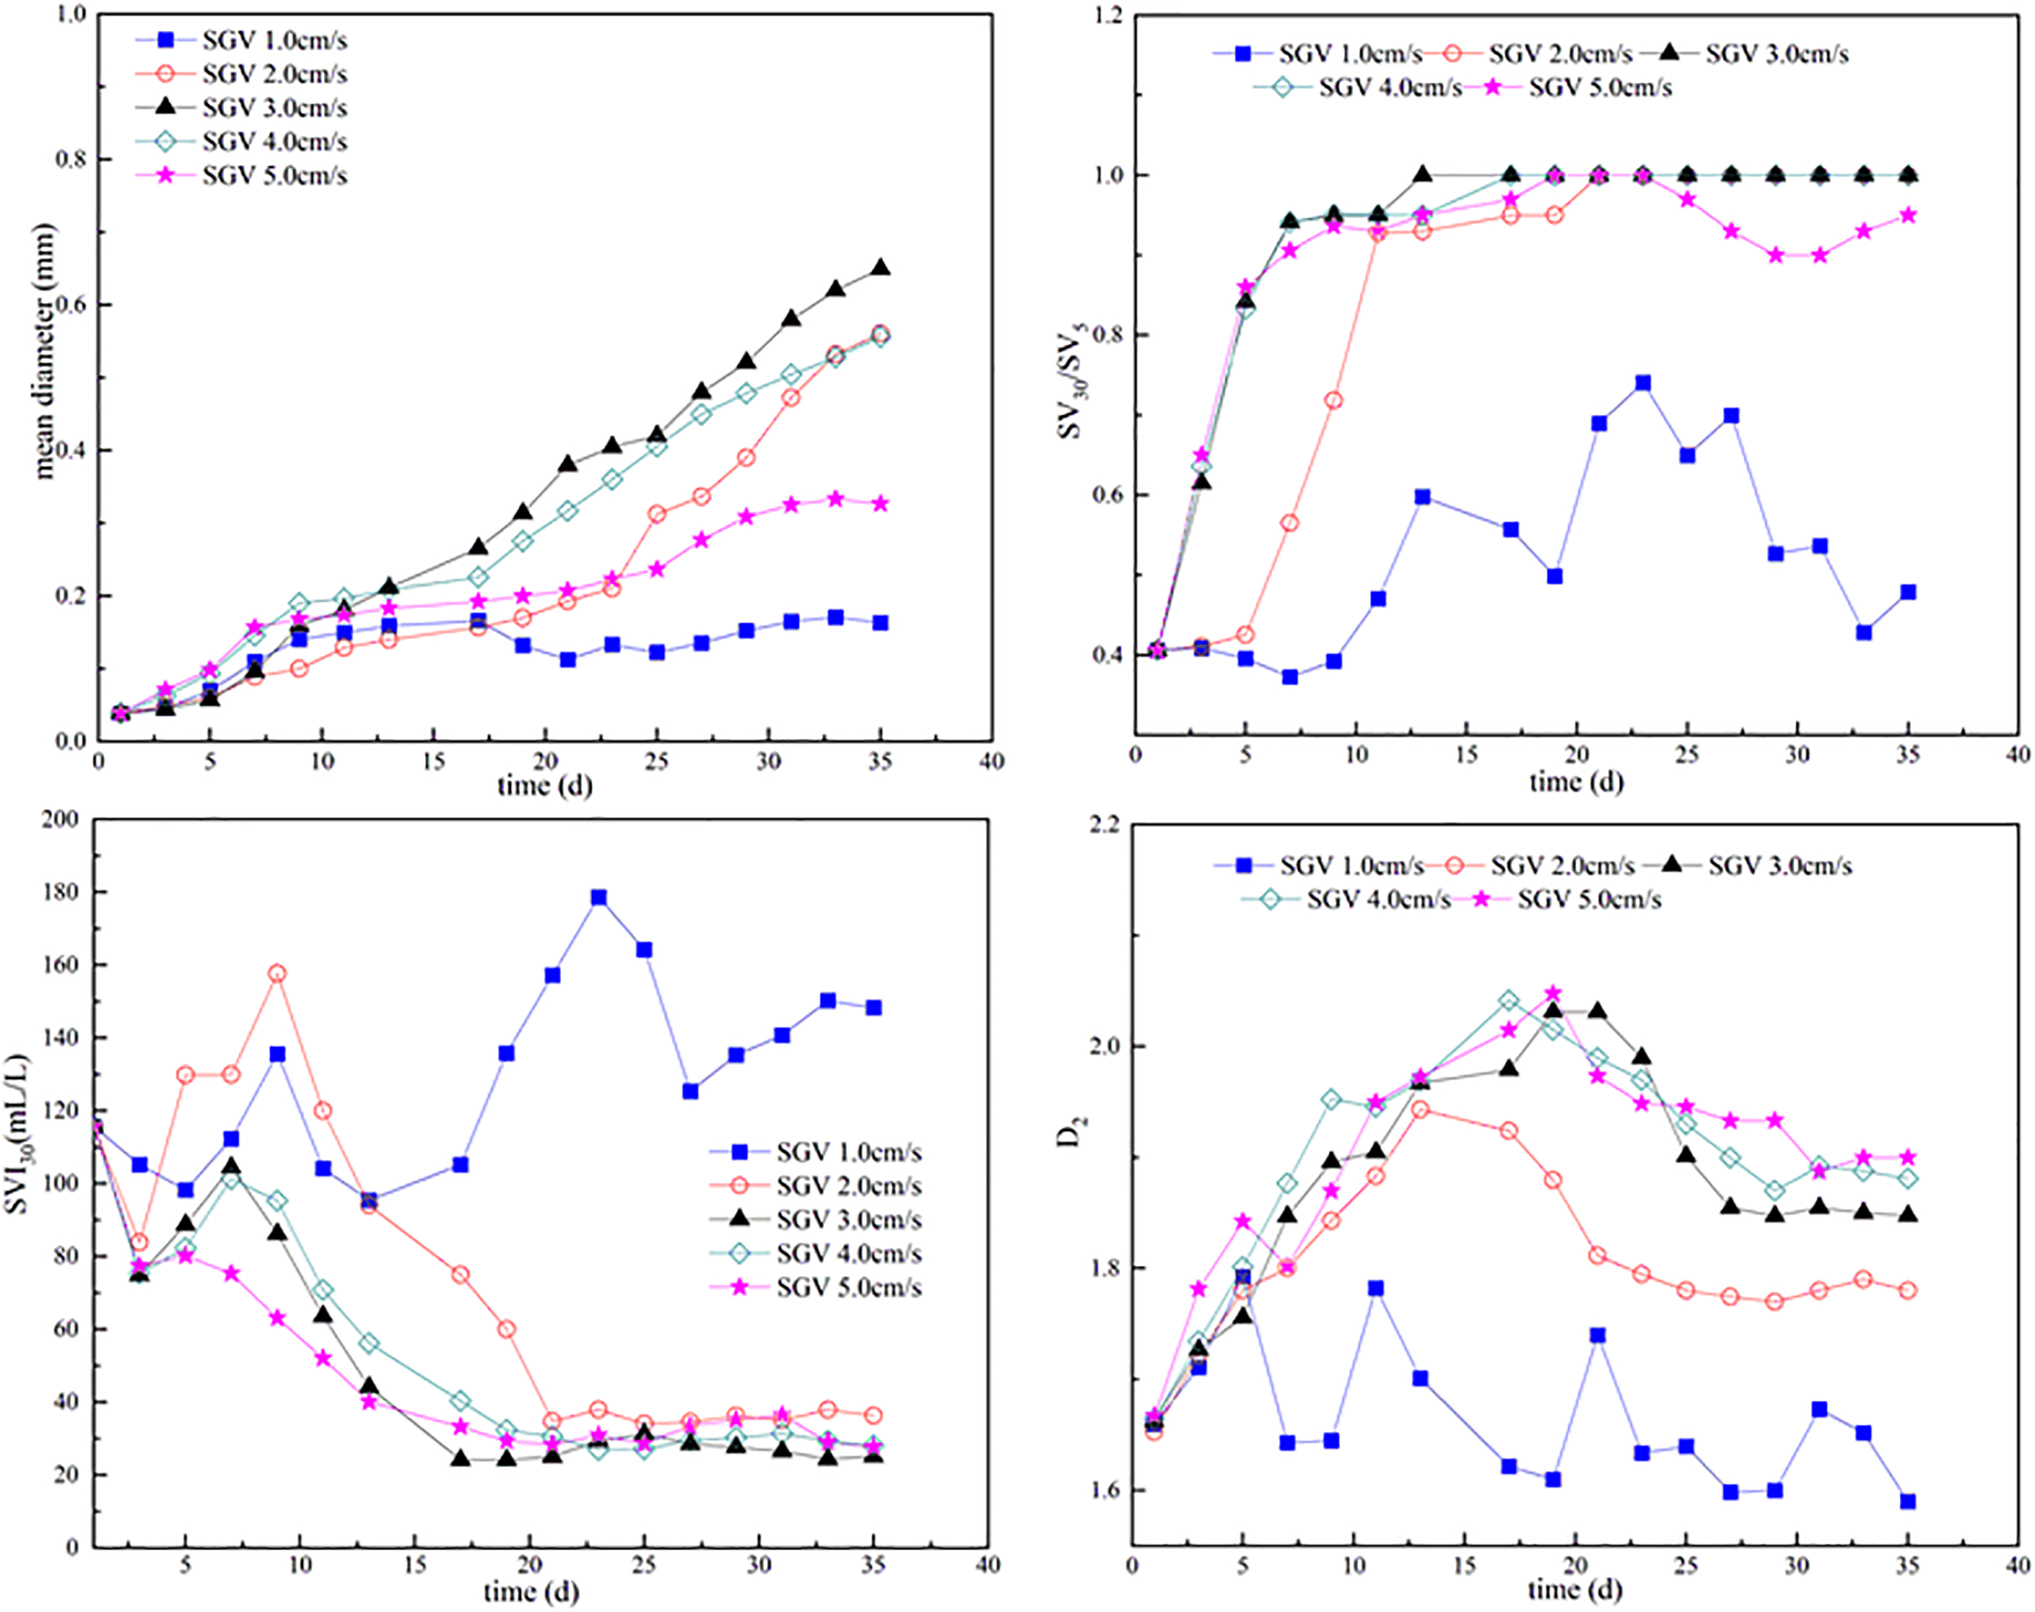
The properties of sludge along with the running time.
SVI30 is an index to describe the sludge settle ability, and it was 20–40 mL/g, which fell into the SVI30 range of AGS (20–100 mL/g) (Gao et al., 2011; Peng et al., 1999; Tay et al., 2001a), and it was lower than floc sludge with the SGV of 1.0 cm/s. Research suggested that the SV30/SV5 of mature AGS was lower than 10% (Liu and Tay, 2007; Long et al., 2014), and it stabilized above 0.98 at an SGV of 2.0, 3.0, and 4.0 cm/s, but it fluctuated at an SGV of 5.0 cm/s. In addition, at the same biological condition, the mean diameter of AGS at SGV of 2.0 cm/s was less than the value of 3.0 cm/s, whereas the SVI30 was higher. It was the result of the development of the flow structure.
The microscopic observation of activated sludge and the granules is shown in Fig. 6A. The AGS was more regular than the bio flocs, and it was smoother and denser at the SGV of 3.0, 4.0, and 5.0 cm/s. In addition, the SEM image illustrated that the granules at SGV of 3.0 cm/s were more compact than that at SGV of 2.0 cm/s (Fig. 6B), which was consistent with the results of D2. Besides, the removal rate of COD and NH4+-N was all kept above 90% after 15 days at the SGV higher than 2.0 cm/s (data not shown).

The appropriate flow pattern for aerobic granulation
The air or liquid flow pattern in a column reactor could create a relatively homogeneous circular flow along with the height of the reactor, the microbial aggregates constantly subjected to circular hydraulic attrition. A higher H/D ratio could ensure a longer circular flowing trajectory, which created a more effective hydraulic attrition for microbial aggregation (Liu and Tay, 2002). Nevertheless, under the H/D ratio of 10/6, the AGS cannot be formed even though the flow pattern was a circulation cell (Fan et al., 2019).
Furthermore, once a higher H/D ratio was ensured (even if additional conditions were used, e.g., shorten setting time, overstressed OLR), the formed AGS was not optimal, which had been confirmed by Liu and Tay (2002) and Beun et al. (1999). The primary reason for the result was that the flow pattern of only a longer circular flowing trajectory was not enough for the formation of AGS. As in the experiment of The Aerobic Sludge Granulation section, when the SGV was 1.0 cm/s, and the H/D ratio was 120/6, the long-path flow pattern was created for liquid and sludge, but no formation of AGS.
However, AGS was performed successfully after introducing a horizontal mechanic agitator in an aeration bioreactor under a lower H/D ratio (H/D = 1 and H/D = 2) (Chen et al., 2015; Fan et al., 2018; Liu et al., 2021; Tao et al., 2017). To understand these results from hydrodynamics, stirring would intensify the transverse force, and the flow pattern of transverse rotation may be beneficial to microbial aggregation. Tay et al. (2001b) confirmed that an SGV higher than 1.2 cm/s must be achieved to produce AGS when the H/D ratio was 80/6. Combining the result of CFD simulation, the liquid flow pattern of transverse rotation had occurred at this SGV.
Table 3 shows the properties of AGS under different H/D ratios and SGVs. The AGS formed at SGV of 1.6 or 1.7 cm/s and an H/D ratio higher than 4. However, the properties of AGS were fluffy and unstable. Corresponding to the results of the CFD model, at these operating conditions, the flow pattern was circulation flow in the vertical direction and rotation in the transverse direction. The composition of the experiment and model results illustrated that it was insufficient to form stable AGS only with a combination of transverse rotation and circulation flow pattern. According to the experiment (The Aerobic Sludge Granulation section and Table 3), the stable AGS was successfully formed only at higher H/D ratios and SGV higher than 2.0 cm/s.
Aerobic Granular Sludge Under Different Reactor Ratios of Height to Diameter and Superficial Gas Velocities
AGS, aerobic granular sludge; H/D ratio, reactor ratio of height to diameter; SGV, superficial gas velocity.
In these circumstances, whether the overstressed parameters did, according to the CFD simulation, all the flow patterns were not only developed into small-scale vortices in the vertical section but also had rotational movement in the transverse section, which enhanced the frequency and the quality of the circular hydraulic attrition. The three-phase flow simulation of AGS resulted that the flow pattern of multiple-cell vortices could develop in BCR, under the sludge diameter higher than 0.5 mm and the SGV higher than 2.0 cm/s (Fan et al., 2019). Demonstrating that the flow pattern of the original activated sludge is crucial to aerobic sludge granulation. The three-phase flow can simplify to gas-liquid two-phase at this condition. The AGS formed under various substrates (Table 3).
The CFD simulation of diverse substrate types and concentrations resulted in the small-scale vortices being easier to develop at the same SGV in wastewater. Hence, the combination of the experiment of aerobic sludge granulation and the CFD simulations of two-phase and three-phase flow shows that the flow pattern of the multiple-cell vortices is beneficial to stable microbial aggregation and development. In addition, at higher H/D ratios, the small-scale vortices were formed more easily at a less SGV, implying that the longer path will create more effective hydraulic attrition. It explains why AGS can be performed easily under a higher H/D ratio.
The combination of a higher H/D ratio (H/D > 4) and SGV of 2.0 cm/s could result in the evolution of small-scale vortices. However, it did not mean that a better exhibition of flow patterns would occur under the higher values of these factors. When the SGV increased to 5.0 cm/s (Fig. 2A.F and Supplementary Fig. S8), the number of vortices decreased; however, the size of the vortices increased, as well as the backflow between the adjacent vortices was observed in the reactor. The increase of the SGV enhanced the volume-averaged shear strain rate (Supplementary Tables S3 and S4), which coincided with Liu and Tay (2002).
However, the volume-averaged shear strain rate bombed up under the SGV of 5.0 cm/s. In addition, from the experiment of aerobic granulation (The Aerobic Sludge Granulation section), it is observed that the SV30/SV5 fluctuated at an SGV of 5.0 cm/s, and the mean diameter decreased. Combining the experiment and CFD simulation, it is speculated that the SGV 5.0 cm/s might be the critical value for aerobic sludge granulation. The reason was that the progressive increase of SGV caused the motion and drift of bubbles, and then affected the liquid motion. The chaotic motion of liquid would destroy the flow pattern of vortices and spirals resulting in a turbulent flow structure. The evolution of the flow pattern would influence sludge granulation.
The formation and stability of AGS were also dependent on the biological conditions, for example, OLR, C/N ratio, substrate type, and substrate concentration. These microbiological conditions not only affected the structure of sludge but also affected the hydraulic properties of BCR. The diameter of AGS correlated to the hydraulic shear force acting on the sludge surface.
At the identical SGV, the shear strain rate of starch was higher than the sodium acetate and glucose, and the glucose was the least (Supplementary Table S4). It illustrated that the diameter size of AGS is glucose first, sodium acetate seconded, and starch lasted, which explains the experimental result of Sun et al. (2006) from the hydrodynamic. A high OLR was beneficial to the process of aerobic sludge granulation, and the hydraulic shear strain rate was different because of the various substrate concentrations. However, after the concentration of COD was higher than 1,000 mg/L, the volume-averaged shear strain rate decreased with the increase in COD concentration (Supplementary Table S5). It demonstrated that the performed diameter of AGS enhanced with the increase of the OLR, which was the same as the experimental results of Moy et al. (2002) and Chen et al. (2008).
The reason was that the fluid viscosity varied because of the different substrate types and concentrations. It made a difference in the hydrodynamic property and internal friction of fluid (Zhang et al., 2004; Zhuang et al., 2009), and then influenced the hydraulic shear force acting on the surface. In the process of aerobic sludge granulation, microbes would secrete large amounts of extracellular polymeric substances (EPS) to resist the variation of fluid environment. And the increase of EPS enhanced the fluid viscosity and thus improved the internal friction. The increase of hydraulic shear force promoted the secretion of EPS again. The liquid viscosity, EPS secretion, and hydraulic shear force influenced each other to jointly facilitate the formation of AGS. Finally, they manifested as the various diameters of AGS at the macro level.
No matter what the biological parameters were, the above-mentioned flow patterns of AGS (Table 3) (The Aerobic Sludge Granulation section) (Chen et al., 2008; Sun et al., 2006) were all the multiple cells and transverse rotation, and the formation and stability conformed to the development of flow pattern. The column-type upflow reactor with a higher H/D ratio provided an optimal interactive pattern between fluid and microbial aggregates. The flow pattern of transverse rotation is essential to form AGS, and the corresponding SGV should be higher than 1.2 cm/s.
The structure of a small-scale spiral vortex is necessary for the stability of AGS, and the corresponding range for the SGV is 2.0–5.0 cm/s. Furthermore, at the same biological condition, the mean diameter of AGS at SGV of 3.0 cm/s was larger than 2.0 cm/s, and the granules were more compact at the SGV of 3.0 cm/s. It implied that, because of different distributions of the size and number of the vortices, the SGV might affect the time of granulation and the characteristics of the AGS. In addition, the AGS consisted of different diameters in the experiment (Ortega et al., 2022). It was related to the vortex size, which was not identical from the bottom to the top of the reactor.
Conclusions
In conclusion, the flow pattern of the bioreactor was predicted under different SGVs, substrate types, and concentrations by CFD simulation. The results showed that the flow pattern transformed from single-cell circulation to small-scale vortices with the increase of SGV, and the small-scale vortices were more easily developed with wastewater under the same SGV. SGV had a great contribution than the substrate. The experiment of aerobic sludge granulation was established under the SGV of 1.0–5.0 cm/s, and the AGS successfully formed with good settling ability under the SGV of 2.0–5.0 cm/s. The CFD simulation and experiment combination demonstrated the flow pattern and corresponding SGV for aerobic sludge granulation.
The flow pattern of transverse rotation was essential to form AGS, with the SGV higher than 1.2 cm/s. The structure of a small-scale spiral vortex was necessary for the stability of AGS, with an SGV of 2.0–5.0 cm/s. Also, the SGV 5.0 cm/s may be the critical value for aerobic sludge granulation. The distribution of size and number of vortexes is not identical with the various SGV and viscosity. It can influence the formation time, characteristics, and the distribution of diameter of AGS. It can be seen that the CFD simulation is an effective and economical way to predict the flow pattern for aerobic sludge granulation, and we can use it to explore the flow pattern in any BCR.
Footnotes
Authors' Contributions
W.F.: Conceptualization, methodology, visualization, and writing—original draft. L.Y.: Funding acquisition. Y.L.: Data curation.
Author Disclosure Statement
No conflict of interest exists in the submission of this article, and the article is approved by all authors for publication.
Funding Information
This work was supported by the National Natural Science Foundation of China (No. 51278406). This work was supported by the Doctoral Research Initiative Program of Xi'an Aeronautical Institute (206011944). This work was supported by the Research Foundation of Xi'an Aeronautical Institute (2020KY0218).
Notation
Subscripts
References
Supplementary Material
Please find the following supplemental material available below.
For Open Access articles published under a Creative Commons License, all supplemental material carries the same license as the article it is associated with.
For non-Open Access articles published, all supplemental material carries a non-exclusive license, and permission requests for re-use of supplemental material or any part of supplemental material shall be sent directly to the copyright owner as specified in the copyright notice associated with the article.