
Abstract
Concerns regarding endocrine disrupting compounds (EDCs) in wastewater treatment plant effluents have led to the need to better understand their fate during various treatment processes. The thermal hydrolysis process (THP) is a growing technology; this article aims to better understand the impacts of THP on EDCs. Serum bottles were used to understand how the THP of anaerobically digested wastewater influences concentrations of phthalic acid esters (PAEs) and antimicrobials. The succession of DNA-based microbial community was followed to assess conditions of contaminant biotransformation. Sludge samples were collected at different locations, placed in 250 mL serum bottles, and inoculated with samples collected from the anaerobic digestion solid recycle line to compare the influence of the THP pretreatment. Bottles were covered, kept at 37°C, and agitated for 22 days, with periodic destructive sampling for the chemical analysis of antimicrobials, PAEs, and transformation products, as well as the microbial community structure. Results demonstrated an increase in the concentrations of triclosan (TCS), triclocarban (TCC), and their transformation products with and without THP pretreatment. 2,4-Dichlorophenol increased at a significantly higher rate in pretreated sludge, while the TCC concentrations increased significantly faster in untreated sludge. Pretreatment did not significantly influence the formation rates of TCS and methyl triclosan. Pretreatment impacts on phthalate concentrations varied. Di(2-ethylhexyl) phthalate decreased and diisononyl phthalate concentrations were unchanged. Benzyl butyl phthalate increased in sludge that had undergone pretreatment and decreased in sludge without. PAE metabolites generally increased during the course of the experiments. Results demonstrate the potential for complex transformation processes and indicate the ability of THP to influence concentrations of certain compounds of concern. Analysis of the microbial community structure did not demonstrate any statistically significant difference between sludge with pretreatment and sludge without over the course of the experiment. These results indicate that changes in chemical concentrations could be due to other physicochemical mechanisms not examined.
Introduction
The land application of treated wastewater sludge, or biosolids, as a means to improve soil quality (Lu et al., 2012; Wang et al., 2008) has become common practice in various regions worldwide. For instance, more than 50% of treated sludge produced within the United States, Europe, and Canada is land applied (Cogger et al., 2006; Iranpour et al., 2004). While this practice can help to increase soil nutrient concentrations, organic matter composition, and water holding capacity (Lu et al., 2012; Wang et al., 2008), the land application of biosolids can also act as an environmental source of organic pollutants, including endocrine disrupting compounds (EDCs). Such compounds are not always fully degraded during the wastewater treatment process and can accumulate in wastewater sludge (Armstrong et al., 2018a; Komesli et al., 2015; Lozano et al., 2013).
Compounds such as phthalate plasticizers (phthalic acid esters [PAEs]) and triclosan (TCS) and triclocarban (TCC), compounds that have been utilized in consumer products for their antimicrobial capabilities, are considered to be EDCs (Ahn et al., 2008; Ghisari and Bonefeld-Jorgensen, 2009; Hinther et al., 2011) and have been detected in biosolids, with concentrations reaching as high as 340 mg/kg dry weight (dw) (PAEs), 441 mg/kg dw (TCC), and 133 mg/kg dw (TCS), respectively (Armstrong et al., 2018a; Armstrong et al., 2018c; Armstrong et al., 2017; Beauchesne et al., 2008; Clarke and Smith, 2011). Concerns regarding the health and environmental impacts of these compounds have garnered the attention of regulatory agencies. In 2016, TCS was rejected for use in the European Union in human hygiene biocidal products for skin and scalps (European Commission, 2016).
Also in 2016, the US Food and Drug Administration instituted a phase-out of both TCS and TCC from over the counter antiseptic washes, such as hand soaps, bar soaps, and body washes (US FDA, 2016). In addition, both the United States and European Union regulate the amount of several PAE compounds allowed for use in toys and children's products (Negev et al., 2018). Moreover, some transformation products of these EDCs can also display toxicological properties including endocrine disruption and damage to protein synthesis (Ahn et al., 2008; Hinther et al., 2011; Kim and Lee, 2005; Kim et al., 2003), further emphasizing the negative impacts these compounds may have when released into the environment.
The individual biosolid treatment processes utilized by wastewater treatment plants (WWTPs) can have a varying effect on TCS, TCC, and PAE concentrations in the biosolids (Armstrong et al., 2018c; Armstrong et al., 2017; Pycke et al., 2014), as well as on the nature of the biosolid organic matter (Fischer et al., 2020; Hart et al., 2022). Anaerobic digestion (AD) is an example of a sludge stabilization process that uses complex, anaerobic microbial processes to generate methane (biogas) (Riviere et al., 2009). As more WWTPs move to use treatment methods that enhance the resource recovery of biosolids and biogas (WEF, 2014), it is important to understand how variations of AD processes can influence antimicrobial and PAE concentrations in biosolids. The Cambi Thermal Hydrolysis Process (CambiTHP)™ is an AD pretreatment process that can improve sludge biodegradability and reduce the volume of final solids.
A major benefit to the enhanced biodegradation provided by the thermal hydrolysis process (THP) is the increase in the production of biogas—a renewable energy source (CAMBI, n.d.). However, when THP is coupled with AD, the overall process can have a varying effect on EDC concentrations. For example, the treatment of wastewater sludge with THP was shown to significantly (p < 0.01) reduce TCC concentrations, while TCS and its transformation products were unaffected. Furthermore, concentrations of TCS and its transformation products increased during AD of sludge pretreated with THP (Armstrong et al., 2017).
A similar study focusing on four PAEs throughout the combined THP-AD treatment demonstrated that the treatment resulted in higher concentrations of all four compounds during AD, while THP did not have any impact on compound concentrations (Armstrong et al., 2018a). For polybrominated diphenylethers (PBDEs), it was observed that the concentration of lower brominated congeners increased, while that of PBDE 209 decreased during THP treatment (Wang et al., 2018).
While THP pretreatment can physically degrade various chemicals of concern before AD and enhance the subsequent biogas production, it is not known whether the pretreatment may also affect the downstream anaerobic microbial community capable of degrading EDCs. Gonzalez-Gil et al. (2018) found that more organic compound (i.e., antibiotics sulfamethoxazole and trimethoprim) transformation products were adsorbed to biomass rather than measured from a liquid-phase anaerobic digestate, despite the liquid phase being more bioavailable. However, concurrent changes in the mixed microbial community were not assessed by molecular approaches (Gonzalez-Gil et al., 2018). Biotransformation of many low-abundance emerging organic contaminants in wastewater reactors has been modeled as occurring by cometabolic metabolisms, the simultaneous degradation of two or more compounds with generally one compound utilized for growth and metabolism (Criddle, 1993; Fischer and Majewsky, 2014; Plósz et al., 2010).
Several studies have also shown that biotransformation of organic pollutants improved, when the overall metabolism of microorganisms was stimulated in wastewater reactors by substrate enhancement (Fernandez-Fontaina et al., 2014; Fischer and Majewsky, 2014). While THP pretreatment enhanced methanogenic conditions for AD, no known work has evaluated whether this pretreatment changes the overall microbial community structure thus enhancing the transformation of EDCs in AD.
The objective of this study was to evaluate the effect of CambiTHP pretreatment on AD on biosolids at a laboratory scale. Furthermore, it was assessed how the innovative pretreatment process influenced concentrations of TCS, TCC, PAEs, and their transformation products during the digestion process. The microbial community structure was assessed in mesocosms to determine if (1) the anaerobic microbial community structure was altered by THP pretreatment and (2) if this change was related to a difference in the EDC transformation rate.
Materials and Methods
WWTP background
The present study centered on sludge samples collected from a large municipal WWTP. The facility, located in the mid-Atlantic region of the United States, provides sewage treatment to more than 2 million customers—∼1.14 million m3 of raw sewage per day. Treatment at the facility is achieved via primary sedimentation, activated sludge treatment, nitrification–denitrification treatment, filtration, and disinfection. Sludge is pretreated by the full-scale CambiTHP as follows: centrifugation of solids, preheating of sludge to 60–99°C using recycled steam, hydrolysis of sludge using heat (150–180°C) and pressure (0.37–0.95 MPa), and a rapid decrease of heat and pressure in a flash tank. After CambiTHP, biosolids are anaerobically digested at 37°C for ∼22 days before dewatering by belt presses.
Treated biosolids from the WWTP are classified as Exceptional Quality Class A biosolids by the United States Environmental Protection Agency (US EPA) and are typically land-applied to agricultural fields in the region. Further details regarding the CambiTHP/AD process at the facility can be found elsewhere (Armstrong et al., 2018a; Armstrong et al., 2017).
Sample collection and experimental setup
Sludge from the study WWTP was collected (1) after centrifugation, but before CambiTHP treatment [henceforth classified as “without thermal hydrolysis (TH) pretreatment”] and (2) after THP treatment, postflash tank (considered “with TH pretreatment”). The AD sample used as an inoculant for the experiment was collected from an AD solid recycle line. Metal buckets and glass sampling jars were used for sample collection to avoid the use of plastic during the campaign and, thus, prevent contamination of samples with phthalates.
AD experiments were carried out using 250 mL serum bottles. Each bottle was filled with 20 mL of sludge substrate without TH pretreatment and 130 mL of AD inoculum or 22 mL of sludge substrate with TH pretreatment and 128 mL of AD inoculum. Volumes were chosen to maintain an inoculum to substrate volatile solid ratio of 1.5:1 (Moody et al., 2011; Raposo et al., 2011). AD inoculum only was also incubated in serum bottles to account for the intrinsic biogas production, microbial changes, and chemical degradation, herein referred to as ADInocDay 0, 10, or 22, in duplicate.
Additional treatment controls were set up in the same manner as the experimental bottles, but were treated with 1 g of mercuric chloride to sterilize the sample (Armstrong et al., 2018b), while the inoculum control bottles consisted of 150 mL of AD inoculum only. Before sealing with rubber stoppers (no plastic utilized), each bottle was purged with N2 gas. The sludge matrix was not in contact with the rubber stoppers during experiments. In addition, since TCS can undergo photolysis, each bottle was wrapped in aluminum foil to prevent light exposure of the samples. The bottles were then placed on tabletop shakers for consistent agitation and maintained at 37°C in a dark incubation room for 22 days to mimic the conditions in the WWTP.
Serum bottles were prepared so that the destructive sampling at predetermined time points could take place, allowing for the fate of TCS, TCC, PAEs, and their transformation products over the course of experiments to be determined. Destructive sampling occurred on days 0, 1, 3, 5, 7, 10, 13, 17, 20, and 22 for chemical analyses. Duplicate bottles were sacrificed at each time point. In addition to organic compound analysis, these samples were also analyzed for total solids (TS), volatile solids (VS), soluble chemical oxygen demand (sCOD) [SF4], pH [SF5], volatile fatty acids (VFAs), and methane content in biogas. In addition, DNA was extracted from ∼0.25 g sludge (wet weight) via a PowerSoil® DNA Isolation kit (MoBio Laboratories, Inc., Carlsbad, CA) according to the manufacturer's guidelines.
The quantity and quality of the extracted DNA were assessed with a NanoDrop 2000c (Thermo Scientific, Wilmington, DE) before Illumina sequencing on samples from the beginning (day 1), middle (day 10), and end of the experiment (day 22), further detailed in the DNA Extraction and Amplicon Sequencing and Sequence Processing section. Mesocosm duplicates were also sequenced for day 1, 10, and 22 for mesocosms with TH pretreatment mesocosms, and without TH pretreatment mesocosms. Genomic DNA was also extracted and sequenced for the starting substrate from the THP influent, THP effluent, and incubated AD inoculum, and days 0, 10, and 22.
Target analytes
Experimental target analytes consisted of the antimicrobials TCS and TCC, several PAEs, and at least one commonly detected transformation product for each compound. The compounds analyzed are listed in Table 1. Details regarding suppliers of analytical standards and standard purities are described in Supplementary Table S1.
Chemical Compounds Analyzed, Their Common Uses, Recovery Rates, and Limits of Quantitation
BBP, benzyl butyl phthalate; DCC, 4,4′-dichlorocarbanilide; 2,4-DCP, 2,4-dichlorophenol; DEHP, bis(2-ethylhexyl) phthalate; DiNP, diisononyl phthalate; LOQ, limits of quantitation; MBeP, monobenzyl phthalate; MBuP, monobutyl phthalate; MCC, 1-(3-chlorophenyl)-3-phenylurea; MeTCS, methyl triclosan; MEHP, mono-(2-ethylhexyl) phthalate; MNP, monoisononyl phthalate; NCC, carbanilide; TCC, triclocarban; TCS, triclosan.
Chemical extraction methods and analyses
Before extraction and analysis of the compounds outlined in Table 1, all samples were lyophilized (Labconco FreeZone 6 Plus, Kansas City, MO) without separating the liquid and solid fractions. The samples were extracted for TCS, TCC, and their transformation products using a Dionex accelerated solvent extraction (ASE) (Dionex Corporation, Sunnyvale, CA) system in conjunction with the Oasis® HLB solid-phase extraction (SPE) cartridges (Waters Corporation, Milford, MA), as previously published (Lozano et al., 2012), with one modification: a solution of ethyl acetate:diethyl ether (65:35 v/v) was used for SPE conditioning and elution rather than the previously published dichloromethane:diethyl ether (80:20 v/v) solution.
After extraction, the samples were analyzed for TCS, TCC, and all the transformation products using a Shimadzu Nexera X2 Ultra High Performance Liquid Chromatograph coupled to a Shimadzu 8040 triple quadrupole mass spectrometer (UHPLC-MS/MS) (Shimadzu North America, Columbia, MD) using an electrospray negative source and a mobile phase of 10 mM ammonium acetate in methanol:acetonitrile:water (60:15:25 v/v). Afterward, all the samples were evaporated and reconstituted in hexane for methyl triclosan (MeTCS) analysis by an Agilent 7890B gas chromatograph (GC) with an Agilent 5977A mass selective detector (J&W Scientific, Folsom, CA) run in a positive electron impact ionization mode. Further details regarding UHPLC-MS/MS and GC-MS analytical conditions are provided in a previous publication (Armstrong et al., 2017).
For extraction of PAEs and their metabolites, the Dionex ASE system was also used via a solvent mixture of acetone:2-isopropanol (50:50 v/v), along with HyperSep™ Florisil SPE cartridges (Thermo Scientific, Waltham, MA) for sample cleanup. Elution from cartridges was achieved with a hexane:diethyl ether (80:20 v/v) mixture. Further details regarding this extraction method can be found elsewhere (Armstrong et al., 2018a; Armstrong et al., 2018c). PAE compound analysis occurred using the previously mentioned Shimadzu UHPLC-MS/MS instrument (Shimadzu North America) with a mobile phase of 5 mM ammonium formate in methanol and the MS electrospray ionization source also run in a negative mode, as previously published (Armstrong et al., 2018a).
Statistical analyses for antimicrobial and phthalate compounds were performed using GraphPad Prism 7 (GraphPad Software, Inc., San Diego, CA).
Microbial community analyses
DNA extraction and amplicon sequencing and sequence processing
For time points from the beginning, middle, and end of the experiment (days 1, 10, and 22), genomic DNA was extracted from ∼0.25 g (wet weight) of sludge using the PowerSoil DNA Isolation kit (MoBio Laboratories, Inc.) according to the manufacturer's guidelines. The quantity and quality of the extracted DNA were assessed with a NanoDrop 2000c (Thermo Scientific, Wilmington, DE) and optically sufficient to proceed to sequencing.
Analysis of the microbial communities was carried out by means of high-throughput amplicon sequencing using 300 bp paired-end sequencing chemistry using MiSeq Illumina at the University of Maryland, Biological Services Laboratory (Baltimore, MD). The V3-V4 region of the 16S rRNA gene was targeted for sequencing with the primers described by Klindworth et al. (2010) for both bacterial and archaeal populations. The preparation of libraries for barcode sequencing followed the manufacturer's instructions via the Illumina MiSeq V3-V4 protocol. This data set was demultiplexed, barcodes and adapters were trimmed before paired-end fastq file reads were further filtered, denoised, and merged via the Dada2 1.8 pipeline for R version 3.4.2, generating final amplicon sequence variants (ASVs), a higher resolution version of the traditional Operational Taxonomic Units (Callahan et al., 2016).
Briefly, primer sequences (16 bp long) were trimmed and unpaired reads were filtered to maintain a minimum Phred score quality of 10 across the read. Samples were dereplicated, and then forward and reverse reads were merged to obtain a consensus sequence with a minimum 25 bp overlap. The Dada2 1.8 pipeline was also utilized to remove chimeras and assign taxonomy via the SILVA, 16S rRNA database, version 128 (Quast et al., 2012).
Statistical community analysis
The phylotype-assigned data set was analyzed with R software packages of “vegan” version 2.5–3 (McMurdie and Holmes, 2013; Okansen et al., 2011) for microbial diversity, statistical, and consensus analysis. Sampling depth was assessed by generating rarefaction curves for each sample with vegan, function rarecurve. The relative abundance was computed by normalizing each ASV count to the sum of ASVs per sample, with the user-defined function of transform_sample_counts for phyloseq. The top 20 most dominant taxonomies per phylogenetic level were assessed with phyloseq's plot_bar function. Alpha diversity, or the representative per-sample diversity, was assessed by all standard measures on non-normalized count data with the plot_richness of phyloseq. Statistical differences of alpha diversity as a function of treatment were further assessed by an analysis of variance (function aov) modeling richness estimates (estimate_richness) against treatment or day.
Plots of community differences as a function of (1) substrate treatment (“with THP,” “without THP,” AD Inoculum only) or (2) time (days) were also assessed by several ordination methods applying Bray–Curtis dissimilarity estimates within the function options for ordinate in phyloseq (Fig. 5). Ordination of treatment and time effects were also appraised utilizing envfit {vegan} and metaMDS {phyloseq} assignment.
Sequencing samples was successful and contained an average of 206,690 ± 64,940 raw reads per sample, which were then entered into the Dada 1.8 pipeline. After filtering, denoising, merging, and chimera removal, an average of 45,470 ± 19,140 reads were kept for taxonomic assignment and analysis. Rarefaction curves confirmed that complete coverage of the microbial community was sampled from the incubation treatments TH or non-TH substrate (ADInnoc, with pretreatment substrate incubations, and without pretreatment substrate incubations [Supplementary Fig. S7]). The rarefaction results also showed that sequencing and processing of TH influent and TH effluent biosolid samples had sufficient sampling depth.
Sample characterization
Samples were analyzed for TS and VS using the standard methods established by the American Public Health Association (Clesceri et al., 2011). sCOD was determined using Chemetrics dichromate COD vials and a Hach Company digestor block with filtered samples (Armstrong et al., 2018b). The pH was monitored over time by centrifuging 15 mL of sample at 4,000 rpm for 10 min and measuring pH in the supernatant with a Thermo Scientific Orion pH probe.
VFA analysis
AD samples were analyzed for four VFAs: acetic acid, propionic acid, n-butyric acid, and n-valeric acid. Before the analysis, the samples were acidified to a pH of 2 using sulfuric acid and passed through 0.45 and 0.22 μm syringe filters. An HP 7890A GC (Agilent, Santa Clara, CA) was used for VFA analysis (Lansing et al., 2017). Samples for VFA analysis were collected from the serum bottles concurrently with those used for chemical analysis (days 0, 1, 3, 5, 7, 10, 13, 17, 20, and 22) and analyzed in triplicate.
Biogas characterization
All serum bottles were analyzed for the methane content of the biogas produced via sludge AD on the same day that antimicrobial and PAE samples were analyzed (days 0, 1, 3, 5, 7, 10, 13, 17, 20, and 22). The biogas was sampled from the serum bottles using a 100 μL gas-tight syringe and injected into an Agilent 6890 GC coupled with a thermal conductivity detector (Santa Clara, CA). The injection volume was 10 μL. Each serum bottle was analyzed in triplicate.
Quality assurance and quality control
Each destructive time point consisted of samples collected from two serum bottles, run as duplicates. Similarly, sampling from each serum bottle for target analyte analysis was done in duplicate. Before extraction, samples were spiked with the surrogate standards 13C13-TCC, 13C12-TCS, 13C12-MeTCS, d3-2,4-DCP, d4-DEHP, d4-MNP, d4-BBP, and d4-MBuP. All extraction batches included a blank (laboratory-grade sand) and a sample spiked with unlabeled target analytes for determination of recovery (Table 1). Extraction batches consisted of no more than 12 samples at a time. Method detection limits (MDL) for each compound were determined as outlined by the US EPA (US EPA, 1984), and the limits of quantitation (LOQs) were set as two times the MDL (Table 1).
Calibration curves for instrumental analysis consisted of at least six nonzero standards and run before and after sample analysis, yielding r2 values ≥0.99. Two standards and 2 solvent blanks were also analyzed every 10 samples as a verification of instrument stability.
Results and Discussion
Antimicrobial compounds
TCS and TCS transformation products
The concentrations of TCS, MeTCS, and 2,4-DCP increased over the course of the experiments both with and without TH pretreatment (Fig. 1a–c). Linear regression analysis was applied to the data sets for all three compounds. Concentrations of TCS significantly increased during the course of the experiment with TH pretreatment (R2 = 0.87, p < 0.0001) and without (R2 = 0.79, p = 0.0006). Furthermore, an extra-sum-of-squares F test indicated that the slopes of each regression model fit the TCS concentrations with and without TH pretreatment [m = 221.9 ± 28.11 ng/g-day dw and 242.6 ± 44.47 ng/g-day dw, respectively] but were not significantly different (p = 0.71). Similarly, linear regression analysis also indicated that the concentrations of MeTCS increased in pretreated (R2 = 0.81, p = 0.0004) and nonpretreated (R2 = 0.92, p < 0.0001) AD sludge samples (Fig. 1b).

Concentrations of the detected antimicrobials
As it was observed with TCS, the slopes of the MeTCS linear models were not significantly different (p = 0.23) for anaerobic reactors run with TH pretreatment (m = 6.67 ± 1.154 ng/g-day dw) and without TH pretreatment (m = 8.23 ± 0.885 ng/g-day dw), as determined with the extra-sum-of-squares F test. These results demonstrated that the TH process did influence the fate of TCS and MeTCS during the AD process, when compared with sludge digested without pretreatment.
A previous study focusing on the fate of antimicrobials throughout a full-scale installation of the TH-AD process also found that concentrations of TCS and MeTCS significantly increased during AD treatment, as it was observed in the present study. However, that study concluded that the TCS and MeTCS increases were likely due to the notable reduction in the total solids due to biogas production rather than a direct result of TH itself (Armstrong et al., 2017). Results from the present study were presented on a wet weight basis as a means of compensating for the loss of solids over the 22-day treatment (Supplementary Fig. S1) and demonstrated an increase in TCS and MeTCS concentrations despite this method of data presentation. One explanation for the increase in TCS and MeTCS concentrations during the AD process could be their formation from other metabolites and compound derivatives.
TCS degradation is complex, with numerous intermediates forming during the process (Latch et al., 2004; Lee et al., 2012; Mulla et al., 2016), which may, in turn, continue to degrade during treatment or reform into the parent compound, depending on the specific intermediate and environmental conditions. Furthermore, higher chlorinated derivatives of TCS may be formed during the transport of wastewater to a WWTP and within the treatment system itself, particularly when TCS is exposed to sodium hypochlorite (McAvoy et al., 2002). Deconjugation of metabolites or dechlorination of compounds such as tetra(II)closan [4,5-dichloro-2-(2,4-dichloro-phenoxy)-phenol], tetra(III)closan [5,6-dichloro-2-(2,4-dichloro-phenoxy)-phenol], and pentaclosan [4,5,6-trichloro-2-(2,4-dichloro-phenoxy)-phenol], which have been detected in raw wastewater influents (McAvoy et al., 2002), may be partly responsible for the formation of TCS during AD.
Further research into the presence of additional TCS intermediates and derivatives, as well as a more complex study into solid concentrations during treatment, needs to be explored to gain a better understanding of why TCS concentrations increase during AD treatment.
Concentrations of 2,4-DCP were impacted by TH pretreatment (Fig. 1c), as observed in a previous study in the same WWTP (Armstrong et al., 2017), unlike TCS and MeTCS. Linear regression models demonstrated significant increases of 2,4-DCP both with (R2 = 0.99, p < 0.001 [excluding days 20 and 22]) and without (R2 = 0.84, p = 0.0002) TH pretreatment. The exclusion of the time points for days 20 and 22, which demonstrated a clear break from the trend and were determined to be significant outliers by the ROUT method calculation, showed that the concentrations of 2,4-DCP during AD increased at a higher rate when pretreatment occurred (m = 48.44 ± 1.898 ng/g-day dw) compared with no pretreatment (m = 24.35 ± 3.715 ng/g-day dw). The difference in the rate of compound formation was significant (extra-sum-of-squares F test, p = 0.0001).
Since TCS degradation was not observed and precautions were taken to prevent photolysis, increases in 2,4-DCP concentrations were likely due, in part, to its formation during the degradation of other organic compounds. Compounds such as the herbicides 2,4-dichlorophenoxyacetic acid (2,4-D) (Oturan, 2000) and dichlorprop (Chiron et al., 2007) have been shown to form 2,4-DCP as a degradation product. Pretreatment of wastewater sludge by TH may allow for more efficient degradation of other organic compounds, thus causing a greater increase in 2,4-DCP formation during AD with pretreatment compared with AD without pretreatment.
TCC and TCC transformation products
TCC can undergo dechlorination resulting in the products DCC, MCC, and NCC (Miller et al., 2008; Pycke et al., 2014; Yun et al., 2016). However, this process was not observed during the experiments as the dechlorination products of TCC were not detected at or above the LOQ and TCC concentrations increased (Fig. 1d). A linear regression analysis revealed that the increases in TCC levels during AD were significant when pretreatment was absent (R2 = 0.90, p < 0.0001). TCC concentrations increased at a rate of 83.24 ± 9.577 ng/g-day dw in untreated material (Fig. 1d). However, while the rate of increase of TCC concentrations in biosolids that underwent TH pretreatment (m = 2.665 ± 1.036 ng/g-day dw) was significant (R2 = 0.45, p = 0.033), the rate of change was significantly slower than that of sludge digested without pretreatment (extra-sum-of-squares F test, p < 0.0001).
In addition, the initial concentrations of TCC were ∼10 times higher in sludge that did not undergo TH pretreatment. A previous on-site study demonstrated that this was due to the TH pretreatment process significantly reducing TCC concentrations from 6,816 to 75.4 ng/g dw (Armstrong et al., 2017). Potential reasons for the increase of TCC concentrations are likely similar to those for TCS—mainly the transformation of intermediates. Souchier et al. (2016) outlined several proposed dechlorination pathways of TCC that involved a number of intermediates (Souchier et al., 2016). Similar to the case with TCS, higher chlorinated congeners of TCC exist and have been observed in environmental samples (Souchier et al., 2015). Therefore, transformation of these intermediate and/or congener compounds into TCC may be taking place during the AD process.
Further research into the fate of specific TCC intermediates and the higher chlorinated TCC derivatives needs to be explored as a means to further understand why TCC concentrations increase during AD treatment.
Phthalic acid esters
For all PAE compounds (DEHP, MEHP, DiNP, MNP, BBP, MBuP, and MBeP) and treatments (AD with and without TH pretreatment), rates of change were calculated using pseudofirst-order kinetics according to Equation (1):
and are provided in Table 2.
Rates of Change for Detected Phthalate Compounds During Course of Experiment
TH, thermal hydrolysis.
DEHP and MEHP
Overall, DEHP concentrations in biosolids decreased during AD, while the metabolite MEHP increased during treatment (Fig. 2a, b). Two previous studies concluded that the concentrations of DEHP increased during AD with pretreatment (Armstrong et al., 2018a; Armstrong et al., 2018c), while results from this study did not support this finding. Instead, DEHP concentrations decreased during the course of the experiments at rates −0.0036 ± 0.0098 day−1 with TH pretreatment and −0.0126 ± 0.0039 day−1 without TH pretreatment. DEHP degradation rates were not statistically different (p = 0.37, extra-sum-of-squares F test). MEHP concentrations increased during both treatments, with rates of increase (Table 2) for both treatments not statistically different (p = 0.29, extra-sum-of-squares F test). However, the rates of MEHP increase with and without TH pretreatment were more rapid than the DEHP decrease.

Concentrations of the detected phthalates and phthalate metabolites
An explanation for this may be the formation of MEHP through other DEHP metabolites, such as mono-(2-ethyl-5-carboxypentyl)phthalate, mono-[2-(carboxymethyl)-hexyl]phthalate, mono-(2-ethyl-5-hydroxyhexyl)phthalate, and mono-(2-ethyl-5-oxy-hexyl)phthalate (Chang et al., 2013) indicating that a more complex DEHP degradation process may be taking place than has been analyzed for in the current study.
DiNP and MNP
Concentrations of DiNP increased with TH pretreatment (Fig. 2c) at a rate of 0.00195 ± 0.0033 day−1, while concentrations decreased without pretreatment (−0.0022 ± 0.0079 day−1) (Fig. 2d). Similar to the observations of DEHP, concentrations of DiNP were previously observed to increase in sludge undergoing AD after TH pretreatment (Armstrong et al., 2018a; Armstrong et al., 2018c), which was not confirmed by results from the present study. MNP, on the other hand, increased at rates that were not statistically different (p = 0.20, extra-sum-of-squares F test) both with and without pretreatment (Table 2). Concentrations of this metabolite were more than an order of magnitude lower than DiNP concentrations, indicating that it may not be primarily the DiNP metabolite during AD treatment.
BBP, MBuP, and MBeP
Concentrations of BBP decreased in AD sludge without pretreatment (−0.0648 ± 0.030 day−1), while concentrations increased with pretreatment (+0.0171 ± 0.010 day−1) (Fig. 2e, f). Rates of change were significantly different between the two treatments (p < 0.0001, extra-sum-of-squares F test). In a previous study on the fate of BBP at six different WWTPs, it was observed that AD had a varying impact on concentrations of BBP; both conventional AD and more advanced AD systems, such as TH pretreatment or digestion via a 2-phase acid/gas process, were capable of increasing or degrading BBP during treatment, depending on the individual system. Specifically, TH pretreatment increased BBP levels, while concentrations decreased in the 2-phase acid/gas system. Furthermore, the two WWTPs that used conventional AD treatment displayed conflicting impacts on BBP concentrations—one caused the increase of the compound during treatment, while BBP concentrations decreased at the other WWTP (Armstrong et al., 2018c).
In addition, a study focusing on phthalate compounds in methanogenic microcosms enriched with a BBP-degrading culture demonstrated a complete BBP degradation after a 30-day treatment period (Ejlertsson et al., 1997), indicating the ability of microbial species to remove BBP in anaerobic environments. Results from the present and previous studies imply that the influence of AD on BBP in wastewater sludge is complex. Further investigation into compound degradation and formation mechanisms during treatment is needed to evaluate the influence of anaerobic treatment on BBP.
The BBP metabolite MBeP increased in sludge that had undergone TH- pretreatment (+0.035 ± 0.0103 day−1), but an ∼20-fold lower rate of increase was observed in sludge that had not been pretreated (+0.0059 ± 0.0030 day−1). This difference in rates between the two treatments was not significant (p = 0.076, extra-sum-of-squares F test). A rapid and substantial increase of MBuP was observed during the course of the experiment, when compared with changes in BBP and MBeP concentrations. The final concentrations were approximately an order of magnitude higher than the starting BBP levels. MBuP concentrations were not correlated with BBP degradation, and thus, the formation was likely due to degradation of other PAE compounds. Ejlertsson et al. (1996) demonstrated the ability of dibutyl phthalate to degrade to MBuP under anaerobic conditions (Ejlertsson et al., 1996) indicating the potential presence of other PAEs to be present.
Methane production
Methane production was monitored because methane indicates a healthy microbial community and terminal product of the multistep cascade AD or carbon substrates. Methane accounted for 50% (standard deviation [st dev] = 0.40%) and 54% (st dev = 1.06%) of the total initial biogas production by sludge with and without pretreatment, respectively (Supplementary Fig. S2). For biosolids that did not undergo pretreatment, the level of methane dipped to 52% (st dev = 17.37%) on day 5. Methane percentages increased to ranges between 63% (st dev = 1.33%) and 69% (st dev = 5.59%) throughout the remainder of the experiment. Between experiment days 3 and 13, biosolids that were pretreated produced biogas with a percent menthane range between 60% (st dev = 5.20%) and 67% (st dev = 2.71%). After this time, the methane production decreased to 52.5% (st dev = 18.6%) by day 22.
Several data points (without pretreatment day 5 and with pretreatment days 17 and 22) were highly variable as evidenced by the large st devs (Supplementary Fig. S2) and may have been caused by instrumental error. Ultimately, no significant differences in methane between incubations over the course of the experiment suggest that both microbial communities metabolized either sludge substrate similarly.
Volatile fatty acids
VFAs were monitored because these fatty acids are fermentation precursors to methane production. The compounds are functional evidence of the microbial community's metabolism and decomposition of different sludges. Concentrations of the acetic, propionic, butyric, and valeric acids spiked on day 1 and decreased during the course of the experiments (Supplementary Fig. S3). The VFA concentration at day 1 was higher in reactors that had undergone pretreatment compared with concentrations in solids that were not pretreated, indicating that the substrate that has been pretreated by TH was more readily digestible. Acetic acid was the highest detected VFA. On day 1, concentrations peaked at 180 mM (st dev = 82.1 mM) in sludge with pretreatment and 27.7 mM (st dev = 0.87 mM) in sludge without pretreatment.
Concentrations of acetic acid were reduced over the 22-day period by ∼94% and 84% in samples with and without pretreatment, respectively. Propionic acid presence decreased by 88% and 69% in samples with and without TH pretreatment, respectively. Butyric acid was not detected in any reactors beyond day 3, while valeric acid was not detected beyond day 5.
Microbial community analysis
Microbial community analyses were used to assess the differences of bacterial and archaeal populations in the mesocosm containing THP or non-THP treatments. AD with biogas production is driven by a complex microbial community carrying out sequential and interrelated steps of decomposition, leading to fermentation (VFA production) and then methane formation (Amani et al., 2010; De Vrieze et al., 2016). Community assignments were most reliable for AD inoculum and incubated samples. The total read results were limited for TH effluent samples, with only 26,208 raw reads entering the Dada 2 processing pipeline and only high-quality 6,377 reads remaining likely due to the TH pretreatment hydrolyzing and damaging DNA during sterilization thus resulting in a lack of quality DNA able to successfully amplify during Illumina sequencing chemistry. DNA quality in both with TH and without TH sludge mesocosms were also influenced by the AD inoculum to substrate volatile solid ratio of 1.5:1.
The addition of the AD inoculum that was sampled during steady-state and functioning full-scale AD system was also a source of the methanogenic and fermenting archaea and bacteria to both TH and non-TH substrate mesocosm treatments. The sequencing results from AD only (sequenced as samples “ADInnoc”) are therefore also reported. Due to logistical constraints, the THP influent, effluent, AD inoculum, and 0, 10, and 22 in duplicate, for two treatments (i.e., n = 18 samples) were sequenced to represent changes in community composition at the beginning, middle, and end of the experiment. We do not feel that this limited our statistical interpretations herein as community compositions across treatments converged after 22 days, as follows.
In terms of taxonomic assignment, we hypothesized that the THP-treated biosolid incubations would stimulate more biogas production and a greater relative abundance of methanogens and that this may also relate to changes in the community metabolism of EDC. The methanogenic population was dominated by the Euryarchaeota methanomicrobia class. The relative abundance of this group increased to 4.3% ± 0.2% for the AD inoculum, 2.6% ± 0.8% for without pretreatment, and 5.0% ± 1.0% for with pretreatment after 22 days (Supplementary Fig. S7). These differences in relative abundances in methanogens appear to not be functionally consequential in the mesocosms, however, as there were statistical differences in methane production by day 22 (Supplementary Fig. S2). E. methanomicrobia class was dominated by genus Methanosaeta, previously identified in AD communities (De Vrieze et al., 2016).
The bacterial phyla of Firmicutes, Bacteroidetes, and Chloroflexi dominated, consistent with the core anaerobic phyla previously identified in a meta-analysis of 16S rRNA gene sequences from an anaerobic digester study deposited to the GenBank and RPD genomic databases [Supplementary Fig. S7, www.ncbi.nlm.nih.gov, http://rdp.cme.msu.edu (Nelson et al., 2011)]. The dominating Firmicutes were represented by genus Ruminococcaceae fastidiosipila, which are obligate anaerobic fermenting bacteria associated with cellulosic hydrolysis and H2 production (Morrison and Miron, 2000; Ziganshin et al., 2013). More detailed phylogenetic levels are presented in Supplementary Fig. S7. Overall, the identified fermenting and methanogenic microorganisms were consistent with major microorganisms involved in AD, but statistical analyses of alpha and beta diversity suggest that the different mesocosm treatments did not result in significantly contrasting communities over time (Fig. 3).
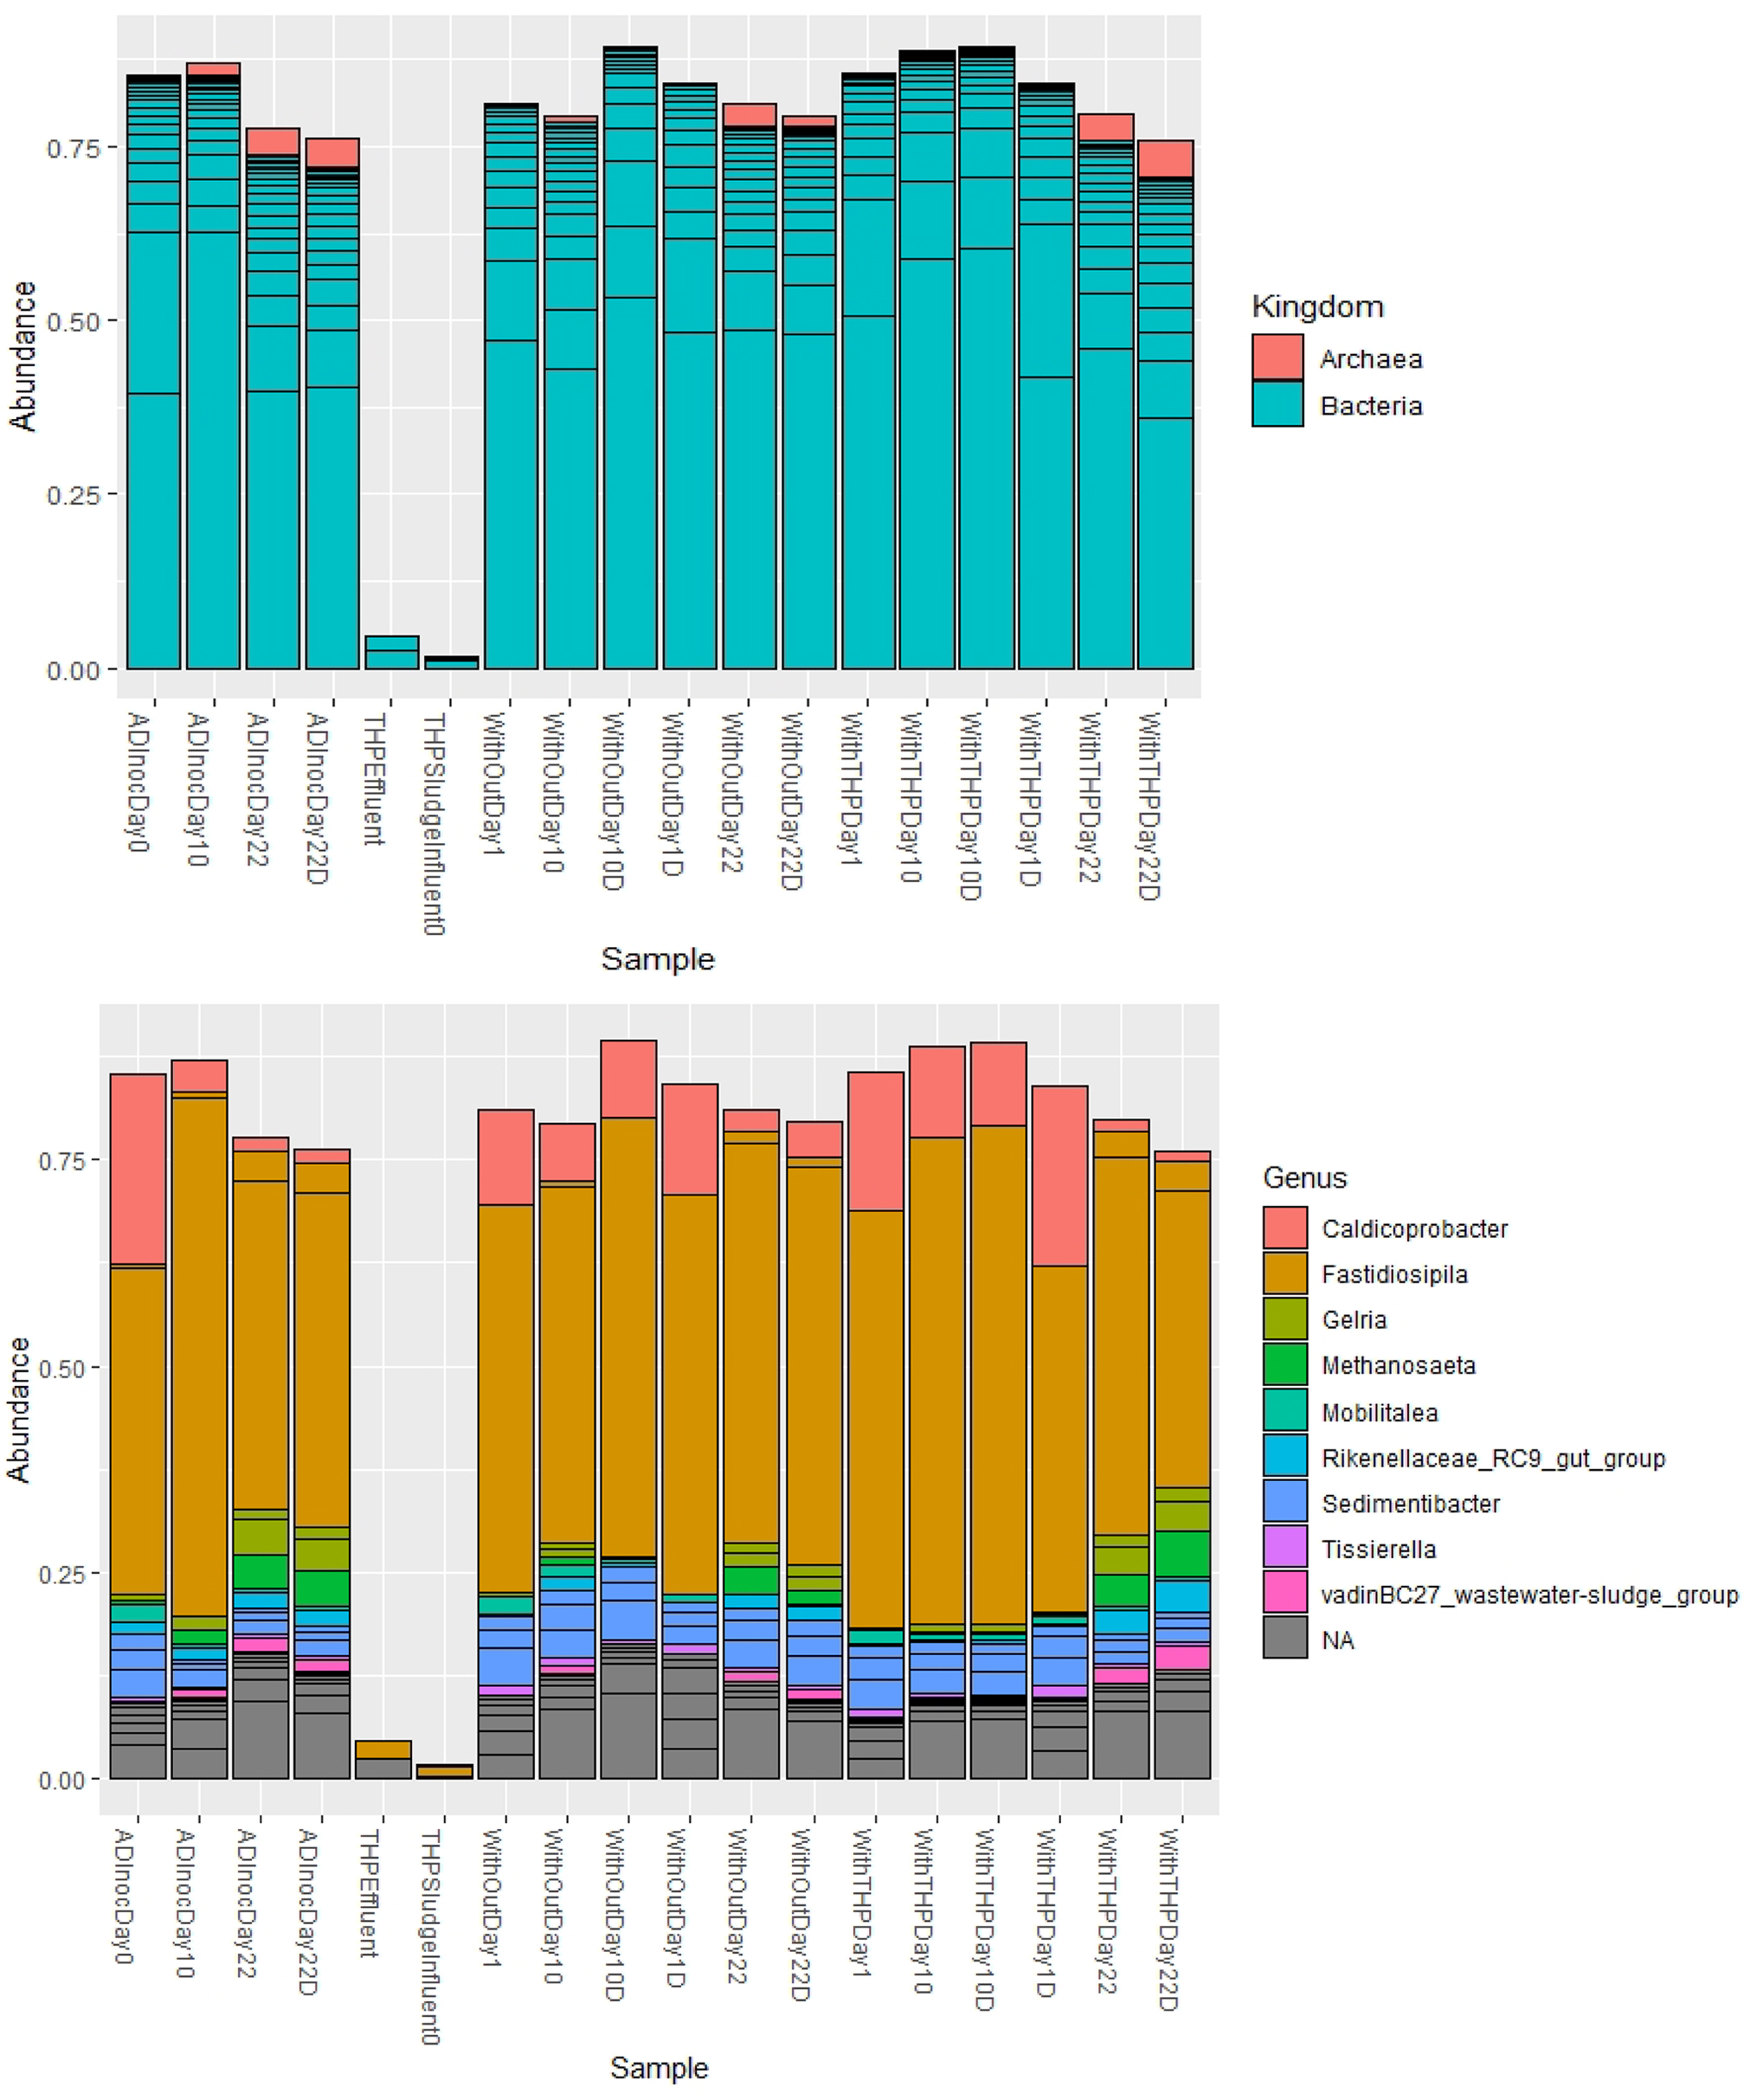
Relative abundance and taxonomic assignment for community structure at different phylogenetic levels across anaerobic mesocosm with THP substrate and without THP substrate. THP, thermal hydrolysis process.
To further discern community structure differences, computation of alpha diversity and beta diversity was evaluated on bioinformatic results. Alpha diversity measures indicated that the treatments of with pretreatment, without pretreatment substrate, or AD inoculum alone resulted in similar levels of community richness (Fig. 4a). The microbiome richness of THP sludge influent was greater than with pretreatment, without pretreatment, or ADInoculum dates, indicative of a different raw sludge community before the THP or AD treatment steps in the full-scale system. However, richness of mesocosms did not change as a function of time over the course of the incubations (Fig. 4b). Analysis of variance of alpha diversity as a function of mesocosm treatment confirmed a lack of statistical difference between mesocosm treatments (p = 0.726, Supplementary Fig. S8).

Alpha diversity analysis across mesocosm experiments with THP substrate and without. Computation of alpha diversity by several subtests is indicated.
Nonmetric multidimensional scaling (NDMS) ordination allows comparison of multivariate systems via dimensionless analysis. These ordination plots indicated that only the initial full-scale THP influent and effluent samples were dissimilar from inoculated mesocosm experiments (Fig. 5a). To further examine any substrate incubation differences with these outlier samples from the full-scale system, THP influent and effluent were removed from the NDMS statistical analysis. The THP influent microbial community is likely exposed to a range of aerobic and anaerobic conditions of sewer systems and upstream processes. The THP process also sterilizes the community, which likely explains why limited taxonomic assignments were possible for the THP effluent samples (Supplementary Figs. S6 and S7). Therefore, the THP effluent was assumed to only represent substrate that was then combined with anaerobic digester sludge at a ratio of 1.5:1 (the Sample Collection and Experimental Setup section).

NDMS Bray–Curtis dissimilarity analysis of community differences as a function of substrate treatment
After this, the NDMS ordination of samples was categorized as either “with pretreatment” or “without” incubations. Interestingly, these incubations did not result in statistical dissimilarity between the mesocosms due to the substrate (Fig. 5b). However, only dissimilarity between early incubations and later incubations (>day 15) was observed as a function of time (Fig. 5c). Figure 5c suggests that both treatments of mesocosm microbiomes developed in statistically similar ways over time. Similar results were seen with the additional principal component analysis (PCoA) (Supplementary Fig. S9). By PCoA, grouping by vectors of time and treatment did not result in significant correlation to either variable (Supplementary Fig. S10). Overall, statistical measures on microbiome diversity or community differences did not indicate that with pretreatment, without pretreatment, or ADInnoc controls had significantly different communities (Fernandez-Fontaina et al., 2014; Fischer and Majewsky, 2014).
Chemical analysis of VFAs and methane did not indicate a significant difference in activity between the THP- or non-THP-treated mesocosms. Similarly, the microbial community analysis did not reveal a significant difference between these treatments either. Instead, changes in the established community over the 22-day batch experiments were observed. The decrease in total VFAs over time is consistent with the methanogenic Methanomicrobia methanosaeta growth observed. These results suggest that while the THP pretreatment has full-scale benefits of enhancing biogas production, this batch mesocosm design may have not supported the establishment of a steady-state methanogenic community. Continuously mixed reactors may have supported a more stable methanogenic population to develop, where differences in abundance or activity due to substrate quality could be observed with bioinformatics, VFA analysis, and biogas production. De Vrieze et al. (2016) also demonstrated that 16S rRNA-based sequencing methods more strongly correlate to anaerobic digester activity measurements than DNA-based analysis.
Future work to elucidate the community metabolism effect on EDC degradation during AD could focus on additional RNA-based analysis. This study also only examined endogenous concentrations of endocrine disrupters and any microbial community differences presumed due to hydrolyzed sludge substrate. Future work could examine the effects of elevated endocrine disruptors to anaerobic digestion and microbial compositions by specifically dosing these compounds for a response.
Conclusions
Results from this study demonstrate the variable impacts that an individual treatment system can have on EDC fate in sludge. Concentrations of the antimicrobials TCS and TCC and their detected transformation products increased during AD with and without TH pretreatment. While there was no significant difference in the increased rates of TCS and MeTCS through the two treatment conditions, the rate of 2,4-DCP formation was significantly higher in sludge that had undergone TH pretreatment. TCC concentrations in sludge without TH pretreatment increased at a significantly higher rate when compared with biosolids digested with TH pretreatment (p < 0.001). The influence of AD and pretreatment on concentrations of PAEs and their metabolites was much more extensive. DEHP revealed decreasing trends during the course of the experiments, while DiNP concentrations remained unchanged. In contrast, BBP was statistically significantly impacted by pretreatment, with concentrations increasing with pretreatment and decreasing for biosolids without pretreatment.
Overall, PAE metabolites increased during AD, sometimes despite no degradation of the parent compound, implying a complex compound transformation process. Results indicate that TH treatment of wastewater sludge has the potential to influence antimicrobial and phthalate concentrations in biosolids, including the degradation products of these compounds, and, thus, influencing their presence in the environment through the land application of biosolids.
Microbiome analysis by bioinformatics did not indicate statistically significant differences in the anaerobic community structure with pretreatment, without pretreatment, or ADInnoc. Therefore, changes in EDC metabolite concentrations may have been due to other physicochemical mechanisms not thoroughly examined. While contrasting metabolic potential or taxa composition may alter EDCs in full-scale systems, microbial factors did not appear to drive changes in incubation differences.
Footnotes
Acknowledgments
The authors would like to thank Dr. Stephanie Lansing, Department of Environmental Science at University of Maryland, for her valuable advice regarding the experimental setup as well as use of her laboratory. The authors also thank Taylor Lachance, Hydrology and Remote Sensing Laboratory at the USDA, for her assistance with the GC-MS analysis of MeTCS.
Authors' Contributions
All authors have read and agree with the published version of the article. Conceptualization: D.L.A., S.J.F., B.V.K., and A.T.; methodology: D.L.A., S.J.F., B.V.K., and A.T.; validation: B.V.K., C.P.R., and A.T..; formal analysis: D.L.A., S.J.F., and R.L., writing—original draft preparation: D.L.A. and S.J.F.; writing—review and editing: C.P.R., B.V.K., and A.T; visualization: D.L.A., S.J.F., B.V.K., and A.T.; supervision: B.V.K. and A.T.; project administration: A.T.; funding acquisition: M.R. and A.T.
Author Disclosure Statement
No competing financial interests exist.
Funding Information
The research was funded, in part, by a collaboration agreement with DC water.
References
Supplementary Material
Please find the following supplemental material available below.
For Open Access articles published under a Creative Commons License, all supplemental material carries the same license as the article it is associated with.
For non-Open Access articles published, all supplemental material carries a non-exclusive license, and permission requests for re-use of supplemental material or any part of supplemental material shall be sent directly to the copyright owner as specified in the copyright notice associated with the article.