
Abstract
Nitrosamines, including N-nitrosodimethylamine (NDMA), are disinfection by-products of concern for drinking water utilities that use chloramines as a disinfectant. In this study, batch experiments were performed to investigate the effectiveness of preoxidation with ozone, free chlorine, or both on removal of NDMA precursors in raw, lime-softened, and recarbonated water from a full-scale water treatment plant treating primarily Mississippi River water and in a tributary water sample before and after bench-scale lime softening. NDMA “precursor” concentrations were assessed indirectly by quantifying NDMA formed after addition of preformed chloramines using the uniform formation conditions (UFC) protocol. NDMA concentrations (NDMAUFC) in the raw plant water were 8 ng/L in summer and 10 ng/L in winter and increased to 13–26 ng/L in lime-softened and recarbonated waters. NDMAUFC in the raw tributary water was 33.7 ng/L. Preoxidation by ozone at doses of up to 5 mg/L effectively decreased NDMAUFC concentrations in all water samples with and without hydrogen peroxide addition (hydrogen peroxide:ozone mass ratio of 0.5:1). The effectiveness of ozone at destroying ambient NDMA precursors was independent of water temperature and ozone dose. NDMA precursor destruction, however, increased with increasing ozone dose for a recarbonated water sample spiked with ranitidine (initial NDMAUFC = 358 ng/L). Free chlorine at a dose of 5 mg/L as Cl2 for 20 min of contact time (i.e., Ct ∼70 mg-min/L) was most effective at destroying ambient NDMA precursors in recarbonated water, and similarly, free chlorine treatment following ozone (2 mg/L) was more effective at destroying NDMA precursors in the ranitidine-spiked water than ozone alone. Preoxidation with ozone, free chlorine, or both proved to be an effective strategy for limiting NDMA formation upon subsequent chloramination for surface waters impacted by agricultural activities and municipal wastewater discharges.
Introduction
Disinfection of drinking water, primarily with chemical oxidants, has significantly improved public health by mitigating the risks affiliated with pathogen exposure. A chemical oxidant, however, can react with precursor compounds such as natural organic matter (NOM) or anthropogenic contaminants in source waters to form toxic and potentially carcinogenic disinfection by-products (DBPs). DBPs were first discovered in the 1970s when free chlorine, the predominant disinfectant in the United States, was shown to react with NOM to form toxic and potentially carcinogenic trihalomethanes (THMs) (Rook, 1974). The concentrations of THMs and another class of DBPs discovered in the early 1980s, haloacetic acids (Miller and Uden, 1983), in drinking water have subsequently been regulated by the USEPA (2022a).
Although a national survey of water utilities conducted in 2017 indicated that ∼70% of respondents still used free chlorine for disinfection, many utilities have transitioned to alternative disinfectants, such as ozone, chlorine dioxide, and chloramines, to reduce formation of regulated and other halogenated DBPs. Nonetheless, harmful DBPs are also associated with these alternative disinfectants: bromate and aldehydes with ozone; chlorite with chlorine dioxide; and nitrosamines with chloramines (Gilca et al., 2020; Shah et al., 2012). Chloramines are frequently used as a residual or secondary disinfectant, allowing time for nitrosamines to form in water distribution systems (Krasner et al., 2013).
With chloramination occurring in numerous utilities in the United States, nitrosamines are a DBP class of particular concern. Nitrosamines are potentially potent carcinogens and are associated with a 10−6 lifetime cancer risk when present in drinking water at nanogram per liter concentrations (USEPA, 2022b). Of the nitrosamines, N-nitrosodimethylamine (NDMA) is the most prevalent compound, and it has been detected in 34% of chloraminated drinking water samples according to a nationwide survey conducted as part of the Unregulated Contaminant Monitoring Rule 2 (Woods and Dickenson, 2015).
The main formation pathway for NDMA is the reaction of dichloramine, which co-occurs with monochloramine, with organic precursor compounds containing secondary, tertiary, or quaternary amine functional groups. Pesticides, fungicides, pharmaceutical and personal care products, and amine-based polymers used in water treatment have all been identified as NDMA precursors (Krasner et al., 2013; Sgroi et al., 2018). Municipal wastewater discharges often contain a variety of these anthropogenic precursor compounds and often contribute the highest load of NDMA precursors to a watershed, although agricultural activity and stormwater runoff are important sources of precursors as well (Aydin et al., 2012; Zeng et al., 2016).
Although there is no federal regulation for NDMA, NDMA was added to a draft of the USEPA drinking water contaminant candidate list 5 in 2021 (USEPA, 2021). Some states have established guidance or notification levels for NDMA, including a notification level of 10 ng/L in California and a guidance value of 5 ng/L in Minnesota (California Department of Public Health, 2013; Minnesota Department of Health, 2023). The World Health Organization guidance value for NDMA in drinking water is 100 ng/L (WHO, 2008).
Oxidizing precursors before chloramination may be a viable strategy for limiting NDMA formation upon disinfection. Several studies have demonstrated that oxidants such as ozone, free chlorine, permanganate, ferrate, hydrogen peroxide, or a combination of these oxidants can deactivate NDMA precursors (Chen and Valentine, 2008; Krasner et al., 2013; Lee et al., 2008; Lee et al., 2007a; Pisarenko et al., 2012; Selbes et al., 2014; Shah et al., 2012; Wang et al., 2015). Generally, ozone and free chlorine tend to be the most effective at decreasing NDMA formation, as both oxidants readily react with amine functional groups (Deborde and von Gunten, 2007; Lim et al., 2022).
There are examples, however, of direct NDMA formation upon ozonation of specific precursors (e.g., N-N-dimethylsulfamide, daminozide, metformin, and to a lesser extent dimethylamine) and wastewater samples (Liao et al., 2021; Padhye et al., 2011; Song et al., 2022; von Gunten et al., 2010; Yang et al., 2009). In addition, there are several reports suggesting that preozonation can increase NDMA formation upon subsequent chloramination (Andrzejewski et al., 2008; Gerrity et al., 2014; Liao et al., 2021; Marti et al., 2014; Oya et al., 2008; Schmidt and Brauch, 2008; Trogolo et al., 2015; von Gunten et al., 2010). Thus, the effect of preoxidation on limiting NDMA formation may be specific to a given water matrix.
The main objective of this study was to assess the effects of preoxidation on NDMA formation upon chloramination for water samples from the upper Mississippi River watershed. The upper Mississippi River was of interest because it serves as the drinking water supply for ∼1 million residents of the State of Minnesota, USA, including those in the Twin Cities of Minneapolis and St. Paul, and has the potential to form more than 50 ng/L of NDMA upon addition of preformed chloramines (Hozalski et al., 2021). Raw water samples were collected from a water treatment plant supplied primarily with Mississippi River water, as well as a tributary to the Mississippi River impacted by agricultural activities and municipal wastewater discharges.
An important aspect of this study involved testing of water samples from a lime-softening plant, where the relatively high pH conditions (10.6–10.8 for lime-softened water and 8.6–8.9 for recarbonated water) should facilitate not only NOM removal but also hydroxyl radical formation, when ozonating without the addition of hydrogen peroxide. In addition, testing a wide range of oxidant doses and combinations of oxidants provides information to optimize treatment.
Selected water samples also were spiked with a model NDMA precursor, ranitidine, before further testing. Preoxidation was performed in batch reactors where three common oxidants were compared under a wide range of conditions: free chlorine, ozone, and a combination of ozone and hydrogen peroxide (i.e., an advanced oxidation process [AOP]). The effect of preoxidation on NDMA precursor levels was assessed by applying preformed chloramines to all water samples following the uniform formation conditions (UFC) protocol and measuring the resulting NDMA concentrations.
Materials and Methods
Site selection, sample collection, and chemical reagents
A drinking water treatment plant (Saint Paul Regional Water Services [SPRWS]) with the Mississippi River as its main source water was chosen for this study. Water is withdrawn from the Mississippi River and passed through a chain of lakes before entering the treatment plant. The water is treated by the addition of lime and coagulant (alum and ferric chloride), flocculation, sedimentation, recarbonation, and filtration before disinfection with free chlorine and then addition of ammonia to form chloramines before distribution. Raw water, lime-softened water, and recarbonated water were collected from SPRWS on two occasions in July 19, 2021 (summer), and January 21, 2022 (winter), to investigate potential seasonal water quality variations.
Water samples were collected in clean high-density polyethlyene carboys, filtered (0.7 μm glass microfiber), and stored in the dark at 4°C until used. An additional water sample was collected from the Crow River, a suspected contributor of NDMA precursors to the Mississippi River, on February 19, 2022 (45.088345, −93.733763). The Crow River water sample was then split, and half the sample was filtered (0.7 μm glass microfiber) and the other half was lime softened using a jar test procedure that mimics lime softening at SPRWS. Both the raw and lime-softened Crow River water samples were stored in the dark at 4°C until used.
All chemical sources and purities are provided in the Supplementary Information. The jar test procedure used for lime softening Crow River water is also provided in the Supplementary Information.
Batch oxidation experiments
For batch experiments with ozone, ozone gas (up to 8% by weight) was produced from ultra-high purity oxygen gas (99.99%) using a Pacific Ozone O3 generator and then sparged into ultrapure water cooled to 4°C in an ice bath (Supplementary Information). Ozone stock solutions ranged from 30 to 50 mg/L. In addition, hydroxyl radical (•OH) concentrations were measured indirectly for ozone and AOP experiments by monitoring the decrease of an added probe compound, para-chlorobenzoic acid (pCBA; ≥98.5%).
Batch ozonation and AOP experiments were performed in 1,000-mL amber glass bottles fitted with bottle top dispensers. A sample of 600 mL water with 10 μM pCBA was added to the bottle. Ozone was injected into the reactor by glass pipette to the desired dose, while continuously stirring the reactor contents with a magnetic stir bar. For the AOP experiments, hydrogen peroxide was added to the batch reactors just before the addition of ozone, at a mass ratio of 0.5:1 of hydrogen peroxide:ozone. All materials in the reactors were comprised of glass or polytetrafluoroethylene so as not to be reactive with chemical oxidants.
The raw, lime-softened, and recarbonated water samples were ozonated at room temperature (20.7°C ± 0.5°C) at doses of 1, 2, and 5 mg/L. Additional ozonation experiments were performed in cold water (5.2°C ± 0.2°C), but at only one dose (2 mg/L). AOP experiments were performed on raw and recarbonated water at both temperatures, but only one ozone dose (2 mg/L). For ranitidine spiking experiments, an aliquot from a 24 mg/L stock solution prepared in ultrapure water was added to a 600 mL sample of winter recarbonated water to obtain an initial concentration of 1,200 ng/L (3.8 nM). The raw and softened Crow River water samples were ozonated at room temperature at a dose of 2 mg/L only.
Water samples were withdrawn from the batch reactors using the dispenser for the measurement of residual ozone concentration after 30 s and then every minute thereafter until the ozone was depleted (up to 10 min). Concurrent subsamples for indirect measurement of •OH were also dispensed from the reactor using a bottle top dispenser into separate glass vials containing a final concentration of 10 mM of tert-butyl alcohol (TBA, an •OH quencher to halt reaction of pCBA) for every minute of ozone residual measurement. After this 10-min period, 475 mL of remaining sample water was then transferred to a 500 mL amber bottle to conduct the UFC test.
The UFC test mimics practical chloramination conditions, and the procedure was adopted from Zeng and Mitch (2015). Preformed monochloramine was prepared each day of UFC testing by mixing a cold 25 mM ammonium chloride solution with sodium hypochlorite at a 1:1 molar ratio (Soltermann et al., 2013). The resulting monochloramine concentration was then quantified using molar absorptivities from the methods of Schreiber and Mitch (2005) and Schurter et al. (1995). An aliquot of monochloramine was added to water samples that were buffered at a pH of 8 with a 4 mM borate solution to obtain an initial concentration of 5 mg/L as Cl2. The water samples were then incubated in the dark at room temperature for 3 days. After 3 days, the residual chloramine concentrations were measured. Residual chloramines were then quenched with excess
Free chlorine preoxidation testing was performed on recarbonated water and ozonated (2 mg/L) recarbonated water. A simulated distribution system (SDS) protocol developed by SPRWS was followed for the chlorination and chloramination phases. Briefly, the water sample was first buffered to a pH of 8 with borate buffer. The total organic carbon (TOC) of the water was then measured, and sodium hypochlorite prepared in pH 6.7 borate buffer was added to the water at a chlorine to TOC mass ratio of 1.2 Cl2:1 TOC. The reactor contents were then mixed for 20 min with a PTFE-coated magnetic stir bar before adding ammonium sulfate at an initial chlorine (as Cl2) to ammonia mass ratio of 4.6:0.94.
The initial chlorine dose ranged from 4.24 to 5 mg/L as Cl2 to achieve a target residual concentration after 20 min of 3.5 mg/L as Cl2 and a Ct of ∼70 mg-min/L. The pH of the water was adjusted to 9 with sodium hydroxide and then the batch bottles were incubated for 3 days at room temperature in the dark. After incubation, the residual chloramine concentration was measured using the ABTS method and then quenched with
Summary of Batch Oxidation Experiments Performed on the Collected Water Samples
Black marks indicate experiments conducted at room temperature (20.7°C ± 0.5°C), while gray checks indicate experiments conducted at low temperature (5.2°C ± 0.2°C).
Indicates this experiment was only conducted using samples collected in winter 2021.
Analytical methods
Routine water quality parameters, including turbidity, TOC, dissolved organic carbon (DOC), alkalinity, and bromide concentrations, were measured following Standard Methods (American Public Health Association et al., 2023). Ozone concentrations were quantified by the indigo method (Bader and Hoigné, 1981). Residual chloramine concentrations were measured by the ABTS [2,2′-azino-bis(3-ethylbenzothiazoline-6-sulfonic acid)] method (Pinkernell et al., 2000). The decrease of pCBA concentration was measured by high-performance liquid chromatography (HPLC) with ultraviolet (UV) detection at 240 nm based on a method developed by Lee et al. (2007b). Details of all three methods and calculation of ozone exposures are provided in the Supplementary Information.
NDMA extraction and quantification followed a modified USEPA Method 521 (Munch and Bassett, 2004). Briefly, all samples were first spiked with an internal standard (d6-NDMA) to a concentration of 10 ng/L before solid phase extraction (SPE) using Enviro-Clean 521 Activated Carbon cartridges (United Chemical Technologies). The cartridges were first conditioned with dichloromethane, methanol, and then Milli-Q water.
After SPE, cartridges were eluted with dichloromethane and the SPE extract was evaporated under a gentle N2 stream to a volume of ∼0.1 mL. Samples were then reconstituted to a proportional volume in microliters as the original UFC sample volume in milliliters (i.e., 485 μL to an original volume of 485 mL to account for the concentrating effect of nitrogen blow down) with liquid chromatography-mass spectrometry (LC-MS) grade water and transferred to HPLC vials. A full SPE procedure is in the Supplementary Information. NDMA was analyzed using a Thermo Scientific Vantage Triple-Stage Quadruple Mass Spectrometer, and details are in the Supplementary Information. Results for samples in which the internal standard was not detected (15.8% of samples) were discarded.
The measured NDMA concentration was corrected for dilution from the addition of the ozone stock solution, hydrogen peroxide solution (if used), •OH probe compound solution, and UFC components (borate buffer and chlorine/chloramine solution). Total dilutions ranged from 2% to 18% of the original sample volume. Likewise, the measured pCBA concentration was corrected for the dilution from the addition of the ozone stock solution and TBA. A derivation of dilution corrections and sample calculations for NDMA and pCBA is in the Supplementary Information. Batch experiments with free chlorine resulted in minimal dilution (<1%), so no correction was needed.
Data analysis
Data analysis and visualization were performed with R software (R Core Team, 2021). Student's t-tests were performed to compare •OH formation in different water types and at different temperatures. Likewise, t-tests were performed to compare NDMA formation between similar preoxidation treatments and at different temperatures.
Results
Water quality
A summary of water quality indicators for both summer and winter samples collected from SPRWS is provided in Supplementary Table S1. The SPRWS summer raw water had a pH of 8.4 and a TOC of 6.9 mg/L, while for the winter raw water, the values were 7.9 and 8.4 mg/L, respectively. The lime-softened SPRWS water for summer and winter had an elevated pH (10.6–10.8) and the TOC concentration was reduced to 3.9 mg/L.
The removal of NOM by lime softening is also reflected in a decrease in UV absorbance (UV254). Alkalinity, a source of •OH scavengers, also decreased ∼3-fold by lime softening. The pH of recarbonated SPRWS water was 8.6 for the summer water and 8.9 for the winter water and the TOC was similar to the lime-softened water. For the Crow River water, the pH and TOC concentration were 7.9 and 34 mg/L, respectively, and the values after lime softening in the laboratory using a jar-test apparatus were 10.5 and 2.6 mg/L, respectively.
Ozone degradation kinetics and •OH formation
Ozone was completely consumed within 30 s under most experimental conditions, particularly at ozone doses of 1 and 2 mg/L and in the high pH lime-softened waters before recarbonation. In these cases, ozone exposure was estimated from the area under a linear decay curve from the known ozone dose at time zero to a concentration of 0 mg/L ozone at 30 s. The estimated ozone exposures were 0.25, 0.5, and 1.25 mg-min/L for ozone doses of 1, 2, and 5 mg/L, respectively.
Because ozone may have been completely depleted before the first residual measurement at 30 s, these exposures may be overestimates. At an ozone dose of 5 mg/L, ozone typically was detected for a minute or longer at room temperature, with calculated exposures ranging from 1.36 to 2.83 mg-min/L for raw and recarbonated water samples from SPRWS (Supplementary Table S2). Example plots of ozone decay for different water types are provided in Supplementary Fig. S1.
The amounts of •OH formed during batch experiments at 20°C for summer and winter water are compared in Supplementary Fig. S2. For experiments with ozone consumption within 30 s, the ratio of •OH to O3 exposures (Rct) (Elovitz and von Gunten, 1999; Elovitz et al., 2000) could not be calculated. Thus, the loss of pCBA at 1 min is presented to show changes in the extent of •OH production.
The formation of •OH (as measured indirectly by pCBA decrease) increased with increasing ozone dose for all water types for both summer and winter samples. In addition, regardless of ozone dose, more •OH reacted with the probe compound in recarbonated SPRWS water, which had both lower DOC and alkalinity, than the raw and lime-softened water for both seasons. The formation of •OH during AOP treatment resulted in a similar loss of the pCBA compared to the raw and recarbonated water at the same ozone dose (2 mg/L), indicating similar extent of •OH formation with and without the addition of H2O2. The effect of temperature on •OH formation is shown in Supplementary Fig. S3. In recarbonated water, t-tests showed significantly greater •OH formation at 5°C than at room temperature.
NDMA precursor removal by preoxidation
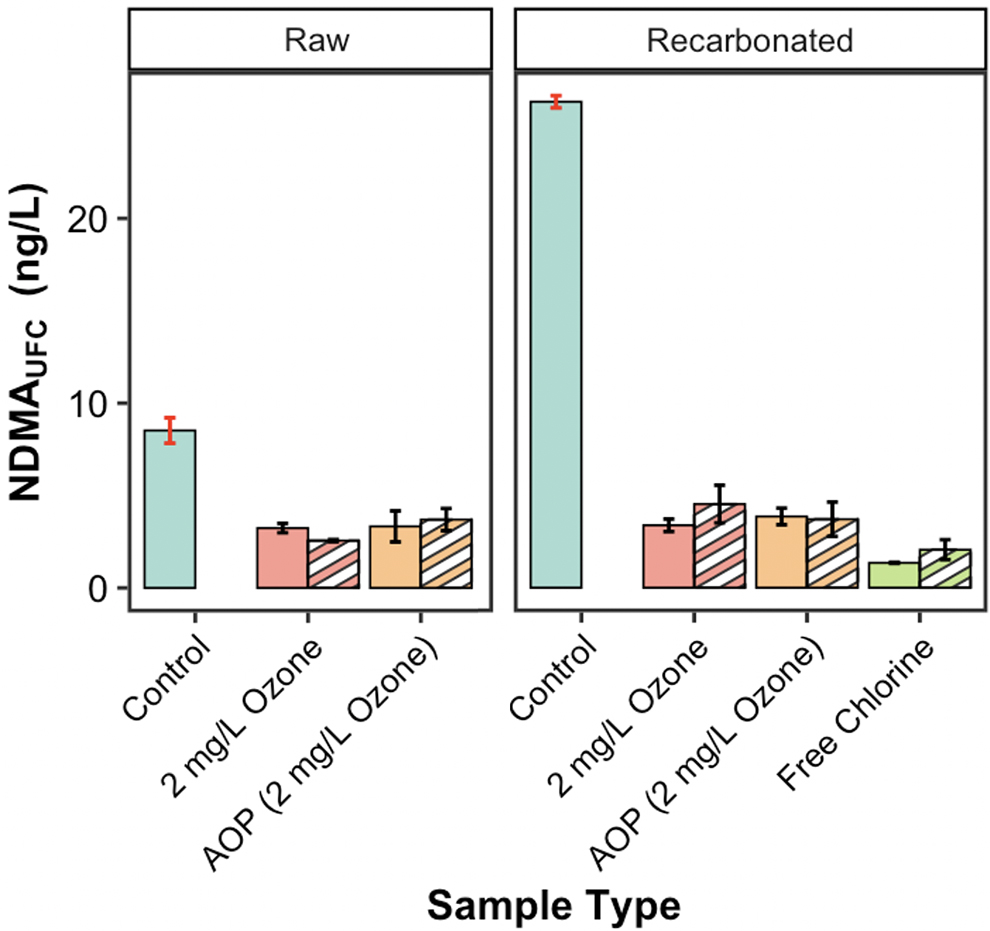
The mean NDMAUFC concentrations were 8.5 ng/L for SPRWS raw summer water (Fig. 1) and 10.1 ng/L for SPRWS raw winter water (Supplementary Fig. S4). All oxidation treatments for these two raw waters resulted in NDMAUFC concentrations below 5 ng/L, with concentrations ranging from 3.1 to 3.8 ng/L for the summer water and 2.5 to 3.6 ng/L for winter water. In addition, the NDMAUFC concentration following AOP treatment at 2 mg/L of ozone was similar to that for ozone alone at the same dose. Ozonation was also effective at limiting NDMA formation in a water sample from the Crow River (Fig. 2), which has substantially higher raw water NDMA formation (33.7 ng/L). An ozone dose of 2 mg/L at 20°C reduced the average NDMA concentration to 6.6 ng/L.

Effect of preoxidation at 20°C on mean NDMAUFC concentration for raw, lime-softened, and recarbonated SPRWS water collected in the summer. Error bars in red represent the difference between duplicate results, while error bars in black represent the standard deviation of triplicate results. NDMA, N-nitrosodimethylamine; SPRWS, Saint Paul Regional Water Services; UFC, uniform formation conditions.

The effect of preoxidation on mean NDMAUFC concentration for raw and lime-softened Crow River water. Error bars represent the standard deviation of triplicate results. The pH and TOC of raw water were 7.9 and 34 mg/L, respectively, while the pH and TOC of lime-softened water were 10.5 and 2.6 mg/L, respectively. TOC, total organic carbon.
The two watersheds that the water samples originated from differ substantially in land use (Supplementary Table S3). The Crow River watershed is dominated by agricultural activity (73%), while the Mississippi River watershed in the Twin Cities area is more urbanized (47%), with agricultural activity accounting for only 22% of the land use in the watershed. These differences may introduce different pools of NDMA precursors.
Lime softening of SPRWS raw water increased the formation of NDMA during subsequent UFC testing, with values of 20.7 ng/L for summer water (Fig. 1) and 17 ng/L for winter water (Supplementary Fig. S4). After recarbonation, the NDMAUFC concentration increased further to an average concentration of 26.3 ng/L for summer water, but decreased slightly for winter water to 14 ng/L. No increase in NDMAUFC was observed after lime softening of the Crow River water (Fig. 2).
Ozonation of lime-softened SPRWS water at ozone doses ranging from 1 to 5 mg/L decreased NDMAUFC levels to 2.2–3.1 ng/L for the summer water (Fig. 1) and 1.5–2.7 ng/L for the winter water (Supplementary Fig. S4). For Crow River water, an ozone dose of 2 mg/L at 20°C decreased NDMAUFC to 10.1 ng/L (Fig. 2). Ozonation of recarbonated SPRWS summer water decreased average NDMAUFC to 2.1–4.0 ng/L (4.3–4.6 for winter).
Applying free chlorine using an SDS protocol to recarbonated SPRWS water at a dose of 4.24 mg/L as Cl2 for 20 min (Ct ∼70 mg-min/L) resulted in the lowest NDMAUFC concentrations of all treatments (1.4 ng/L summer and 1.1 ng/L winter). AOP treatment at an ozone dose of 2 mg/L resulted in similar NDMAUFC concentrations as ozone alone at the same dose. An additional experiment was performed in which recarbonated SPRWS winter water was ozonated at 2 mg/L followed by free chlorine exposure (dose of 5 mg/L for 20 min, Ct ∼70 mg-min/L) and then ammonia addition to form chloramines. The mean (± standard deviation) NDMAUFC after applying the two oxidants in series before chloramine formation (3.6 ± 2.5 ng/L) was similar to the values for either oxidant alone at the same doses.
Increasing the ozone dose did not correlate with NDMAUFC concentration (Supplementary Fig. S5, p = 0.51) in summer raw water. Unlike raw water, NDMAUFC concentration slightly increased with increasing ozone dose at 20°C for the lime-softened and recarbonated water (see p = 0.00083 and 0.0087, respectively). No trend was observed in winter water (Supplementary Fig. S5). The increase observed in summer could be due to precursors that react directly with ozone to form NDMA. An ozone dose of 2 mg/L was applied to the winter water samples and then directly analyzed for NDMA without the addition of chloramines as in a UFC test. For all three water types, ∼3 ng/L of NDMA was formed by the addition of ozone without a UFC test (Supplementary Fig. S6).
The effect of preoxidation temperature on NDMAUFC is shown in Fig. 3 (summer) and Supplementary Fig. S7 (winter). In only one case, raw water with an ozone dose of 2 mg/L, was the NDMAUFC statistically different (2.6 ng/L at 5°C ozone dose, 3.2 ng/L at 20°C, p = 0.009) between the two temperatures. There was no significant difference for the other water samples or preoxidation treatments.
Effect of preoxidation temperature on mean NDMAUFC concentration for raw and recarbonated water collected in the summer. Error bars in red represent the difference between duplicate results, while error bars in black represent the standard deviation of triplicate results. Solid bars and diagonal hatched bars represent results for temperatures of 20°C and 5°C, respectively.
Ranitidine spiking experiments
The effect of preoxidation on limiting NDMA formation in winter recarbonated water spiked with 1,200 ng/L of ranitidine is shown in Fig. 4. Before oxidation, the ranitidine spike increased the average NDMAUFC concentration in recarbonated water from 14 to 358 ng/L (121% molar yield of NDMA from the spiked ranitidine). An ozone dose of 1 mg/L reduced the average NDMAUFC concentration by 94% to 21 ng/L. Increasing ozone doses of 2 and 5 mg/L further diminished NDMAUFC concentrations to 8.2 and 4.2 ng/L, respectively. A sequence of 2 mg/L ozone followed by 5 mg/L of free chlorine produced similar average NDMAUFC concentrations (2.4 ng/L) as 5 mg/L of ozone alone. Free chlorine alone was also effective at diminishing NDMAUFC concentrations by ∼97%.

Effect of preoxidation on mean NDMAUFC concentration for recarbonated water collected in the winter and spiked with 1,200 ng/L ranitidine. Error bars in red represent the difference between duplicate results, while error bars in black represent the standard deviation of triplicate results.
Discussion
Roles of ozone and hydroxyl radical
The longevity of the ozone residual is dependent on the pH, alkalinity, TOC, and temperature of the water matrix (von Gunten, 2003). A combination of these factors most likely played roles in producing low ozone exposures in the sample waters tested. For example, ozone decay rates have been observed to increase by an order of magnitude from 5°C to 25°C (Elovitz et al., 2000), and this is consistent with the rapid loss of ozone at 20°C observed herein.
In addition to temperature, differences in water quality in the different sample types affected ozone stability. Raw water had a lower pH than lime-softened and recarbonated water, which would lead to greater ozone stability because hydroxide initiates ozone decomposition. Raw water exhibited the highest total alkalinity, which would help promote ozone stability due to •OH scavenging by bicarbonate (von Gunten, 2003), because •OH also leads to ozone decomposition. The high TOC in raw water (6–9 mg/L), however, likely leads to the rapid loss of applied ozone, even at 5°C, outweighing any stabilization due to the pH or alkalinity. Rapid ozone residual consumption in lime-softened water is attributed to the high pH. The recarbonated water has the most persistent ozone residual due to the combination of lower pH, lower alkalinity, and reduced TOC.
Depending on the ozonation conditions, including pH, temperature, and TOC concentration, the ozone decomposition and subsequent •OH formation could mimic a traditional AOP using ozone alone (von Gunten, 2003). The similar amounts of •OH produced (as measured by pCBA loss) coupled with the similar extents of NDMAUFC reduction for the ozone and AOPs in this study suggest that •OH is the oxidant responsible for destruction of NDMA precursors. Furthermore, these results suggest that there was no benefit to adding H2O2 compared to ozone alone at the elevated pH (8.6–8.9) of the recarbonated water.
Regardless of ozone dose, there was more •OH exposure for recarbonated water compared to raw or lime-softened water. The recarbonated water had the lowest TOC concentration and alkalinity, both of which serve as •OH scavengers. Although the TOC concentration and alkalinity of lime-softened and recarbonated water were similar, the inorganic carbon in lime-softened water is mostly in the form of CO32−, an •OH scavenger with a rate constant of 3.9 × 10⁸ M−1 s−1 (Buxton et al., 1988).
At the pH of recarbonated water, the dominant form of inorganic carbon is HCO3−, with a rate constant for reaction with •OH of 8.5 × 10⁶ M−1 s−1 (Buxton et al., 1988). Because many organic compounds have second-order rate constants with •OH at near-diffusion controlled reaction rate constants (∼109 M−1 s−1), applying ozone to recarbonated water minimized •OH scavenging by NOM or inorganic carbon, leading to more oxidation of NDMA precursors (von Gunten, 2003).
NDMA precursor removal
Without preoxidation treatment, chloramination of precursors in the raw, softened, and recarbonated SPRWS water samples resulted in NDMAUFC concentrations ranging from 8 to 26 ng/L, above the Minnesota Department of Health's guidance value of 5 ng/L. Ozonation at doses ranging from 1 to 5 mg/L, with or without peroxide addition, as well as preoxidation with free chlorine (dose of 4.24 mg/L as Cl2, Ct ∼70 mg-min/L) consistently resulted in NDMAUFC concentrations of 5 ng/L or less.
A decrease in NDMA formation in drinking water following preoxidation has been reported previously (Pisarenko et al., 2012; Shah et al., 2012). Shah et al. (2012) investigated the preoxidation of raw water and water that had undergone lime softening and recarbonation. An ozone exposure of 0.4 mg/L-min decreased NDMA formation by 50% in the Shah et al. (2012) study, while ozone exposures as low as 0.25 mg-min/L (estimated) in this study decreased NDMA formation by 65–70% for raw water and 70–90% for recarbonated water. Although ozone performed better than free chlorine in terms of decreasing NDMA formation in Shah et al.'s (2012) study, free chlorine performed similar to or better than ozone in this work.
In addition, Shah et al. (2012) observed a greater decrease in chloramine-induced NDMA formation when preoxidation with free chlorine (dose of 2.5 mg/L Cl2 for 30 min) was performed at 21°C than at 4°C, but observed little to no difference in NDMA formation when applying ozone at different temperatures. The experiments with SPRWS water produced similar results to Shah et al. (2012) in regard to ozonation at different temperatures, but differed with respect to free chlorine at different temperatures. Nevertheless, results in this study and in Shah et al.'s (2012) suggest that preoxidation with ozone or chlorine would be effective in decreasing NDMA formation over a wide range of water temperatures.
Ozone was also effective at reducing NDMA formation in the Crow River water sample, even though the raw water TOC concentration was relatively high at 34 mg/L. Thus, it appears that competition between NOM and NDMA precursors for ozone was not significant as the decrease in NDMAUFC was still substantial (∼80% for raw water). Lee et al. (2007a) observed decreases in NDMA formation potential range from 32% to 94% after applying ozone doses of 1 or 2 mg/L to natural waters with ambient precursor pools and much lower NOM content than the Crow River water.
The pool of NDMA precursors in the Crow River sample was likely different than that in SPRWS raw water due to greater agricultural activity in the Crow River watershed. The effective removal of NDMA precursors from raw and lime-softened water samples by ozone from two different surface waters over a wide range of conditions is promising. Nevertheless, more testing of the effects of preoxidation on NDMA precursor removal should be performed on a wider variety of surface waters to investigate potential benefits, as well as drawbacks in terms of formation of regulated or other DBPs.
For most of the conditions tested, there was no effect of increasing ozone dose on NDMAUFC, suggesting that an ozone dose of 1 mg/L was sufficient for the removal of precursors at NDMAUFC concentrations ranging from 8.5 to 26.3 ng/L before preoxidation treatment. However, when the precursor level was increased by spiking in a known precursor compound to achieve an extremely high NDMAUFC of 358 ng/L, there was a clear effect of ozone dose on precursor removal. At that precursor level, an ozone dose of 5 mg/L or a combination of ozonation followed by free chlorine exposure was needed to decrease the NDMAUFC to below 5 ng/L. Thus, these results suggest that low to moderate ozone doses (1–2 mg/L) should be effective for NDMA control, except in extreme circumstances.
It is important to note that NDMA concentrations produced from UFC tests may overestimate the amount of NDMA formed at a utility, because the water is dosed with preformed chloramines and then incubated for 3 days at room temperature (20–22°C) during UFC testing. It is common for water utilities to have brief free chlorine exposure for disinfection credit before converting the residual free chlorine to chloramines with the addition of ammonia. This process was investigated by performing an SDS test and consistently resulted in NDMA concentrations below 5 ng/L. Furthermore, in the winter, in temperate climates, rates of NDMA formation in chloraminated water should be less than those during UFC testing because of the lower water temperatures.
The reason for increased NDMAUFC after lime softening could arise from more efficient removal of organic matter overall compared to NDMA precursors (either microcontaminants or the precursors in NOM). This would lead to a greater fraction of the chloramines available to react with NDMA precursors after softening. The elevated pH also could potentially liberate precursor compounds bound to NOM or alter the structure of NDMA precursors by base-catalyzed hydrolysis and making them more reactive. Based our ongoing work, we suspect that the decrease in competition for chloramines from NOM is likely the most important factor.
Formation of NDMA and effectiveness of preoxidation with a known precursor
Reported molar conversions for ranitidine to NDMA range from 40% to 100% in distilled deionized water, ultrapure water, or finished tap water for a variety of formation potential tests (Selbes et al., 2018; Selbes et al., 2014; Shen and Andrews, 2010; Wang et al., 2015; Zou et al., 2018). The observed yield was 121% for ranitidine spiked into lime-softened and recarbonated surface water in this study. Several other studies in the literature also have observed that the presence of NOM can enhance the formation of NDMA from ranitidine (Selbes et al., 2012; Zou et al., 2018).
Nonetheless, the data demonstrate that both free chlorine and ozone were effective at decreasing NDMA formation in ranitidine-spiked water. Both of these oxidants have been reported to diminish the NDMA formation potential of ranitidine, with ozone generally more effective than free chlorine (Selbes et al., 2014; Wang et al., 2015; Zou et al., 2018). In this study, a free chlorine dose of 4.24 mg/L as Cl2 was slightly more effective than an ozone dose of 1 mg/L, but ozone performed better with increasing dose.
The combination of preozonation at a dose of 2 mg/L followed by free chlorine at a dose of 5 mg/L resulted in the largest reduction in NDMAUFC among all preoxidation treatments tested. Although this study tested the effects of preoxidation on waters spiked with only one model NDMA precursor, the results suggest that moderate doses of ozone and free chlorine, especially when used in series, could effectively decrease NDMA formation for waters with extremely high levels of precursors.
Conclusions
The effects of preoxidation with ozone (1–5 mg/L), free chlorine (4.24–5 mg/L as Cl2, Ct ∼70 mg-min/L), or both in series, on NDMA precursor levels (i.e., measured by UFC testing), were investigated. Ozone effectively removed NDMA precursors in raw and lime-softened water samples from two different watersheds, suggesting that preoxidation could be effective for a variety of drinking water supplies with different precursor sources.
In addition, NDMAUFC concentrations after preoxidation were similar, regardless of ozone dose, suggesting that utilities using chloramination may only need low ozone doses (e.g., 1 mg/L) to effectively destroy NDMA precursors. When treating water with extremely high precursor concentrations, an ozone dose of 5 mg/L or a combination of ozonation followed by free chlorine exposure was needed to decrease the NDMAUFC to below 5 ng/L. Overall, these results suggest that low to moderate ozone doses and free chlorine Ct values should be effective for NDMA control, except in extreme circumstances.
Footnotes
Acknowledgments
Robert Axtell is sincerely acknowledged for help with sample collection and processing. We would also like to acknowledge the analytical biochemistry mass spectrometry group at the Masonic Cancer Center, University of Minnesota, including Peter Villalta, Jingfang Huang, Yingchun Zhao, and Jibin Guan, for their assistance with LC-MS/MS instrumentation. This work was used in partial fulfillment of the Master of Science degree of Eric Noe.
Authors' Contributions
E.N.: methodology, investigation, validation, data curation, visualization, and writing—original draft; J.L.: methodology, investigation, visualization, and writing—review and editing; W.A.: conceptualization, methodology, writing—review and editing, supervision, project administration, and funding acquisition; R.H.: conceptualization, methodology, writing—review and editing, supervision, project administration, and funding acquisition.
Author Disclosure Statement
No competing financial interests exist.
Funding Information
Funding was provided by the Minnesota Environment and Natural Resources Trust Fund as recommended by the Legislative-Citizen Commission on Minnesota Resources (LCCMR) and the Minnesota Department of Health. Grant Number: ML2019 CH 4 ART 2 SEC2 SUB 04F E819IDW.
References
Supplementary Material
Please find the following supplemental material available below.
For Open Access articles published under a Creative Commons License, all supplemental material carries the same license as the article it is associated with.
For non-Open Access articles published, all supplemental material carries a non-exclusive license, and permission requests for re-use of supplemental material or any part of supplemental material shall be sent directly to the copyright owner as specified in the copyright notice associated with the article.