
Abstract
Organics in domestic wastewater contain more chemical energy than is required for treatment; however, current wastewater treatment approaches are energy intensive. The chemical energy in wastewater can be converted to methane-rich biogas through anaerobic bioreactor technologies. While recent research has examined anaerobic bioreactor configurations for domestic wastewater treatment, such as anaerobic membrane bioreactors (AnMBRs) or anaerobic sludge blanket bioreactors, none have conducted energy balances on proposed full-scale anaerobic wastewater treatment facilities (WWTFs; i.e., those that include all processes, such as preliminary treatment, sludge pumping, odor control, etc.). Using Monte Carlo simulation, we address this gap in the literature by examining whole-facility net energy balances for three potential anaerobic wastewater treatment configurations composed of anaerobic sludge blanket bioreactors (e.g., the upflow anaerobic sludge blanket, UASB), AnMBRs, and partial nitritation/anammox (PN/A) to a conventional WWTF designed for biological nutrient removal. For comparison, all energy values were normalized to treatment of 37,850 m3 of wastewater per day to U.S. EPA secondary effluent standards and nitrogen removal to 1 mg·N/L. Results suggest that a configuration based on anaerobic sludge blankets and PN/A can achieve a net energy positive condition, generating 670 ± 3,580 kWh/day. AnMBR-based configurations currently do not achieve an energy-neutral condition; however, reduction in AnMBR energy requirements will bring AnMBR configurations closer to this goal. Our results suggest that full-scale WWTFs that leverage anaerobic technologies can become energy neutral or net energy positive even when all WWTF energy requirements are examined.
Introduction
Wastewater conveyance and treatment accounts for about 2% of the U.S. electrical energy budget (EPA Office of Water, 2006; U.S. EPA, 2008). The majority of wastewater treatment facilities (WWTFs) rely on fossil fuel electricity for required energy (Narayanamoorthy et al., 2022). As the wastewater treatment industry faces myriad challenges, such as aging infrastructure, increasing energy costs, and increasingly strict environmental regulations, the development of more sustainable treatment practices that reduce environmental impacts and resource consumption has gained importance (Ghimire et al., 2021). A wastewater treatment paradigm that minimizes or eliminates reliance on energy-intensive activated sludge and maximizes the methane-producing potential of anaerobic microbiota could achieve reliable onsite net energy production (McCarty et al., 2011). To date, many studies have examined individual anaerobic bioreactors, and several have placed anaerobic technologies in basic treatment configurations (i.e., with primary treatment, secondary treatment, and sludge treatment).
However, from a complete full-scale facility-level net energy balance, such studies are overly simplistic and do not capture all of the energy requirements, thereby failing to understand if a net energy neutral or net energy-positive condition is achieved. Furthermore, there is a lack of current studies examining energy use of anaerobic treatment trains that remove both carbon and nitrogen (Wu et al., 2021). The lack of studies in these areas represents a critical gap in literature. The purpose of this study is to address these gaps by exploring the net energy balance of several plausible full-scale WWTFs that incorporate accepted anaerobic and nutrient-removal technologies.
Energy available in wastewater
The current domestic wastewater treatment paradigm centers on activated sludge bioreactors, which require the provision of oxygen to aerobic microbiota for removal of biodegradable organics and suspended solids (Tchobanoglous et al., 2014). Activated sludge is energy intensive (0.13–0.79 kWh/m3 wastewater treated), accounting for greater than 50% of a typical WWTFs electrical energy use (Crawford and Sandino, 2010; Meyers, 2012; Scherson and Criddle, 2014; U.S. EPA, 2008). However, untreated domestic wastewater contains ∼10 times the energy required to treat it to Clean Water Act discharge standards (Ghimire et al., 2021; Tarallo, 2014; WERF, 2011).
Energy in wastewater exists in three major forms—thermal (80%), chemical (20%), and hydraulic (<1%) (Tarallo, 2014; WERF, 2011). Of these three forms, chemical energy is the most readily converted to electrical and heat energy for onsite use at WWTFs (Maktabifard et al., 2018; Wan et al., 2016). Typical medium-strength raw domestic wastewater contains ∼500 mg/L of chemical oxygen demand (COD), of which 320 mg/L is biodegradable, and 40 mg/L of nitrogen (McCarty et al., 2011; Scherson and Criddle, 2014; Tchobanoglous et al., 2014).
Given these concentrations, the maximum theoretical energy potential of these wastewater constituents is 1.96 kWh/m3 (Scherson and Criddle, 2014). The calorific content of typical wastewater is observed to be ∼1.54 kWh/m3 (WERF, 2011).
Anaerobic microbiota—contaminant removal and methane generation
Wastewater chemical energy can be recovered through the metabolism of anaerobic microbiota, which convert wastewater organics and nitrogen to gaseous end products composed primarily of CH4, CO2, and N2. For organic degradation, syntrophic anaerobic microbial communities carry out hydrolysis, acidogenesis, acetogenesis, and methanogenesis to create methane-rich biogas (Hu et al., 2022a). In addition to CH4 production, the advantages of anaerobic chemical conversion relative to conventional aerobic activated sludge include lower costs and decreased sludge production (due to lower biomass yield) (Hahn and Figueroa, 2015; Hu et al., 2022b; Vinardell et al., 2020). Furthermore, as anaerobic microbiota exist in the absence of oxygen, there is no energy burden associated with pumping oxygen to aeration basins (McCarty et al., 2011; Vinardell et al., 2020).
One of the most common approaches for nitrogen removal is conventional biological nitrogen removal (BNR), which requires sequential aerobic and anoxic conditions (Tarallo, 2014; WEF, 2009). In BNR, ammonium (NH4+) is first converted to nitrate (NO3−) under aerobic conditions (i.e., nitrification). NO3− is then reduced to N2 gas under anoxic conditions (i.e., denitrification) (Lu et al., 2014). Similar to activated sludge, BNR requires significant energy to pump oxygen and create the aerobic conditions necessary for nitrification (Winkler and Straka, 2019).
Anaerobic ammonium-oxidizing (anammox) bacteria, which convert NH4+ and nitrite (NO2−) to N2 gas, is an alternative solution to BNR. Relative to BNR, anammox bioreactors do not require oxygen, have lower-energy requirements, lower costs, and lower sludge production (Kuenen, 2008; Zhao et al., 2022). Furthermore, anammox bioreactors reduce or eliminate the need for supplemental carbon, which is sometimes required for BNR (Ma et al., 2016). Despite these benefits, removal of other contaminants, such as hydrogen sulfide and phosphorous, from anaerobic bioreactor effluents remain ongoing areas of research (Ersahin et al., 2019).
Description of anaerobic bioreactor technologies
Anaerobic digestion
Anaerobic digestion (AnD) of wastewater sludge has been used for well over a century (McCarty, 2001). Today, ∼43% of WWTFs in the U.S. treating flowrates greater than 3,785 m3/day, which accounts for ∼48% of the volumetric flow of wastewater in the U.S., use AnD for sludge treatment (Shen et al., 2015). AnD biogas typically contains 60–70% methane that can be combusted for heat and/or electrical energy generation onsite at WWTFs (Tchobanoglous et al., 2014). Many WWTFs with AnD use biogas to create heat energy onsite using boilers; the heat from which is normally used to maintain mesophilic anaerobic digester temperatures (U.S. EPA, 2017). However, <10% of WWTFs in the U.S. have opted to create both heat and electrical energy using combined heat and power (CHP) technologies, like microturbines or cogeneration engines (Shen et al., 2015; Willis et al., 2012).
Anaerobic membrane bioreactors
Anaerobic membrane bioreactors (AnMBRs) couple anerobic digestion with membrane separation processes (Hu et al., 2022a; Hu et al., 2022b; Smith et al., 2012; Stuckey, 2012; Vinardell et al., 2020). AnMBRs decouple the solids' retention time (SRT) from the hydraulic retention time (HRT) allowing for 90–99% removal of COD and suspended solids from the permeate (Vinardell et al., 2020). Of COD removed and volatile solids destroyed, 50–70% is converted to biogas, while the remaining is removed through accumulation of solids on the membrane (Hu et al., 2022a). AnMBRs can be configured in several ways (e.g., submerged or crossflow) and many pilot-scale studies are ongoing (Aslam et al., 2018; Shin and Bae, 2018; Shin et al., 2021b). Despite the promise of AnMBRs, there are still several barriers to widespread implementation at full scale, to include reducing membrane fouling, optimizing reactor configurations, and reducing energy demand (Mahmood et al., 2022; Shin et al., 2021b; Smith et al., 2012; Vinardell et al., 2020; Zhen et al., 2019).
Anaerobic sludge blanket bioreactors
Anaerobic sludge blanket bioreactors are designed for wastewater to travel upward through a mixed anaerobic consortium capable of degrading organics to methane (Chong et al., 2012; Daud et al., 2018). Two of the most studied anaerobic sludge blanket processes are upflow anaerobic sludge blankets (UASBs) and anaerobic baffled reactors (ABRs) (Shoener et al., 2014). UASBs, which have been used at full scale for several decades and are the most widely employed anerobic treatment technology today, typically consist of a single cylindrical column and a gas–liquid separator (Chernicharo et al., 2015; Chong et al., 2012; Daud et al., 2018).
ABRs operate like UASBs in series. In ABRs, wastewater flows through sequential anaerobic sludge layers located in separate compartments (Callahan et al., 2022; Pfluger et al., 2018; Tchobanoglous et al., 2014). This configuration allows for decoupled HRT and SRT, thereby increasing time for solids and particulate COD hydrolysis (Pfluger et al., 2018). UASBs and ABRs have several advantages over other anerobic technologies, including low energy requirements and simplicity.
However, UASBs and ABRs have relatively low COD and suspended solid removal efficiencies and, when operated alone, do not meet effluent discharge standards (Hahn and Figueroa, 2015; Pfluger et al., 2020). Due to similarities in UASB and ABR performance, the systems are grouped and henceforth labeled as anaerobic primary treatment.
Partial nitritation/anammox
Partial nitritation/anammox (PN/A) bioreactors have been used for sidestream conversion of NH4+ to N2 gas at full-scale WWTFs; however, development of reliable full-scale PN/A bioreactors for mainstream treatment of domestic wastewater is still an area of active research (Cho et al., 2019; Lackner et al., 2014; Zhao et al., 2022). Challenges to development of long-running full-scale PN/A systems include process instability, retention of anammox biomass, and growth of aerobic nitrite-oxidizers that outcompete anammox (Hausherr et al., 2022). Despite these challenges, anammox bioreactors are likely to become an integral part of any future complete anaerobic domestic wastewater treatment train because they can be used to remove nitrogen from wastewater without aeration (Wu et al., 2021).
Methods
WWTF configurations selected for analysis
This study examines the energy use and onsite energy generation of three possible full-scale WWTF configurations that leverage anaerobic technologies for mainstream domestic wastewater treatment. These configurations were selected as each can be directly compared with a typical BNR (nitrification+denitrification) facility while achieving EPA secondary discharge standards for biochemical oxygen demand (BOD) and total suspended solids (TSS). Figure 1A depicts the baseline BNR configuration (i.e., Configuration 1), which includes electrical energy use for 12 major processes and energy generation from AnD of wastewater sludge. Figure 1B depicts the first anaerobic WWTF configuration (i.e., Configuration 2), which consists of 14 processes, to include conventional primary (CP), secondary AnMBR treatment with partial PN/A, and AnD of sludge. Primary treatment is included as many recent pilot- or full-scale AnMBR studies have required removal of large settleable solids before AnMBR treatment to reduce membrane fouling (Harclerode et al., 2020; Hu et al., 2022b; Shin et al., 2021b).
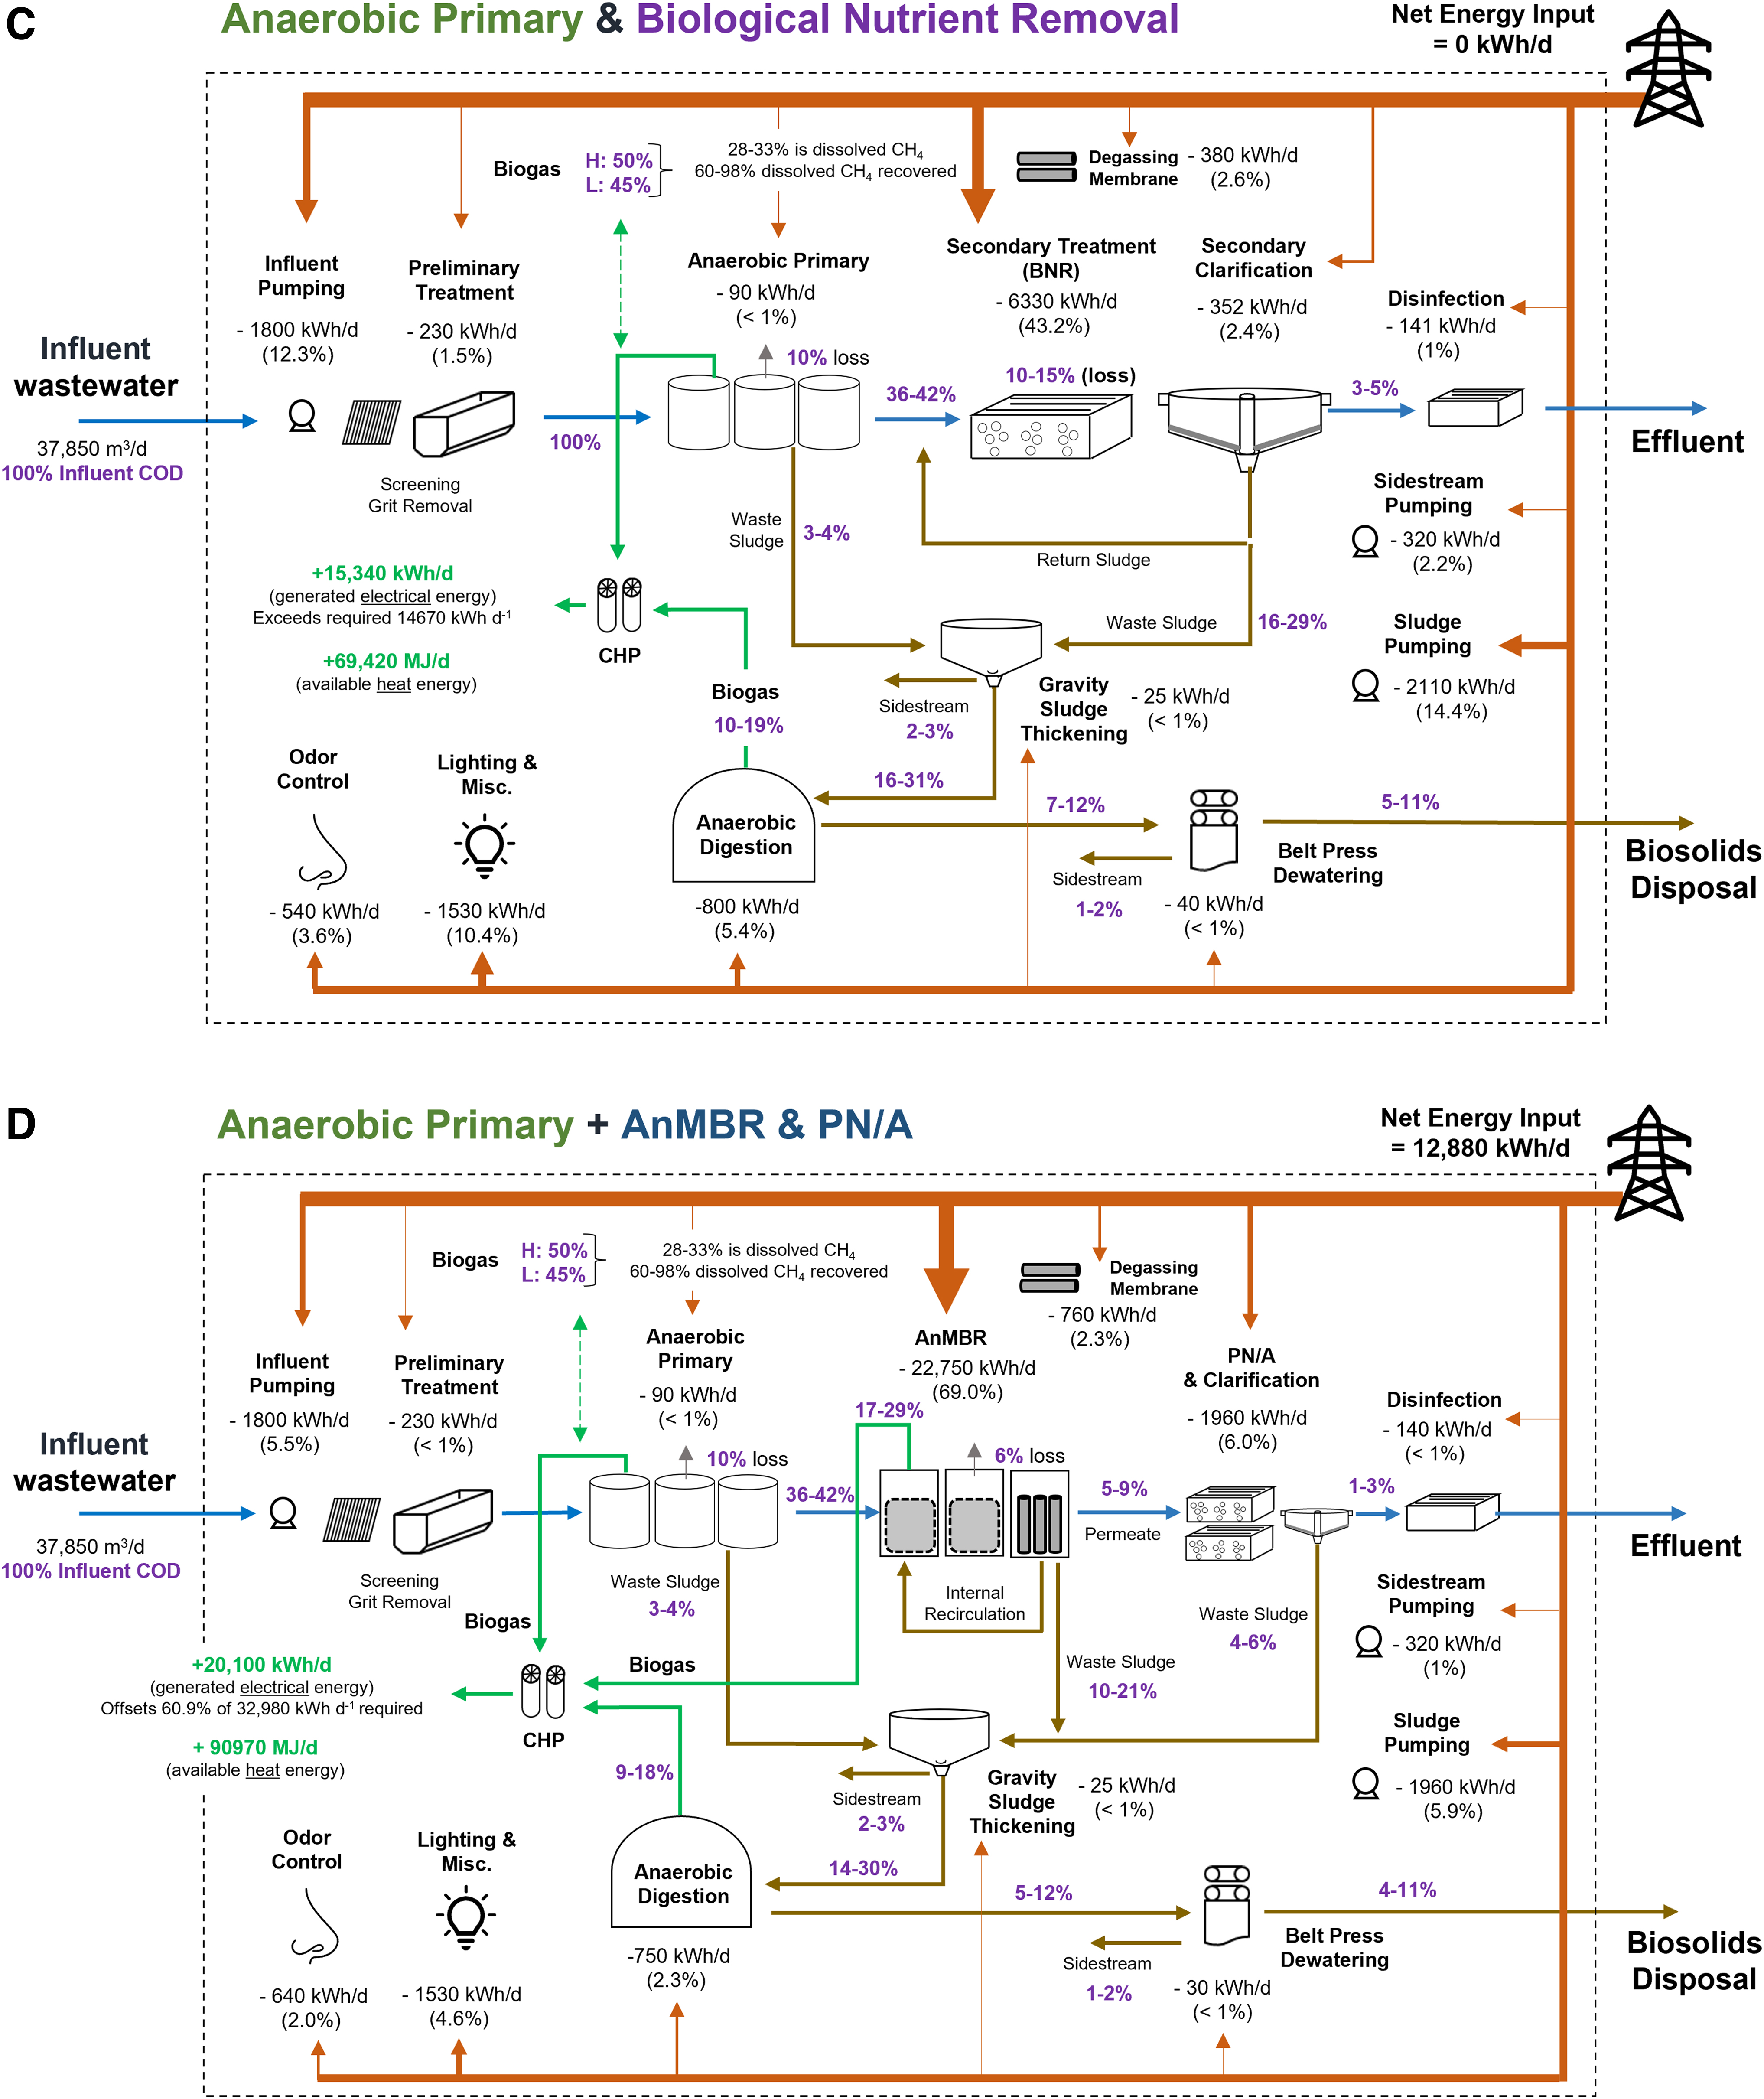
Comparison of water, sludge, energy, and COD flows in examined configurations.
Figure 1C shows the second anaerobic configuration (i.e., Configuration 3), which consists of 15 processes, to include anaerobic primary (AnP), BNR, and AnD. BNR was modeled to remove residual organic carbon from AnP to effluent discharge standards. Last, Fig. 1D depicts a complete anaerobic treatment train (i.e., Configuration 4) with 15 processes, to include AnP, AnMBR, PN/A, and AnD. Each configuration in Fig. 1 depicts COD removal efficiencies and conversion losses by process.
Furthermore, each configuration employs a microturbine for onsite conversion of methane (primary energy) to electrical and heat energy (secondary energy). The range of microturbine efficiencies used for analysis are listed in Tables 1 and 2. For Configurations 2, 3, and 4, dissolved methane (dCH4) is recovered using a degassing membrane. While dCH4 recovery through degassing membranes is still an area of research, several studies have examined degassing anaerobic effluents with promising results (Bandara et al., 2012; Bandara et al., 2011; Cookney et al., 2016; McLeod et al., 2016; Shin et al., 2021b). Tertiary treatment for phosphorous removal was not considered in any configuration.
Energy Data Used for Monte Carlo Simulation: Energy Use Data by Process for Each Configuration
Low-end and high-end values are listed within parentheses adjacent to the baseline value for each process. All sources are listed in the Supplementary Data. All values are in kWh/day. N/A means that process is not applicable to the configuration.
AnMBR, anaerobic membrane bioreactor; BNR, biological nitrogen removal; PN/A, partial nitritation/anammox.
Energy Data Used for Monte Carlo Simulation: Energy Generation Values Used For Monte Carlo Simulation
AnP, anaerobic primary; COD, chemical oxygen demand; dCH4, dissolved methane.
Wastewater characteristics and energy balance
All energy values in this study were normalized to treatment of 37,850 m3/day of domestic wastewater to U.S. EPA Secondary Effluent discharge standards (30 mg/L of TSS and BOD5 over 30-day timeframe) (Tchobanoglous et al., 2014) and removal of nitrogen to 1 mg·N/L. Wastewater with calorific energy ranging from 11.4 to 45.5 GJ per 37,850 m3/day was used in this study. Typical medium strength wastewater characteristics with a range of COD loading 15,140 to 22,710 kg COD/day, suspended solids' loading of 9,960 to 14,350 kg/day, and nitrogen loading from 760 to 1,890 kg·N/day (Section S1 in the Supplementary Data) were used in Monte Carlo simulation (Monte Carlo Simulation section).
A net energy balance was calculated for each configuration by modeling the total energy used by all WWTF processes and then subtracting modeled onsite energy generation using Monte Carlo simulation. Energy-related data for processes in each configuration are in Supplementary Data (Configuration 1 in Section S3, Configuration 2 in Section S4, Configuration 3 in Section S5, and Configuration 4 in Section S6 in the Supplementary Data). All energy use data were converted to kWh/day for modeling (Table 1). Supplementary Table S1 in the Supplementary Data provides values by source used for modeling all BNR WWTF processes. For anaerobic processes where operational energy use is an area of active research, a range of values from recent literature were used for modeling (AnMBR data are found in Section S4.1, PN/A in Section S4.3, and AnP in Section S5.1 in the Supplementary Data). In cases where energy use data were not available in literature, solids and energy balances were employed (Supplementary Tables S4–S6 in the Supplementary Data).
For onsite energy generation, COD mass balances were used to determine the calorific energy available for each anaerobic technology as wastewater and sludge flowed through each modeled WWTF configuration—an approach used in previous studies (Wu et al., 2021). Table 2 provides energy generation values used for modeling, to include anaerobic technology methane generation (AnP, AnMBR, AnD), fractions of dissolved (dCH4) and gas-phase methane, degassing membrane efficiency, and microturbine efficiency.
Monte Carlo simulation
Lumivero Decision Tools Suite v8.3.2 @Risk Platform Monte Carlo Simulation (50,000 iterations) was used to predict the net energy balance by WWTF configuration (see Section S2 in the Supplementary Data for further description). A baseline, low-end, and high-end energy use or production value for each process within each configuration was determined through extensive literature review (as described in Sections S3–S6 in the Supplementary Data and values found in Tables 1 and 2). As anaerobic technology energy-related data are limited (and more uncertain), a wider range of values was selected for modeling. Triangular, pert, or uniform distributions were assigned to each process variable as appropriate (Section S2 in the Supplementary Data and Tables 1 and 2). Raw values for @Risk Monte Carlo Simulation outputs are found in Supplementary Appendices SA1–SA4 in the Supplementary Data (for Configurations 1–4, respectively).
Results
Configuration net energy balance
Table 3 lists the net electrical energy balance (NEB) values from Monte Carlo simulation for each configuration. A higher NEB value indicates a larger disparity between energy required for treatment and energy generated onsite. Conversely, a negative NEB value indicates a net energy positive condition. A large gap between electrical energy use and onsite electrical energy generation indicates a high NEB, while overlapping values indicate an energy-neutral or net energy-positive condition (Fig. 2). Configuration 2 has the highest NEB; consequently, it demands the highest quantity of electrical energy from the grid (20,020 kWh/day).

Electrical energy use and generation by configuration. Mean values for electrical energy used by each configuration to treat 37,850 m3/day of influent wastewater to U.S. EPA secondary discharge standards are shown with a red square, while mean values for energy generated onsite by each configuration are shown with a blue triangle. Error bars represent 1 standard deviation (±) from the mean.
Net Energy Balance Results from Monte Carlo Simulation
NEB is defined as electrical energy use minus electrical energy generated onsite. NEB and electrical energy use are in units of kWh/day. Heat energy is in MJ/day. A negative value indicates that a surplus of energy is generated, while a positive value indicates external energy is required.
NEB, net electrical energy balance.
The baseline BNR configuration, which employs only AnD of sludge for energy recovery, has the second highest NEB. However, electrical energy from AnD offsets 5,190 ± 830 kWh/day of required electrical energy, or 28%, which results in the second lowest electricity demand (from the grid). Configuration 2, which uses AnMBR and PN/A for domestic wastewater treatment and AnD of sludge, generates almost triple the electrical energy of Configuration 1 (14,140 ± 3,160 kWh/day). However, this configuration has the highest electrical energy use of any configuration and, therefore, the highest NEB. Configuration 3, which employs low-energy AnP, BNR, and AnD of sludge, has a slightly negative NEB (−670 ± 3,580 kWh/day), indicating that the configuration can be energy neutral or net energy positive. Last, Configuration 4, which is completely anaerobic (AnP+AnMBR+PN/A+AnD), has the second lowest NEB but still requires 12,880 ± 6,660 kWh/day of electrical energy owing to large energy requirements from the AnMBR and PN/A.
Process-level energy use
For each configuration, energy use by process is depicted in Fig. 3. Several processes were modeled to have the same electrical energy requirement regardless of configuration (e.g., influent pumping, chlorination, site lighting). For these processes, variations in primary, secondary, or sludge treatment approaches did not impact their electrical energy requirements. Conversely, several energy-intensive processes were eliminated or reduced in the transition to anaerobic treatment (e.g., BNR and sludge pumping). Last, as shown, some processes substantially impact the overall energy use of the configuration. For example, electrical energy needed for operation of the AnMBR (Configurations 2 and 4) and BNR (Configurations 1 and 3) were the highest at the process-level and negatively impacted the ability of that configuration to become net energy positive.

Electrical energy use by process for each configuration. Electrical energy used by each configuration, by process (18 total were considered), to treat 37,850 m3/day of influent wastewater to U.S. EPA secondary discharge standards. Each process is color coded as shown in the legend. Processes are stacked from bottom to top in the same order that each are listed from left to right in the legend.
Electrical energy produced by anaerobic technologies
Figure 4 shows electrical energy generation by anaerobic process for each examined configuration. The quantity of electrical energy generated by each process was independent of configuration. AnP treatment produced the largest quantity of electrical energy generated, accounting for 67.9% of Configuration 3's energy production and 30.2% of Configuration 4's energy production.
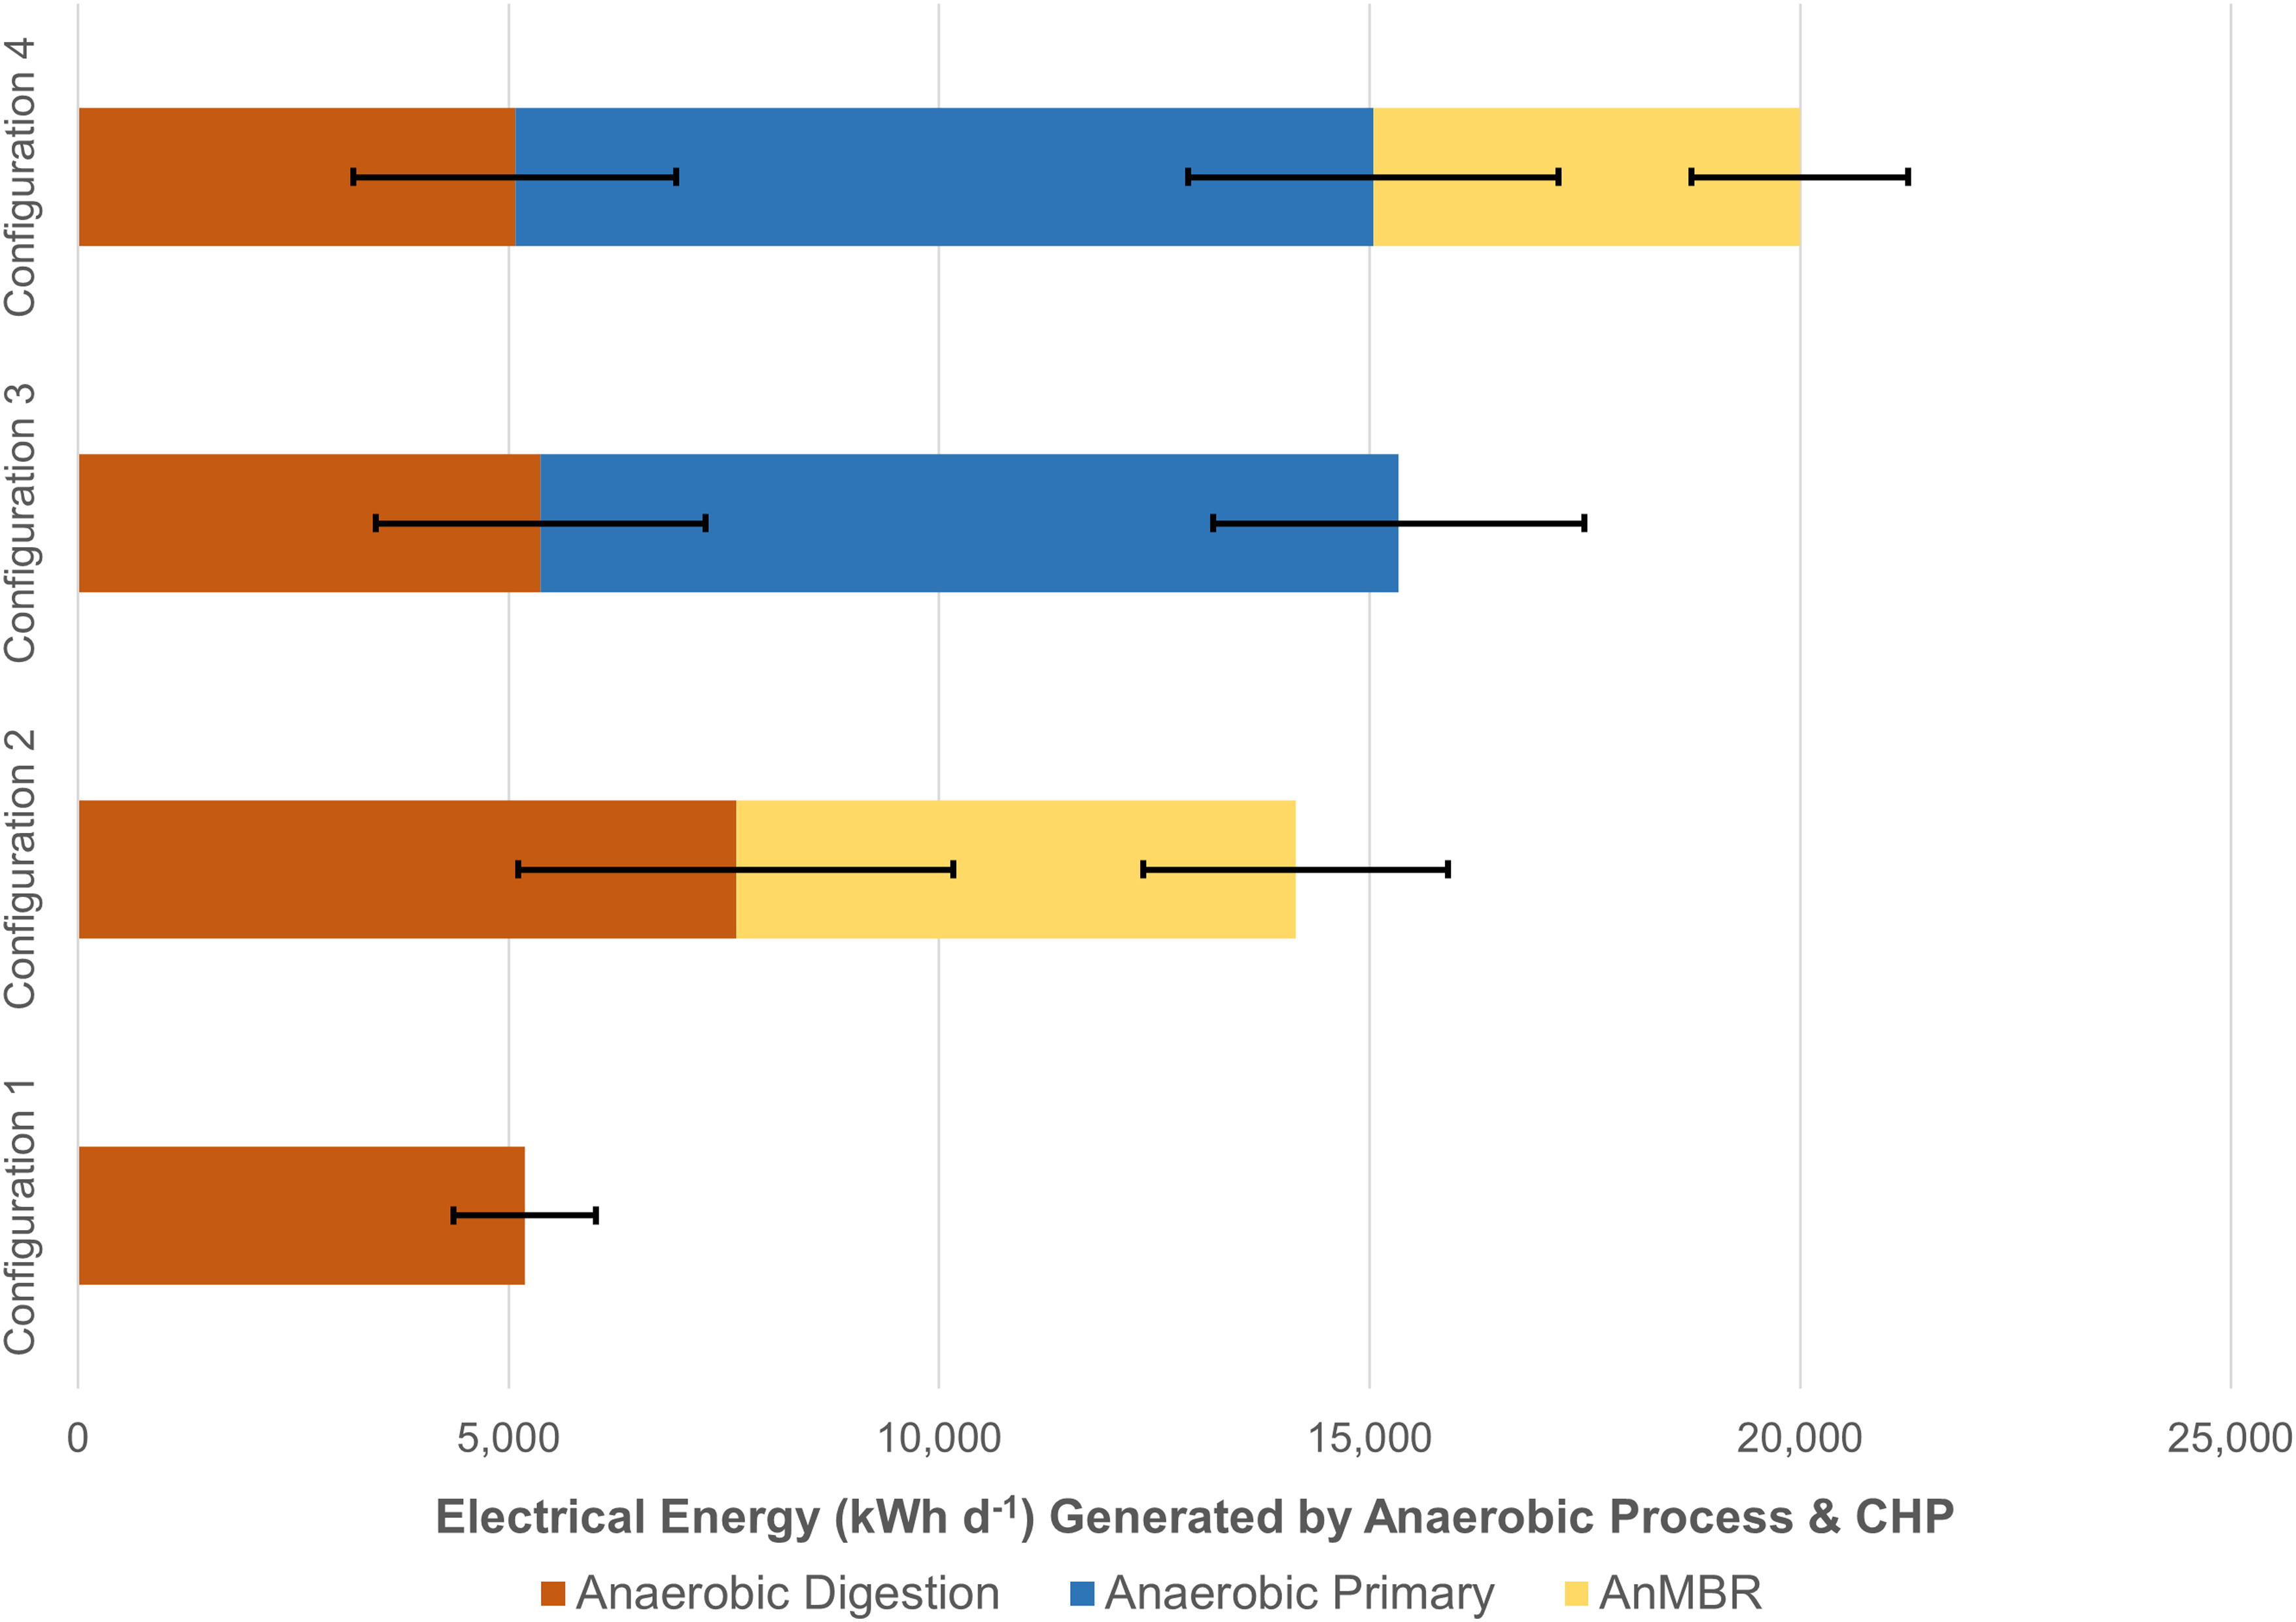
Electrical energy generated by process during the treatment of 37,850 m3/day of influent wastewater to U.S. EPA secondary discharge standards. Each bar represents the mean value of electrical energy generated by that process. For configurations with more than one energy-generating process, the bars are additive. Error bars represent 1 standard deviation (±) from the mean.
Discussion and Conclusions
Energy-positive wastewater treatment
In general, the use of electrical energy from the grid should be minimized due to emission of greenhouse gases and losses associated with transmission of electricity to the WWTFs. Researchers have proposed several anaerobic bioreactor technologies for domestic wastewater treatment, many of which promise a net energy-positive condition and reduced reliance on the grid (Aslam et al., 2022; Ji et al., 2022; Mahmood et al., 2022). However, results from this study suggest that AnMBR-based treatment configurations require reduction in electrical energy use before achieving this condition. Specifically, the electrical energy required to operate the AnMBR modeled in this study (22,750 ± 5,660 kWh/day), coupled with energy requirements from other processes, prevents energy-positive scenarios for Configurations 2 and 4. Indeed, Configuration 2 demands the highest quantity of electrical energy from the grid. A reduction of energy used in AnMBR subprocesses, including biogas sparging (membrane fouling control) and permeate pumping (Shoener et al., 2014), is likely required to make AnMBR-based configurations energy positive.
The electrical energy required to operate the AnMBR at pilot scale varies widely in literature (Section S4.1 in the Supplementary Data); the range of values selected for Monte Carlo simulation in this study were 0.28 kWh/m3 (low-end value) to 1.00 kWh/m3 (high-end value). The modeling low-end value (0.28 kWh/m3) was derived from the best-case scenario reported for the second-generation staged anaerobic fluidized membrane bioreactor (SAF-MBR 2.0) operated at Stanford University, which is one of the first long-running pilot-scale systems to demonstrate system-level energy-positive wastewater treatment (Shin et al., 2021a; Shin et al., 2021b). When the SAF-MBR 2.0's best-case value is used, the energy required for modeled AnMBR operation decreases from 22,750 to 10,600 kWh/day. This reduction in AnMBR energy use would allow Configuration 4 to approach an energy-neutral condition. Specifically, Configuration 4's NEB would decrease from 12,880 kWh/day (mean value) required, to only 730 kWh/day required—a value within the standard deviation provided by Monte Carlo simulation.
Results for Configuration 3 indicated that the AnP+BNR+AnD treatment train will likely achieve an energy-neutral or possibly energy-positive condition (NEB = −670 ± 3,580 kWh/day). The advantage of an anaerobic sludge blanket bioreactors is their relatively small energy requirement. However, due to their inability to meet discharge standards for organics and suspended solids on their own, a follow-on treatment process is needed (Hahn and Figueroa, 2015; Mainardis et al., 2020; Pfluger et al., 2020; Pfluger et al., 2018)—most of which are more energy intensive. Despite this limitation, some WWTF designers may find incorporation of AnP into treatment trains advantageous. Indeed, a selection of energy-generating technologies and design optimization of energy recovery schemes will become increasingly important. Future energy-positive WWTFs will need to determine the amount of energy needed onsite versus the amount that can be generated. Achieving an energy-neutral condition daily will require accurate prediction and active monitoring, otherwise “excess” methane may need to be flared.
Furthermore, energy-positive WWTFs will need to consider if they want to produce excess electricity to sell to the local grid, or whether they want to upgrade excess methane-rich biogas to natural gas.
Of note, a comparison of energy used for nutrient removal technologies shows that BNR, which accounts for nitrogen and some organic removal in Configurations 1 and 3, exceeds that of PN/A in Configurations 2 and 4 (Fig. 3). Furthermore, the use of AnP before BNR in Configuration 3 reduces the energy requirement for BNR by 4,120 kWh/day relative to Configuration 1 (where CP is used with BNR) due to a reduction in required organic removal. Also of note, heat energy from CHP was purposefully not accounted for within NEB modeling. Heat energy produced onsite at WWTFs has a limited number of practical applications. Specifically, heat energy can be used to offset anaerobic digester heating needs (to 35°C, through heat exchanger) or for building space heating, which can reduce electrical energy requirements. Given the limited applications of heat energy at WWTFs, it is inappropriate to include all heat energy produced into the NEB; therefore, heat energy is listed as a separate item in Table 3.
Other onsite energy-generating options
The energy generated onsite at anaerobic WWTFs could increase if additional energy-generating processes are included. One approach is to supplement anaerobic digesters with additional organic material, such as food scrap waste, fats, oils, and grease (FOG), and/or other wastes, for example, pulp mill condensate, which can be transported from local communities (Breunig et al., 2017; Hayes et al., 2022; Koch et al., 2016). Adding these organics would increase the available chemical energy and subsequently the quantity of biogas produced, thereby increasing the amount of energy generated onsite. This approach, called codigestion, is used at some WWTFs worldwide and is very promising. However, some implementation challenges exist in the U.S., to include regulatory uncertainty, food waste collection and processing issues, and lack of design and operational experience (Nghiem et al., 2017; Pfluger et al., 2019). Furthermore, other approaches to increase methane production by gaining process efficiencies, for example, pretreating sludge, should be explored (Hart et al., 2022).
Other energy-generating technologies that could be added to an anaerobic treatment train include pyrolysis, gasification, or incineration of biosolids (post AnD) (WERF, 2011), or thermal heat energy recovery from the wastewater itself using heat-pump extraction (McCarty et al., 2011).
Future studies
This study addresses energy use and production using the current state of the art. However, the nascency of anaerobic technologies (AnMBRs, AnP, and PN/A), most of which have primarily operated at pilot scale for limited periods of time, provided a wide range of input values for Monte Carlo simulation. Over time, increased data from longer-running pilot-scale and full-scale systems should narrow the range of values and reduce uncertainty, allowing for more refined results. Furthermore, additional study of each anaerobic technology should, in principle, increase system-level efficiencies and will ideally reduce energy demand (and/or increase energy production). Full-scale studies will also provide values for other WWTF requirements such as odor control (Section S4.5 in the Supplementary Data), which are particularly difficult to predict for a future full-scale anaerobic WWTF. Furthermore, the treatment of anaerobic effluents remains a challenge that requires further study (Tyagi et al., 2019).
Based on literature, this study assumes a degassing membrane will recover 60–98% of dCH4 (Tables 1 and 2); however, additional examination is required to determine if degassing membranes are a best-available technology for dCH4 recovery (Ersahin et al., 2019). Removal of other anaerobic effluent constituents, like hydrogen sulfide and phosphorus, also requires further examination. Last, codigestion of food scraps and FOG, and/or biosolids pyrolysis, gasification, or incineration for increased onsite energy generation could be considered in future modeling studies.
Beyond this energy-related study, lifecycle analysis (LCA) studies for proposed complete anaerobic WWTFs that include all treatment processes should be conducted. NEB results from this study could be incorporated into such LCA analyses to help identify reductions in greenhouse gas emissions and other environmental impact categories. Furthermore, uncertainty modeling from pilot- and full-scale demonstrations of anaerobic technologies should be used for lifecycle analyses. Harclerode et al. (2020) conducted a LCA and economic analysis of proposed complete AnMBR-based WWTFs; however, their analysis did not include uncertainty modeling and fell short of including all treatment processes required to operate a complete full-scale anaerobic WWTF. While this study provided a meaningful contribution to literature, future efforts should account for uncertainty in pilot-scale data, consider other anaerobic treatment processes (beyond the AnMBR), and include all associated treatment processes for a complete facility.
Footnotes
Authors' Contributions
C.L.: idea generation, modeling, and writing. M.B.: idea generation, writing, and editing. E.B.: idea generation, writing, and editing. M.W.: idea generation, and editing. Al.P.: idea generation, writing, and editing. An.P.: idea generation, modeling, editing, and supervision.
Author Disclosure Statement
The authors declare that they have no known competing financial interests or personal relationships that could have appeared to influence the work reported in this article.
Funding Information
This research was supported by the U.S. Department of Defense Environmental Security Technology Certification Program (ESTCP) grant EW22-7278.
References
Supplementary Material
Please find the following supplemental material available below.
For Open Access articles published under a Creative Commons License, all supplemental material carries the same license as the article it is associated with.
For non-Open Access articles published, all supplemental material carries a non-exclusive license, and permission requests for re-use of supplemental material or any part of supplemental material shall be sent directly to the copyright owner as specified in the copyright notice associated with the article.