
Abstract
In this study, magnetic alginate beads (MABs) were prepared as adsorption materials by adding Fe3O4 nanoparticles to sodium alginate (SA) matrix through in situ cross-linking and freeze drying. To improve adsorption performance, bentonite (BE) and activated carbon (AC) were also used to create composite BE–MABs and AC–MABs, respectively. Furthermore, Fourier transform infrared spectroscopy, scanning electron microscopy, and X-ray diffractometry were used to characterize the magnetic beads before and after Cd(II) adsorption. BE and AC were successfully compounded with SA, which not only enhanced the compressive properties of SA but also exploited the adsorption capacities of BE and AC for cadmium. Batch adsorption experiments revealed that the optimum adsorbent dosage, pH, and contact time were 0.2 g, 5, and 1,440 min, respectively. The adsorption kinetics of the MABs and AC–MABs obeyed the pseudo-second-order model, suggesting that chemical reactions are involved in Cd(II) adsorption. The experimental adsorption–equilibrium isotherm data are consistent with the Langmuir model, which reveals that the process involves monolayer surface adsorption. The results show that magnetic bead materials with BE or AC can be used to treat cadmium-contaminated wastewater with similar efficiencies.
Introduction
Heavy metals are among the most important pollutants present in industrial wastewater because they are nondegradable, persistent, and toxic (Safari et al., 2022). Among them, Cd ions are released from anthropogenic (lead–zinc ore mining, metal electroplating, nonferrous metal production, phosphate fertilizer production, paint industry, photography, and battery manufacturing) and natural sources (volcanic eruptions and forest fires) (Huang and Keller, 2015; Zeng et al., 2015). Notably, Cd can severely damage the kidneys and bone (Awual et al., 2018). Owing to its high toxicity, the World Health Organization has set the permissible Cd concentration in drinking water to 0.003 mg/L (Gutiérrez-Segura et al., 2012).
Currently, technologies for controlling Cd include adsorption, ion exchange, chemical precipitation, reverse osmosis, bioremediation, and membrane filtration (Liakos et al., 2020; Yang et al., 2018). Among these, the adsorption method is widely used to treat Cd wastewater (Pan et al., 2018; Su et al., 2022; Yang et al., 2020; Zhou et al., 2022) because the process is simple, cost-effective, efficient, environmentally friendly, among others (Gao et al., 2018). However, the performance, stability, reusability, and cost of adsorption materials always restrict the application of adsorption technology.
In recent years, various new cadmium adsorption materials have been developed, such as biocomposite (El-Naggar et al., 2018; Nouri et al., 2015), modified biochar (Goh et al., 2019; Rajput et al., 2023; Yan et al., 2022; Zeng et al., 2015), nanocomposite materials (Awual et al., 2018; Bharadwaj et al., 2023; Wang et al., 2018b; Yang et al., 2020), magnetic nanoparticle sorbents (Chairul et al., 2023; Huang and Keller, 2015; Kataria and Garg 2018; Subrajit et al., 2022), agricultural waste and its modified materials (Elias et al., 2023; Garg et al., 2008; Liu et al., 2022; Othmani et al., 2022), biodegradable magnetically/recyclable cellulose-based adsorbent (Ghahremani et al., 2023), porous multimetallic silicate (Zhao et al., 2023), and composite hydrogel (Ghobadifar et al., 2023; Zhou et al., 2022).
In addition, renewable biopolymers and their modified forms have been developed as advanced adsorption materials to eliminate heavy metal ions from water resources (Ahmad et al., 2017; Li et al., 2021; Manzoor et al., 2019; Ray and Shipley, 2015; Yusuf et al., 2015). Alginate is widely used as a renewable biopolymer to remove Cd(II) (Ji et al., 2023; Majidnia and Idris, 2015; Pan et al., 2018; Sudhakar et al., 2023; Wang et al., 2018a).
Alginate is a biodegradable nontoxic biopolymer extracted from brown algae. Alginate biopolymers are inexpensive and have good cationic adsorption properties because of their large number of free carboxyl (–COOH) and hydroxyl (–OH) functional groups (Germanos et al., 2020); they have also been identified to have adsorption properties for heavy metals in aqueous solutions (Williams et al., 1998). In particular, sodium alginate (SA) is a linear polyanionic copolymer consisting of (1–4)-linked α-
Magnetic nanoparticles have attracted considerable attention because they are physically and chemically stable, biocompatible, highly dispersible, and have large specific surface areas. Importantly, they possess superparamagnetic properties and are easily removed from solution under the effect of magnetic forces (Bhaumik et al., 2011). Iron-based nanoparticles include goethite, hematite, maghemite, and magnetite (Zhu et al., 2013). Magnetite nanoparticles are the most widely used materials in the preparation of magnetic nanocomposite adsorbents owing to their unique properties, such as chemical stability, uniform particle size, and biocompatibility (Duman et al., 2016; Zhu et al., 2020). Magnetite exhibits an excellent removal rate and can be recycled after adsorbing Cd from wastewater (Kataria and Garg, 2018; Wang et al., 2018b). Numerous studies have revealed that the adsorption properties of polymers can be enhanced by the incorporation of magnetite nanoparticles (Chang et al., 2006; Li et al., 2013; Liu et al., 2012; Oliveira et al., 2003; Zhu et al., 2022).
Bentonite (BE) and AC have been widely used as adsorbents (Avik et al., 2022; Awad et al., 2019; Gupta et al., 2015; Kaya and Oren 2005; Largitte and Laminie, 2015; Rivera-Utrilla et al., 2011; Yan et al., 2022). Embedding BE or AC into an alginate matrix reportedly results in good adsorption properties (Benhouria et al., 2015; Cataldo et al., 2016; Hassan et al., 2014; Oussalah et al., 2019; Pawar et al., 2020; Tan and Ting, 2014). However, most current studies use alginate composites with BE or AC for methylene blue, Cu(II), and Pb(II). In addition, the removal of Cd(II) with magnetic BE or AC composites has rarely been reported. Comparing the effects of several composite materials on cadmium adsorption in the presence and absence of BE or AC is beneficial when screening effective adsorption materials for Cd(II)-containing wastewater.
In this study, magnetic alginate beads (MABs) were synthesized using an in situ cross-linking and freeze-drying method. Furthermore, BE and AC were incorporated into the MABs to prepare BE–MAB and AC–MAB composites, respectively. The morphologies and structures of the three bead types were characterized following Cd adsorption, and the effects of adsorbent dosage, contact time, pH, and initial Cd2+ concentration on the removal efficiency were analyzed. Finally, the kinetics and isotherm behavior of the adsorption process were studied.
Materials and Methods
Chemicals and materials
Fe3O4 particles less than 50 nm in size were purchased from Xingtai, Hebei. Powdered AC (Cationic exchange capacity 65.28 mmol·[100 g]−1, specific surface area 120.50 m2/g, particle size 122.4–141.8 nm, density 2–3 g/cm3) and BE (specific surface area 934 m2/g, average particle size 10 μm, density 0.45–0.55 g/cm3) were purchased from the Chongqing Maoye Chemical Reagent Co. Ltd., while cadmium nitrate tetrahydrate (CdNO3·4H2O), calcium chloride dihydrate (CaCl2·2H2O), sodium chloride (NaCl), nitric acid (HNO3), and sodium hydroxide (NaOH) were supplied by the Chengdu Cologne Chemicals Co., Ltd.
Preparing the MABs, BE–MABs, and AC–MABs
SA (2 g) and Fe3O4 nanoparticles (4 g) were added to distilled water (94 mL) and then continuously stirred until it was evenly mixed. The mixture was then slowly dripped into a 2% CaCl2 solution (200 mL). The precipitate obtained by cross-linking the magnetic alginate droplets with calcium ions consisted of black balls with an average diameter of 2 mm. The produced beads were placed in a CaCl2 solution rest and harden for 18 h. After filtration, excess calcium was removed from the beads by washing with deionized water, after which they were freeze-dried in a freeze dryer (SCIENTZ-10N; Ningbo Scientz Biotechnology Co. Ltd., China) at −50°C for 12 h. The resulting materials are shown in Fig. 1. The same procedure was used to prepare the BE–MABs and AC–MABs by adding BE (2 g) and AC (2 g) to the mixed magnetic SA solution, respectively (Verma et al., 2017).
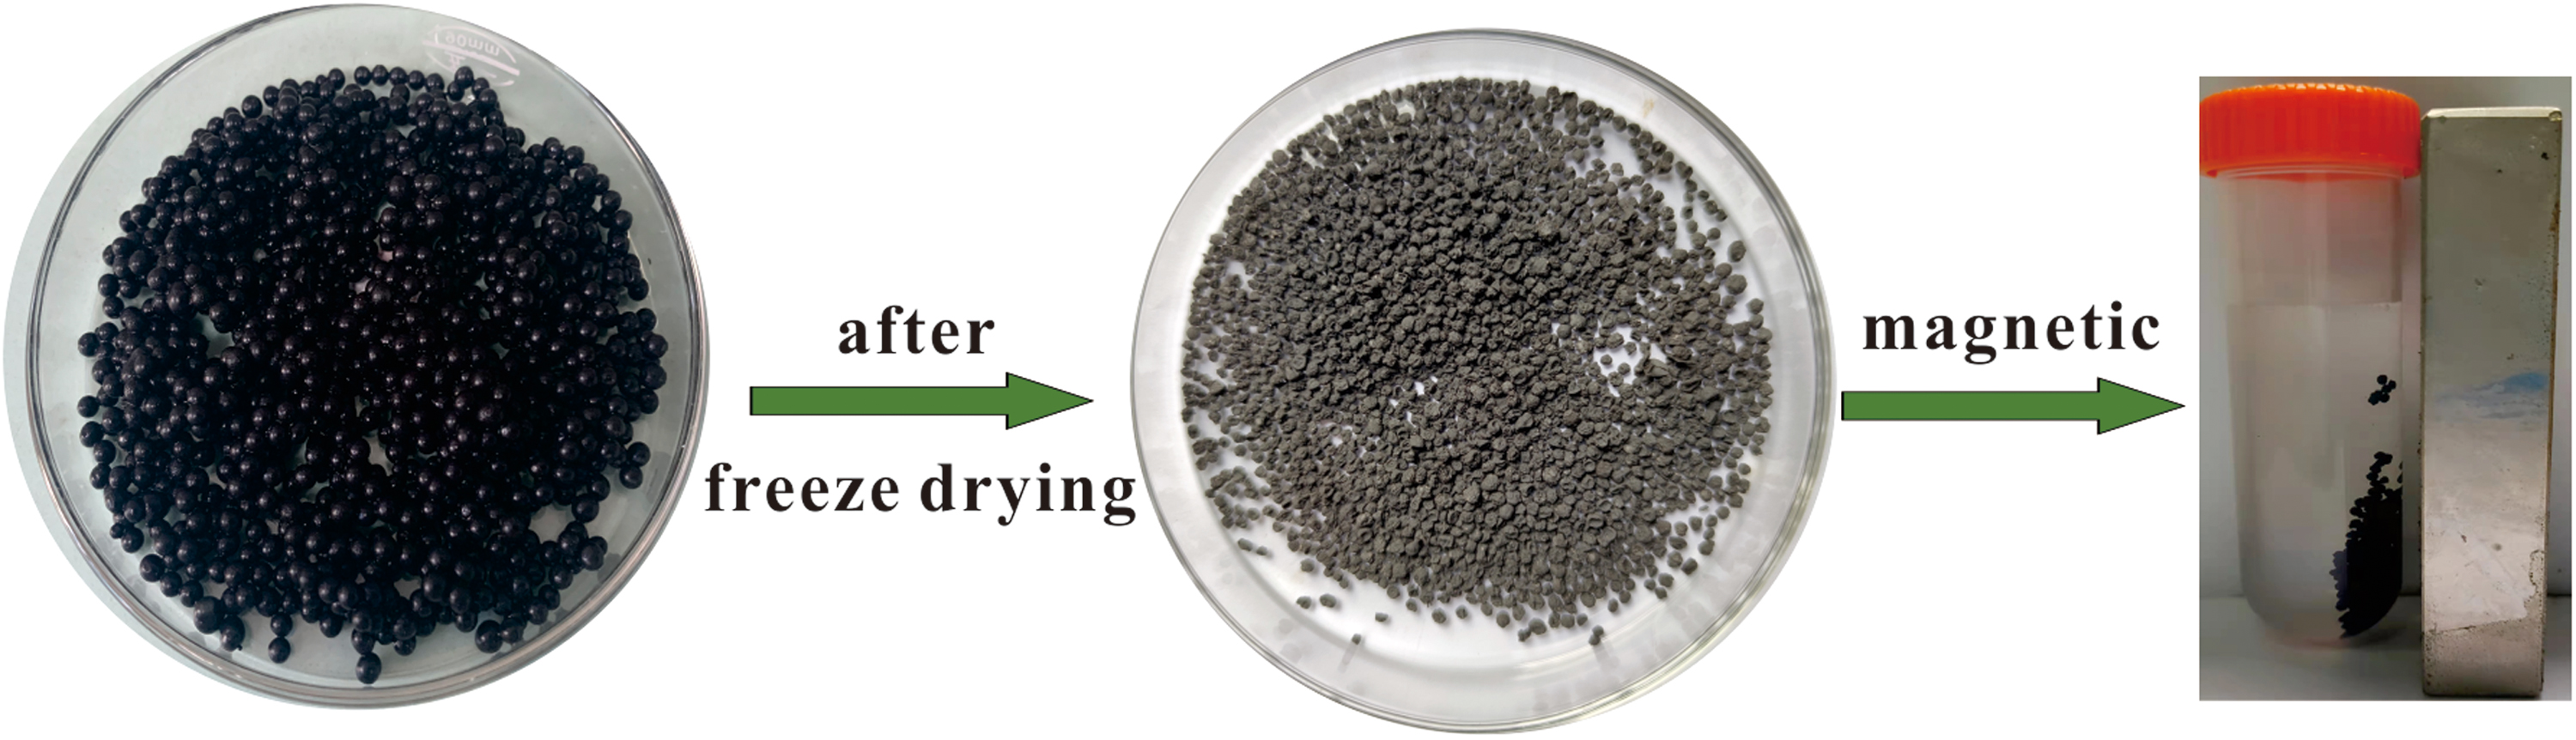
Adsorbed bead morphologies before and after drying.
Characterization methods
The magnetic SA materials were characterized using field emission scanning electron microscopy (SEM) augmented with energy-dispersive X-ray spectroscopy (EDX; ZEISS Sigma 500, ZEISS, Jena, Germany) and X-ray diffractometry (XRD; Haoyuan DX-2700, Dandong, China). Fourier transform infrared (FTIR) spectroscopy was performed on a Thermo FTIR 5700 Spectrometer (Thermo Fisher Scientific, Massachusetts, USA). The specific surface area, pore volume, and average pore diameter of synthesized materials were determined on a static N2 adsorption instrument (BET, V-Sorb 2800TP, Beijing, China).
The pH at the point of zero charge (pHpzc) was determined by preparing a 0.1 M NaCl solution and adjusting its initial pH (pHi) between 2 and 10 (in intervals of 1 pH unit). NaCl solutions (20 mL) with various pH values were separately placed into 50-mL centrifuge tubes, after which the adsorbent (0.1 g) was added, and the mixtures were oscillated for 24 h. The final pH of the solution was measured using a pH meter. A plot of ΔpH as a function of pHi was constructed and used to determine the pHpzc.
Adsorption experiments
Adsorption kinetics experiments were carried out in 30 mL initial Cd(II) solution (20 mg/L) at room temperature. The pHi was adjusted to 5, adsorbent (0.2 g) was added, and the Cd concentration was determined using a flame atomic spectrophotometer (4530F; INESA, Shanghai, China).
Isothermal adsorption experiments were carried out at 25°C and Cd(II) concentrations in the 20–120 mg/L range. Adsorption material (0.2 g) was added to the mixture after which it was oscillated at 120 rpm for 48 h.
The adsorption properties of the MABs, BE–MABs, and AC–MABs were determined in batch adsorption experiments. In addition, the effects of the initial concentration of Cd ions and the reaction time were also studied.
The change in the Cd(II) concentration was calculated as follows:
where R is the removal rate of Cd(II) in the solution, C0 (mg/L) is the initial Cd(II) concentration, and Ct (mg/L) is the concentration at time t.
The three types of beads (0.2 g) were added to different centrifuge tubes (50 mL), and a Cd(II) solution (30 mL) was poured into each tube. Each solution was shaken in a shaker at room temperature. The residual Cd(II) concentration was calculated at various time points to analyze the adsorption kinetics of the MABs, BE–MABs, and AC–MABs using the following equation:
where qt (mg/g) is the amount adsorbed at time t, m (g) is the quantity of the adsorbent, and V (L) is the volume of the solution.
Results and Discussion
Material characterization
FTIR studies
The composites before and after adsorbing Cd for 24 h were characterized by FTIR spectroscopy. Figure 2 shows that the MABs, BE–MABs, and AC–MABs exhibit similar spectra. The peak at 3,413 cm−1 is ascribable to the stretching vibration of the –OH moiety in SA; the weak peak near 2,921 cm−1 is associated with the asymmetric stretching vibration of the alkane group (C–H) (Nouri et al., 2015); here, the “egg box” structure formed by the SA macromolecules and calcium ions limits C–H bond extension (Pan et al., 2018). The spectra of each type of bead present a weak peak at 1,419 cm−1 owing to the carboxylate group (C–O) of alginate, and a strong characteristic peak at ∼1,604 cm−1 (Khajavi et al., 2021; Monier et al., 2015).
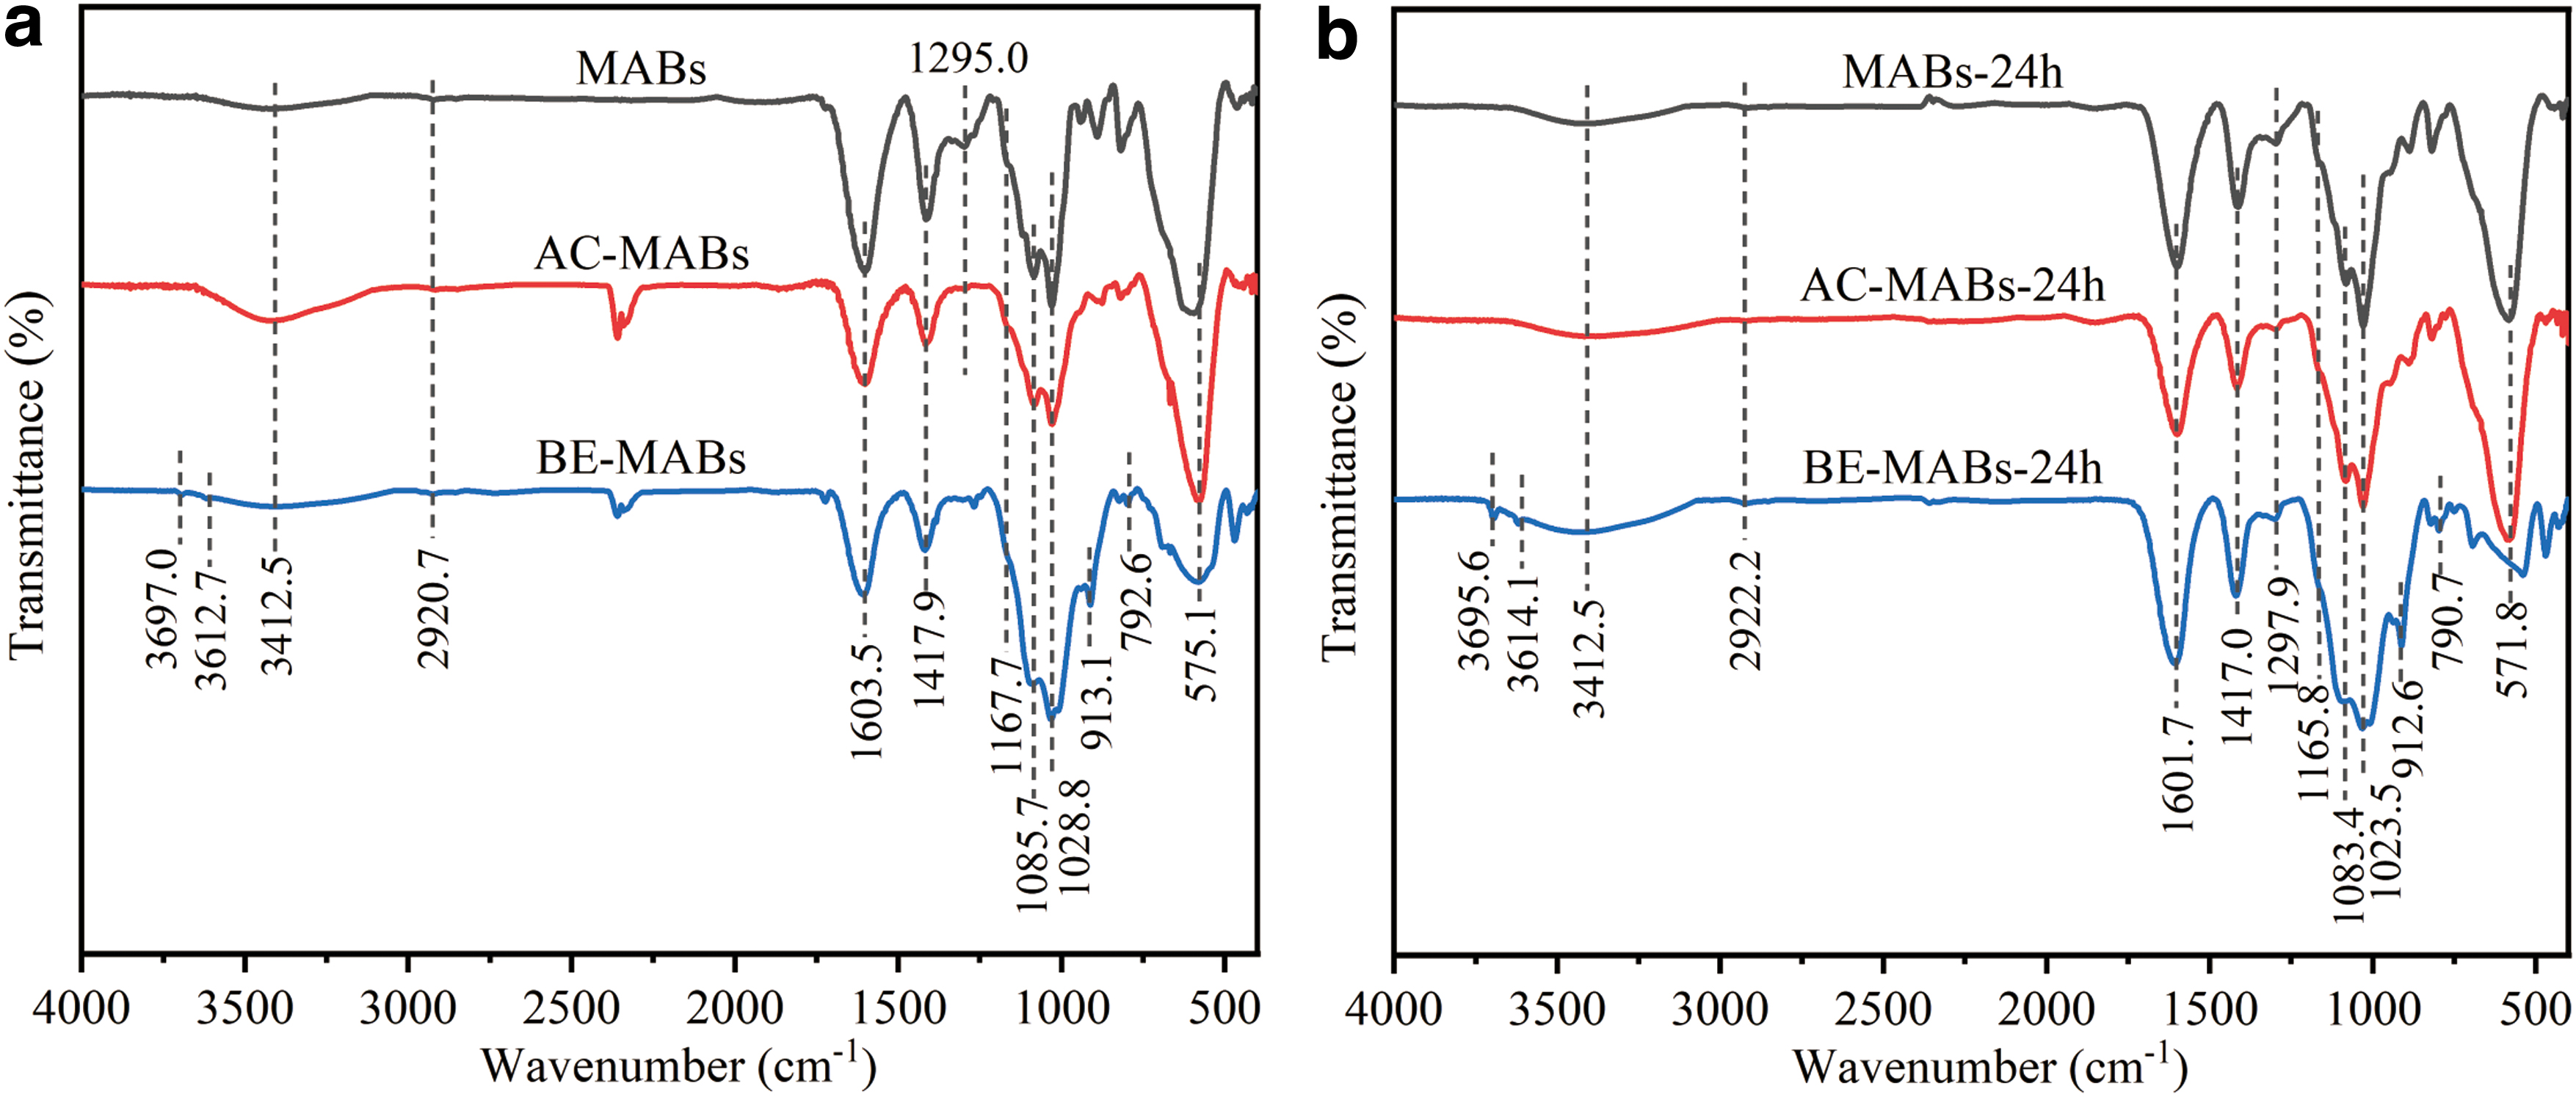
Characterizing the MABs, BE–MABs, and AC–MABs by FTIR spectroscopy
The peaks at 1,029 and 1,086 cm−1 indicate the presence of C–O (Deng et al., 2018; Filipiuk et al., 2005), consistent with C–OH stretching vibrations (El-Naggar et al., 2018). The in-plane and out-of-plane deformation vibrations of Fe–O groups are observed near 575 cm−1, indicative of the presence of Fe3O4 on each MAB surface (Mohapatra et al., 2009; Safari et al., 2022). Notably, peak positions and intensities before and after Cd adsorption are very similar for all the three bead types owing to the small amount of adsorbed Cd2+.
SEM–EDX studies
The surface morphologies of the MABs, BE–MABs, and AC–MABs before and after Cd(II) adsorption were observed using SEM. Figure 3a–f shows that all composites present rough surfaces with dense networks. Notably, pores increase the specific surface area, providing additional binding sites and facilitating metal ion diffusion during adsorption. No noticeable differences are observed in the 50-μm SEM images of the magnetic beads before and after Cd(II) adsorption, indicative of good material stability.

SEM images of the
The characteristics of the MABs, BE–MABs, and AC–MABs before and after Cd(II) adsorption were further studied by EDX (Fig. 4), which revealed the presence of calcium on the surfaces of the three adsorbents, with O, Fe, and C accounting for more than 10% of the material. In addition, Na is present in the MABs and BE−MABs. Notably, the BE–MABs possess higher Si and Al contents than the other beads owing to the addition of BE. The AC–MABs exhibit a relatively high C content owing to the addition of AC. Cd was detected on the surfaces of the three types of beads following adsorption testing. The Na content was observed to decrease dramatically with increasing Cd ion content, which suggests that Cd(II) combines with the carboxylate group (–COO−Na+) of the composite to form (–COO−Cd2+) with the release of Na+ (Abu Elgoud et al., 2022). Meanwhile, the calcium content also decreased, which suggests that Cd ions exchange with Ca2+.

EDX results for the
XRD studies
Figure 5 presents the XRD patterns of the MAB, BE–MAB, and AC–MAB crystals before and after 24 h of Cd adsorption. Diffraction peaks at 38.5°, 44.8°, 65.2°, and 77.3° observed in the pattern of each material correspond to the (2 2 2), (4 0 0), (4 4 0), and (5 3 3) planes of Fe3O4, respectively, indicative of a stable Fe3O4 structure (PDF#26-1136, Fig. 5) in each adsorbent. No other diffraction peaks were observed, which indicates that SA has good cementation characteristics that endow the various material components with good compatibility (Thao et al., 2019). However, these characteristic diffraction peaks were less intense after the adsorption of Cd(II), most likely because new complexes are formed by chemical reactions during the adsorption process.

XRD patterns of the MABs, BE−MABs, and AC−MABs before and 24 h after Cd(II) adsorption. XRD, X-ray diffractometry.
BET studies
The N2 adsorption and desorption isotherms of the MABs, BE–MABs, and AC–MABs (Fig. 6) are type IV isotherms, indicating the mesoporous behavior of adsorbents (El-Sharkawy et al., 2022; Xu et al., 2023). BET analysis data are provided in detail in Table 1. Based on the BET result, the AC–MABs have a relatively high surface area, which might increase the adsorption efficiency.
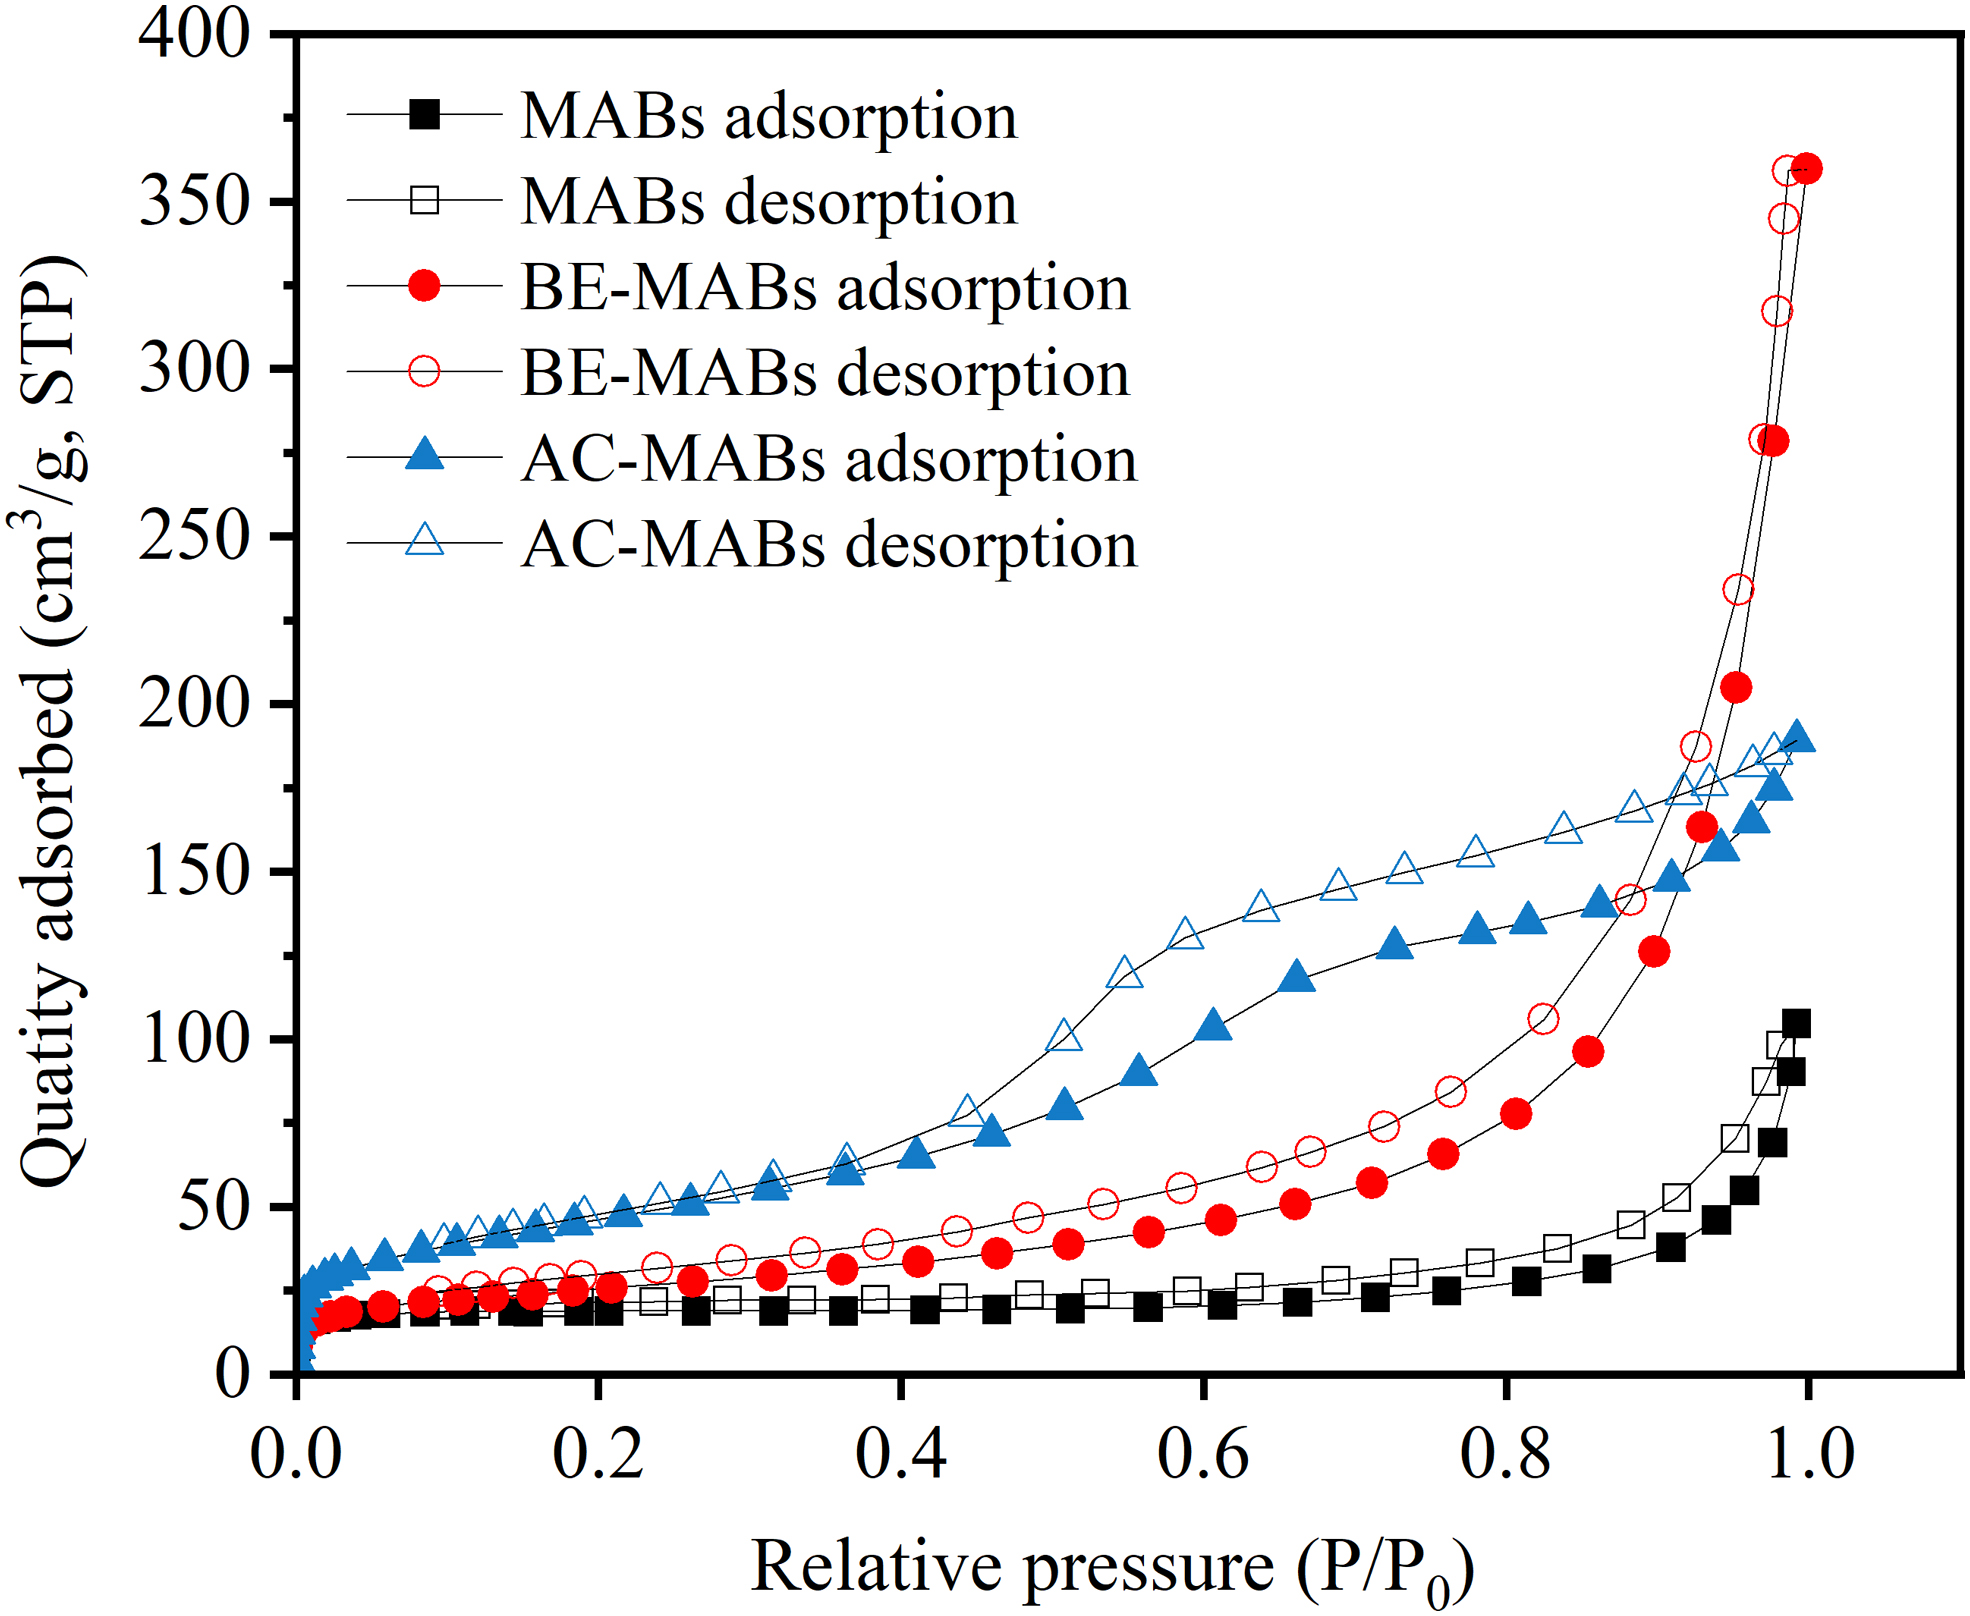
N2 adsorption and desorption isotherm plots of the MABs, BE–MABs, and AC–MABs.
Surface Area (BET) Analysis Data of the Magnetic Alginate Beads, Bentonite–Magnetic Alginate Beads, and Activated Carbon–Magnetic Alginate Beads
AC, activated carbon; BE, bentonite; MABs, magnetic alginate beads.
pH at the point of zero charge
Supplementary Figure S1 shows the plots of ΔpH as functions of pHi, which reveals that the MABs, BE–MABs, and AC–MABs exhibit pHpzc values of 6.73, 7.27, and 6.83, respectively. The surface is positively charged at effluent pH values below pHpzc and negatively charged at effluent pH values above pHpzc.
Adsorption studies
Adsorbent dosage
Supplementary Figure S2a and b shows how magnetic bead dosage affects adsorption capacity (qe) and removal rate (R), with both qe and R observed to increase as more adsorbent is added at constant Cd concentration. Cd(II) removal rates of 87.82%, 91.25%, and 91.88% were determined when 0.2 g of the MABs, BE−MABs, and AC−MABs were used, with adsorption capacities of 3.3809, 3.5132, and 3.5375 mg/g, respectively, recorded; hence, the addition of BE or AC improves R and qe. Further increases in dosage led to decreases in R and qe as equilibrium was gradually established. Consequently, high adsorbent doses do not lead to more effective Cd(II) adsorption, which is possibly due to adsorption-site saturation (Badawi et al., 2021; Wang et al., 2018a). Increasing the adsorbent loading may cause mutual extrusion and aggregation among adsorbents at fixed Cd solution concentration and volume, resulting in incomplete utilization of surface adsorption sites (Senturk et al., 2009).
Effect of pH
Previous studies showed that the pH is the main factor that controls the adsorption process (Goh et al., 2019; Yi et al., 2018). Supplementary Figure S2c and d shows how pH affects qe and R when the values of other parameters are fixed. The qe and R values tended to balance with a slight fluctuation at pH 3. The R was observed to increase significantly as the pH was increased from 1 to 3, more slowly between pH 3 and 5, and then slightly more slowly between pH 5 and 7. The high concentration of H+ at extremely low pH prevents Cd2+ from approaching the binding sites of the magnetic beads, leading to lower adsorption (Cheng et al., 2020; Vijayalakshmi et al., 2016).
As the H+ concentration decreases with increasing pH, the number of Cd(II)-binding sites increases, which enhances the adsorption capacity. The –COOH and –OH functional groups within the beads combine with H+ in solution through deprotonation, which changes the surface charge and affects the electrostatic adsorption performance of the absorbent (Wu et al., 2006). An appropriate concentration of H+ facilitates chelation and complexation between the –COOH/–OH groups and Cd2+ (Hossain et al., 2011), which enhances adsorption performance. Considering that the pH of Cd(II)-containing wastewater (electroplating wastewater, mining wastewater, etc.) is mostly acidic, the magnetic alginate material developed in this study may be very useful in practical applications.
Effect of contact time
Previous studies (Gupta and Suhas, 2009; Safari et al., 2022) revealed that long-term contact can increase R and qe. Supplementary Figure S2e and f shows how R and qe vary with contact time; qe increases rapidly at the initial stage, with dynamic equilibrium achieved at a contact time of 1,440 min (Wang et al., 2018b; Yan et al., 2017), when almost all adsorption sites are occupied (Vijayalakshmi et al., 2016) and active sites are saturated. The experimental results reveal that the MABs, BE–MABs, and AC–MABs exhibit R values of 87.87%, 92.18%, and 91.04% for Cd(II), with adsorption capacities of 2.9305, 3.0652, and 3.0198 mg/g, respectively.
Effect of the initial Cd concentration
Supplementary Figure S2g shows that the adsorption capacities of the beads increase sharply at low concentrations because mass transfer, which is a driving force, is faster at higher concentrations (Garg et al., 2008). Each adsorption curve rises slowly and gradually reaches equilibrium as the initial Cd(II) concentration increases and the available binding sites on the adsorption material become occupied (Derome and Gadd, 1987). Supplementary Figure S2h reveals that R decreases with increasing initial Cd(II) concentration, in accordance with previous research conclusions (Safari et al., 2022; Wang et al., 2017). The specific active sites on the magnetic beads effectively adsorb Cd(II) at low Cd(II) concentrations, and the beads exhibit high R values, whereas the adsorption sites are saturated at high concentrations, and lower R values are obtained (El-Sayed et al., 2010).
Adsorption kinetics
The following kinetic models were used to understand the magnetic beads adsorption process (Cataldo et al., 2016; Cheng et al., 2020; Ho and McKay, 1999; Manzoor et al., 2019; Wang et al., 2018b):
where qe (mg/g) and qt (mg/g) are adsorption capacities at equilibrium and time t, respectively, and k1 (min−1) and k2 (g/[mg·min]) are the adsorption rate constants of the two models, respectively.
Supplementary Figure S3 presents linearly fitted kinetic adsorption data for Cd(II) adsorbed on the MABs, BE–MABs, and AC–MABs. Table 2 reveals that the theoretical adsorption capacities of the BE–MABs and AC–MABs are higher than that of the MABs. The qe values calculated using the pseudo-second-order model are more consistent with the actual adsorption capacities, and its R22 values (>0.99) indicate that the pseudo-second-order equation better fits the data (Badruddoza et al., 2013). Therefore, Cd(II) adsorption by the magnetic beads is mainly controlled by chemical adsorption (Pang et al., 2011), which is related to electron sharing or cation exchange between Cd(II) and the functional groups in the adsorption materials (Li et al., 2011; Ma et al., 2017).
Kinetic Data for Cd(II) Adsorption on the Magnetic Alginate Beads, Bentonite–Magnetic Alginate Beads, and Activated Carbon–Magnetic Alginate Beads
Adsorption isotherms
The Langmuir model assumes that a monolayer surface adsorbs without any interdependence between the adsorbed particles, while the Freundlich model assumes multilayer adsorption, wherein the adsorbed particles are interdependent, and the adsorption capacity increases with concentration (Manzoor et al., 2019; Wang et al., 2018b). The experimental data were analyzed using the two models, which are represented as follows:
(Choy et al., 2000)
(Proctor and Toro-Vazquez, 1996).
where kL (L/mg) and kF [(mg/g) (mg/L)1/n] are the Langmuir and Freundlich constants, Ce (mg/L) is the equilibrium concentration, qm (mg/g) is the maximum amount adsorbed, and the 1/n value reflects the adsorption strength (Kim et al., 2015).
The data are shown in Supplementary Figure S4 and listed in Table 3, particularly, the RL2 values reveal that the Langmuir model can better simulate the experimental data for the three kinds of beads. Cd ions interact with each type of bead to form uniform monolayers on the surface (Wang et al., 2018b). While the AC–MABs exhibited the highest theoretical maximum adsorption capacity (qm) among the three types of beads, its value is lower than those reported in other studies, which is possibly attributable to the low initial Cd ion concentration. Similar findings have been reported for many pollutant–adsorbent systems (Bozoğlan et al., 2020; Duman et al., 2015). The n values in the Freundlich isothermal model are higher than 1, indicating a nonlinear preferential adsorption (Lalley et al., 2016).
Isotherm Data for Cd(II) Adsorption on the Magnetic Alginate Beads, Bentonite–Magnetic Alginate Beads, and Activated Carbon–Magnetic Alginate Beads
Conclusions
In this study, we enhanced the magnetic responsiveness of alginate beads by the addition of nano Fe3O4, which facilitated their separation from aqueous solutions. In particular, the BE–MABs and AC–MABs were prepared by adding BE and AC to the MABs, respectively. Material characterization revealed that carboxyl (–COOH) and magnetic (Fe–O) functional groups were successfully introduced into the MABs without significantly impacting their overall morphologies. While the structure of the material remained unchanged after adsorbing Cd(II) ions, their characteristic diffraction peaks were less intense owing to the formation of new complexes.
The results of adsorption experiments show that the addition of BE or AC slightly improved MAB adsorption capacity. While the Cd(II) removal rate by each material exceeded 90%, the AC–MABs are superior to the BE–MABs at high Cd(II) concentrations. Furthermore, adsorption kinetics and isothermal adsorption studies revealed that adsorption occurs through a chemical-reaction-based single-molecule adsorption process. Hence, the results of this study show that the MABs, BE–MABs, and AC–MABs can be used as effective adsorbents to treat Cd(II)-containing wastewater, especially because they are millimeter-scale magnetic materials, that are more conveniently recycled in sewage treatment facilities.
Footnotes
Authors' Contributions
Q.L., Y.W., and S.L. contributed to the conception and design of this research. Material preparation and experimental operation were performed by Q.L., J.Z., T.L., and Q.Z. Data analysis was performed by Q.L. and J.Z. The first draft of the article was written by Q.L. Y.W. put forward a constructive discussion on this study. All authors have read and approved the final article.
Author Disclosure Statement
No competing financial interests exist.
Funding Information
This research was supported by the Science and Technology Key Research Support Foundation of Sichuan Province (Grant Nos. 2021YFS0294 and 2021YFN0128) and the Special Basic Cooperative Research Programs of Yunnan Provincial Undergraduate Universities' Association (Grant Nos. 202101BA070001-084).
References
Supplementary Material
Please find the following supplemental material available below.
For Open Access articles published under a Creative Commons License, all supplemental material carries the same license as the article it is associated with.
For non-Open Access articles published, all supplemental material carries a non-exclusive license, and permission requests for re-use of supplemental material or any part of supplemental material shall be sent directly to the copyright owner as specified in the copyright notice associated with the article.