
Abstract
The population pressure and rapid urbanization in the Southern Punjab of Pakistan have led to massive landuse transformations in the recent years, especially in the Multan and Bahawalpur district. These frequent landuse alterations disrupt the crop yield and indirectly affect the livelihoods and economy at the national level. With an aim to assess the agricultural shifts in cotton landscapes of Multan and Bahawalpur districts over two decades, the advanced classification techniques of Machine Learning Algorithms (MLA), Random Forest (RF) was used. One year composite of monthly time series images were taken along with Normalized Difference Vegetation Index in Google Earth Engine (GEE) for the selected years (2000, 2005, 2010, 2015, and 2020). The Landuse/Landcover classes extracted through satellite imagery included cropland, orchards, settlement, water, and other land for both districts, while forest class was extracted for Bahawalpur district only. The results indicated that the use of MLA, RF classifier highlights the variations in cotton landscapes with an accuracy greater than 85%. It was observed that the cropland and other lands in Multan reduced by 3.03% and 20.33%, respectively, while the classes such as orchard, wetland, and settlement significantly increased by 66.1%, 40.3%, and 75.5%, respectively. Similarly, in Bahawalpur an overall increase was observed in croplands, forests, water bodies, and settlements over the two decades. It can be confidently concluded that GEE has become a viable alternative to conventional methodologies for remote sensing applications while providing a comparatively higher degree of confidence in results.
Introduction
The term “Landuse” states the way the land has been utilized by human, including settlement, industry, croplands, and so on, while “Landcover” denotes the physical properties of Earth Surface in terms of distribution of soil, water, vegetation, and other topographic features. Both of the terms are closely linked and are used interchangeably (Kaul and Sopan, 2012). The Landuse/Landcover (LULC) changes, whether natural or forced by humans, disrupt the delicate equilibrium of ecosystems (Siddiqui et al., 2020a). Since decades, landscapes are being altered by mankind to meet the needs of ever-growing population. Numerous researchers have highlighted that LULC changes are more frequent all over the world, especially in the densely populated parts of the world (Gadrani et al., 2018). The LULC changes directly affect the drivers of natural ecosystem, including future climate systems, soil cover, vegetation dynamics, water resources, and the biodiversity, which are crucial for sustainability (Rounsevell and Reay, 2009).
Since the advancement in geospatial technology, satellite data have replaced the traditional methods, including topographic sheets for addressing the LULC changes over the different times. LULC has become a vital component in the management of natural resources and for the monitoring of environmental changes (Hussain et al., 2020a). Nadeem (2021) conducted LULC change analysis using Landsat images, to highlight the urbanization process in Multan from year 2008 to 2018. A conventional supervised image classification method “Maximum Likelihood” was adopted in this study. The LULC classes, including built-up, bare soil, vegetation, and cultivated area, were extracted through supervised image classification using ArcMap software. Furthermore, the values of Normalized Difference Vegetation Index (NDVI) were also extracted to analyze the vegetation cover changes for 3 years 2008, 2013, and 2018. The study concluded that in year 2008 Multan city consisted of 47.4 Sq.km built-up area that expanded to 70.3 Sq.km in 2018 in response to population growth. The urban growth and socioeconomic development were said to be the major causes of this rapid urbanization which indirectly affected the agricultural activities. The overall accuracy of the LULC classification was calculated as 82.72% with 0.74 kappa coefficient.
Sajid et al. (2020) investigated the primary causes of Landuse changes that led to decline in the agriculture in Multan district. Landsat images of 3 years 2000, 2008, and 2016 were downloaded and processed in Arcmap software. The Landuse classes incorporated for this study included water, dense vegetation/orchards, sparse vegetation/agriculture, soil/barren land, and built-up. The supervised image classification was performed in conventional Geographical Information System (GIS) software by assigning training samples for each class. It was revealed that in the year 2000, dense vegetation/orchards (20.11%) covered a huge expanse which drastically decreased (17.91%) in 2016. The LULC classes, including water, built-up, and sparse vegetation/agriculture, increased from 2000 to 2016. Based on the increase in built-up class over the years and the recent crop yield records of Multan district the study predicted that in future the agricultural production especially wheat and cotton crop may be replaced by urban expansion that may lead to serious agricultural consequences.
Ahmed et al. (2021) compared the major LULC changes in Bahawalpur city using Landsat satellite images from 2003 to 2018. The LULC classes decided to be mapped for this study included forest, agriculture, barren, and urban areas. The LULC change detection was conducted as changes directly affect the drivers of natural ecosystem conventional method of supervised image classification in commercial GIS software. The results of this study indicated that forest and barren land decreased from 89.3% to 57.6%, whereas an increase in agriculture and urban areas was observed by 34.5% to 45.5%.
With an aid to link the land degradation with abrupt climate change and human activities, Wahla et al. (2023) processed and analyzed Landsat images of 1980, 1990, 2000, 2010, and 2020 for Bahawalpur division. The LULC classes, including built-up, water, barren land, and vegetation, were identified using Maximum Likelihood classifier. Besides, the Remote Sensing indices including Normalized Difference Vegetation Index (NDVI), Normalized Difference Water Index (NDWI), Modified Normalized Difference Water Index (MNDWI), Soil Index (SI) and Bare Soil Index (BSI) were also applied on the satellite images to reveal the desertification vulnerability in the study area. The NDVI helps in quantification of health and density of vegetation, while NDWI index is sensitive to the changes in water content. The SI helps classify the soil properties in the satellite image and BSI aids in extraction of bare land. It was found that the built-up area has significantly increased over time by 6.25% over the years, while the LULC, NDVI, and MNDWI showed a positive link for the areas located in the West of Cholistan desert from year 1980 to 2010. The values of Kappa coefficient estimated over the years (1980–2020) were 0.83, 0.82, 0.83, 0.85, and 0.88, respectively.
As Google Earth Engine (GEE) has gained recognition for catering large geospatial data processing using online platform, Wahap and Shafri (2020) evaluated the effectiveness of various GEE image classification Machine Learning Algorithms (MLA). The LULC classification was performed for 3 different years 1998, 2003, and 2018 in Klang valley of Malaysia. The LULC classes included agriculture land, forested land, water body, bare land, urbanized land, and paddy fields. MLA, including Random Forest (RF), Support Vector Machine (SVM), and Classification and Regression Tree (CART), were incorporated in this study, and the results were quantified using commercial GIS software. It was revealed that accurate results were found using CART classifier with 94.71%, 96.7%, and 96.57% accuracy for the respective years. The study concluded that GEE proved efficient in terms of processing large data sets within small time frame and with minimum human interaction.
Aldiansyah and Saputra (2023) compared the accuracy of ML classifier algorithm, including CART, RF, and SVM, using GEE. Satellite images of Landsat-8 and Sentinel-2 were used to develop LULC maps of year 2014, 2016, and 2020 in Wanggu watershed of Indonesia. The LULC classes decided for this study included forest, water, built-up, open field, and vegetation. It was revealed that regardless of training data size the RF outperformed the CART and SWM classifier which included misclassified vegetation pixels. The mean overall accuracy of CART, RF, and Scalable Vector Machine (SVM) was estimated to be 92.03%, 94.74%, and 83.54% on Landsat-8 and 93.14%, 96.15%, and 93.34% on Sentinel-2, respectively.
The Multan and Bahawalpur districts are considered as important cotton landscapes of Pakistan where LULC changes have accelerated over the few years. High population pressures in Multan have compelled the landowners to sell their agricultural assets, including massive mango orchards covering 44,000 acres to housing societies (Hasan and Arif, 2018). Similarly, in Bahawalpur population pressures have led the productive regions to be turned into residential zones crowning it as the most populated district in South Punjab. Therefore, in an effort to conserve the natural resources Multan and Bahawalpur this research focused on the LULC change analysis of Multan and Bahawalpur districts of Pakistan from year 2000 to 2020. The advanced RF classifier MLA were incorporated using GEE to extract the significant LULC classes.
This article is an attempt to explore and explain the particulars of the change in landscapes over the decades, with the emphasis on Multan and Bahawalpur district, based on their significance in terms of cotton production. The methodology used is based on the integration of remote sensing and GIS tools in GEE, which gives the users the flexibility of platform and minimizes the workload on personal workstations. The results are intended to draw attention of policy makers and decision makers to give this issue a priority as the loss of land due to human activity is causing a serious decline in agricultural land and, in future, might create a serious issue in terms of resource management.
Study Area
This study focused on district Multan and Bahawalpur of Punjab Province (Fig. 1). The Multan district has an area of 3,720 Sq.km and a population of 4,746,166. The population density is 1,275 people per square kilometer, and 43.38% of the population lives in urban areas. Multan is well known for its economic, industrial, and agricultural pursuits, especially in the production of cotton and mangoes. It is well-connected by rail, road, and airlines and is home to important agricultural research institutions. Bahawalpur district, which has six tehsils and covers 24,830 Sq.km, is the biggest geographical district in Punjab. Along the southeast bank of the Sutlej River, it is situated in a transitional area between agricultural land to the north and the Cholistan desert to the South. As a result of significant urbanization, Bahawalpur's population increased from 135,263 in 1972 to 408,305 in 1998. It is currently Pakistan's 12th-largest metropolis and draws people from the countryside to the city because of the employment and educational possibilities. Geographically speaking, the district includes desert, plain, and riverine regions. Rice, cotton, wheat, sugarcane, oilseeds, and citrus fruits, as well as guavas and dates, are among the crops and fruits grown in Bahawalpur. However, over the past 20 years, urbanization has significantly altered the landuse patterns in the districts of Multan and Bahawalpur (Hussain et al., 2020a; Hussain et al., 2020b).

Study area map.
Materials and Methods
This study involves the analysis of historical Land use/ Land cover data from publicly available sources and individual consent is neither feasible nor applicable. The confidentiality of all data will be maintained and any information presented will be aggregated to prevent the identification of specific individuals or properties.
Before change detection, the crucial step of satellite image preprocessing is to create a more direct link between the data collected and biophysical processes. Due to its accessibility and freedom from limitations imposed by system design, the GEE platform was used for all data processing. The study used minimally clouded satellite images from Landsat 7 (ETM+) and Landsat 8 (OLI/TIRS) (Table 1). Mean filters were used to fill up these gaps in Landsat 7 images that had missing scan lines. The examination of temporal LULC variations, the optimization of crop area calculations, and the mitigation of seasonal variable impacts across various landcover types were all made possible by the creation of an annual composite for each reference year. These annual composites included information from the Blue, Green, Red, Near Infra-Red, and Shortwave Infra-Red bands with information from the “QA PIXEL” band, which was used to mask cloudy pixels and produce cloud-free composites.
Datasets Used
Due to the many crop cycles of the various crops in the area, cropland classification is challenging using single date images. We used the sophisticated classification methods of MLA, RF, and NDVI on a 1-year composite of monthly time series Landsat images in GEE to acquire better results. This allows the classifier to learn the temporal pattern and detect pixels that exhibit similar patterns. Six LULC classes—forests, orchards, crops, water bodies, settlements, and other lands—were chosen for mapping. While “Orchards” contained varied fruit farms, the “Forests” category covered thick vegetation and mixed wooded regions. The “Water” class included wetlands, streams, canals, and ponds, while the “Cropland” class included agricultural regions, pastures, and range lands. Residential, commercial, and industrial sites were categorized as “Settlements,” whereas bare rocks and deserted places were categorized as “Other Lands.”
For each LULC class in each image, up to 100 samples depending upon the expanse of classes were identified through prior knowledge and to improve the classification results using high-resolution Google Earth imagery. To remove bias, these samples were split into training (70%) and validation (30%) sets at random. The RF Classifier, a decision-based technique that builds numerous decision trees from random subsets of training data, was trained using the training data. By combining forecasts from various trees, RF's ensemble technique improves accuracy while exceeding single trees. Understanding and managing land use, making decisions on how much land to allocate for different uses, and protecting natural resources all depend on LULC change analyses.
To improve visual coherence, individual pixels contributing to noisy LULC appearances were sieved and combined into the classes that were closest to them using the Quantum Geographic Information System (QGIS) software. Based on reference information and images, misclassified pixels were fixed, improving the accuracy of the classification outcomes. An evaluation was done by turning the classified raster into a Google Earth-supported layer and superimposing it over Google Earth photos to verify the correctness of the classified photographs. To rate the quality of the information produced from the categorized photos, accuracy assessment and the Kappa coefficient were utilized. GIS platforms were used to perform change detection and area estimations to measure temporal changes in various LULC classes within the research region. Before using a raster calculator for change detection analysis, individual areas for each LULC class were computed, and maps were prepared. The Figure 2 illustrates the research methodology adopted for this study. Both districts had positive results in LULC accuracy evaluations using the Kappa-Factor, with Multan reaching an average accuracy of 0.90 and Bahawalpur earning an even higher 0.93.

Research methodology.
Results
With the aid of multitemporal satellite imaging, remote sensing, and GIS techniques, the study examined changes in LULC in the districts of Multan and Bahawalpur during the course of the last two decades (2000–2020). The findings show considerable changes in LULC as a result of growing urbanization, industrialization, and commercialization in both districts, which have a significant impact on crop yields and livelihoods, including agriculture. Following are the main conclusions for each LULC class in the districts of Multan and Bahawalpur: -
LULC change analysis in Multan district
The cropland predominated in Multan district, followed by Other Land and Settlements, while Orchards and Water Bodies occupied lesser areas, according to LULC results (Table 2). The distribution of LULC classes of Multan district over the years is shown in the Figure 3. From 2000 to 2020, cropland fluctuated, occupying 78.5% to 76.1% of the district's total area, dropping from 291,665 to 282,810 hectares (ha), representing a 2.4% loss of quality agricultural land (Fig. 5). By 2030, more decreases are predicted. Orchards increased dramatically from 9,889 ha in 2000 to 16,400 ha in 2020 as a result of Cropland's change, which was sparked by the building of housing schemes. By 2030, similar trends are anticipated to approach 18,600 ha. Settlements grew quickly, doubling in size between 2000 (14,153 ha) and 2020 (24,898 ha) to make up 6.70% of the total area, mostly due to urbanization, infrastructural development, and advantageous position. This increase in settlements has been witnessed on the expanse of cropland. Due to the Chenab River's existence, water bodies varied, growing to roughly 9,000 acres by 2030. By 2030, Other Lands, which included open spaces and arid regions, had varied but were on the decline, totaling roughly 44,000 ha.

Time-series classified map of Multan district.
Area of Landuse/Landcover Classes in Multan District
LULC, Landuse/Landcover.
LULC change analysis for the Bahawalpur district
Forests, Orchards, Cropland, Water Bodies, Settlements, and Other Lands, which included deserts and arid regions, were among the LULC classes created in Bahawalpur's remotely sensed data (Table 3). The LULC classes for the reference year 2000–2020 are shown in Figure 5. Due to afforestation initiatives and protected areas, forests grew over time and stabilized at 10,888 ha by 2020 (Fig. 6). Due to the conversion of desert into agricultural, cropland increased steadily from 15.67% in 2000 to 21.73% in 2020. By 2030, the trend predicts cropland area to be ∼650,000 acres. Urban sprawl and the development of housing projects are the main causes of the loss in orchards, which went from 1,070 ha in 2000 to 1,205 ha in 2020. But by 2030, orchards are projected to grow to roughly 1,600 acres. Settlements increased from 0.89% in 2000 to 1.44% in 2020, and there is an alarming trend toward urbanization that may need double the amount of land by 2030. The area covered by water bodies rose slightly from 0.11% in 2000 to 0.20% in 2020, with the river Sutlej and other water sources contributing to this class. By 2030, the trend predicts a possible expansion of >7,000 acres. It is possible that desert conversion for agriculture is to be blamed for the area under desert and barren lands declining from 82% in 2000 to 76.76% in 2020 (Figure 4). By 2030, desert and other land may have been reduced to <1.800 million hectares as a result of this transition.
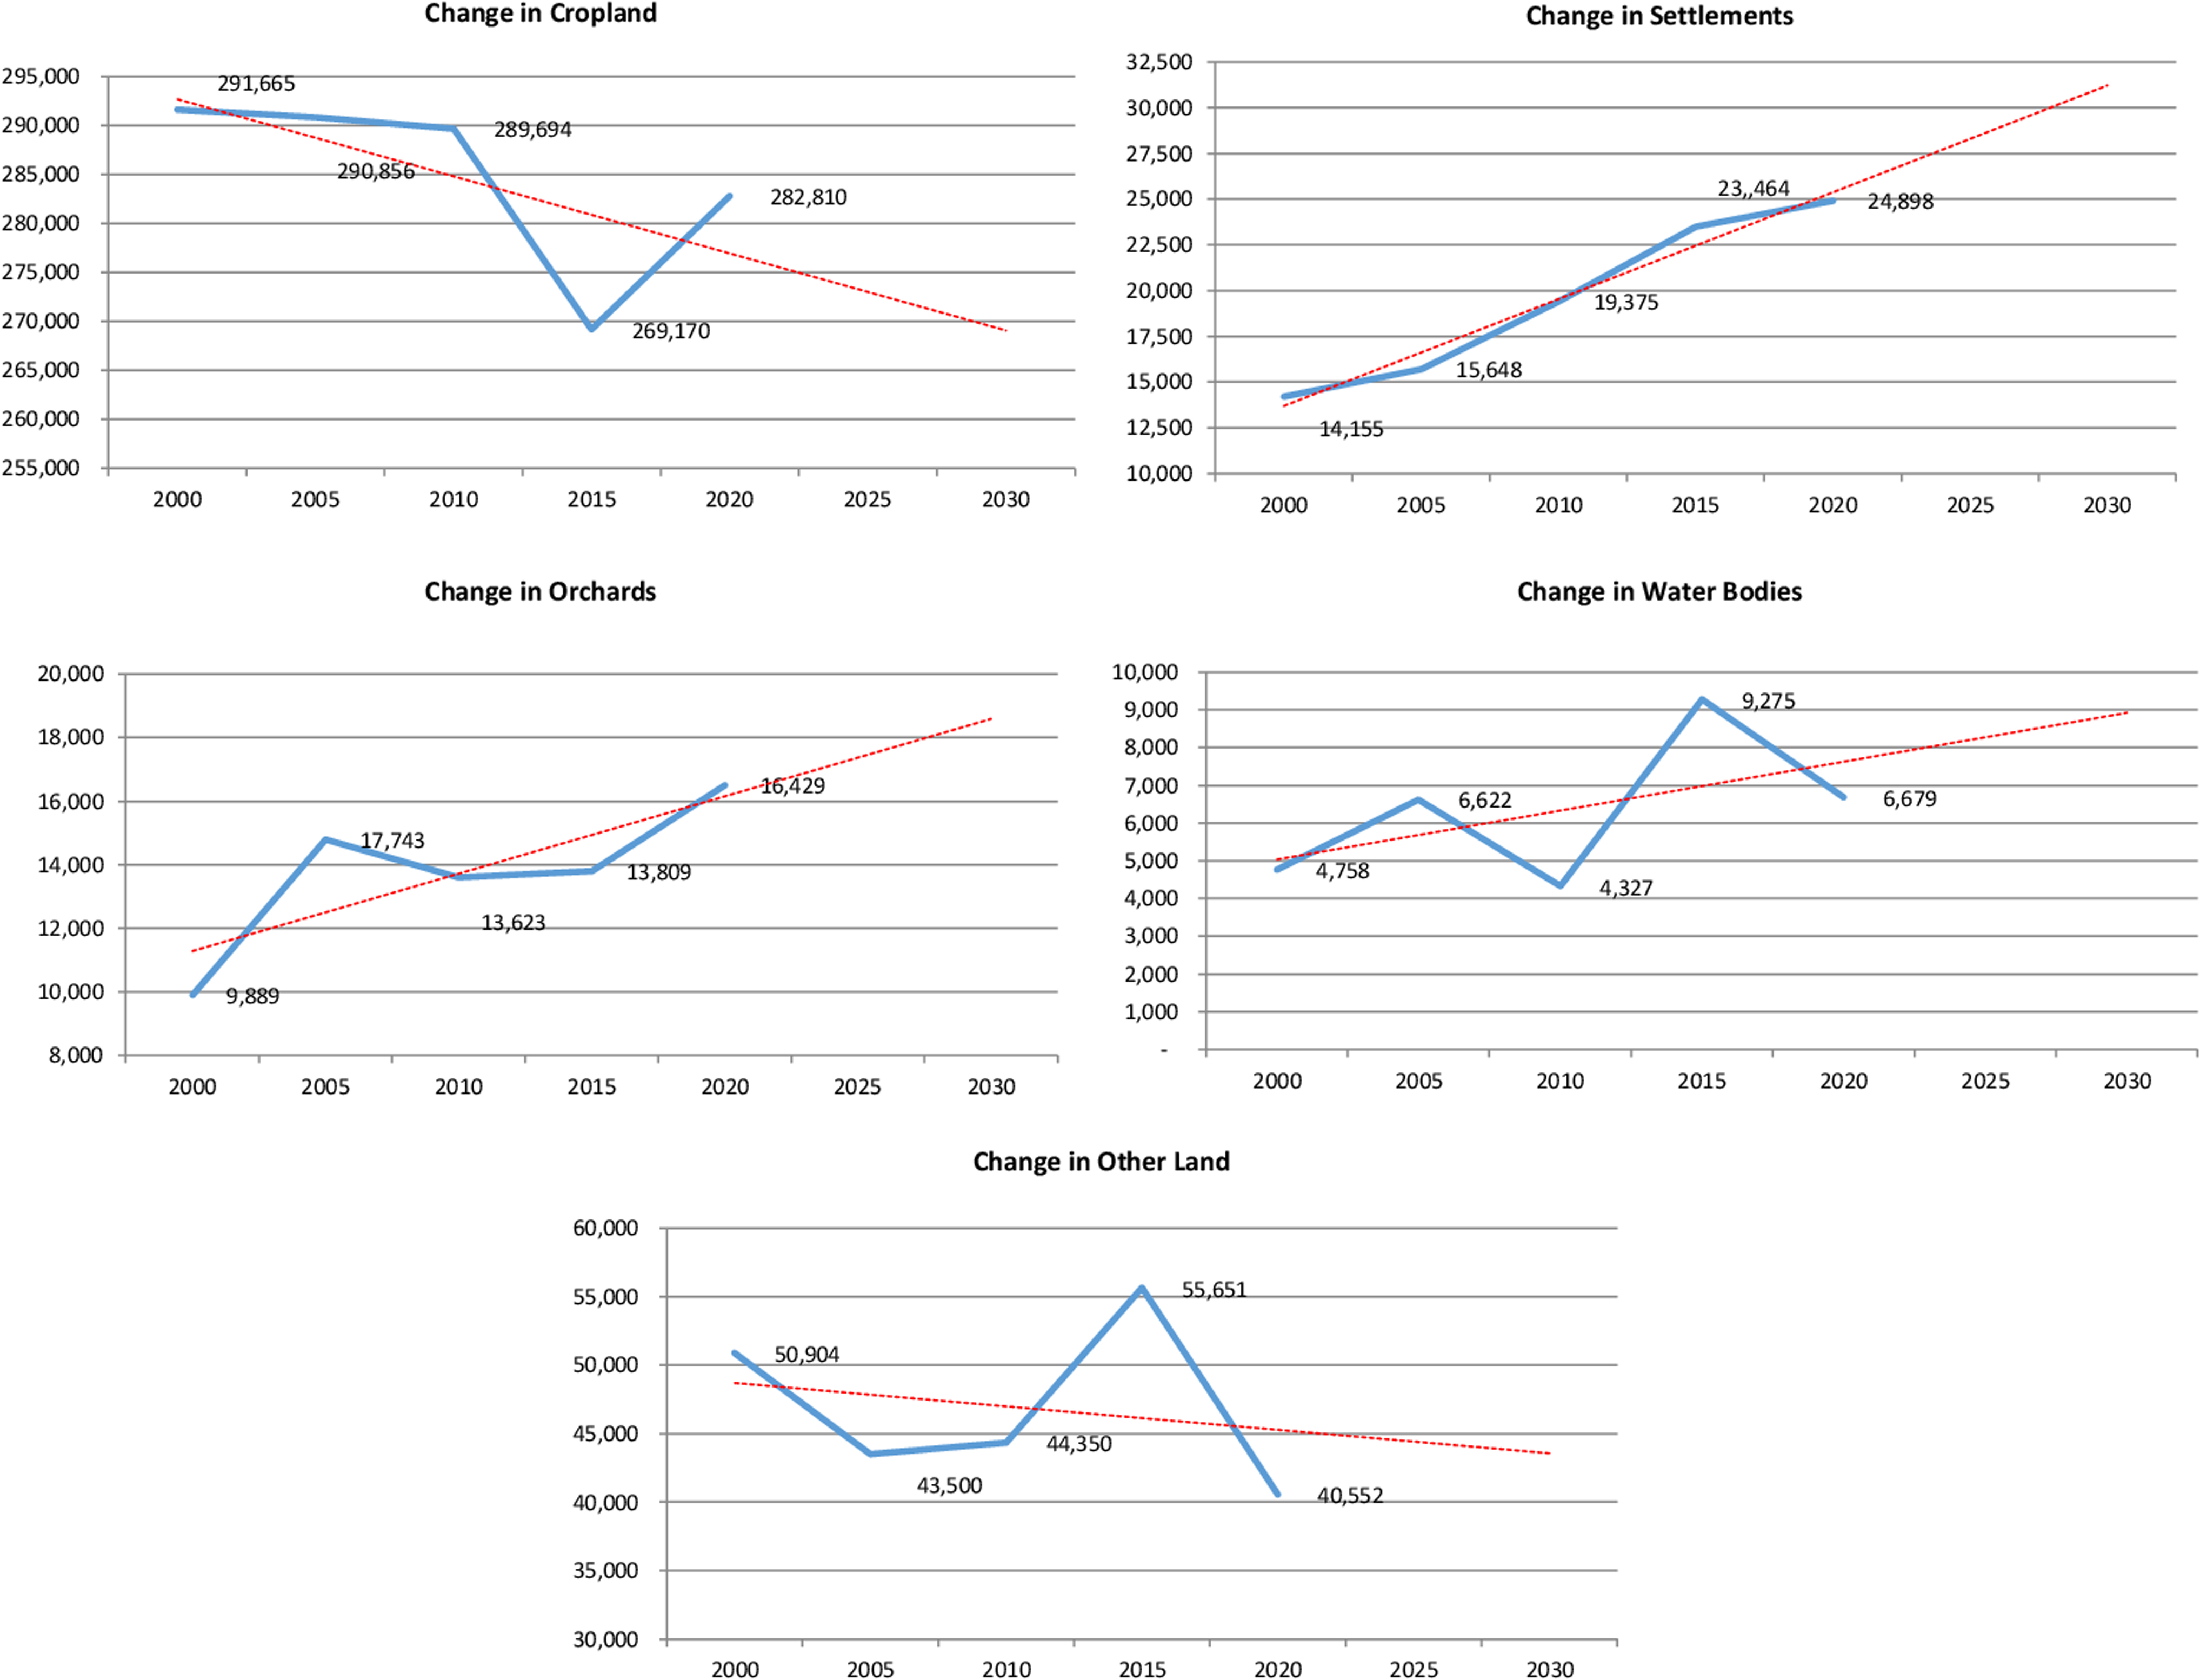
Graphs of LULC change Multan. LULC, Landuse/Landcover.

Time-series classified map of Bahawalpur district.
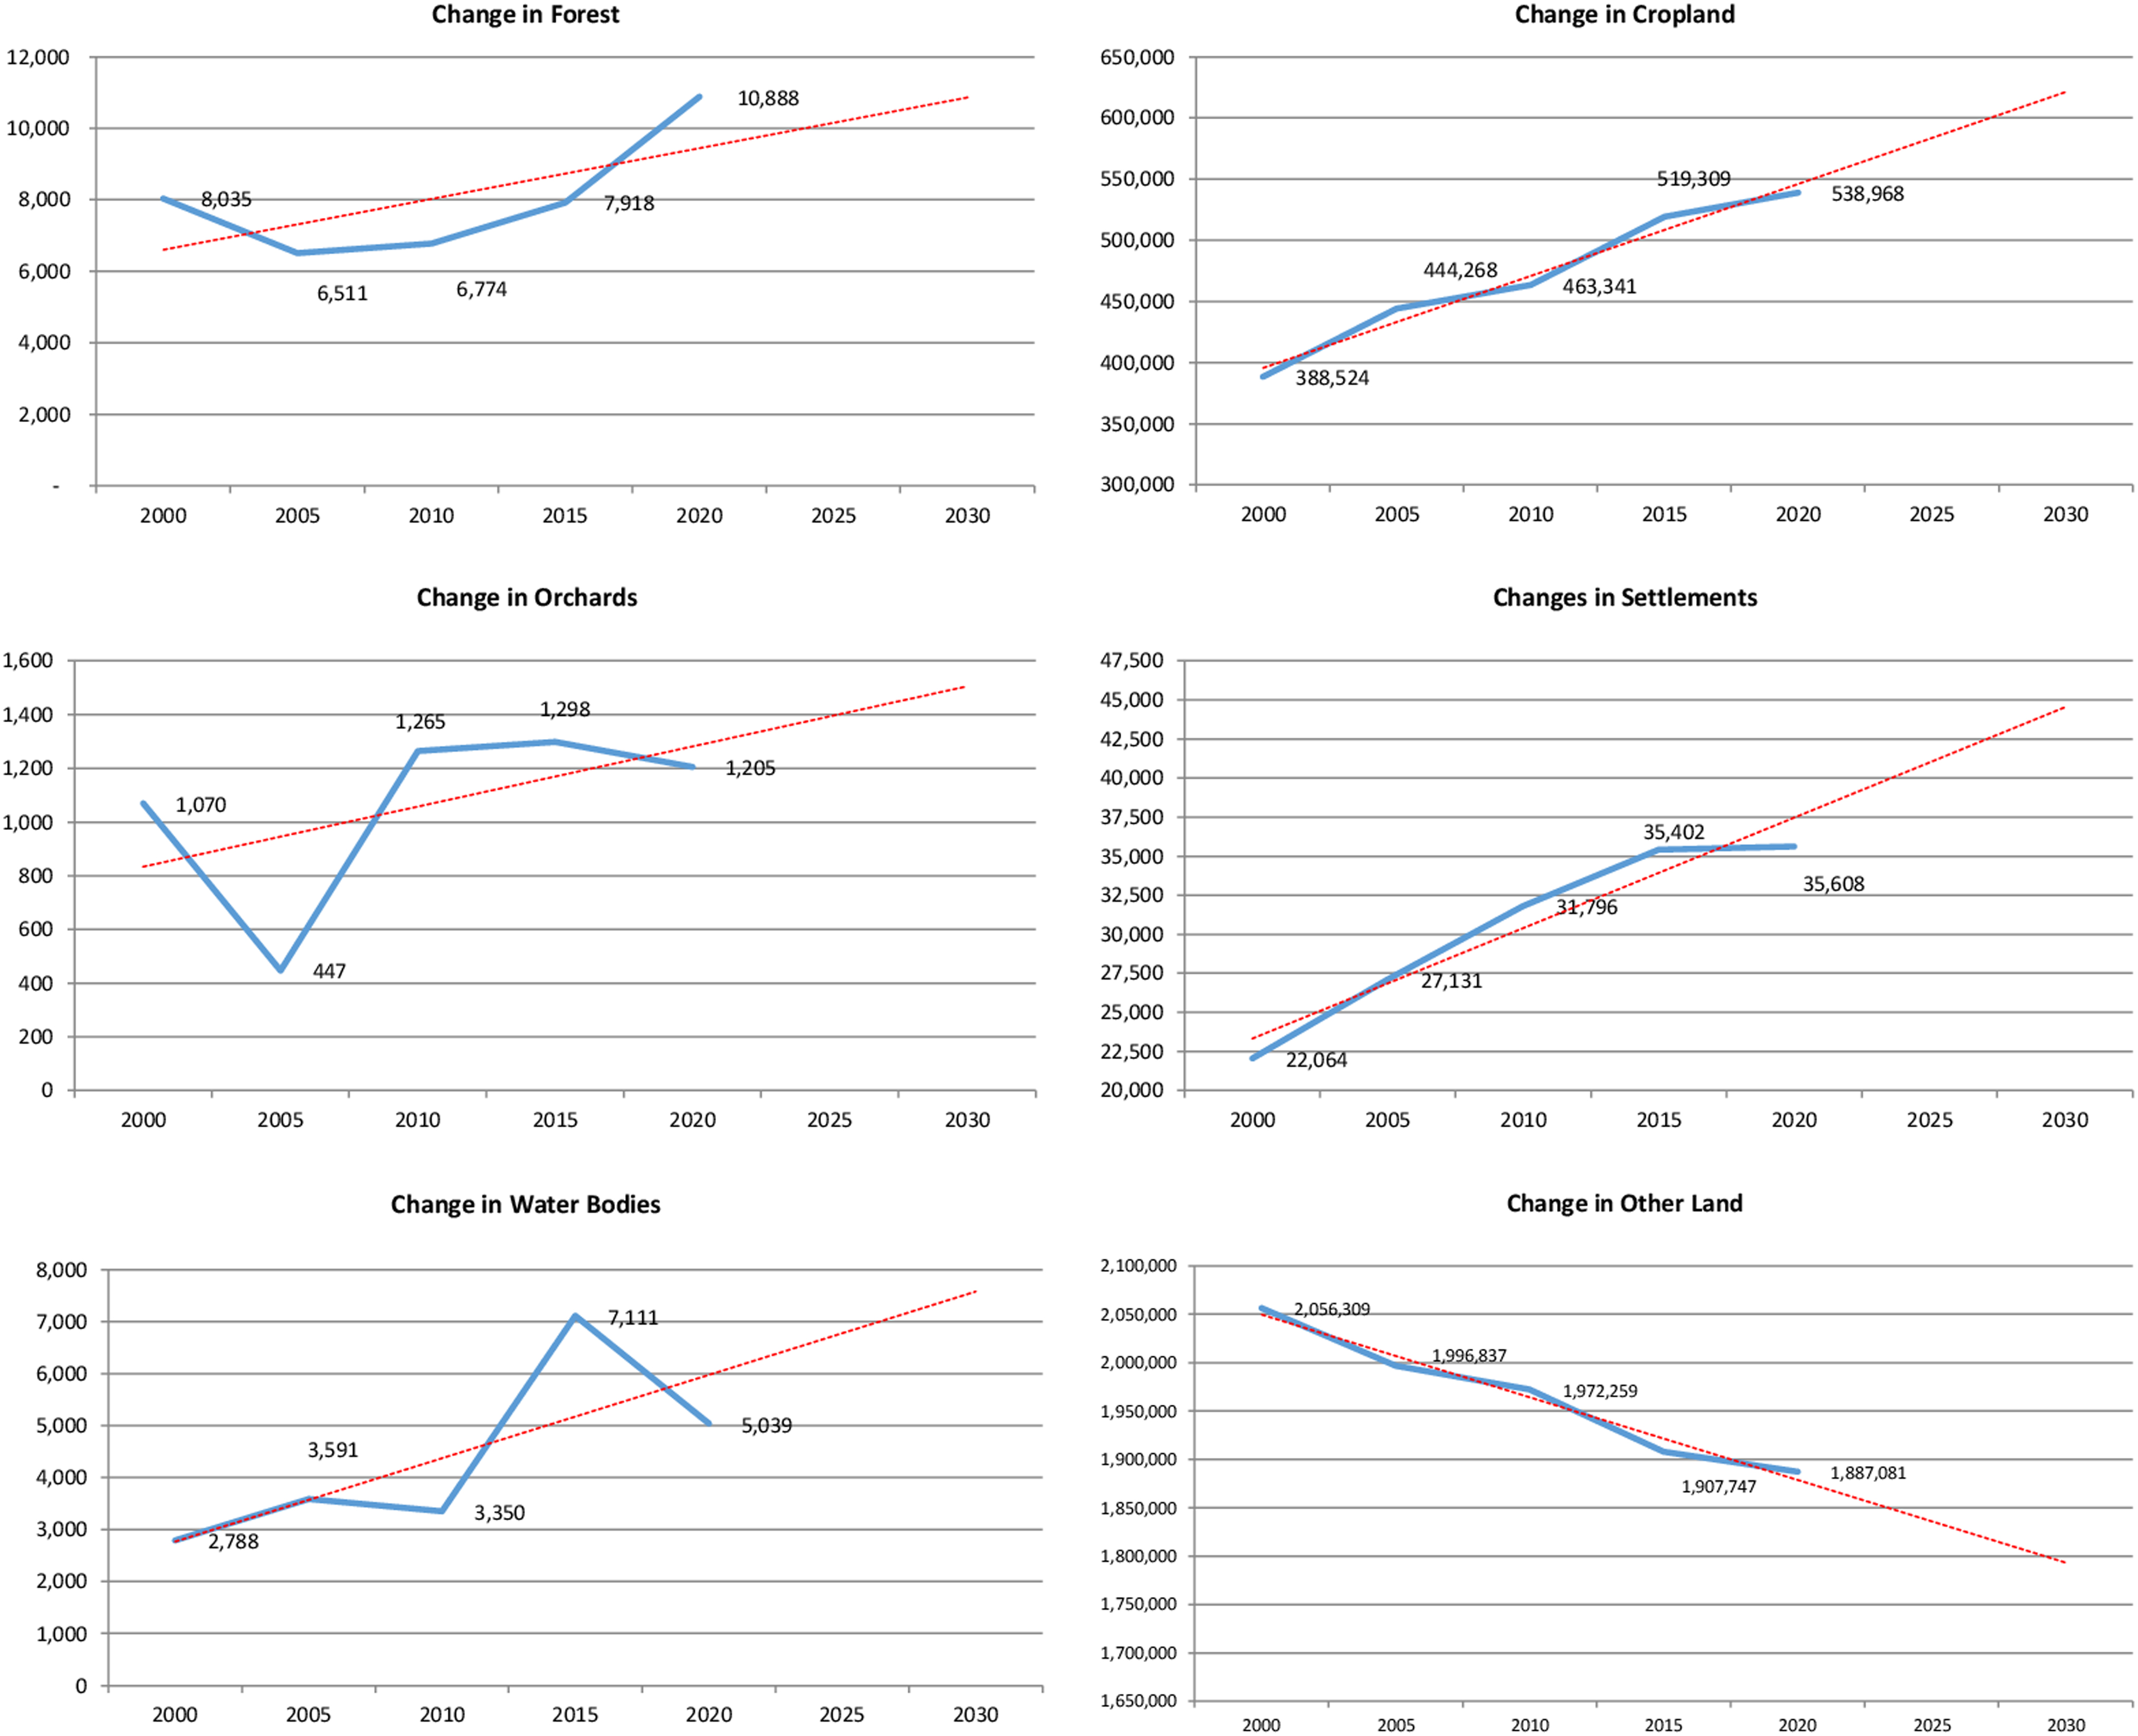
Graphs of LULC change Bahawalpur.
Area of Landuse/Landcover Classes in Bahawalpur District
Discussion
The research observed significant changes in LULC in the Punjab districts of Multan and Bahawalpur during the previous 10 years, principally as a result of the areas' increasing urbanization, industrialization, and commercialization. Crop yields have been significantly impacted by these changes, as have indirectly agricultural livelihoods. Urban expansion was observed by producing accurate LULC change maps using multitemporal satellite imagery, Remote Sensing, and GIS methods. Similar research linking LULC changes to climatic change was compiled in Chakwal district (Siddiqui et al., 2020b) utilizing Landsat data from 1995 to 2020 at 5-year intervals and Object Based Image Analysis for LULC class extraction.
In another study, LULC maps of India were produced from Landsat data from 2005, 2006, 2007, and 2016 using machine learning (Mnlogit), with classification accuracy ranging between 80% and 86% (Sajid et al., 2020; Singh et al., 2021).
The findings of this study highlight the significant influence that urbanization, industry, and commercialization have had on LULC patterns in the districts of Multan and Bahawalpur. The ecology and agriculture in these areas will be significantly impacted by these changes. Given the significance of agriculture in the area, the documented decline of cropland in Multan district is cause for worry. Reduced crop yields and a threat to global food security might result from the loss of key agricultural land. This issue has to be addressed immediately with measures like urban design that protects agricultural regions and sustainable land management techniques. The striking growth of orchards in Multan district is indicative of the significance of the area as Pakistan's “mango city.” The increase in the number of housing constructions at the expense of orchards raises concerns about the preservation of mango cultivation. To preserve the area's standing as a significant fruit producer, efforts should be taken to strike a balance between urban expansion and agricultural conservation. In another study, LULC maps of India were produced from Landsat data from 2005, 2006, 2007, and 2016 using machine learning, with classification accuracy ranging between 80% and 86% (Sajid et al., 2020; Singh et al., 2021). Multan district increasing urbanization emphasizes the necessity for thorough urban planning to handle the expanding population while maintaining agricultural land. To control urban expansion and preserve a balance between urban and rural regions, strategic steps must be taken. The growth of Cropland in the Bahawalpur district is encouraging for agricultural output. To preserve the sustainability of the ecology and biodiversity in these places, it is necessary to monitor the conversion of desert and arid areas into agriculture. According to Abid et al. (2019), small landholding farmers need instruction in modern agricultural techniques, including crop diversification and soil conservation, to reduce the harmful effects of climate change. It is positive that there are more forests in the Bahawalpur district thanks to protected areas and national afforestation programs. The effectiveness of these initiatives should be increased to improve environmental sustainability. Overall, it was determined that LULC categorization accuracy was good, demonstrating the efficiency of GIS and remote sensing tools in tracking changes in land use.
Conclusion
This research sheds light on LULC change dynamics in the study area and raises the necessity for proactive land management approaches to strike a balance between urban growth, agricultural preservation, and environmental sustainability. From the LULC trends for the years 2000, 2005, 2010, 2015, and 2020 significant increases in settlements and agriculture were observed. Bahawalpur showed a massive increase in agriculture, whereas Multan's agriculture suffered a modest decline. The “Other Land” class made a significant contribution to towns and crops in the overall study area, while the orchards, woodlands, and water bodies observed minor alterations. All these LULC patterns were driven by the changing terrain, particularly as a result of housing developments. The classification accuracy for the LULC development was >85%, and RS indices like NDVI proved useful in this study (Table 4). These results provide a useful baseline for mapping crop types using NDVI and machine learning methods. Future studies can concentrate on determining how these changes will affect crop yields, biodiversity, and local livelihoods over the long run.
Classification of Overall Accuracy Assessment
Footnotes
Acknowledgments
The authors really appreciate the contributions made by everyone who helped make this initiative a success. This study is a perfect illustration of teamwork.
Authors' Contributions
M.W.A.S.: Visualization; Writing—Review and editing (lead), A.I.: Conceptualization, M.A.: Project administration, M.A.: Validation, M.R.: Formal Analysis; Methodology (lead); Software, M.A.: Software (lead); Methodology; Data Curation, U.M.: Software; Writing—Original Draft (lead); visualization, U.A.: Supervision, Z.A.A.: Writing—Review and editing.
Author Disclosure Statement
No competing financial interests exist.
Funding Information
No funding was received for this article.